Amyloid domains in the cell nucleus controlled by nucleoskeletal protein lamin B1 reveal a new pathway of mercury neurotoxicity
A peer-reviewed article of this Preprint also exists.
Author and article information
Abstract
Mercury (Hg) is a bioaccumulating trace metal that globally circulates the atmosphere and waters in its elemental, inorganic and organic chemical forms. While Hg represents a notorious neurotoxicant, the underlying cellular pathways are insufficiently understood. We identify amyloid protein aggregation in the cell nucleus as a novel pathway of Hg-bio-interactions. By mass spectrometry of purified protein aggregates a subset of spliceosomal components and nucleoskeletal protein lamin B1 were detected as constituent parts of an Hg-induced nuclear aggregome network. The aggregome network was located by confocal imaging of amyloid-specific antibodies and dyes to amyloid cores within splicing-speckles that additionally recruit components of the ubiquitin-proteasome system. Hg significantly enhances global proteasomal activity in the nucleus suggesting that formation of amyloid speckles plays a role in maintenance of protein homeostasis. RNAi knock down showed that lamin B1 for its part regulates amyloid speckle formation and thus likewise participates in nuclear protein homeostasis. As the Hg-induced cascade of interactions between the nucleoskeleton and protein homeostasis reduces neuronal signalling, amyloid fibrillation in the cell nucleus is introduced as a feature of Hg-neurotoxicity that opens new avenues of future research. Similar to protein aggregation events in the cytoplasm that are controlled by the cytoskeleton, amyloid fibrillation of nuclear proteins may be driven by the nucleoskeleton.
Cite this as
2015. Amyloid domains in the cell nucleus controlled by nucleoskeletal protein lamin B1 reveal a new pathway of mercury neurotoxicity. PeerJ PrePrints 3:e801v1 https://doi.org/10.7287/peerj.preprints.801v1Author comment
This is a revised version of a submission to PeerJ for review.
Sections
Supplemental Information
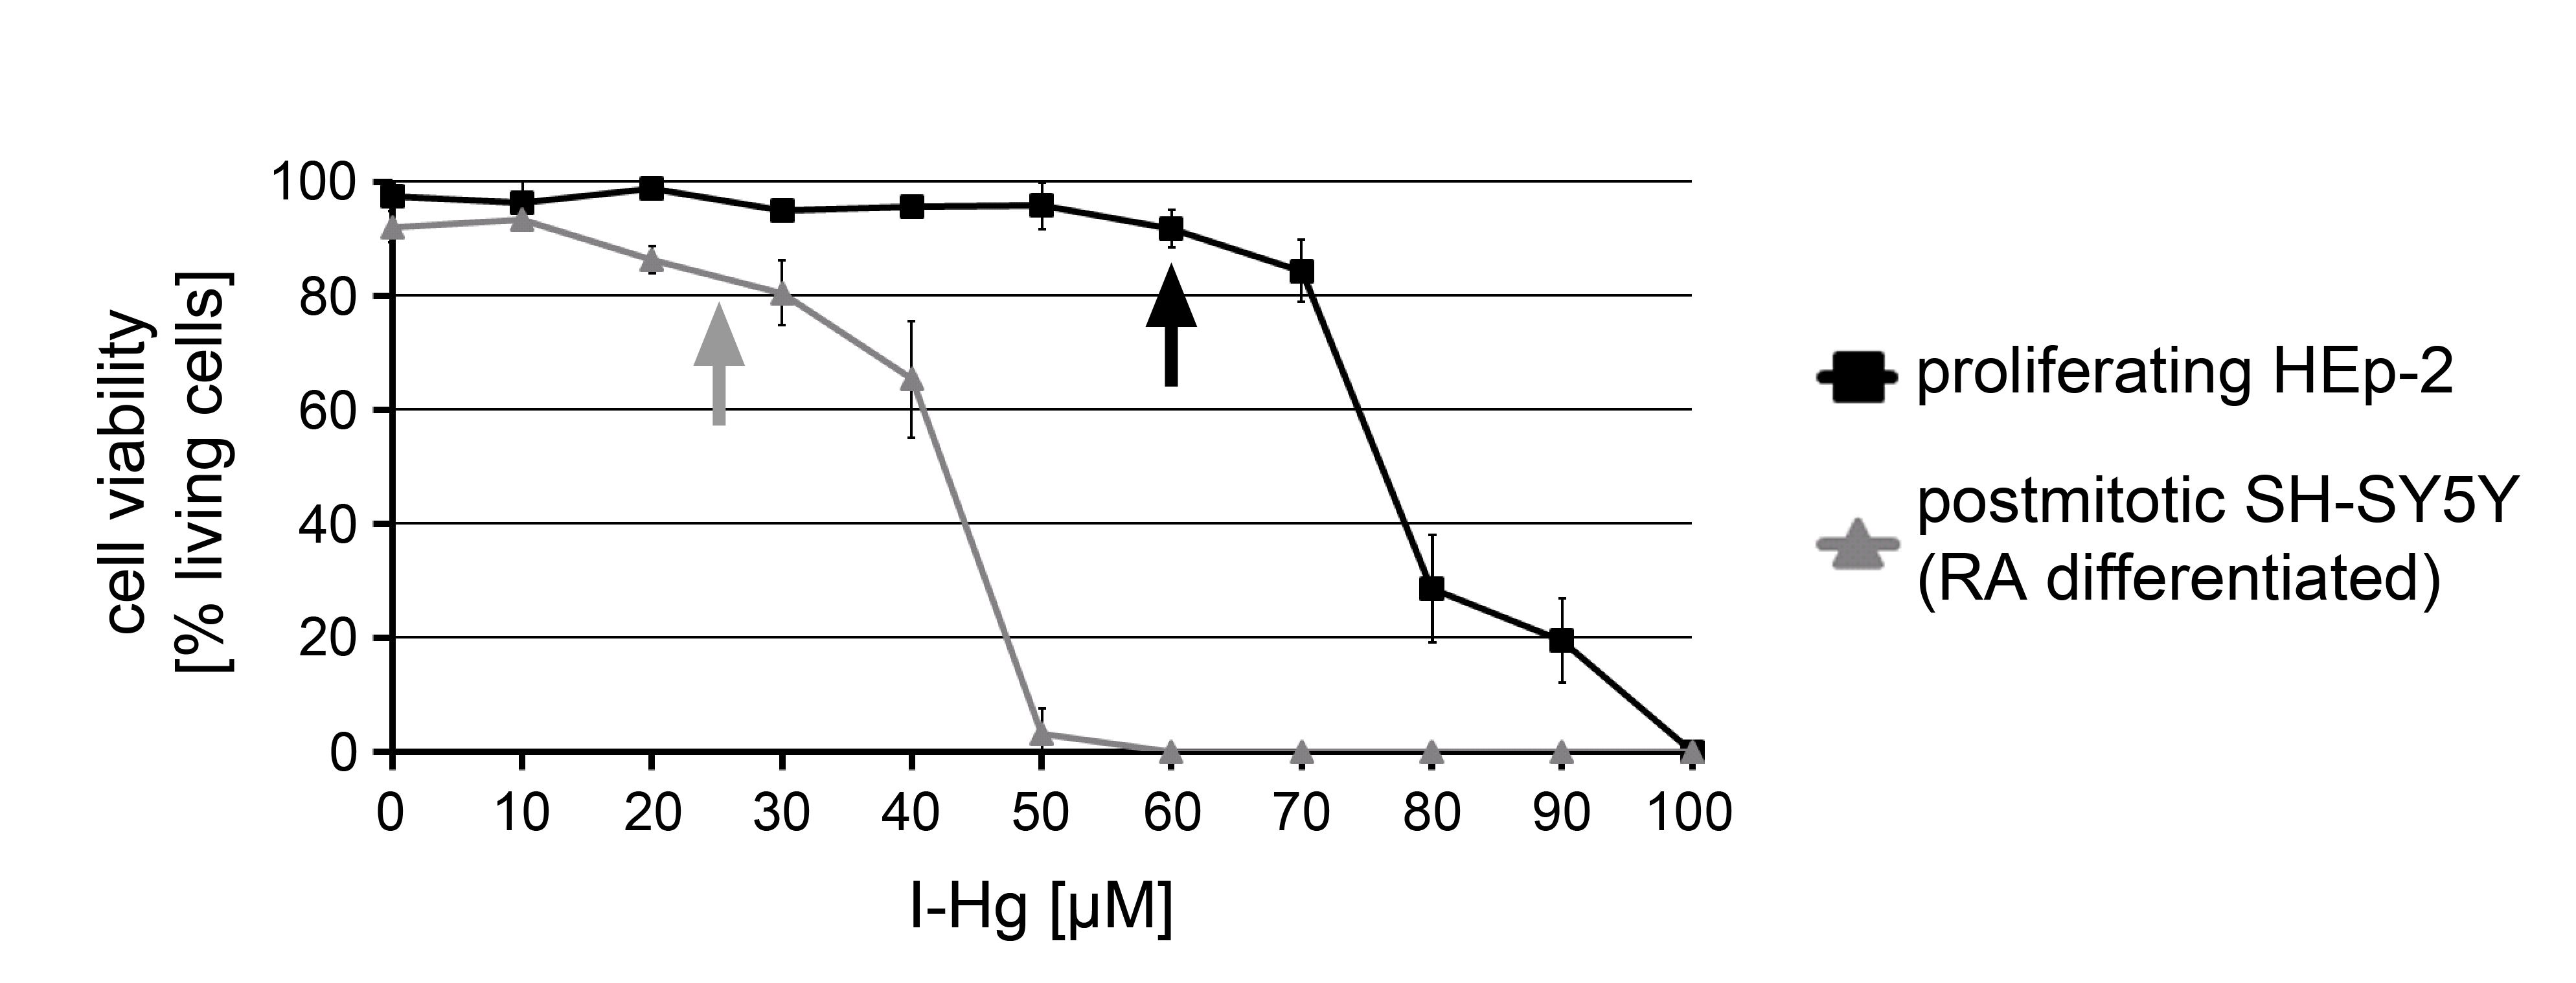
Definition of sub-cytotoxic (‘mild’) I-Hg-concentrations
Supplemental Figure S1. Definition of sub-cytotoxic (‘mild’) I-Hg-concentrations. Cell viability assay: HEp-2 or RA-differentiated SH-SY5Y cells were treated with the indicated I-Hg concentrations for 4 hours and analyzed for intracellular staining of the diazo dye trypan blue designating dead cells. Results are presented as a xy-graph with the percentage of viable cells on the y-axis and the I-Hg-titration on the x-axis. Error bars represent standard deviation of three independent experiments. Arrows indicate the I-Hg-concentrations that do not induce cell death and were used in subsequent experiments to accelerate amyloid-like protein fibrillation in the nucleus.
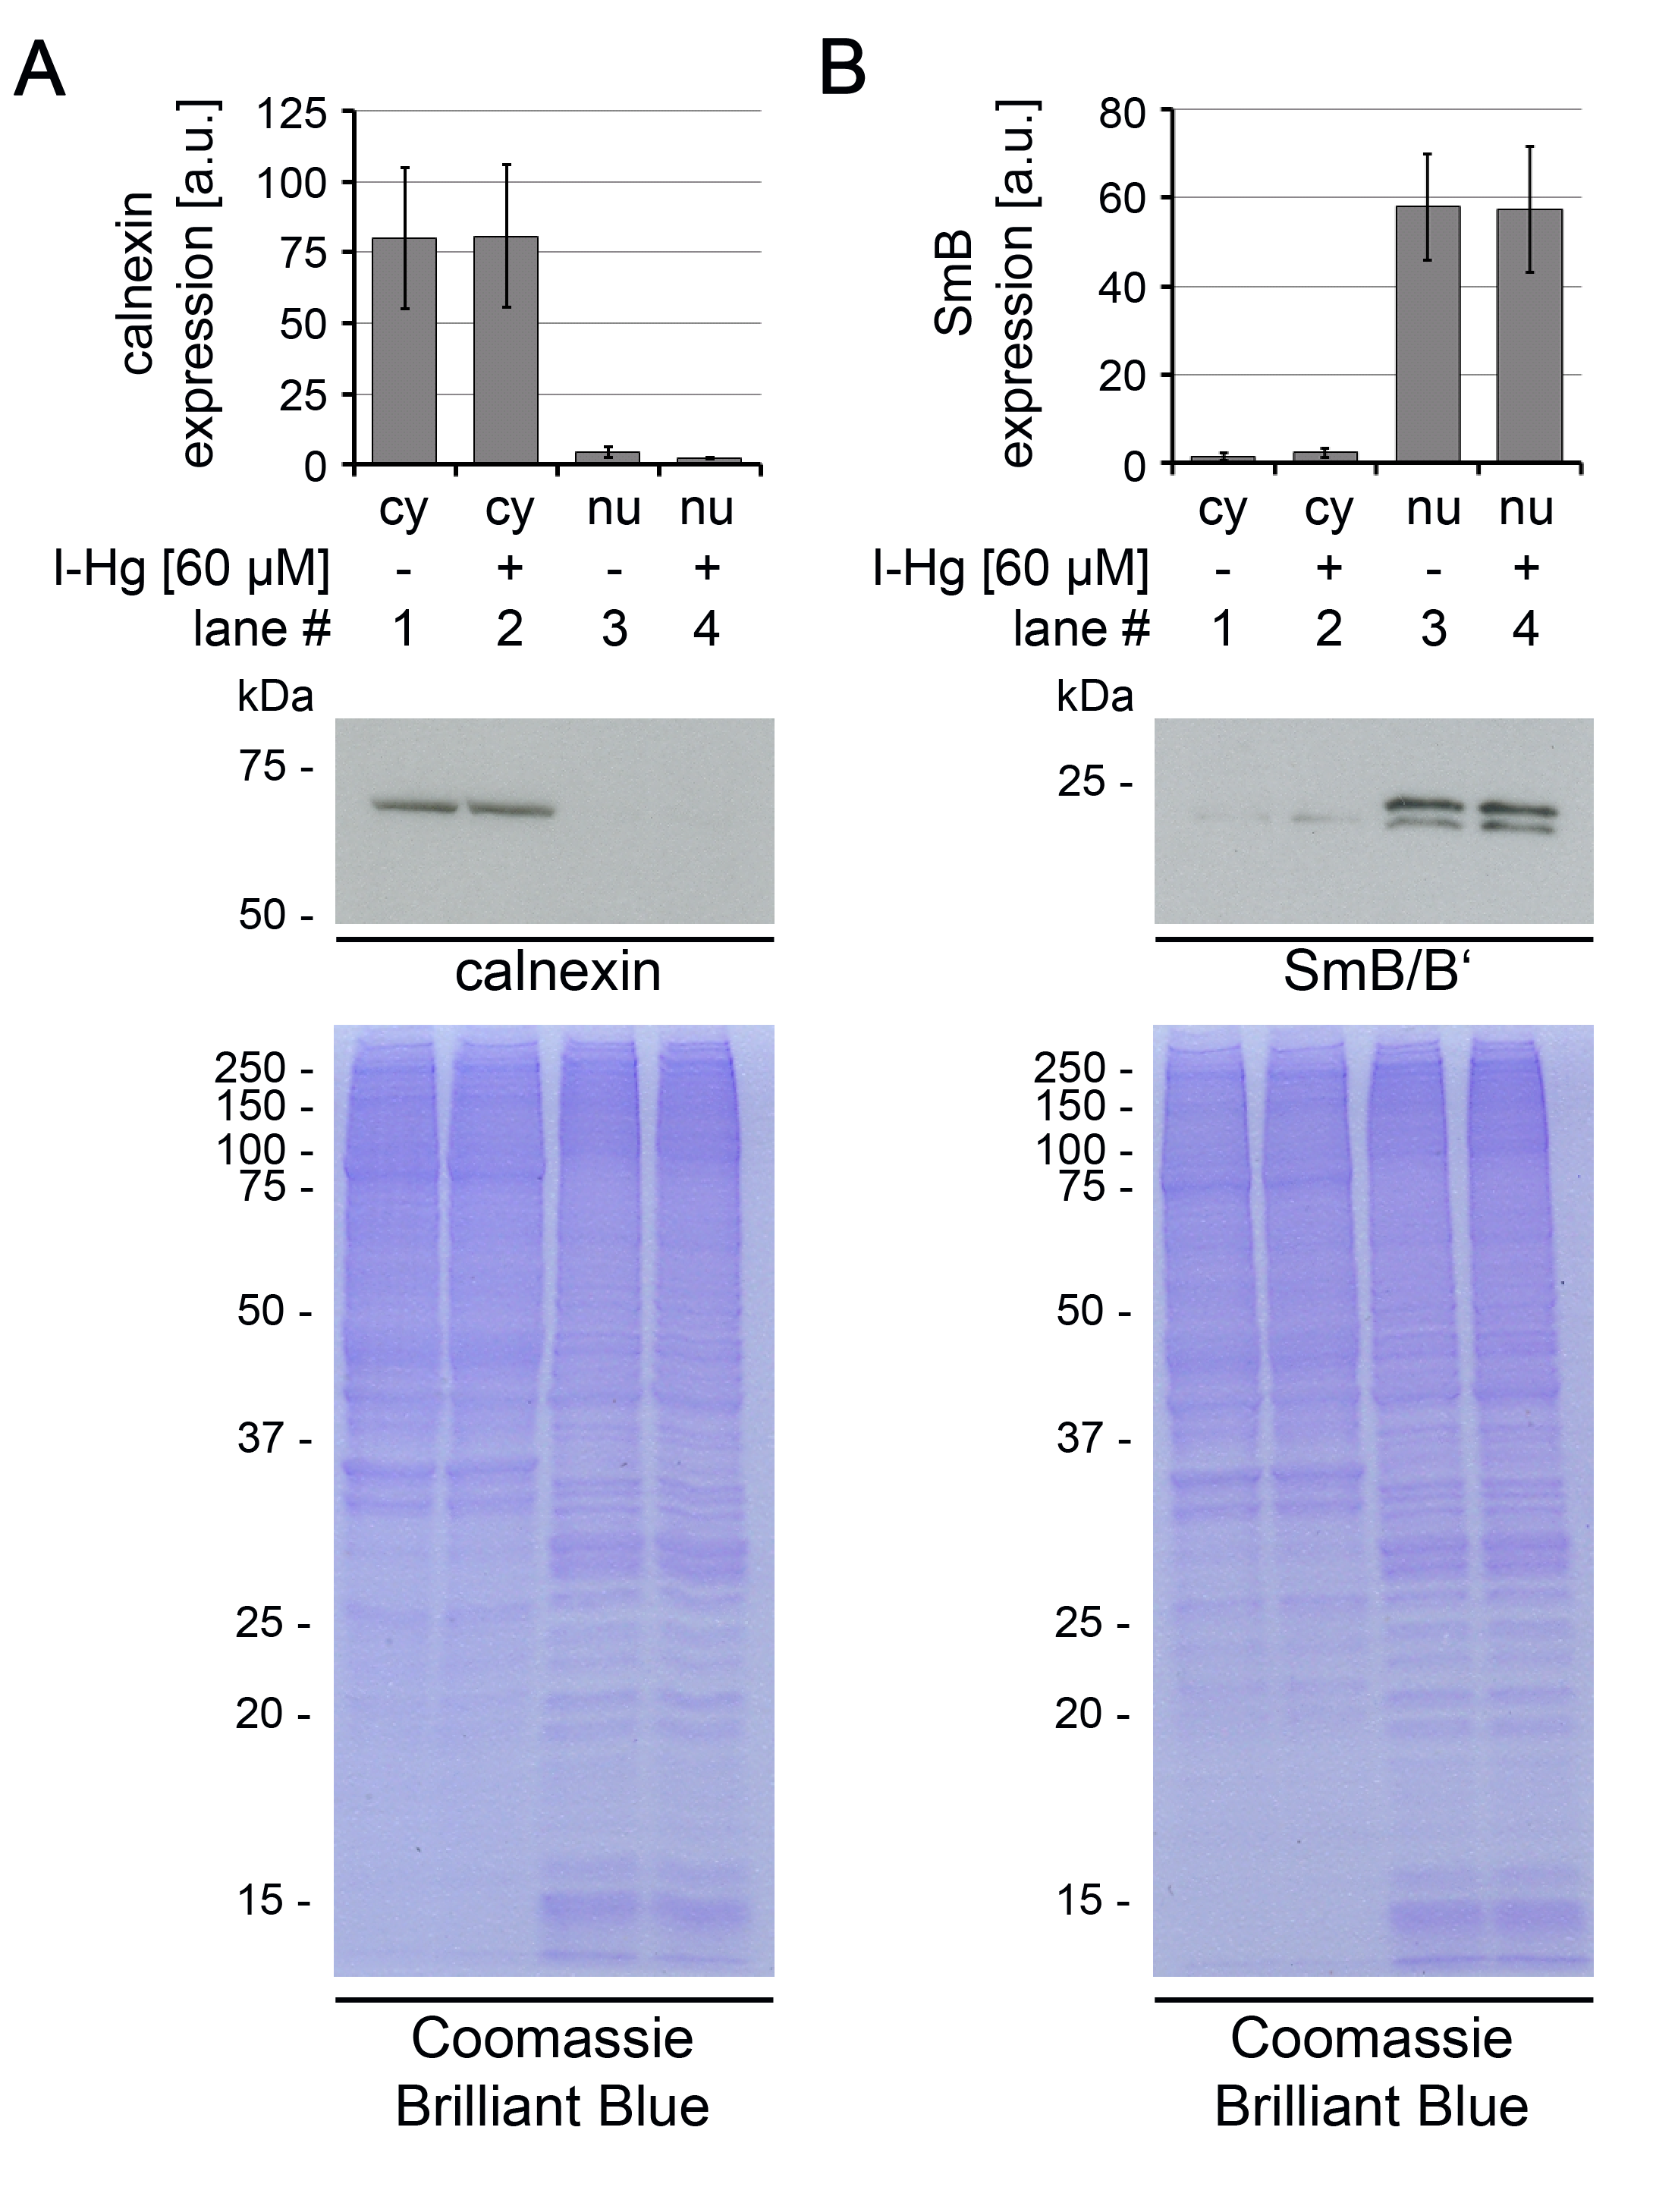
Atomic absorption spectroscopy (AAS): protein fractionation controls
Supplemental Figure S2. Atomic absorption spectroscopy (AAS): protein fractionation controls. Untreated or I-Hg-treated (4 hours, 60μM) HEp-2 cells were lysed and fractionated into cytoplasmic or nuclear proteins. Purity of fractions was controlled by immunoblots of (A) endoplasmatic reticulum-associated protein calnexin as cytoplasmic control or (B) spliceosomal component SmB/B’ as nuclear control. Respective Coomassie Brilliant Blue staining confirms equal protein loading. Expression levels of calnexin and SmB were quantified by densitometric analysis based on the band intensity of the immunoblots. a.u., arbitrary units; cy, cytoplasmic fraction; I-Hg, inorganic mercury; kDa, kilo Dalton; nu, nuclear fraction.
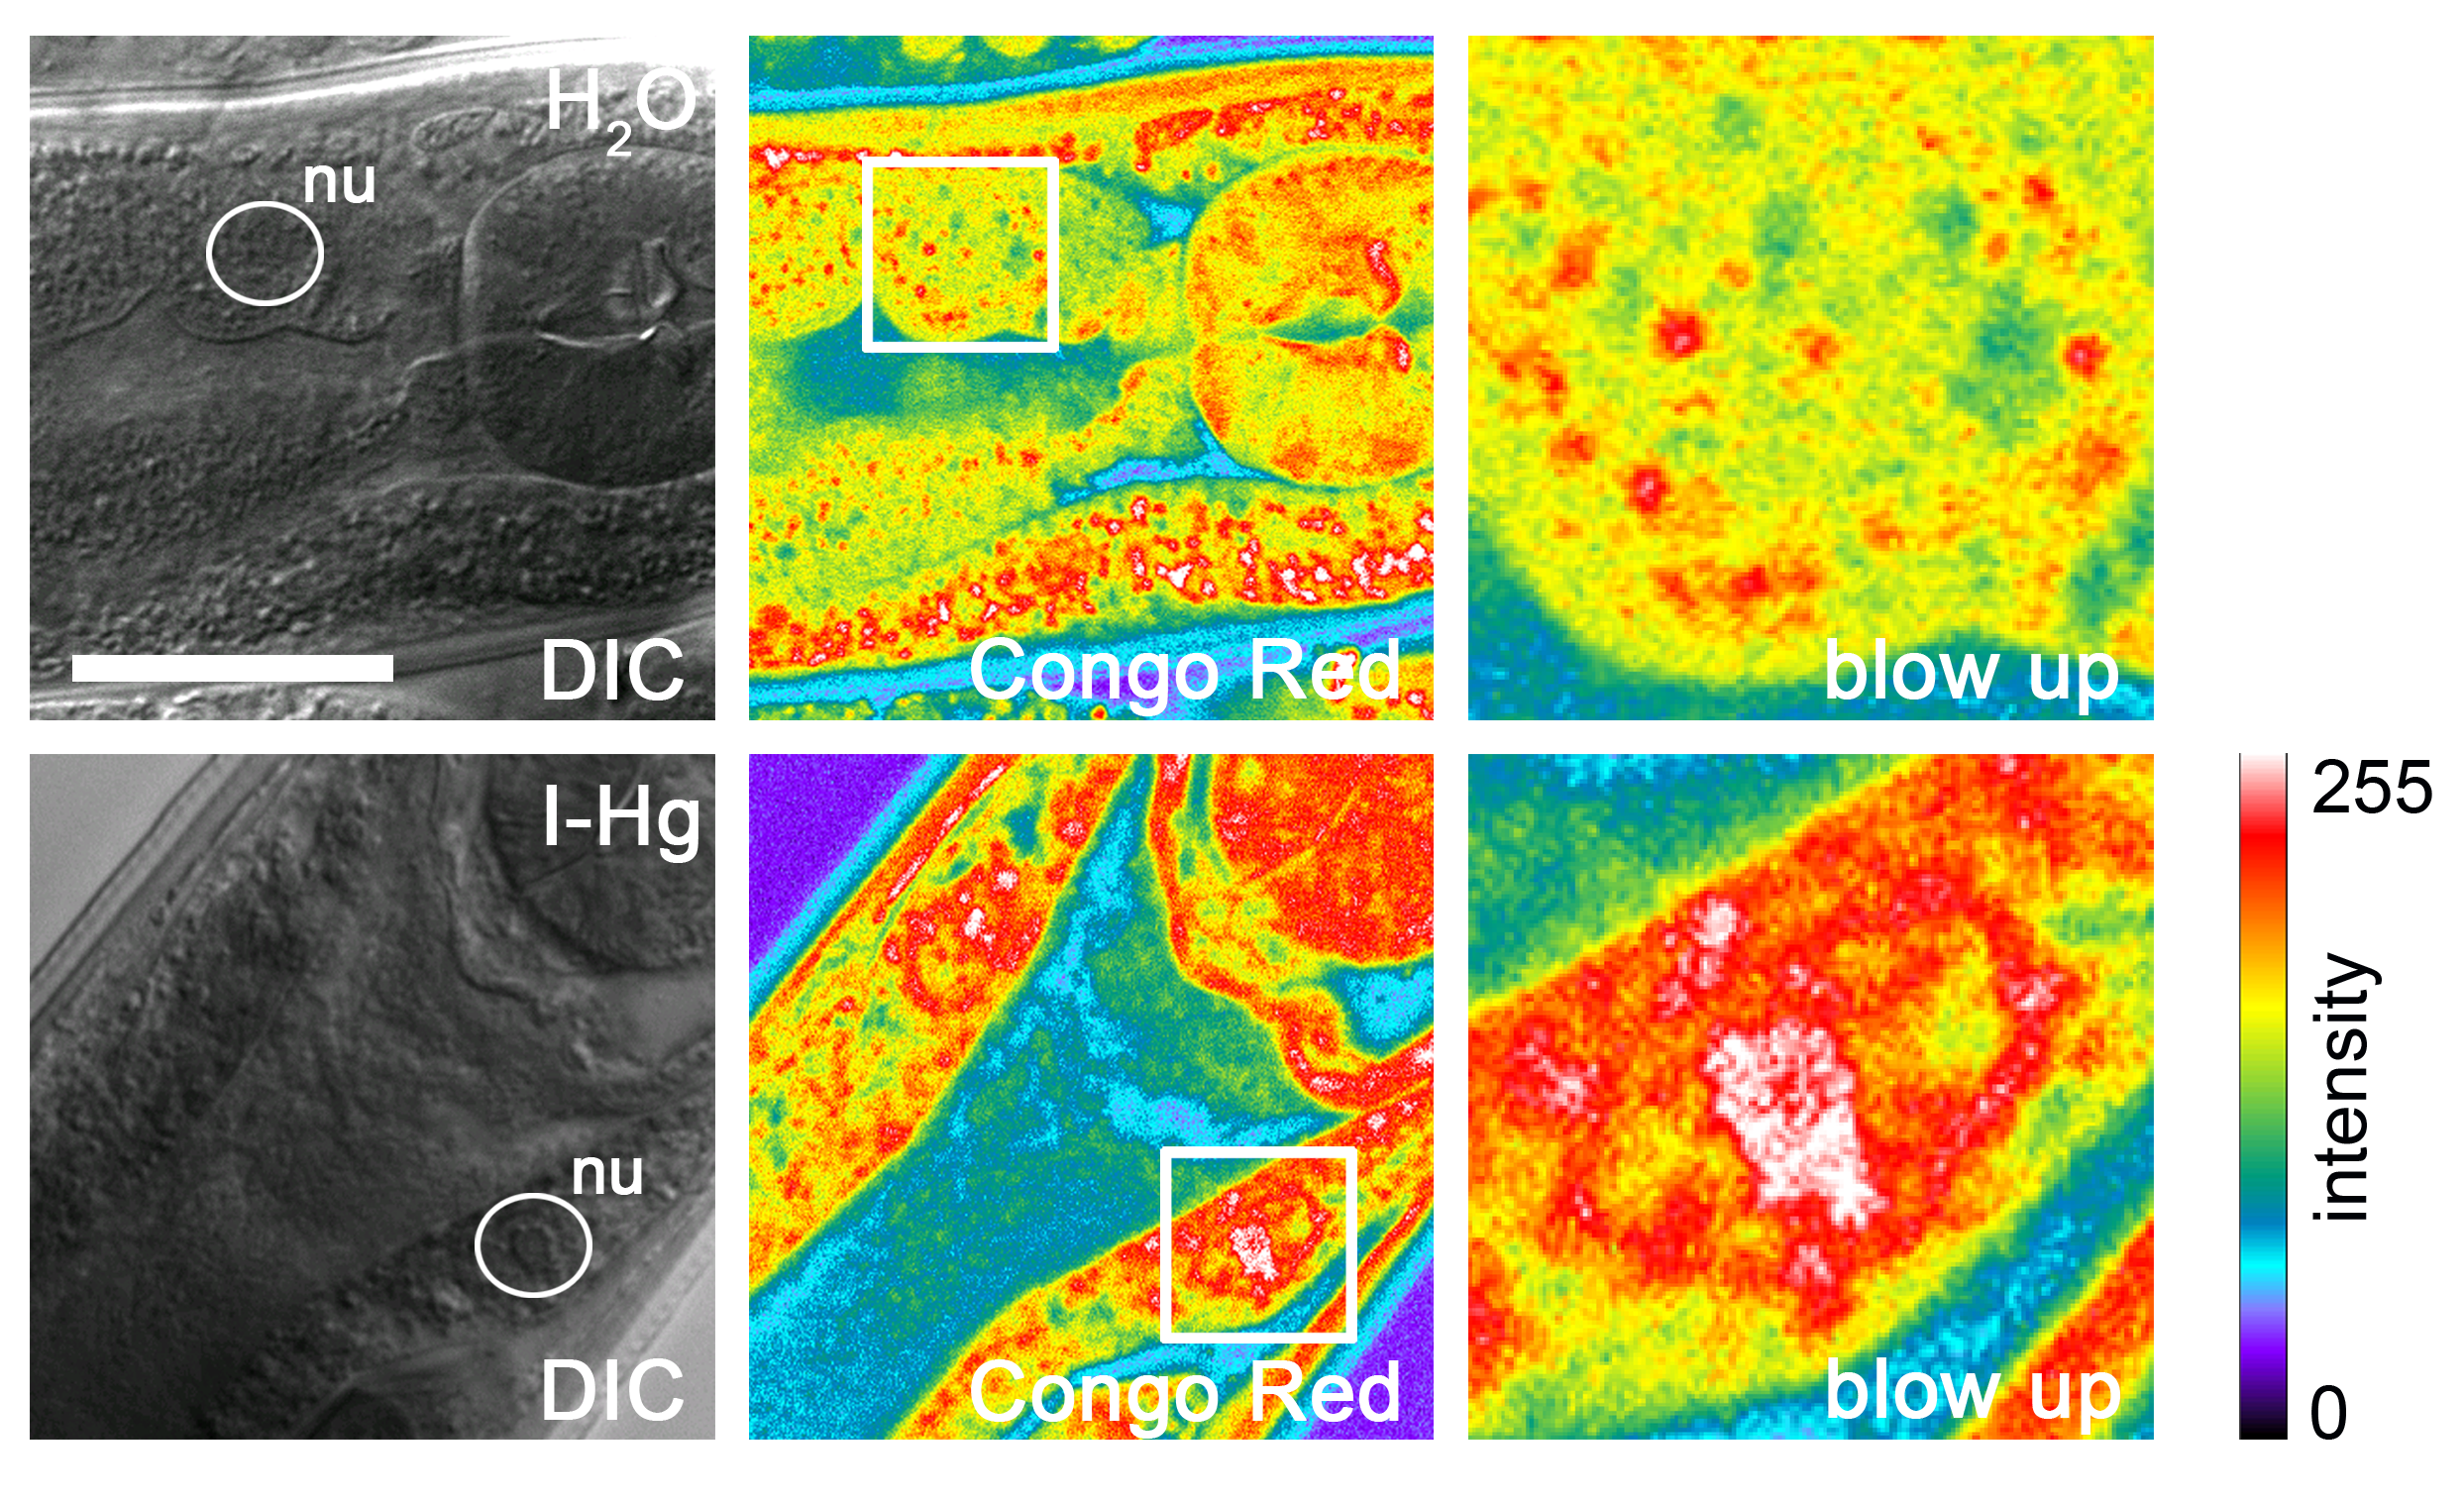
I-Hg induces aggregation of endogenous nuclear proteins in the nematode C. elegans
Supplemental Figure S3. I-Hg induces aggregation of endogenous nuclear proteins in the nematode C. elegans. One day-old, adult worms (wild-type N2) were left untreated (H2O control, upper panel) or treated with 60 μM I-Hg for 24 hours (lower panel). Differential interference contrast and pseudocolored fluorescence microscopy micrographs of representative 2-day old worms are shown. Increasing intensities are depicted in purple (lowest intensity) via blue or red to white (highest intensity). White circles point out nuclei of the anterior-most intestinal cells that are shown in detail as blow ups (insets, right column)). DIC, differential interference contrast; I-Hg, inorganic mercury; nu, nucleus. Bar, 20 µm.
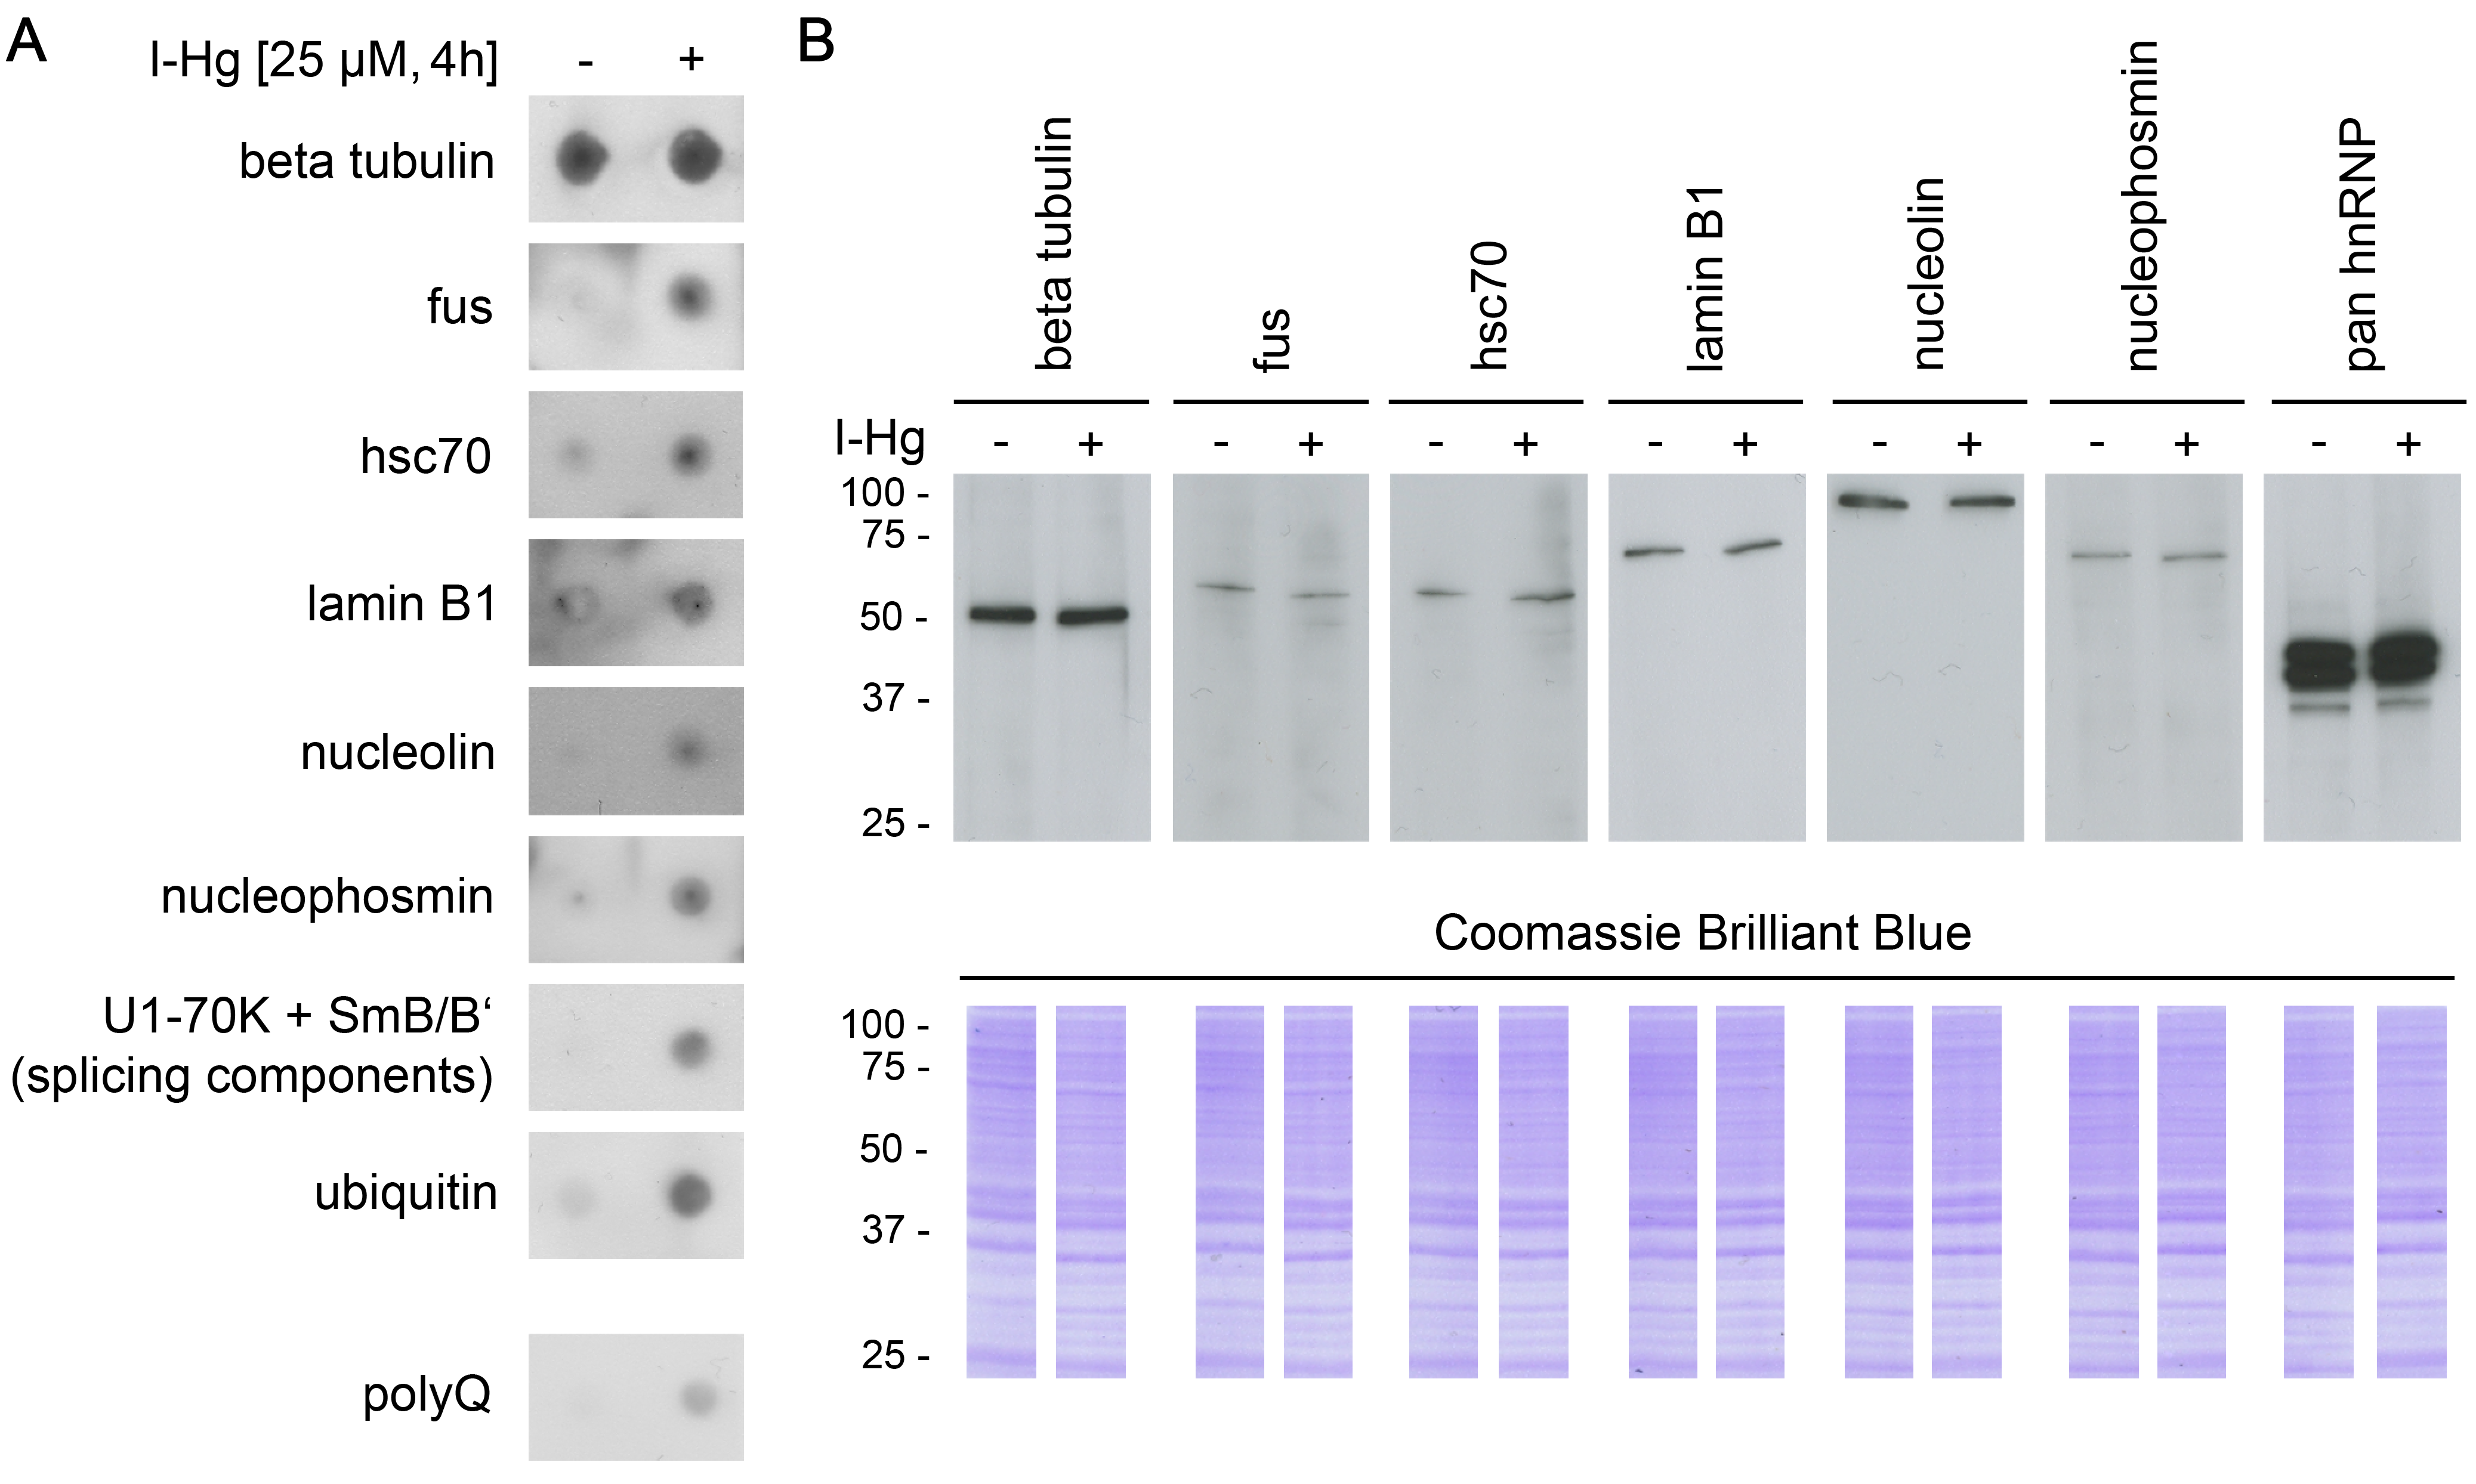
Validation of representative aggregome components
Supplemental Figure S4. Validation of representative aggregome components. (A) Untreated or I-Hg-treated SH-SY5Y neurons were analyzed by filter retardation assays. Dotblot immunodetection of filter-trapped SDS-insoluble protein aggregates with primary antibodies against beta tubulin, FUS/ TLS, Hsc70, lamin B1, nucleolin (C23), nucleophosmin (B23), U1- 70K and SmB/B’ (spliceosomal components, human autoimmune serum), ubiquitin and CAG-repeats (polyQ). Experiments were carried out in triplicate with equal numbers of cells (3x10⁶ cells per dot). (B) Equal protein expression of representative aggregome components was controlled by immunoblotting of untreated and I-Hg-treated SH-SY5Y neurons (top). Respective staining of the SDS-PAGE-gel with the acid dye Coomassie Brilliant Blue indicates equal loading (bottom). h, hours; I-Hg, inorganic mercury.
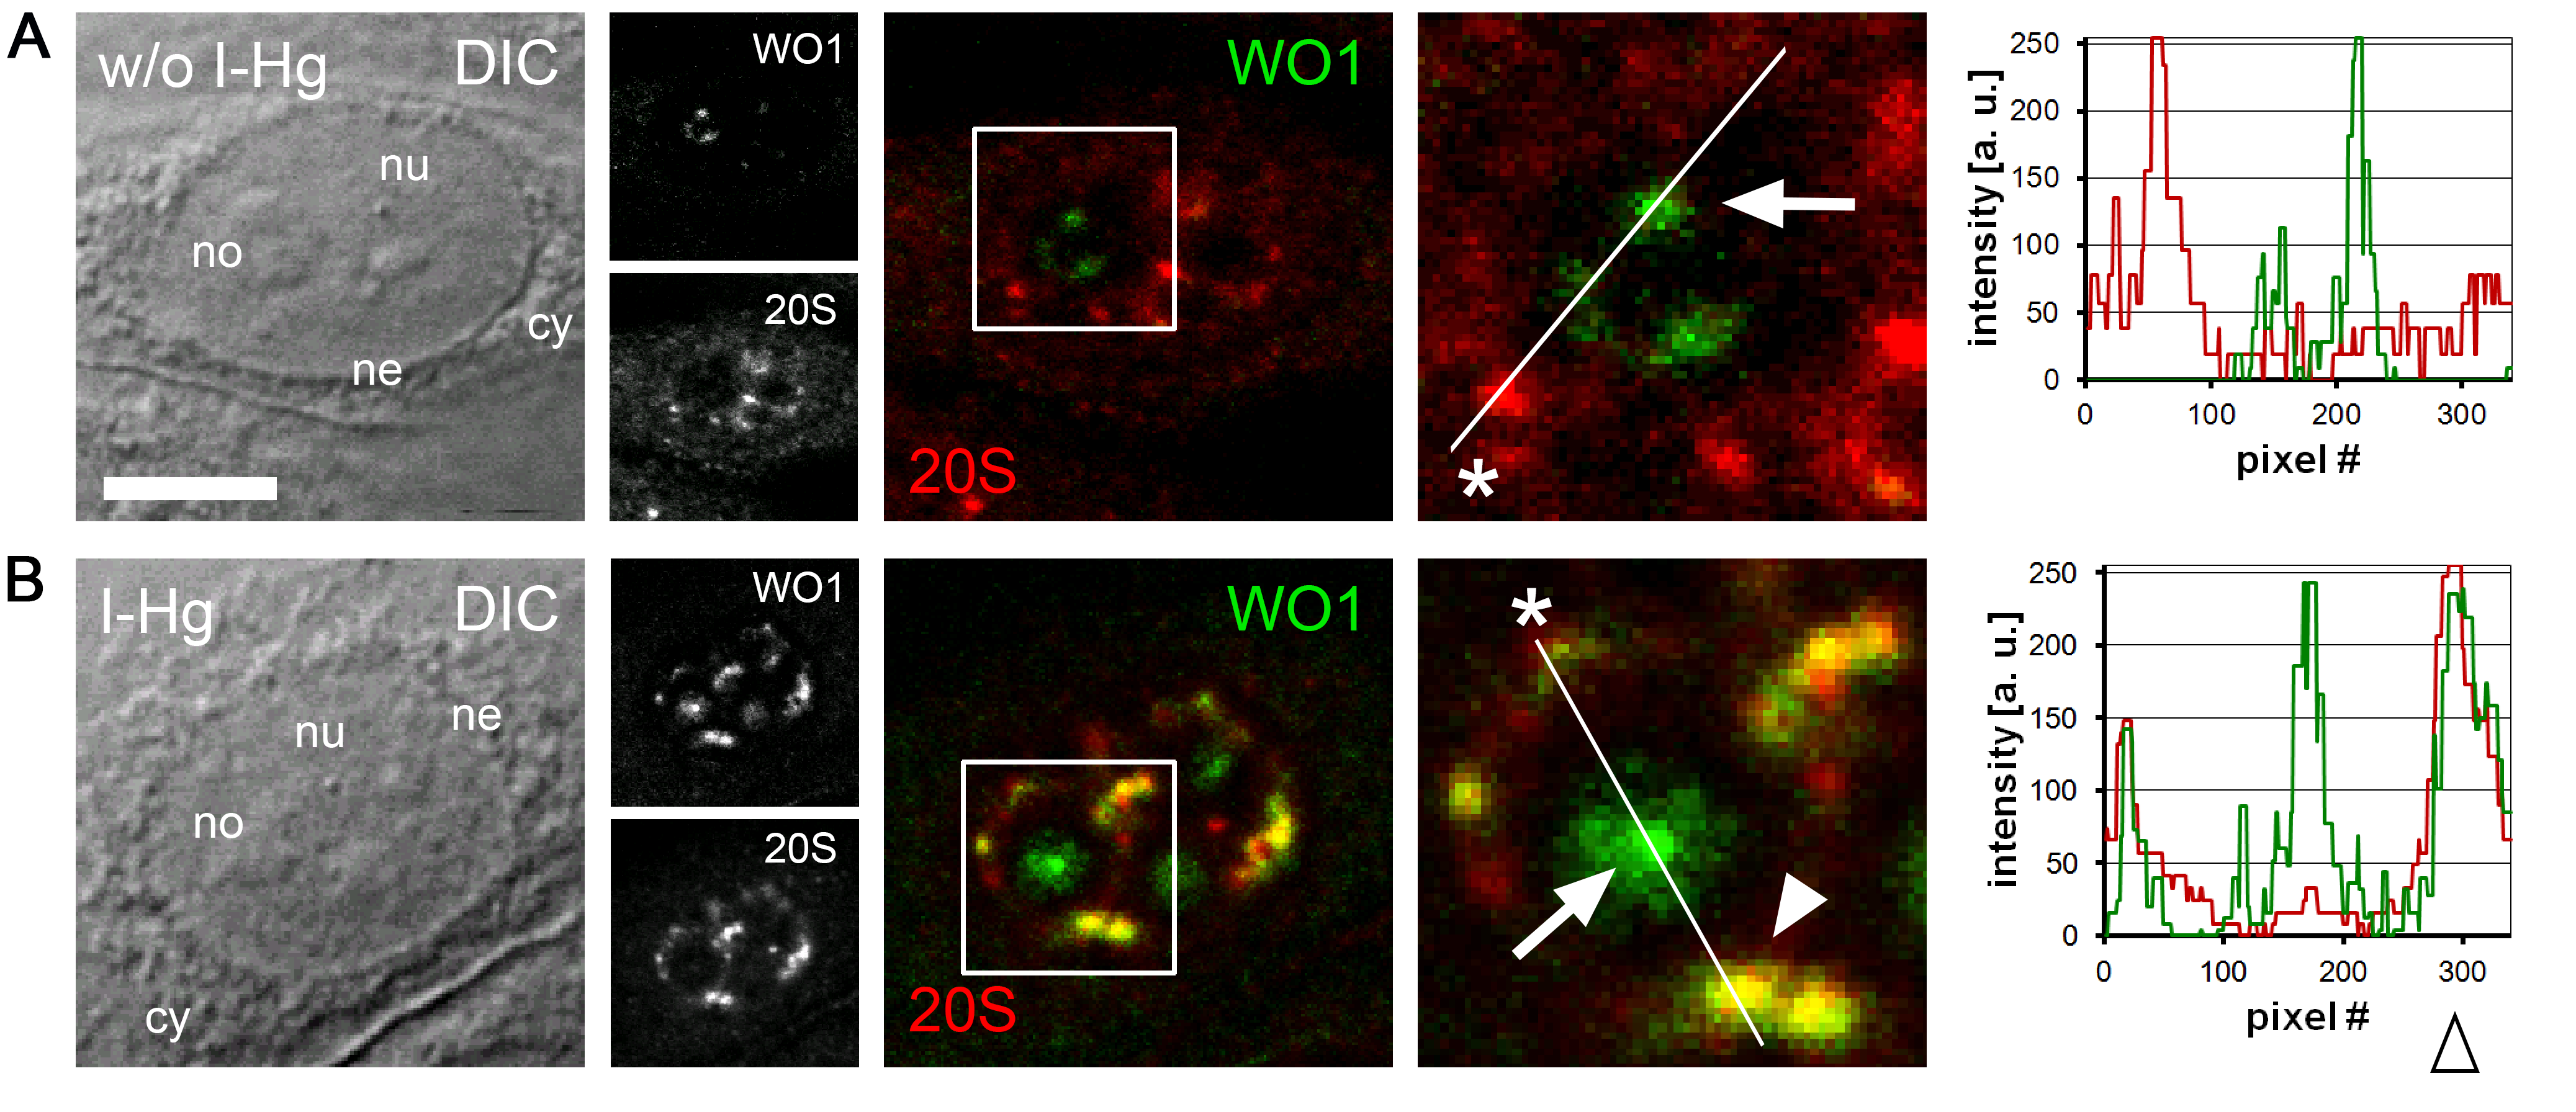
I-Hg-induced recruitment of 20S proteasomes to amyloid speckles
Supplemental Figure S5. I-Hg-induced recruitment of 20S proteasomes to amyloid speckles. Representative confocal micrographs of (A) untreated or (B) I-Hg-treated (4h, 60 μM) HEp-2 cells, double-labelled for amyloid (WO1, green) and 20S proteasomes (red). Blow ups of indicated nuclear regions show WO1-positive nucleoli (arrows) and I-Hg-induced WO1-positive amyloid-like microenvironments in the nucleoplasm (filled arrowhead). Colocalization of amyloid-like microenvironments with proteasomes (yellow) is visualized in the corresponding linescan (open arrowhead). Bars, 5 μm.
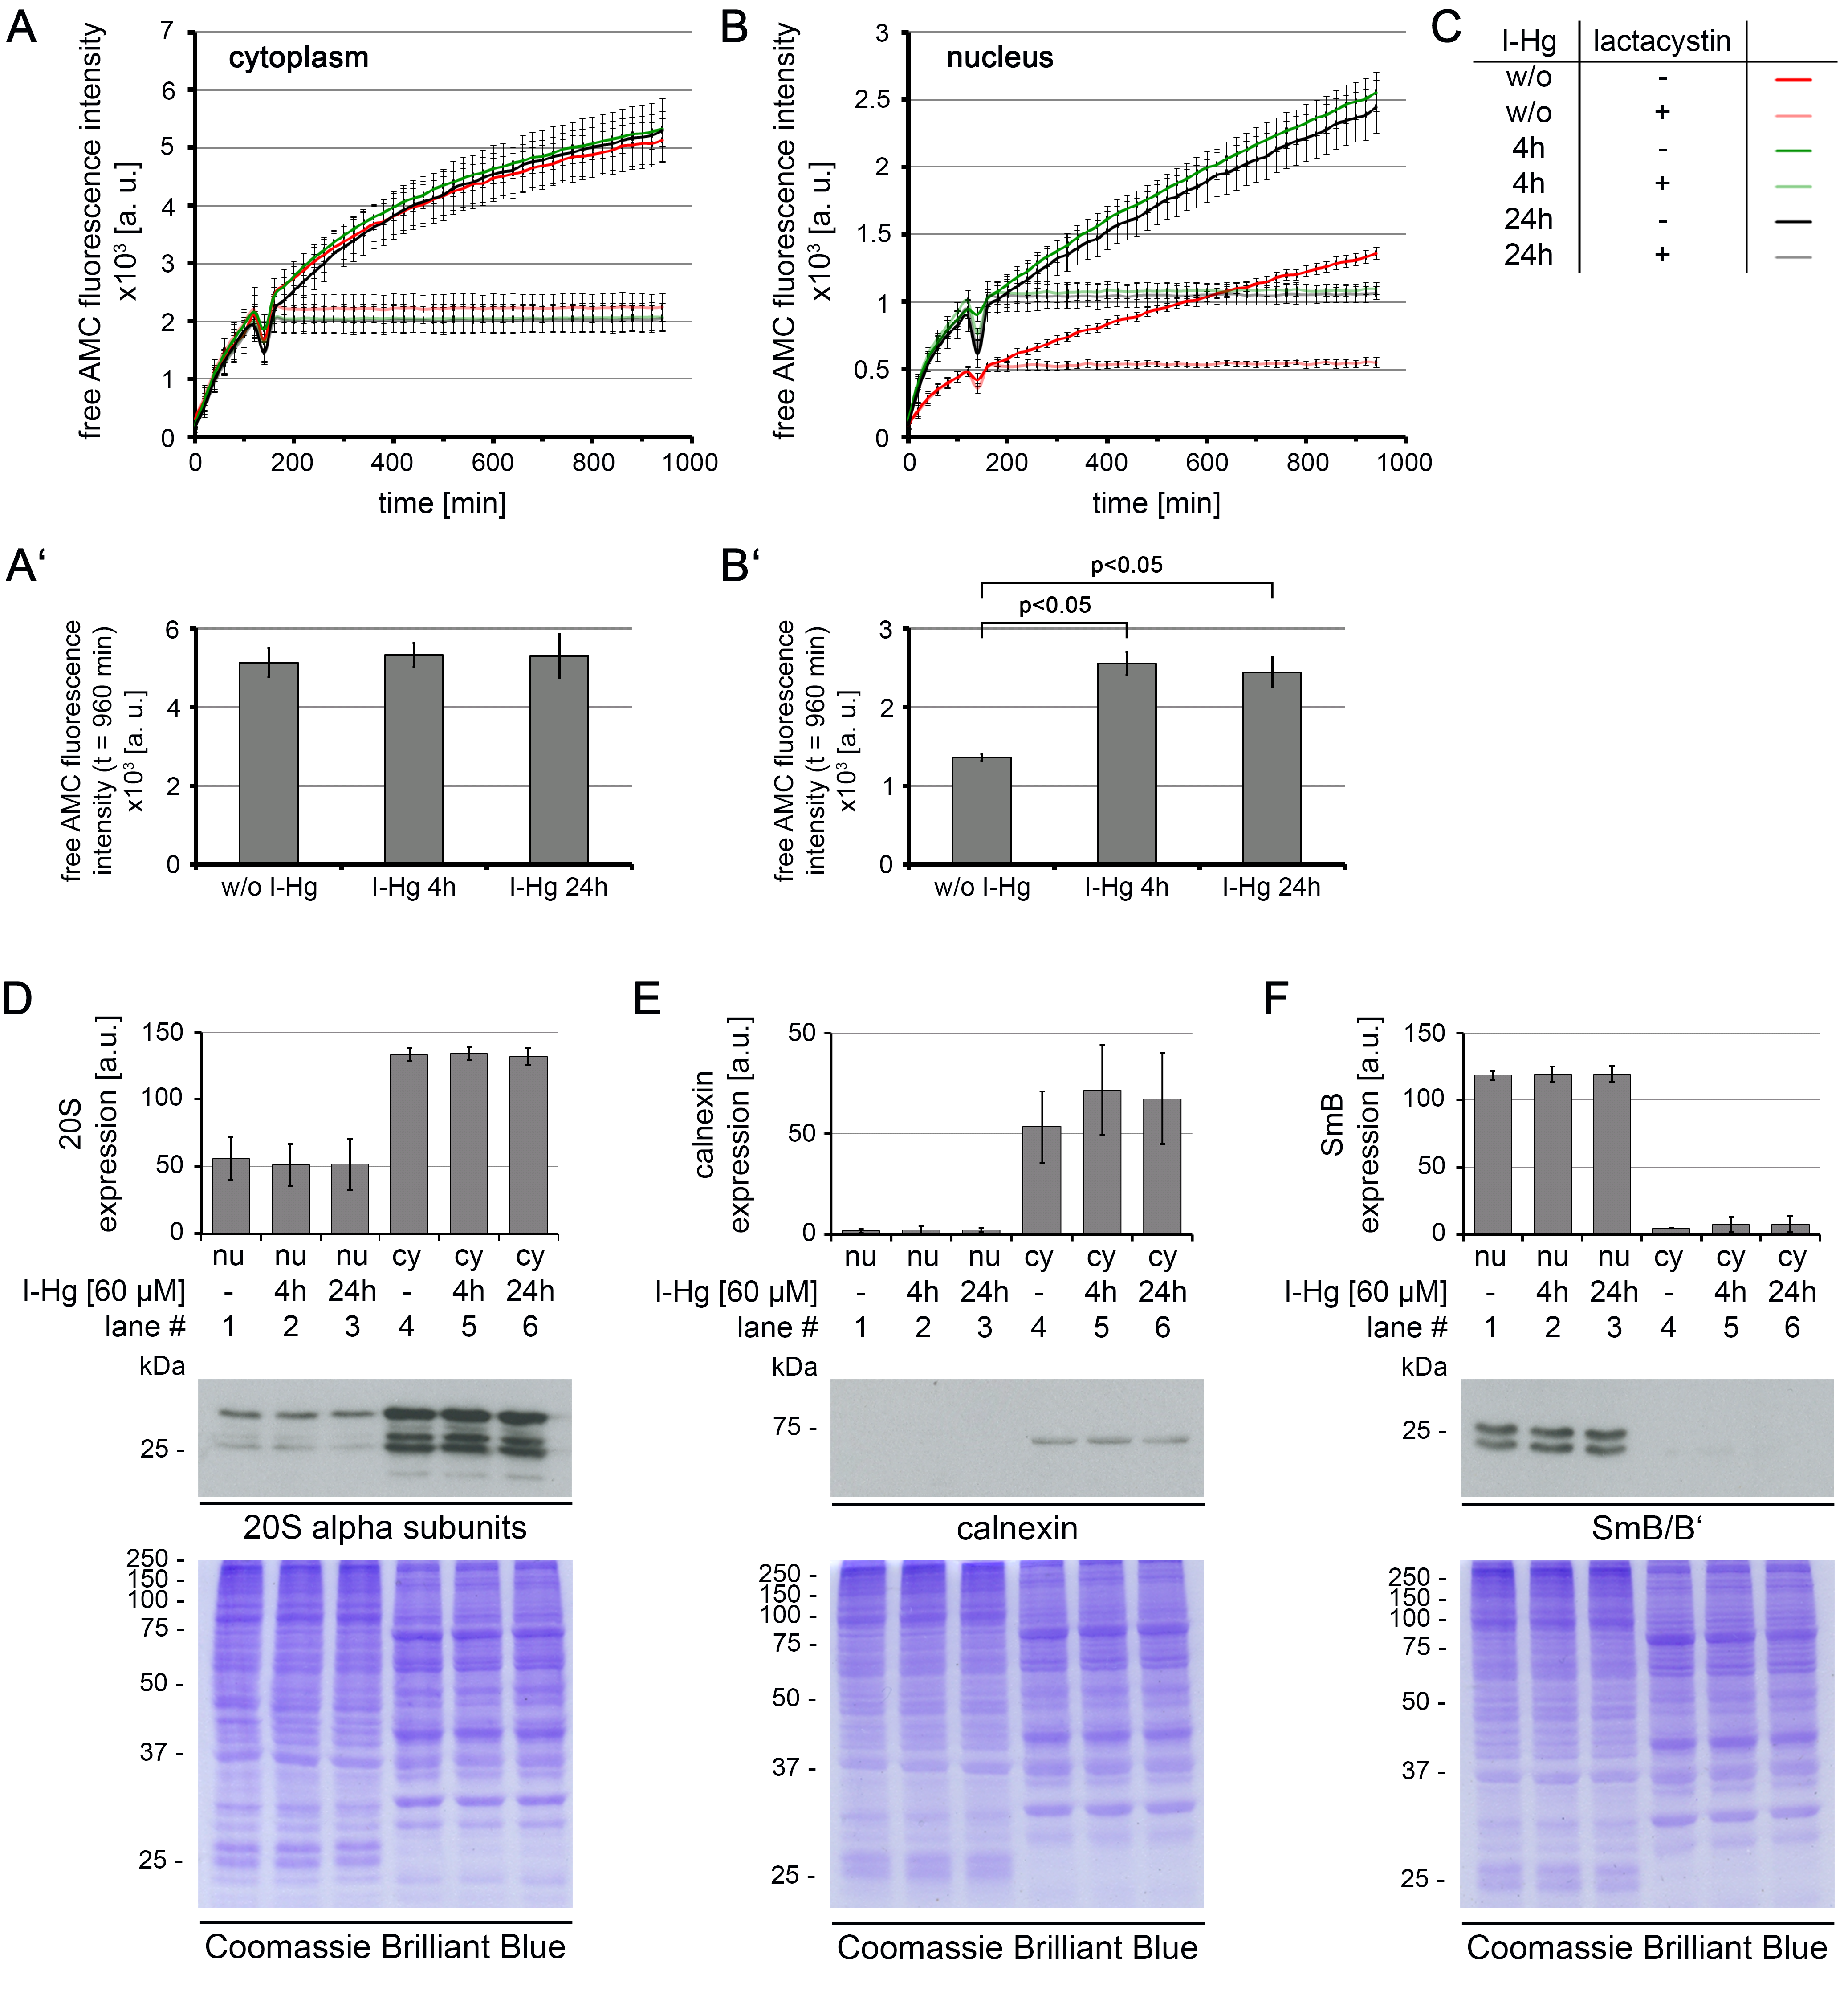
I-Hg induces a significant increase of global proteasomal activity in the nucleus
Supplemental Figure S6. I-Hg induces a significant increase of global proteasomal activity in the nucleus. (A-C) HEp-2 cells were either left untreated or treated with I-Hg for 4 or 24 hours followed by preparation of cytoplasmic and nuclear protein fractions. Cytoplasmic (A, A') and nuclear (B, B') fractions were analysed for proteasomal activity by incubation with fluorogenic substrate Suc-LLVY-AMC and measurement of fluorescence intensity for 960 minutes. Specificity of proteasomal degradation was tested by addition of proteasome inhibitor lactacystin after 2 hours (light red, light green or light grey). (A', B') Bar graphs show mean values and standard deviations (SD) at time point t = 960 min (see A and B). One-way ANOVA with Tukey's post-hoc test was performed to test for significant differences (p < 0.05). (C) Color codes indicate cell culture conditions. (D) Expression of 20S proteasomes was analysed by immunoblot of 20S alpha subunits. (E, F) show purity of cytoplasmic and nuclear protein fractions. Calnexin was used as a cytoplasmic marker and SmB/B’ was used as a nuclear marker. (D-F, bottom) Coomassie Brilliant Blue staining indicates equal protein loading. (A-F) Graphs show mean values of three independent experiments ± SD. AMC, aminomethylcoumarin; a.u., arbitrary units; cy, cytoplasm; DIC, differential interference contrast; h, hours; min, minutes; ne, nuclear envelope; no, nucleolus; nu, nucleus.
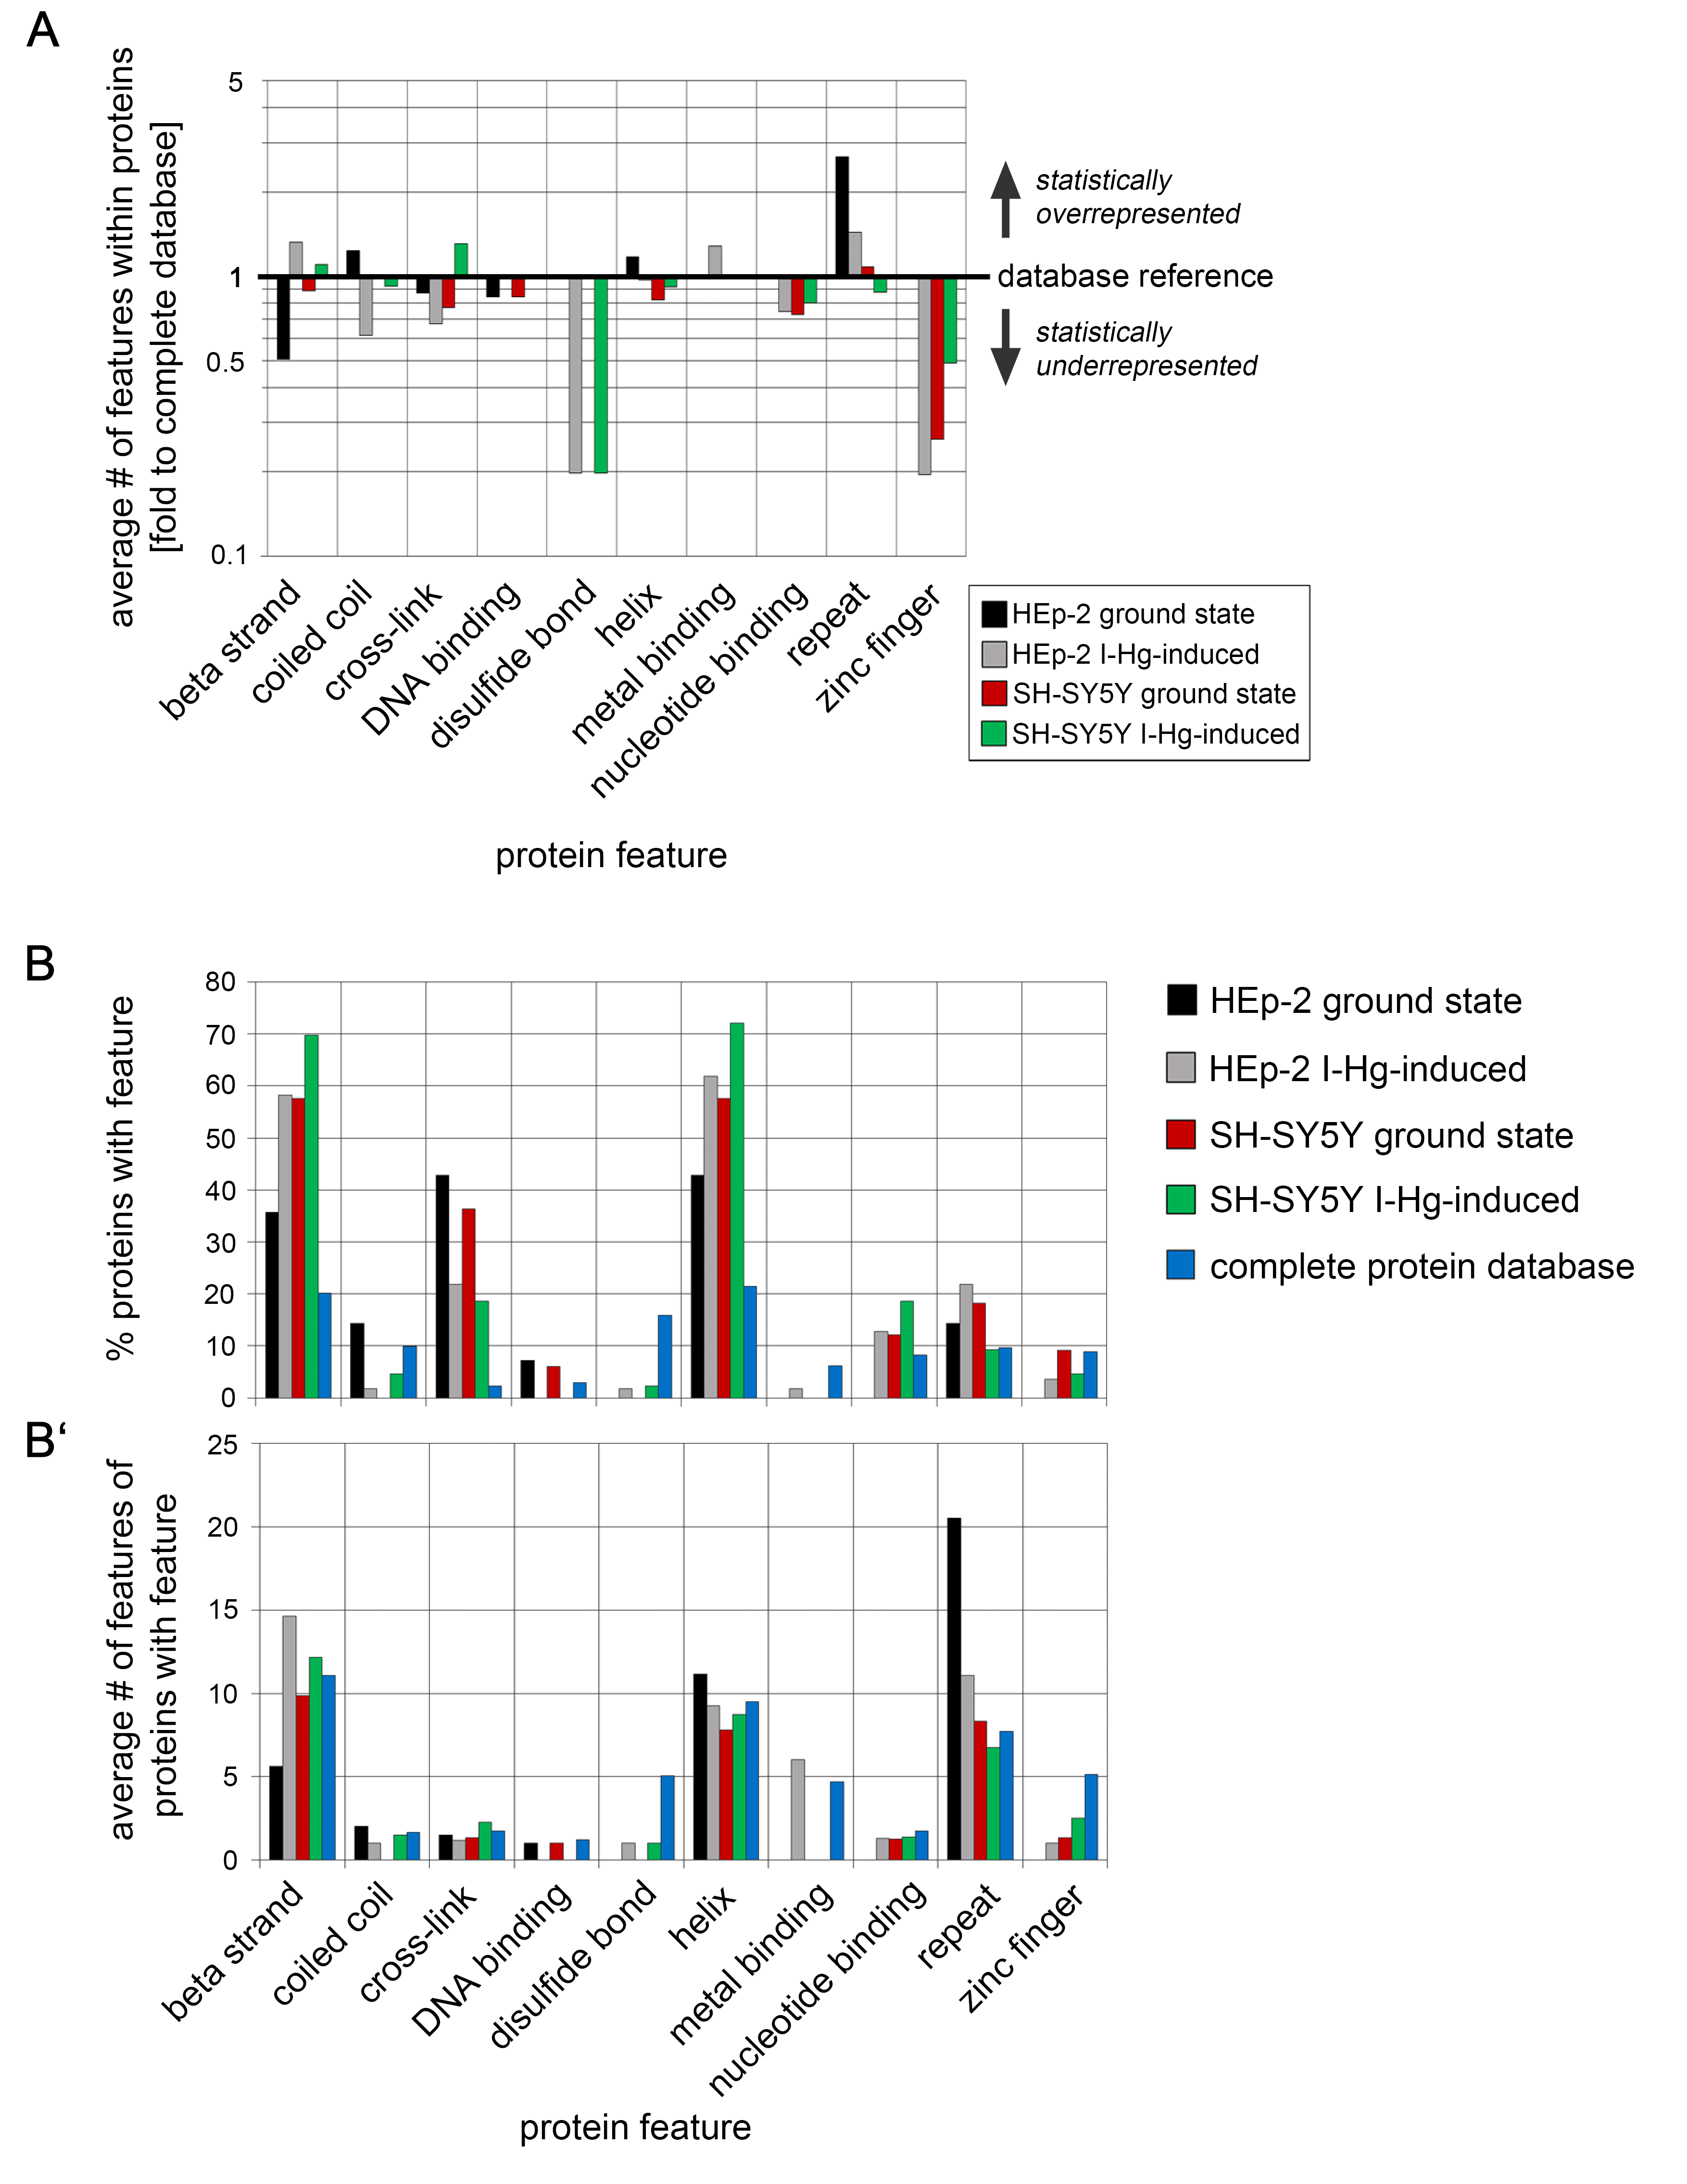
Protein features of aggregome components
Supplemental Figure S7. Protein features of aggregome components. Protein bcomponents of aggregomes in different protein fibrillation states (compare Supplementary Tables 1 and 2), i.e. HEp-2 ground state (black), HEp-2 I-Hg-induced (grey), SH-SY5Y ground state (red) and SH-SY5Y I-Hg-induced (green) were analyzed for sequence features extracted from the UniProtKB database. (A) The average number of features within each protein is calculated and presented as fold change to corresponding values of the complete human proteome database. The database reference line (y-value = 1) represents the value of a feature in the complete UniProtKB protein database. A corresponding value above 1 (upward bars) indicates statistical overrepresentation and a value below 1 (downward bars) indicates underrepresentation. Values of features that are not found in a single sample (value = 0) are not depicted. (B + B’) show the absolute values of the protein feature quantification described in (A). Additionally, the quantification of the complete protein database was plotted as a separate bar (blue). (B) The number of proteins with features [%] and (B’) the average number of features within a protein was calculated and is presented as bar plots of absolute values.
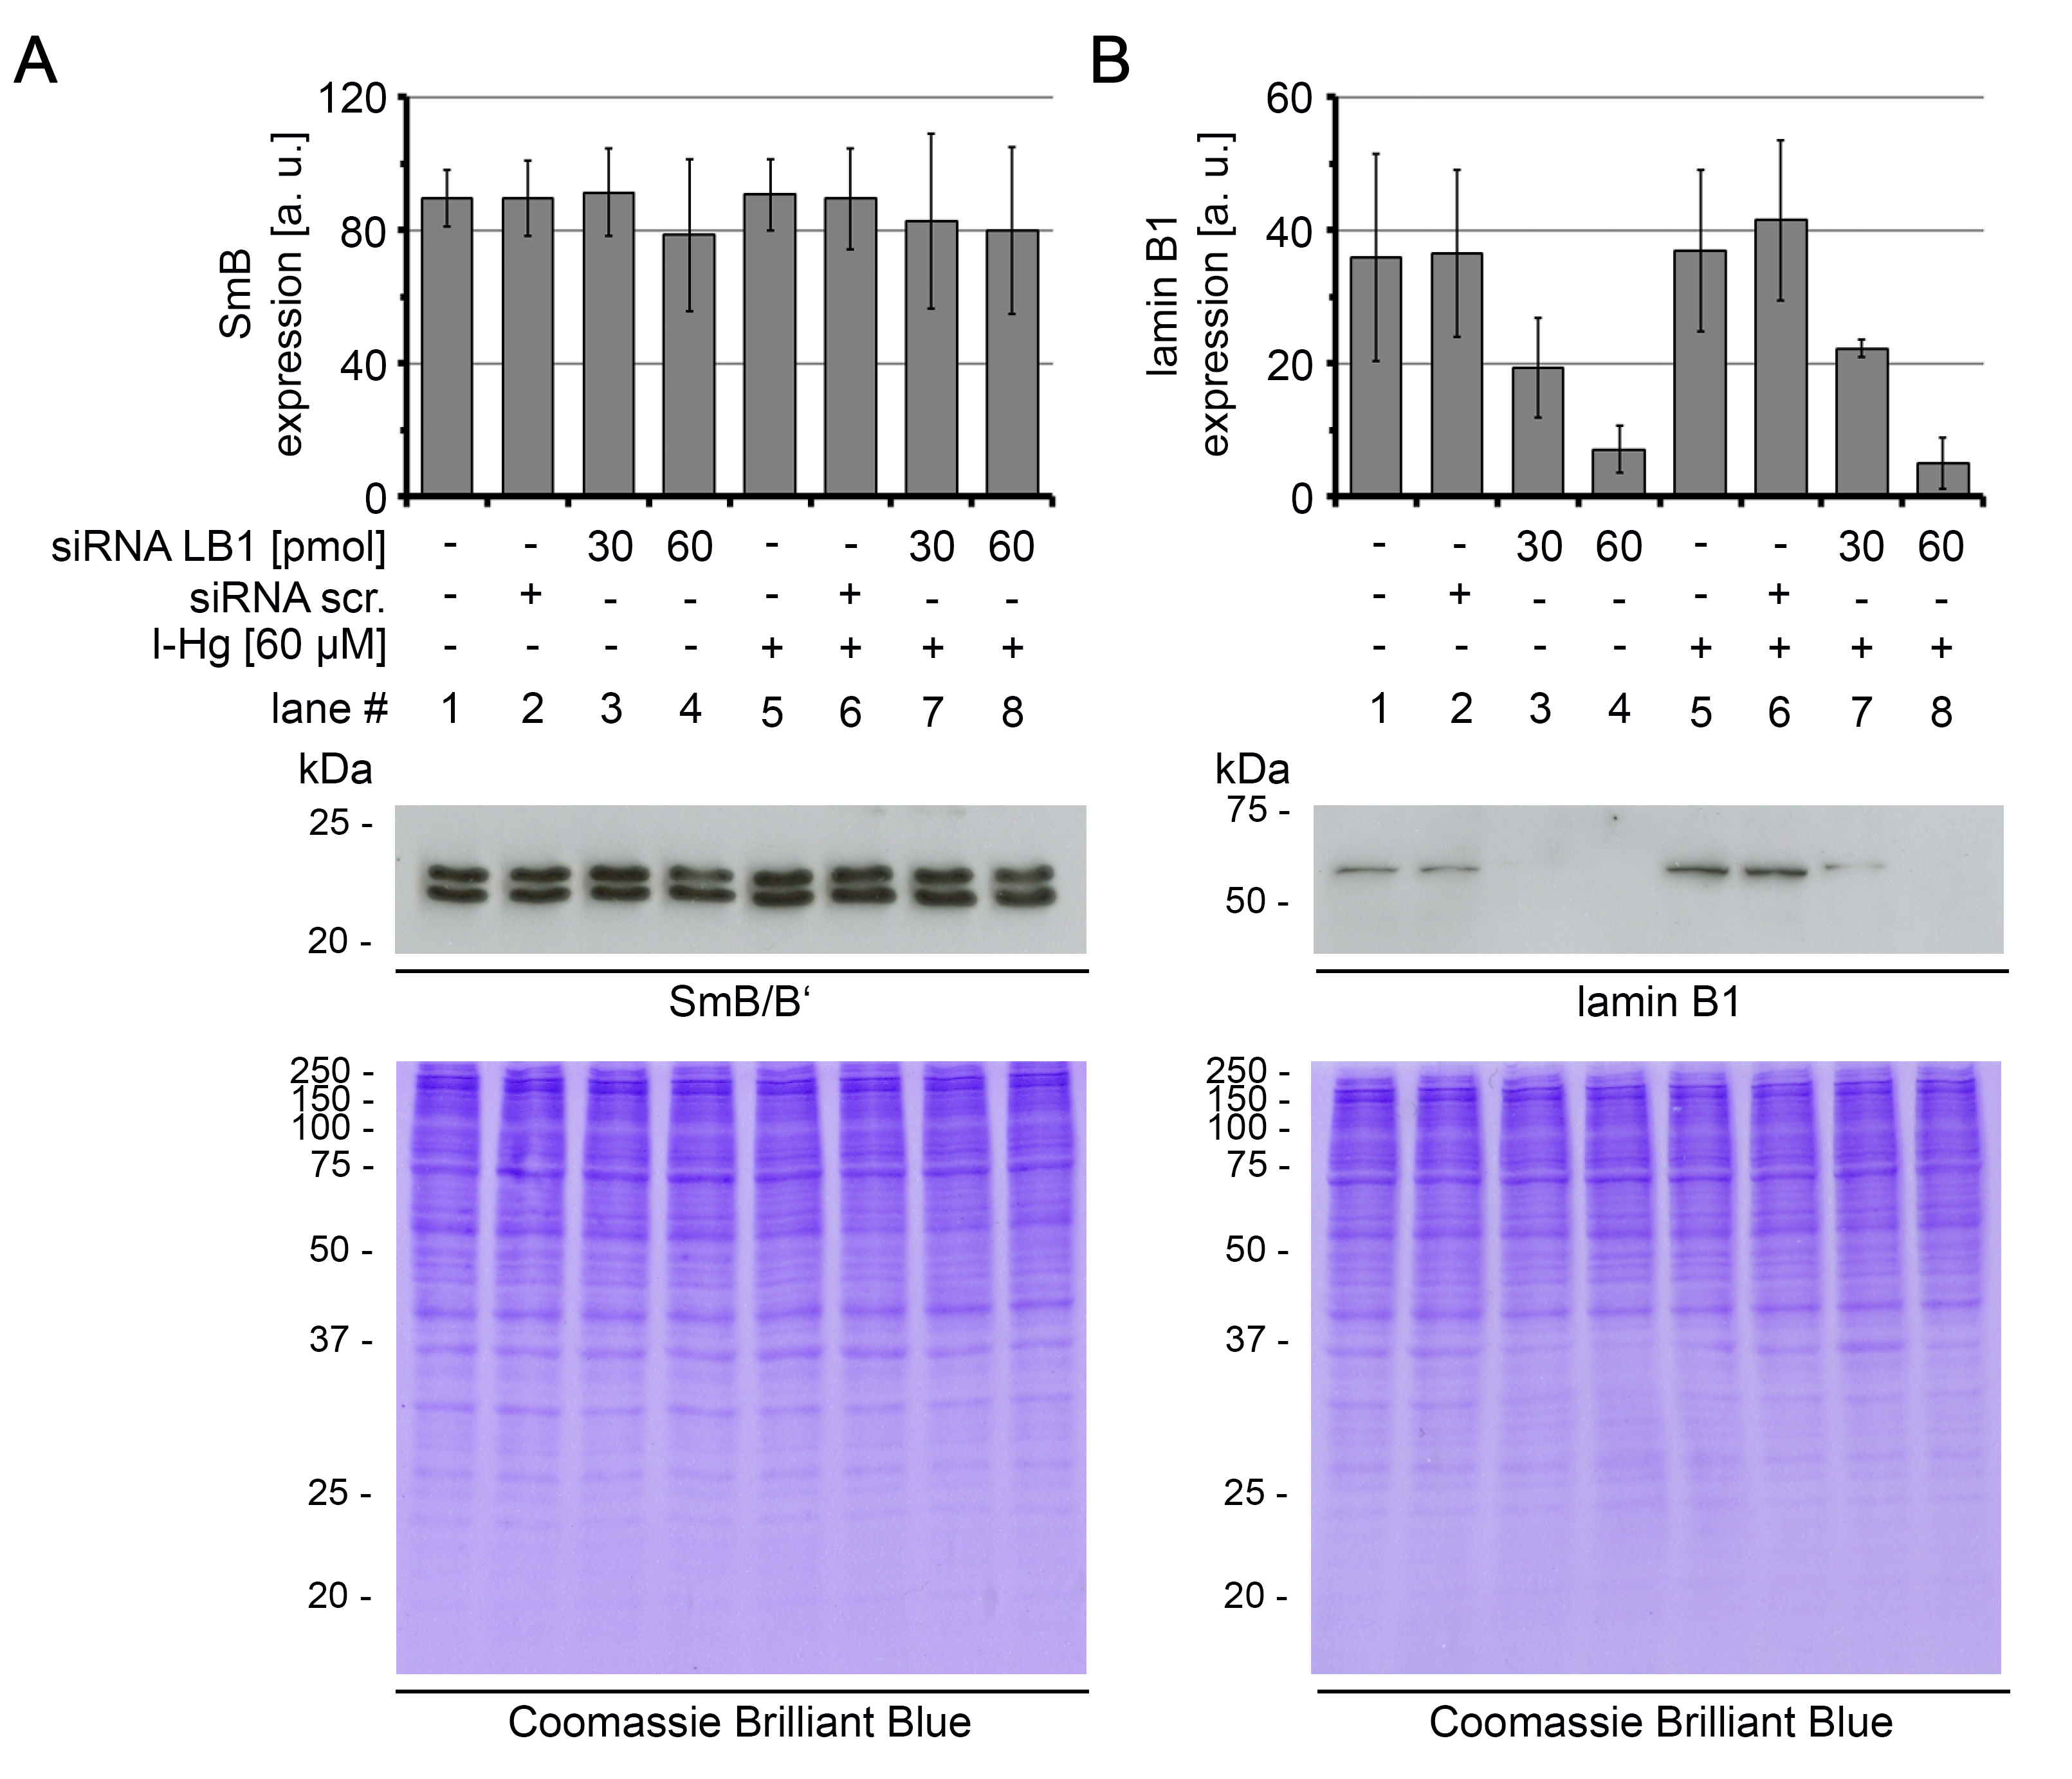
Expression of lamin B1 and spliceosomal component SmB/B' in lamin B1 silenced cells
Supplemental Figure S8. Expression of lamin B1 and spliceosomal component SmB/B' in lamin B1 silenced cells. HEp-2 cells were left untreated, or pre-treated with lamin B1 siRNA [30 pmol or 60 pmol] or scrambled siRNA, followed by an incubation with I-Hg (4 hours, [60μM]) as indicated. Cell lysates were analysed by immunoblotting and expression levels of (A) SmB/B’ and (B) lamin B1 were quantified by densitometric analysis. Coomassie Brilliant Blue staining indicates equal loading. Immunoblots are representative of three independent experiments. A.u., arbitrary units; kDA, kilo Dalton; LB1, lamin B1; siRNA scr., scrambled small interfering RNA.
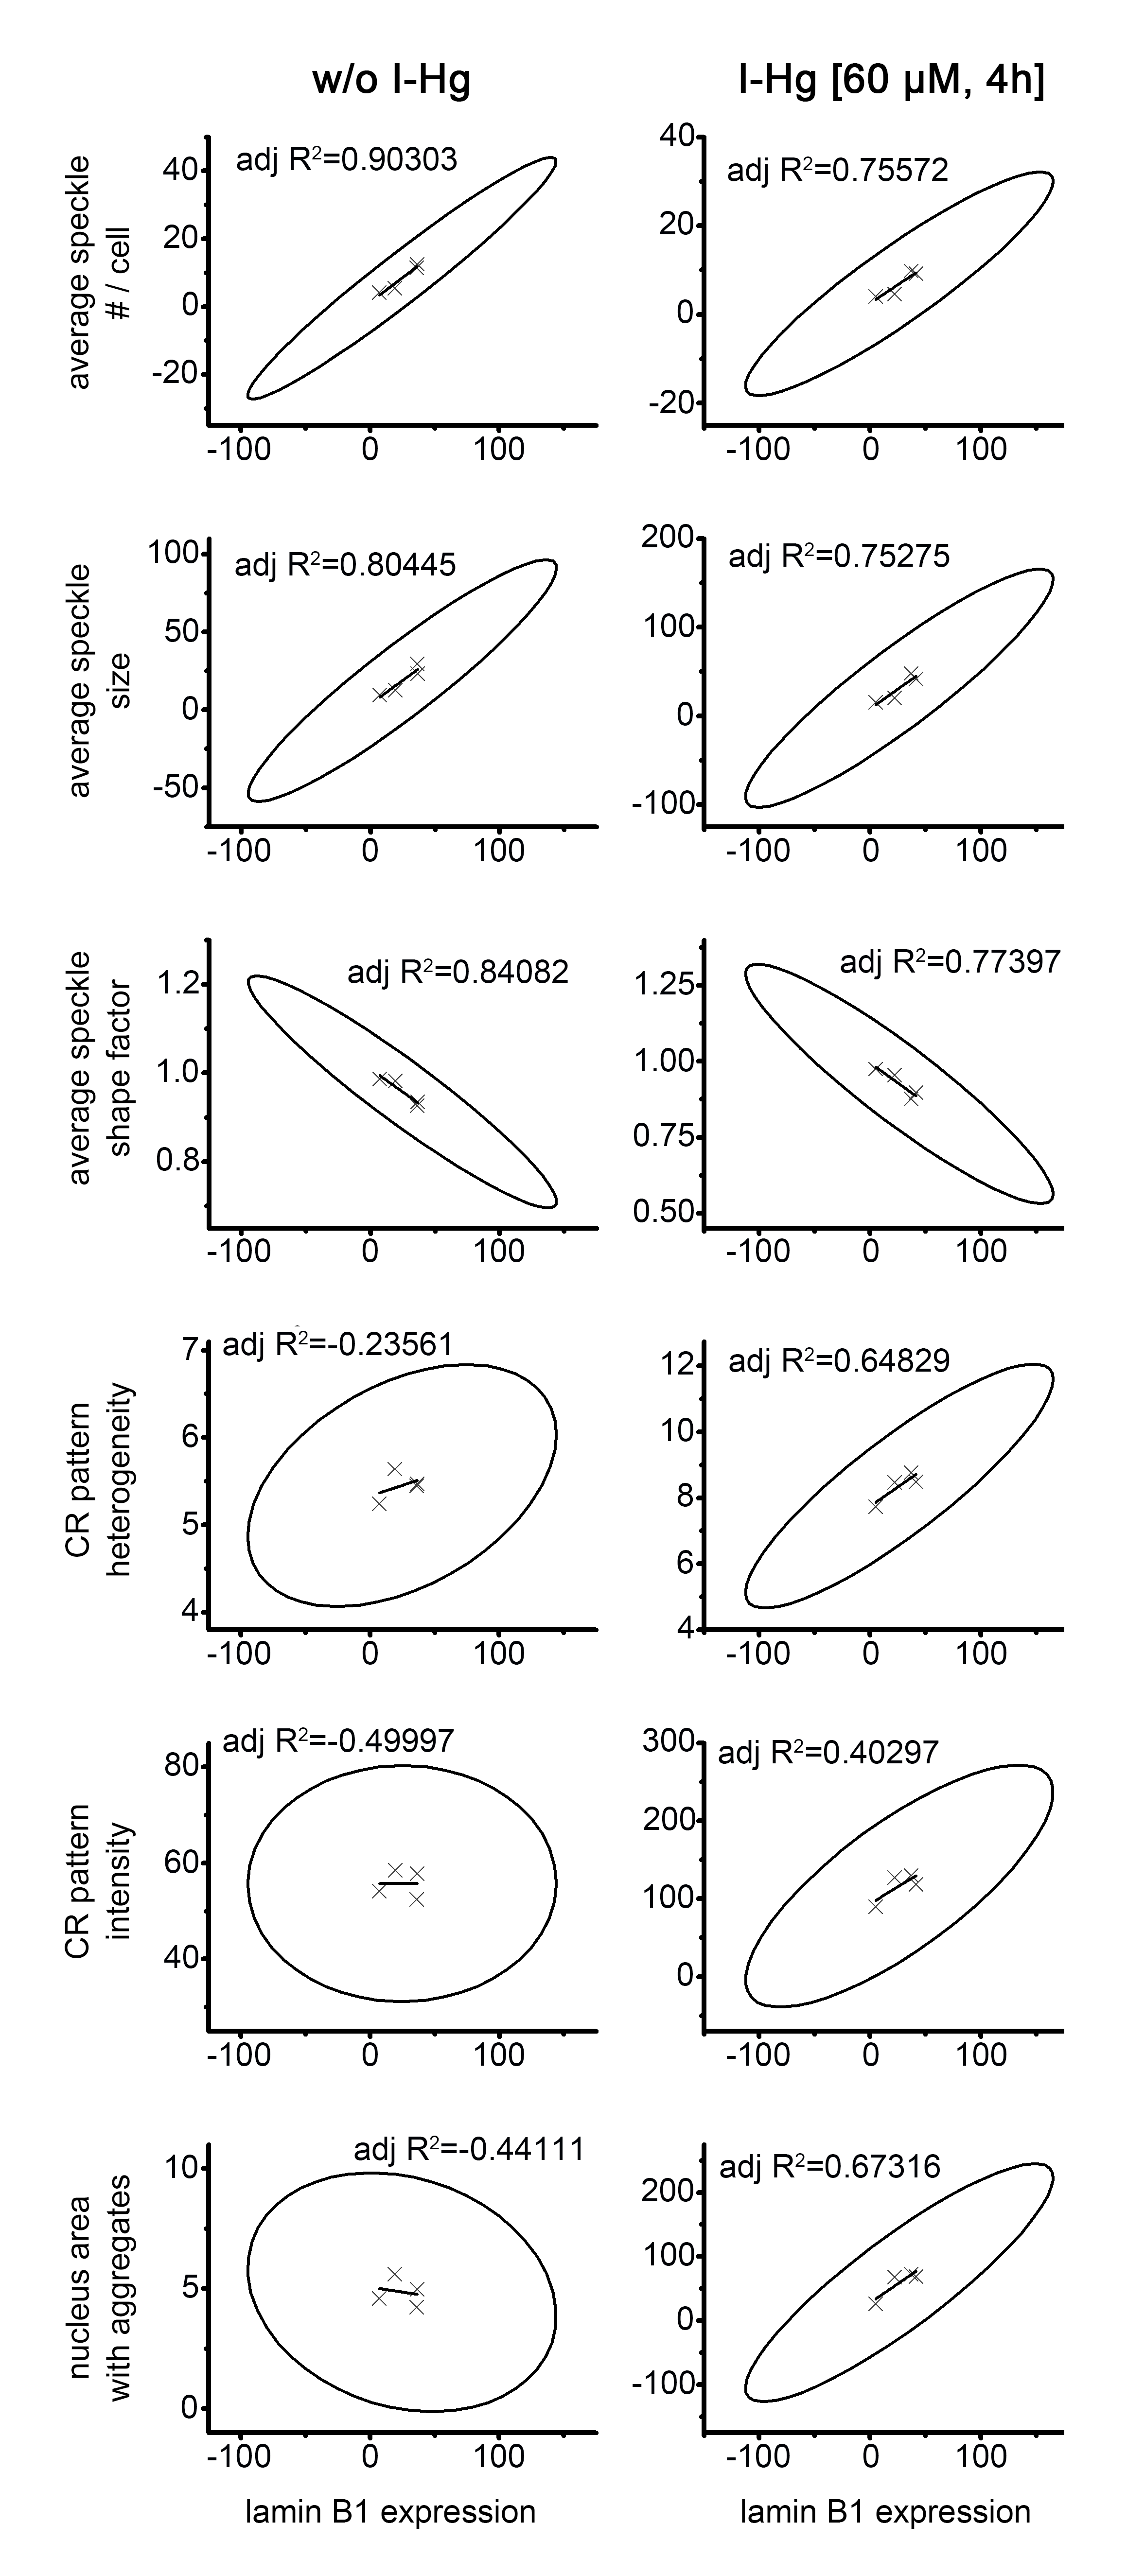
Positive correlation of lamin B1 depletion with I-Hg-induced nuclear amyloid
Supplemental Figure S9. Positive correlation of lamin B1 depletion with I-Hg-induced nuclear amyloid. Correlation analysis was done by linear fit analysis (Origin 8.5, Origin Labs). High adjusted R2-values and corresponding high eccentricity of the confidence ellipses indicate a high correlation. A positive or negative slope of the regression line indicates a positive or negative correlation. Adjusted R2-values were used to evaluate correlation of lamin B1 expression levels with speckle and amyloid fluorescence pattern characteristics. Scatter plots show lamin B1 expression (immunoblot) on the x-axis and speckle or amyloid characteristics (immunofluorescence) on the y axis. Graphs show mean values (X) from quantifications in Figure 5 (C, D), linear regression (line), confidence ellipse (ellipse) and adjusted R2-values (text). The analysis shows a high correlation of nuclear speckle patterns with expression of lamin B1 in untreated as well as in I-Hg-treated cells. Nuclear speckles enriched with spliceosomal components are reduced in number and size and become rounder when lamin B1 is depleted by RNA interference (compare to Fig. 5). The ground state of nuclear protein aggregation (Congo red pattern in untreated cells) is not correlated with lamin B1 depletion, as indicated by low R2-values and round shaped confidence ellipses (eccentricity near 0). In contrast, lamin B1 depletion is positively correlated with I-Hg-induced nuclear amyloid as indicated by high eccentricity and positive slopes of the respective confidence ellipses. The data suggests a critical role of lamin B1 in nuclear speckle formation and induction of nuclear amyloid. adj, adjusted; h, hours; I-Hg, inorganic mercury; R2, coefficient of determination.
The aggregome of untreated or I-Hg-induced HEp-2 cells as identified by mass spectrometric analysis
Supplemental Table S1. The aggregome of untreated or I-Hg-induced HEp-2 cells as identified by mass spectrometric analysis.Supplemental Table 1 lists all filter-trapped proteins detected in untreated HEp-2 cell samples (ground state protein fibrillation) and in samples from 4 hour I-Hg-treated HEp-2 cells (induced fibrillation state), depleted of candidates that also occur in ground state. Proteins from two independent experiments per group were pooled and listed. Entry names are according to the SwissProt database.
The aggregome of untreated or I-Hg-induced neural SHSY5Y cells as identified by mass spectrometric analysis
Supplemental Table S2. The aggregome of untreated or I-Hg-induced neural SHSY5Y cells as identified by mass spectrometric analysis. Supplemental Table S2 lists all filter-trapped proteins detected in untreated SH-SY5Y cell samples (ground state protein fibrillation) and in samples from 4 hour I-Hg-treated SHSY5Y cells (induced fibrillation state), depleted of candidates that also occur in ground state. Proteins from two independent experiments per group were pooled and listed. Entry names are according to the SwissProt database.
Statistical analysis of the quantification of nuclear speckle patterns
Supplemental Table S3. Statistical analysis of the quantification of nuclear speckle patterns (compare Fig. 5 A,C). Mean values presented in Figure 5C were tested for significance by one-way ANOVA and Tukey’s post-hoc test. Values indicating significance (p < 0.05) are depicted in black.
Statistical analysis of the quantification of nuclear Congo red staining patterns
Supplemental Table S4. Statistical analysis of the quantification of nuclear Congo red staining patterns (compare Fig. 5 b,d). Mean values from Figure 5D were tested for significance by one-way ANOVA and Tukey’s post-hoc test. Values indicating significance (p < 0.05) are depicted in bold, black lettering.
Raw data of Fluo4 measurements
Raw data of Fluo4 measurements in Figure 1 A-D.
Raw data of aggregome proteomics
Raw data of mass spectrometry results, e.g. aggregome components in Supplemental tables 1 and 2.
Raw data of Supplemental Figure 1
Raw data of cell viability analyses in HEp-2 or SH-SY5Y cells that were treated with increasing concentrations of I-Hg as presented in Supplemental Figure 1.
Raw data of proteasomal activity analyses
Raw data of global proteasomal activity in cytoplasmic or nuclear protein fractions of untreated or I-Hg-treated HEp-2 cells as presented in Supplemental Figure S6, A,A',B,B'.
Raw data of all immunoblots
Raw data of immunoblots (Figures 1,4,S2,S4,S6,S8).
Additional Information
Competing Interests
The authors declare they have no competing interests.
Author Contributions
Florian Arnhold performed the experiments, analyzed the data, contributed reagents/materials/analysis tools, wrote the paper, prepared figures and/or tables, reviewed drafts of the paper.
Karl-Heinz Guehrs performed the experiments, analyzed the data, contributed reagents/materials/analysis tools, reviewed drafts of the paper.
Anna von Mikecz conceived and designed the experiments, analyzed the data, contributed reagents/materials/analysis tools, wrote the paper, prepared figures and/or tables, reviewed drafts of the paper.
Funding
Work in the von Mikecz laboratory was supported by the German Science Foundation (DFG) through grants (MI 486/7-1) and GRK 1033. The funders had no role in study design, data collection and analysis, decision to publish, or preparation of the manuscript.
