
Research advances in predicting the expansion of hypertensive intracerebral hemorrhage based on CT images: an overview
- Published
- Accepted
- Received
- Academic Editor
- Gustavo Pedrino
- Subject Areas
- Neurology, Radiology and Medical Imaging
- Keywords
- Hypertensive intracerebral hemorrhage, Hematoma expansion, Imaging signs, Radiomics, Artificial intelligence
- Copyright
- © 2024 Ai et al.
- Licence
- This is an open access article distributed under the terms of the Creative Commons Attribution License, which permits using, remixing, and building upon the work non-commercially, as long as it is properly attributed. For attribution, the original author(s), title, publication source (PeerJ) and either DOI or URL of the article must be cited.
- Cite this article
- 2024. Research advances in predicting the expansion of hypertensive intracerebral hemorrhage based on CT images: an overview. PeerJ 12:e17556 https://doi.org/10.7717/peerj.17556
Abstract
Hematoma expansion (HE) is an important risk factor for death or poor prognosis in patients with hypertensive intracerebral hemorrhage (HICH). Accurately predicting the risk of HE in patients with HICH is of great clinical significance for timely intervention and improving patient prognosis. Many imaging signs reported in literatures showed the important clinical value for predicting HE. In recent years, the development of radiomics and artificial intelligence has provided new methods for HE prediction with high accuracy. Therefore, this article reviews the latest research progress in CT imaging, radiomics, and artificial intelligence of HE, in order to help identify high-risk patients for HE in clinical practice.
Introduction
Intracerebral hemorrhage (ICH) is the second most common type of stroke, accounting for 10–20% of all strokes, and is associated with high morbidity and mortality (Schrag & Kirshner, 2020; Sheth, 2022; Vandertop, Can & Post, 2023). Hypertensive intracerebral hemorrhage (HICH) is the most common type of ICH, accounting for about 50–70%. With the aggravation of the population aging, the incidence of HICH is increasing year by year (Anand et al., 2023; Hostettler, Seiffge & Werring, 2019). Hematoma expansion (HE) is considered to be the mortality or poor prognostic factors after ICH, and its incidence is about 13–38% (Chu et al., 2023; Li et al., 2020). According to reports in the literature, for each 1 ml increase in hematoma after ICH, which was associated with a 5% increase in the hazard of death or dependency (95% confidence interval [CI], [2∼9%]). Conversely, any intervention that reduces hematoma growth by 2 to 4 ml is equivalent to a 10% to 20% reduction in the risk of death or dependency within 90 days (Chu et al., 2022; Delcourt et al., 2012). In clinical practice, accurately predicting the risk of HE is helpful for early targeted treatment or surgery (Al-Shahi Salman et al., 2018), which can prevent adverse events, reduce patient mortality and disability rates, and have important clinical significance (Limin et al., 2022).
How to predict HE early, accurately, and noninvasively has become a hotspot and challenging issue in current clinical research (Hu et al., 2021; Puy et al., 2023). Computer tomography (CT) is the preferred examination method for the diagnosis and follow-up of acute HICH (Nehme et al., 2022), including CT plain scan and computer tomography angiography (CTA) (Rindler et al., 2020). It has important value in the diagnosis, localization, and hematoma quantification of HICH (Romero & Rojas-Serrano, 2023). In the past, many studies and clinical practice had proved that some CT imaging signs are independent predictors of HE, such as “blend sign”, “black hole sign”, “island sign” and “swirl sign” (Al-Ajlan et al., 2023; Huang et al., 2023b). However, the above signs are not common in clinical practice. Moreover, relying solely on CT signs to predict hematoma enlargement has the drawbacks of strong subjectivity, high dependence on the diagnostic level of doctors, and poor consistency. Therefore, further research is needed on how to more effectively utilize CT images to accurately assess HE risk.
In recent years, radiomics and artificial intelligence have also shown strong application prospects in the integration of imaging, genetic, clinical, and other information to assist diagnosis, analysis, and prediction (Chen et al., 2023, 2022). The combination of artificial intelligence and medicine has had a profound impact on the medical system and greatly expanded the value of medical imaging in clinical practice (Wang et al., 2021). At present, it has been widely used in the diagnosis and prognosis evaluation of mild cognitive impairment, Alzheimer’s disease, Parkinson’s disease, lung cancer, liver cancer, breast cancer and other diseases (Feng et al., 2021; Feng & Li, 2023; Georgiadou et al., 2023). With the rise of radiomics and artificial intelligence, significant progress has been made in predicting HE (Zhao et al., 2022).
The rationale of our work is based on a detailed investigation of methods for predicting intracranial hematoma enlargement using CT images. We have discovered that many previous studies on this topic may not have captured the information we obtained from various authoritative academic data sources. Previous efforts to expand recognition of intracranial hematoma based on CT images have been limited to a small number of academic sources. Some early studies failed to adequately emphasize the advantages and disadvantages of different methods for predicting intracranial hematoma enlargement using CT images. The innovation in our work lies in identifying targets for predicting intracranial hematoma enlargement based on CT images, utilizing data from multiple reputable academic sources. Additionally, we highlight important strategies along with their respective advantages and disadvantages in predicting intracranial hematoma enlargement. Therefore, this article reviews the latest research progress in predicting HE based on CT imaging, radiomics, and artificial intelligence, in order to assist in early clinical identification of high-risk HE patients.
Survey methodology
This study strictly adhered to the norms of a systematic literature review and carefully designed research methods to ensure the integrity and rigor of the investigation. Specifically, we proceeded with our planned data collection and conducted a thorough review of the data.
In the first phase of data collection, we conducted a comprehensive search of Pubmed, Springer, Science Direct, and Web of Science to find academic articles relevant to our study’s prediction of intracranial hematoma enlargement. The initial search aimed to cover a wide range of literature on the subject. After an extensive search, we adopted a more targeted approach. Specifically, we have conducted an exhaustive study of literature that is widely cited and directly related to our research topic. We have applied rigorous methodologies and outstanding features to ensure a thorough, comprehensive review. By combining practical insights from academic research, our aim is to explore and present the complex issues involved in predicting the expansion of hematoma in the brain from multiple perspectives. It is hoped that this work can provide a scientific basis for formulating treatment plans early on and make a positive contribution to improving patients’ quality of life.
This study was approved by the ethics committees of Chongqing University Central Hospital (Chongqing Emergency Medical Center). Due to the retrospective nature of this study, the ethics committees waived the need for individual consent.
The ct plain scan imaging signs in prediction of he
Irregular hematoma shape and heterogeneous hematoma density
In 2009, Barras et al. (2009) reported that irregular shape and heterogeneous density of hematoma were independent risk factors for HE, and formulated a five-point categorical scale (Fig. 1). The hematoma shape score: 1 score represented that the hematoma had a regular shape, no lobes or satellite lesions, 2 scores indicated that the hematoma had a lobe or satellite lesion, and so on. The highest score was five points, and the higher the score, the greater the possibility of HE occurrence. The 1–2 points were defined as regular shapes of hematoma, and the 3–5 points were defined as irregular shapes of hematoma. The hematoma density score: 1 score indicated uniform density or one low-density area of the hematoma, 2 scores represented two low-density areas in the hematoma, and so on. The highest score was five points, and the higher the score, the greater the risk of HE. The 1–2 points were defined as homogeneous hematoma density, and the 3–5 points were defined as heterogeneous hematoma density. Yu et al. (2017) reported in the meta-analysis that the sensitivity and specificity of irregular hematoma shapes in predicting HE were 67% and 47%, respectively. And the sensitivity and specificity of hematoma density heterogeneity in predicting HE were 52% and 69%, respectively. The irregular shape and heterogeneous density of the hematoma indirectly reflect the existence of perihematoma injury and active bleeding in the hematoma (Liu et al., 2022). However, the sensitivity and specificity are low in the prediction of HE, which is not conducive to clinical promotion.
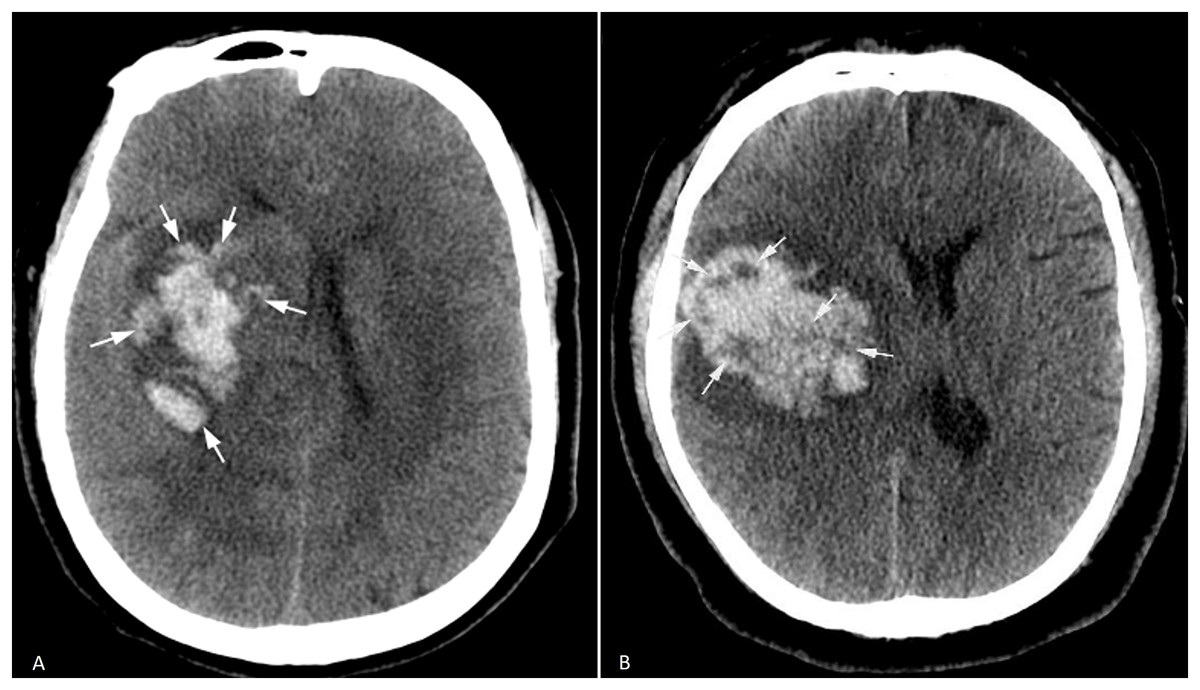
Figure 1 : Irregular hematoma shape and heterogeneous hematoma density.
A 71-year-old male patient was admitted to the hospital with a sudden weakness in his left limb that lasted for 1 h, and he had previously experienced a maximum blood pressure of 190/100 mmHg. (A) Irregular hematoma shape; (B) Heterogeneous hematoma density.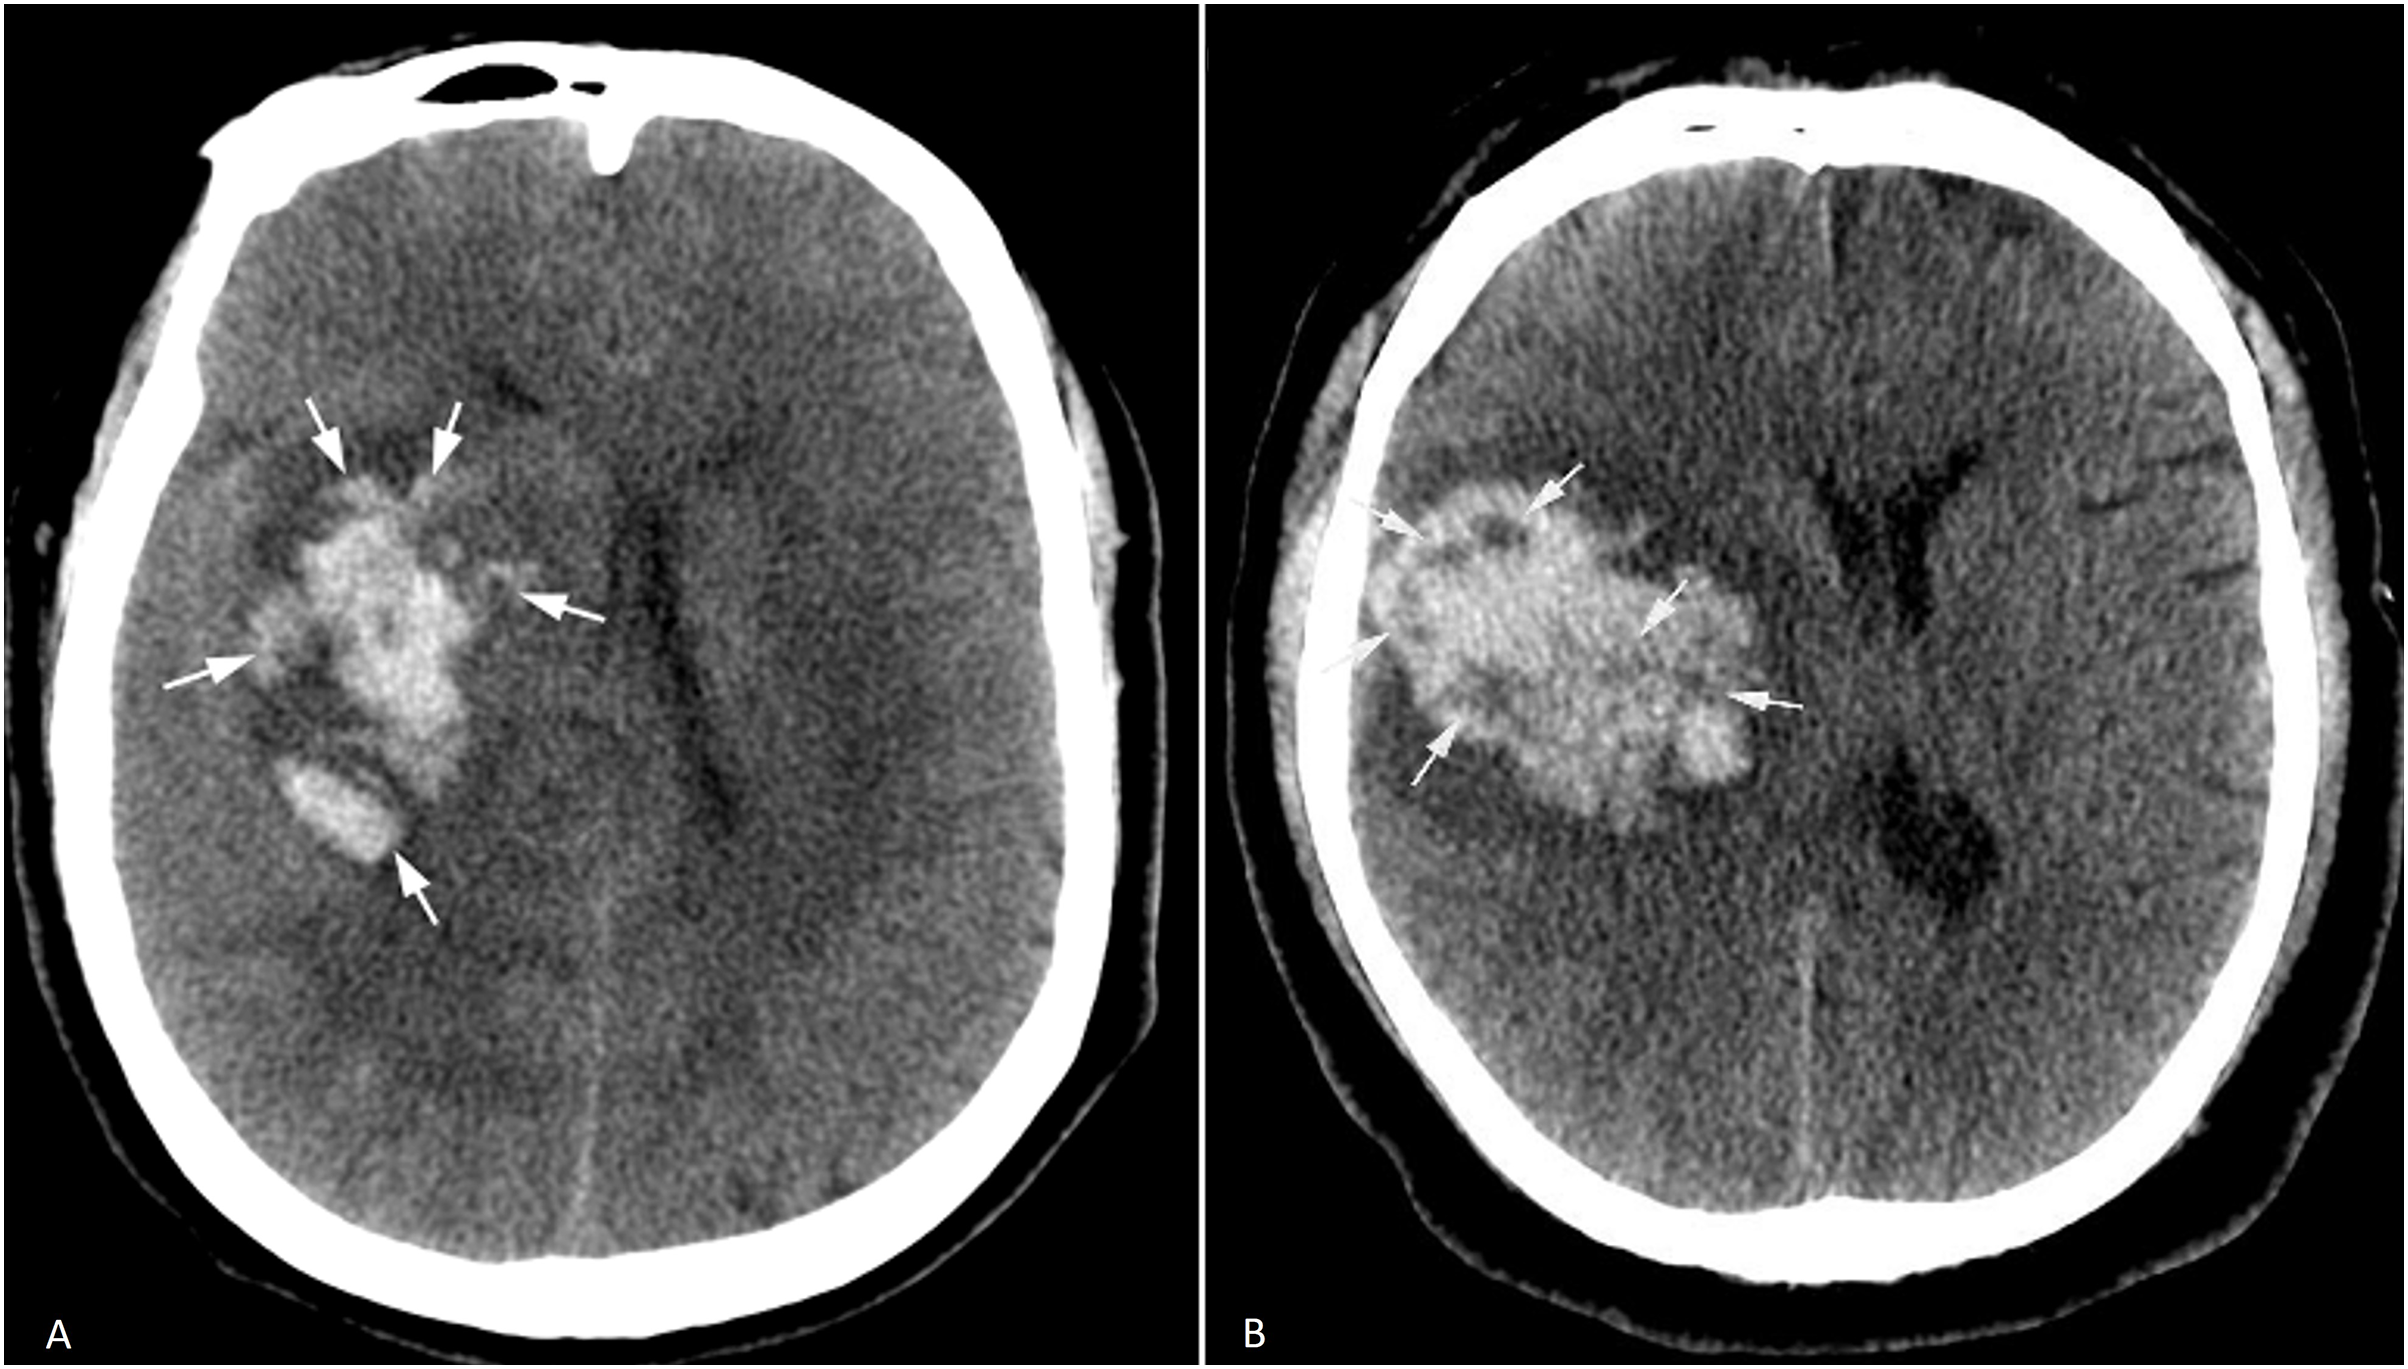
Hypodensities
In 2016, Boulouis et al. (2016b) proposed that the hypodensity sign predicted HE, which was defined as the existence of relatively low-density areas in the hematoma that were not connected with the surrounding brain parenchyma (Fig. 2). Vedartham et al. (2021) found that the detection rate of the hypodensity sign was related to the time of onset. The CT detection rate of patients within 3 h after symptom onset (about 71%) was higher than that after 3 h (about 29%), and the detection rate declined with the extension time. Boulouis et al. (2016a) reported that the incidence of hypodensities with the hematoma was 31.2% overall, 52.8% in the HE group, and 21.9% in the non-HE group (HE group vs. non-HE group P < 0.001), and it was significantly correlated with HE (odds ratio, OR, 3.42 95%CI [2.21–5.31]), which could be used as an independent predictor of HE.
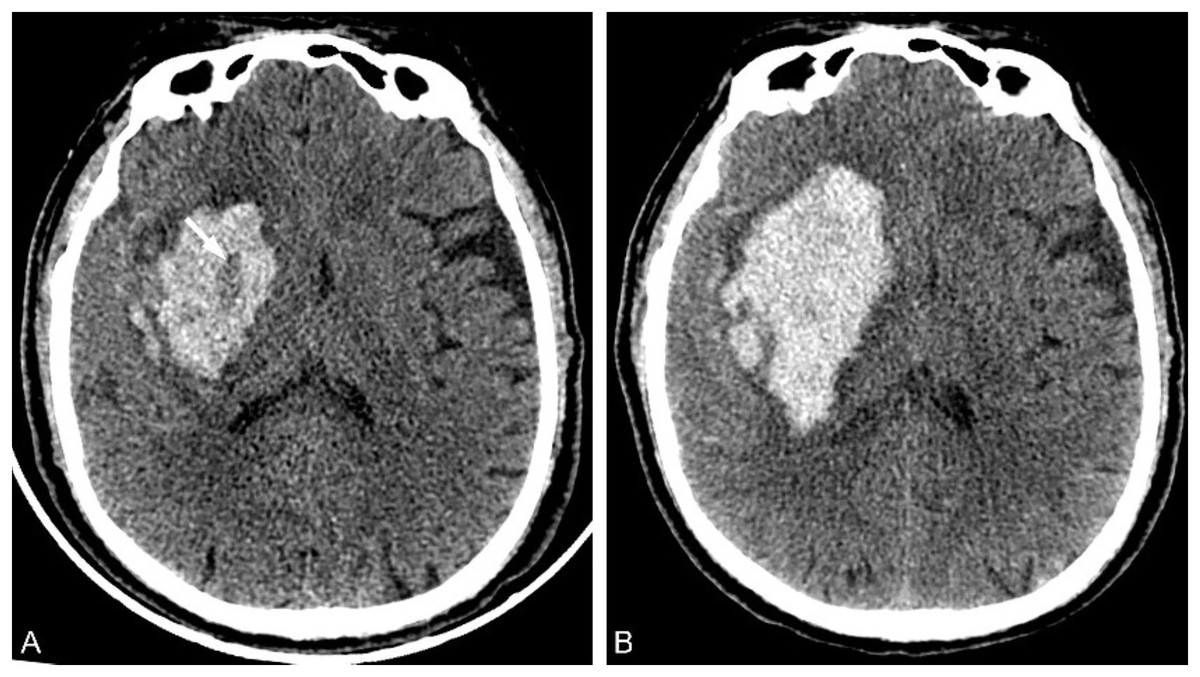
Figure 2: Hypodensity sign.
A 73-year-old man was admitted to the hospital with sudden dizziness and weakness in his left limb for 2 h. The patient had a history of hypertension for over 2 years, and his blood pressure upon admission was 183/101 mmHg. (A) He was admitted to the hospital 2 h after the onset of the disease for a CT examination. Clumps of high-density hematoma were found in the right basal ganglia, and low-density shadows were observed in the lesion that were not connected with the surrounding brain parenchyma (arrow). (B) The CT examination conducted 14 h after the onset of the disease revealed a significant increase in hematoma volume and its occupying effect.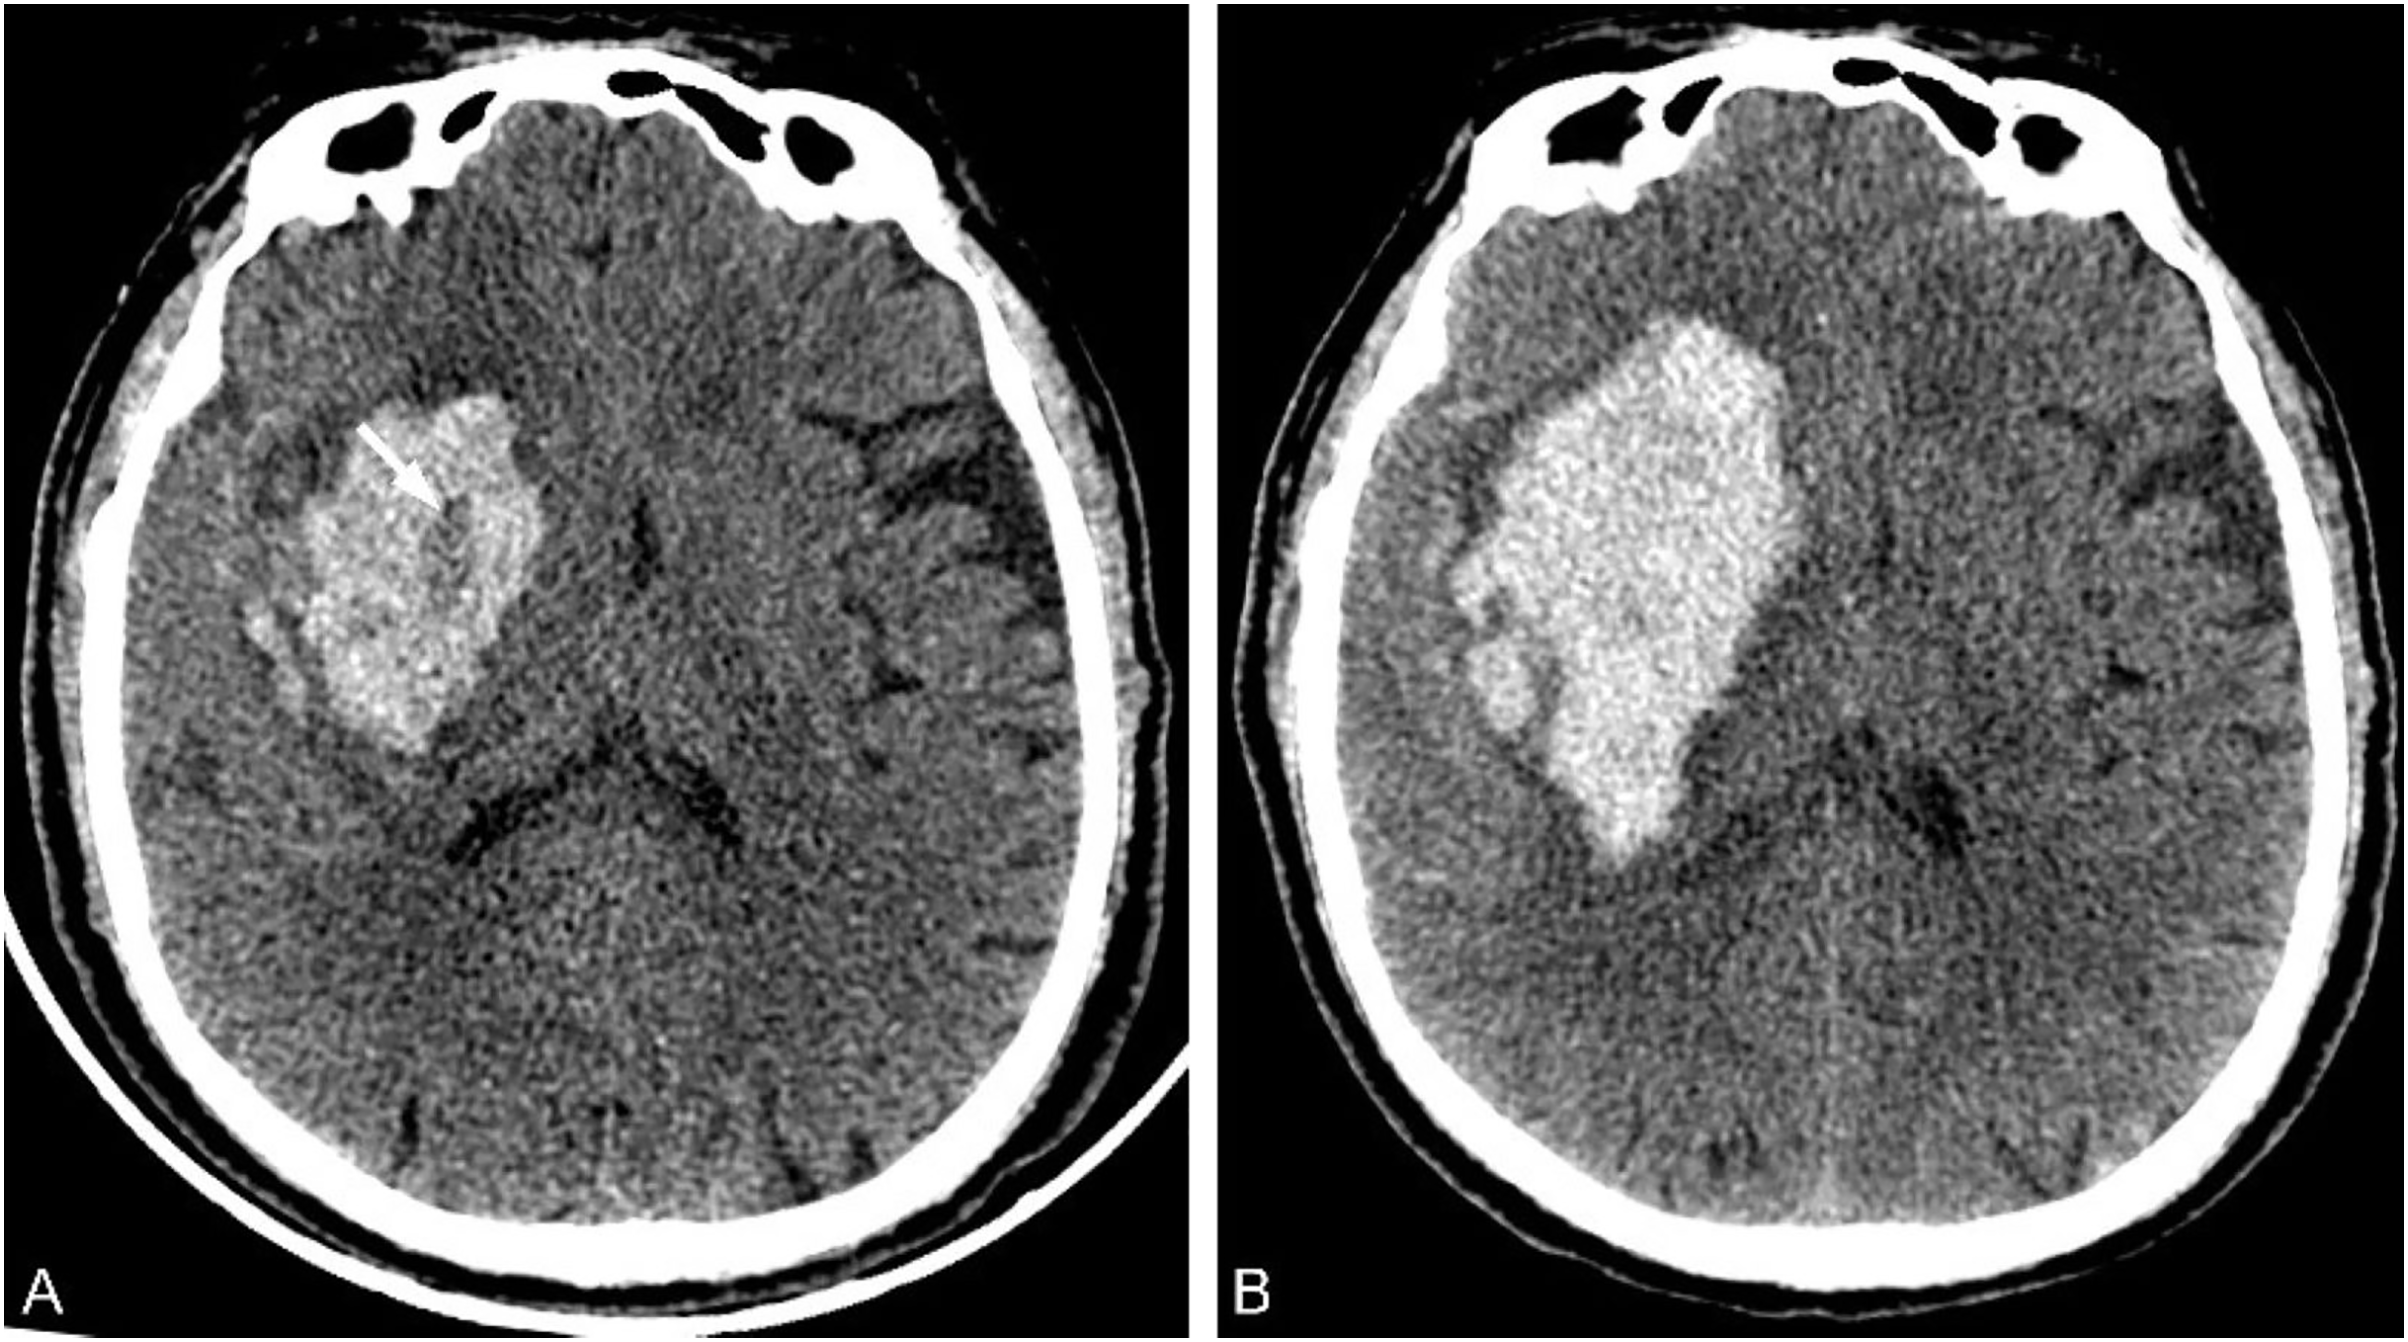
Blend sign
In 2015, Li et al. (2015) found that the blend sign could effectively predict HE (Fig. 3). The blend sign was characterized by hypoattenuating and hyperattenuating regions within the hematoma, with a well-defined margin, and the difference in CT value between the two density regions was ≥18HU. The incidence of the blend sign was 16.9%, with a sensitivity of 39.3% and a specificity of 95.5% for predicting HE. Zhang et al. (2020) compared the effectiveness of the blend sign and other CT plain scan signs in predicting HE and found that the blend sign was better than the black hole sign in predicting HE (AUC: 0.67 vs. 0.57; P < 0.001). This imaging marker could help identify patients at a high risk of hematoma expansion and aid in their early treatment (Li et al., 2021; Schreiber et al., 2023).
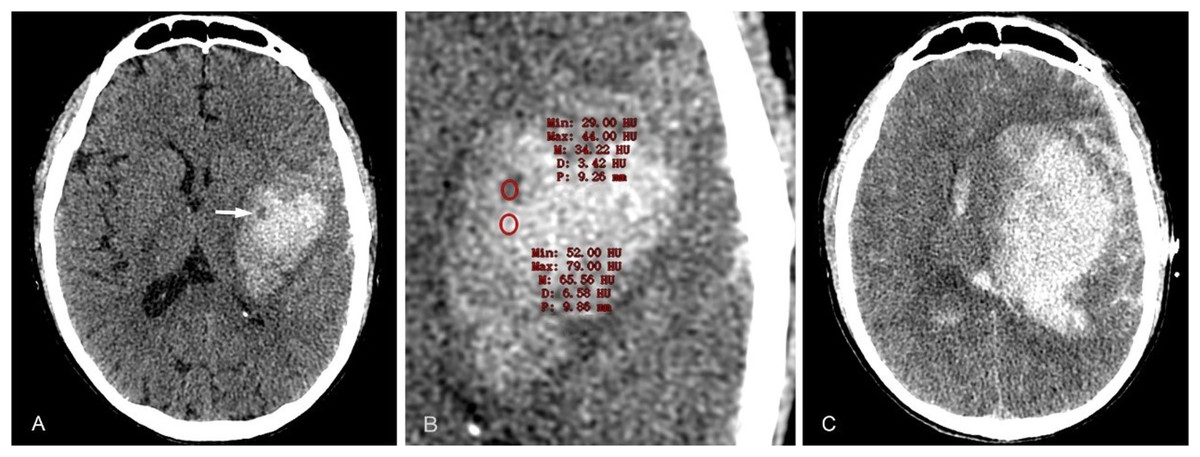
Figure 3: Black hole sign.
A 50-year-old male patient was admitted to the hospital with a sudden headache, dizziness, and weakness in his right limb for 2 h. His blood pressure was 141/82 mmHg. (A) CT examination conducted 2 h after the onset of the patient revealed a high-density hematoma shadow in the left basal ganglia, with a small round low-density shadow inside that was not connected to the surrounding cerebral parenchyma and had clear boundaries. (B) The CT value of the low-density area was approximately 32 Hounsfield units lower than that of the high-density hematoma in the periphery. (C) The CT examination conducted at 4.75 h after the onset of the disease revealed a significant increase in hematoma volume, an intensified occupying effect, and cerebral herniation accompanied by subarachnoid blood and ventricular system involvement.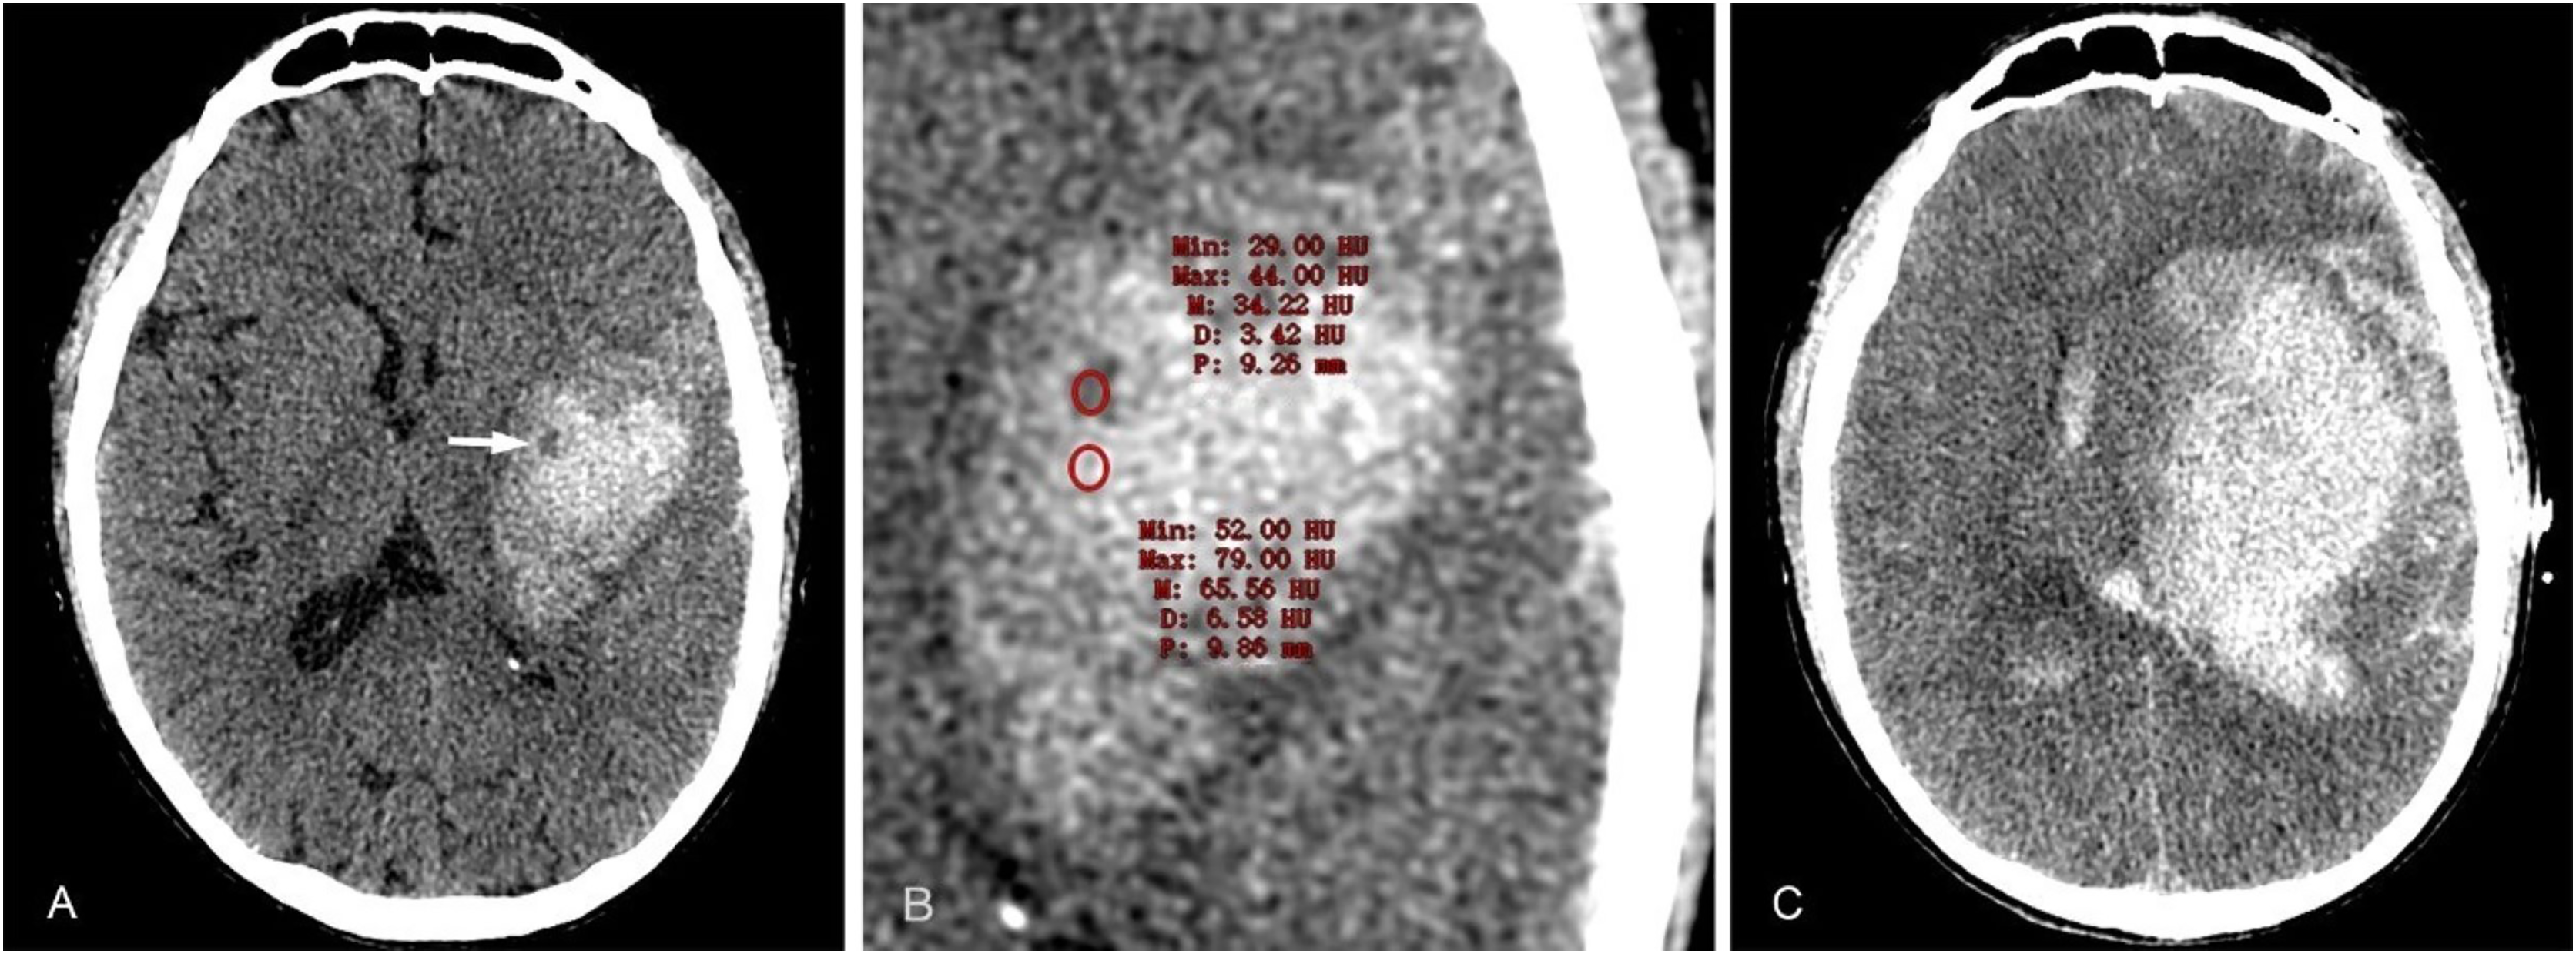
Black hole sign
Subsequently, Li et al. (2016) reported that the black hole sign predicted HE (Fig. 4). The black hole sign represents a well-defined hypodense region within a hyperdense hematoma that is not connected to the nearby brain parenchyma. It could be round, oval, or rodlike. Moreover, it was clearly separated from the hyperattenuating region of the hematoma, and the CT value difference between the two was ≥28HU.The incidence of the black hole sign was 14.6%. The sensitivity and specificity of predicting HE were 31.9% and 73.2%, respectively. Chen et al. (2020) conducted a meta-analysis that showed the black hole sign predicts HE with a 30% sensitivity and 93% specificity, and the area under the cure (AUC) was 0.83. As an independent predictor of HE, although the black hole sign has a high specificity, its sensitivity is low, and its clinical application is limited (Shakya et al., 2021).
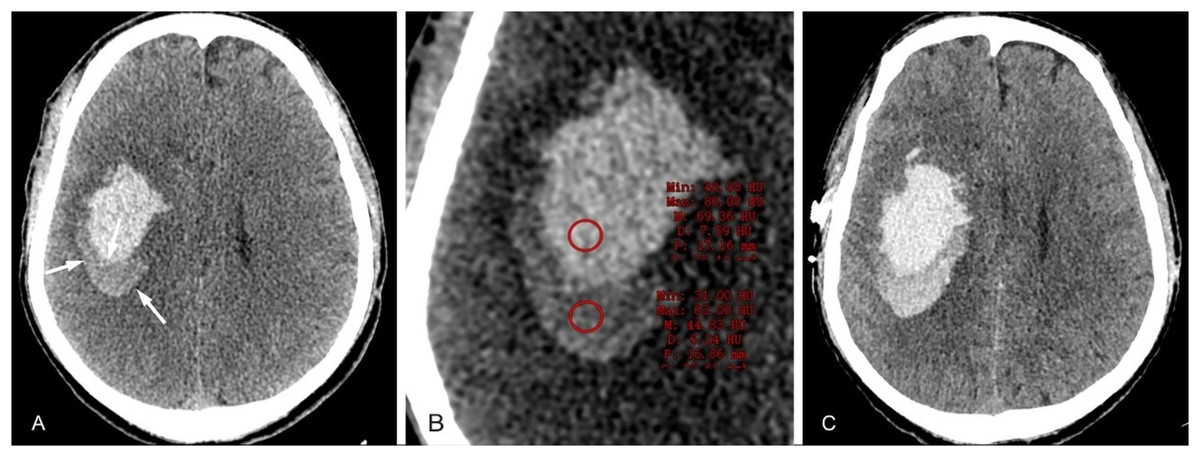
Figure 4: Blend sign.
A 55-year-old male patient was admitted to the hospital for 4 h due to sudden weakness in his left limb. The patient had a history of hypertension for many years and presented with a blood pressure of 181/100 mmHg upon admission. (A) A plain CT scan conducted 4.5 h after the onset of the patient revealed a high-density hematoma in the right hemioval center, with a clearly demarcated area of high density and an adjacent area of relatively low density. (B) CT examination 11 h after the onset of the disease showed that the hematoma volume increased.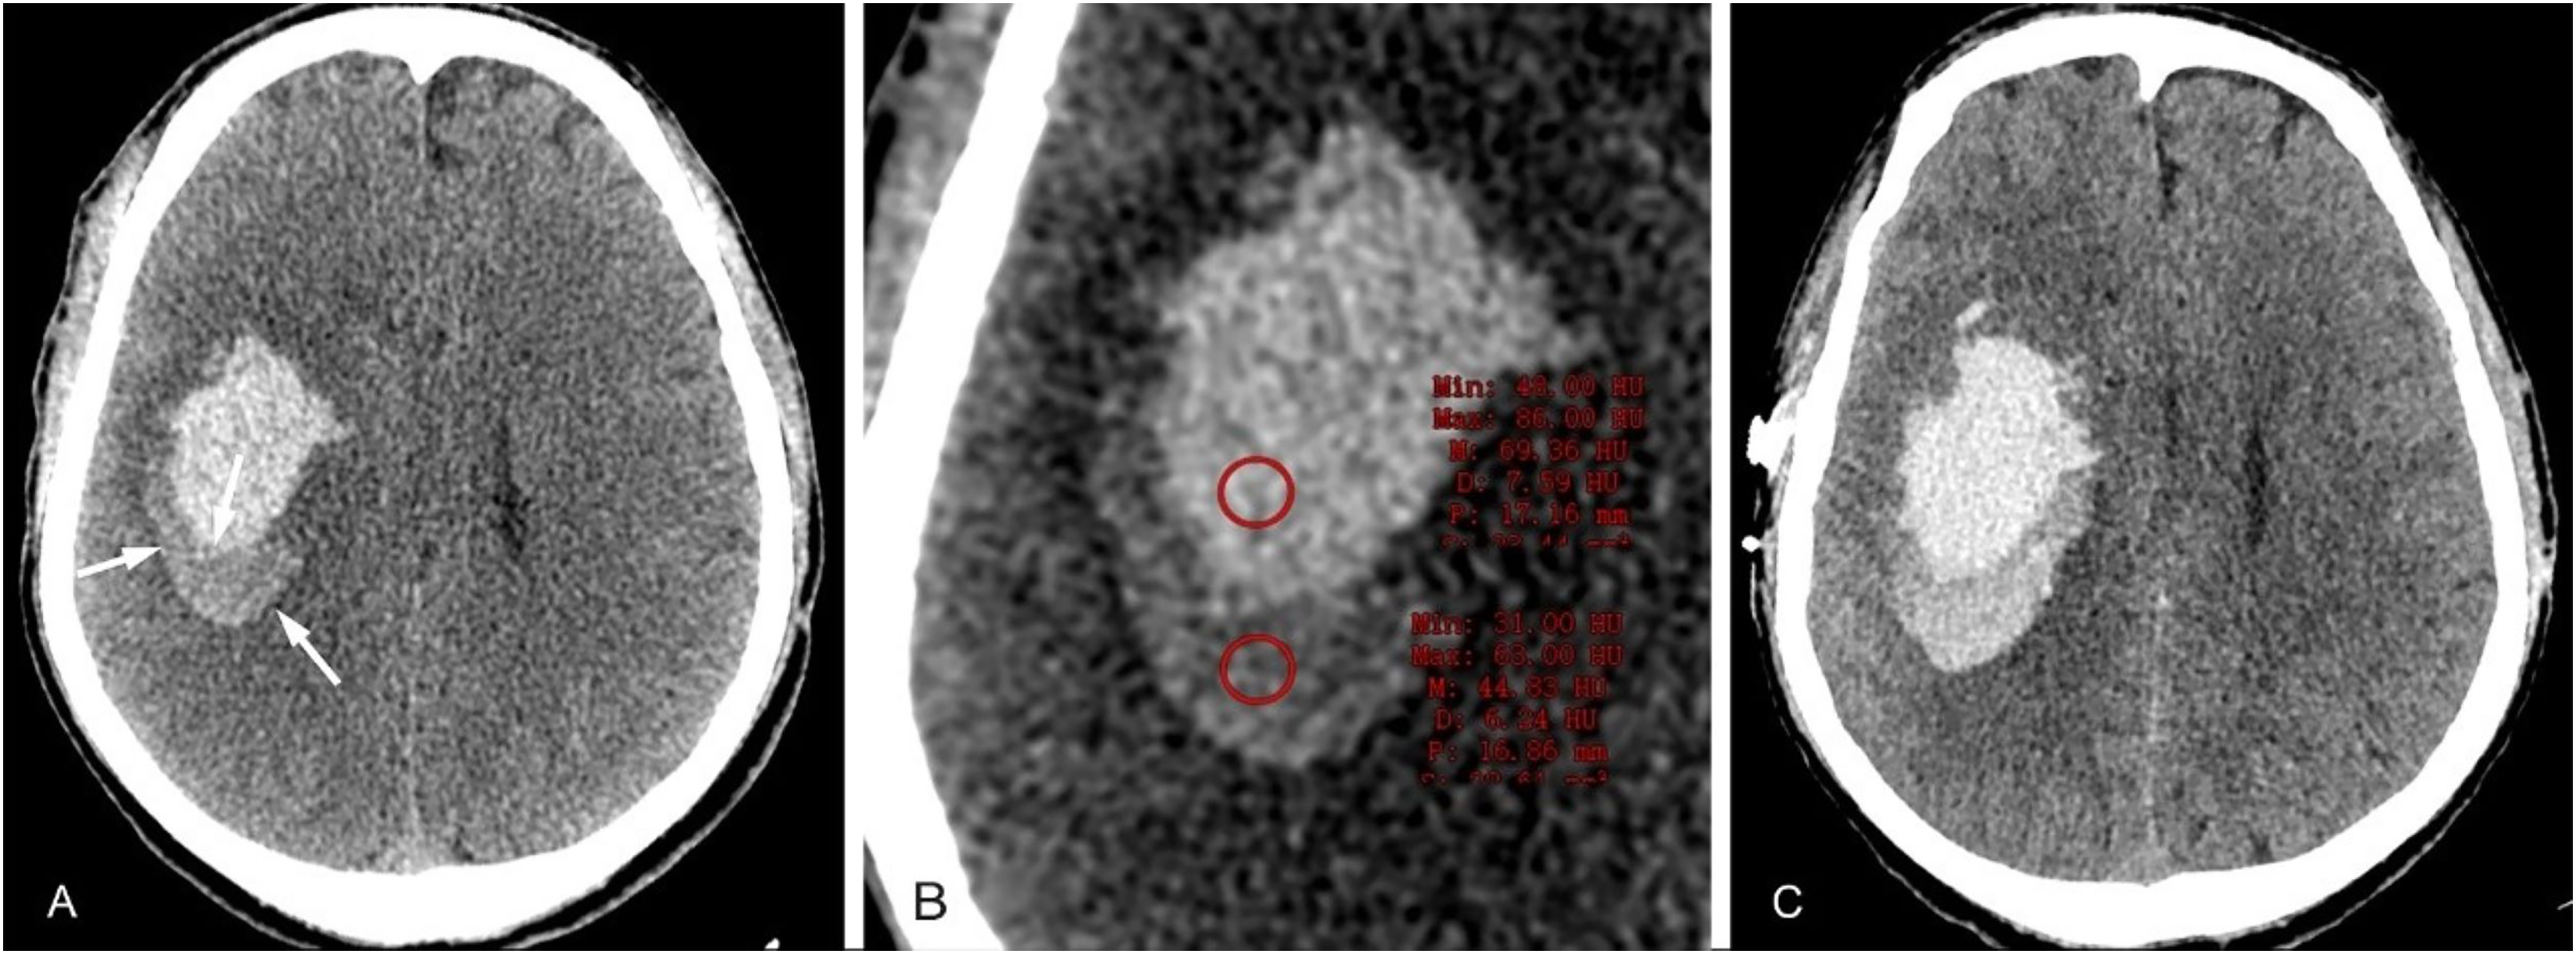
Swirl sign
The swirl sign denotes one or more hypodensity areas in the hyperdensity hematoma (Fig. 5), which morphology is variable, round, streaklike, and strip. And the hypodensity area can be continuous with the adjacent brain parenchyma (Ng et al., 2018; Park et al., 2019). Amoo et al. (2021) found in a meta-analysis study evaluating nine articles that the swirl predicts HE with 50% sensitivity and 77% specificity. Yu et al. (2019a) conducted a meta-analysis to assess the accuracy of swirling signs in predicting intracerebral hematoma enlargement. A total of 2,647 patients from six studies were included in the analysis. The results revealed that the sensitivity and specificity of swirling signs were 0.45 (95%CI [0.32–0.59]) and 0.79 (95%CI [0.73–0.84]), respectively, while the combined positive likelihood ratio was found to be 2.2 (95%CI [1.8–2.5]). Additionally, the combined negative likelihood ratio for the vortex sign was determined as 0.69 (95%CI [0.57∼0.84]). This study suggests that swirling signs exhibit high specificity in predicting hematoma enlargement among patients with cerebral hemorrhage.
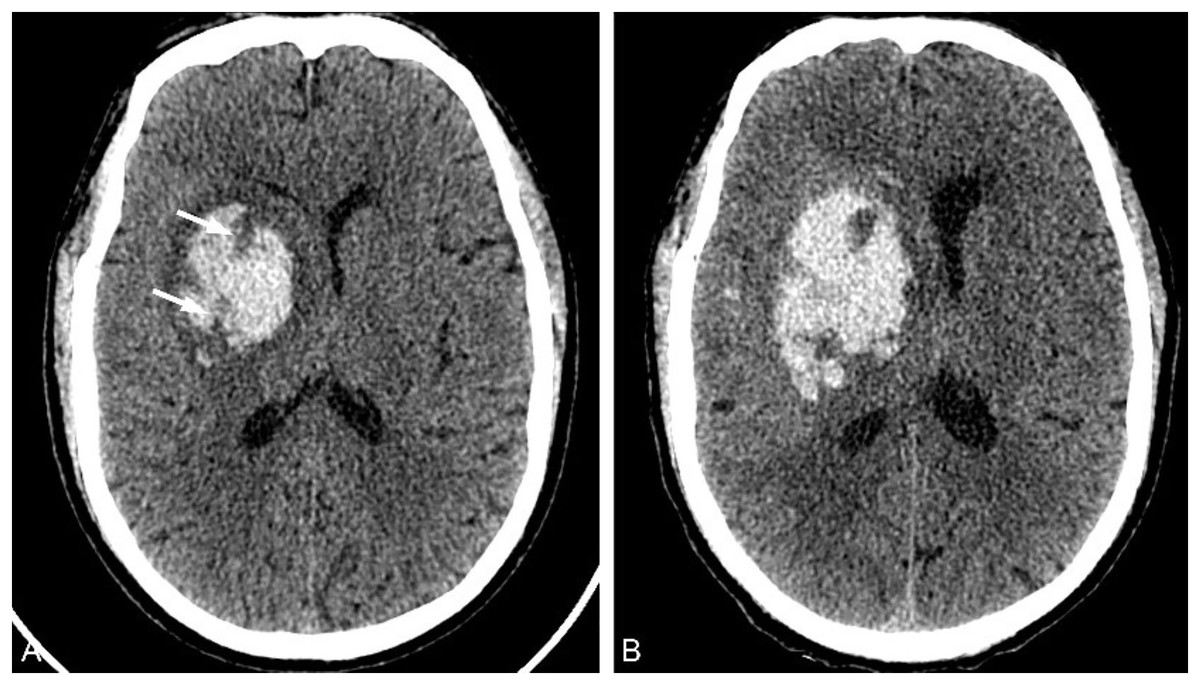
Figure 5: Swirl sign.
A 65-year-old male patient presented with sudden left limb weakness for over an hour upon admission and had a blood pressure reading of 248/112 mmHg. (A) A total of 1 h after the onset of the patient, a high-density hematoma shadow was observed in the right basal ganglia on CT examination. Inside, there was a low-density bar shadow known as the swirl sign (arrow). (B) The CT examination conducted at 7.5 h after the onset of the disease revealed an increase in hematoma volume and occupying effect.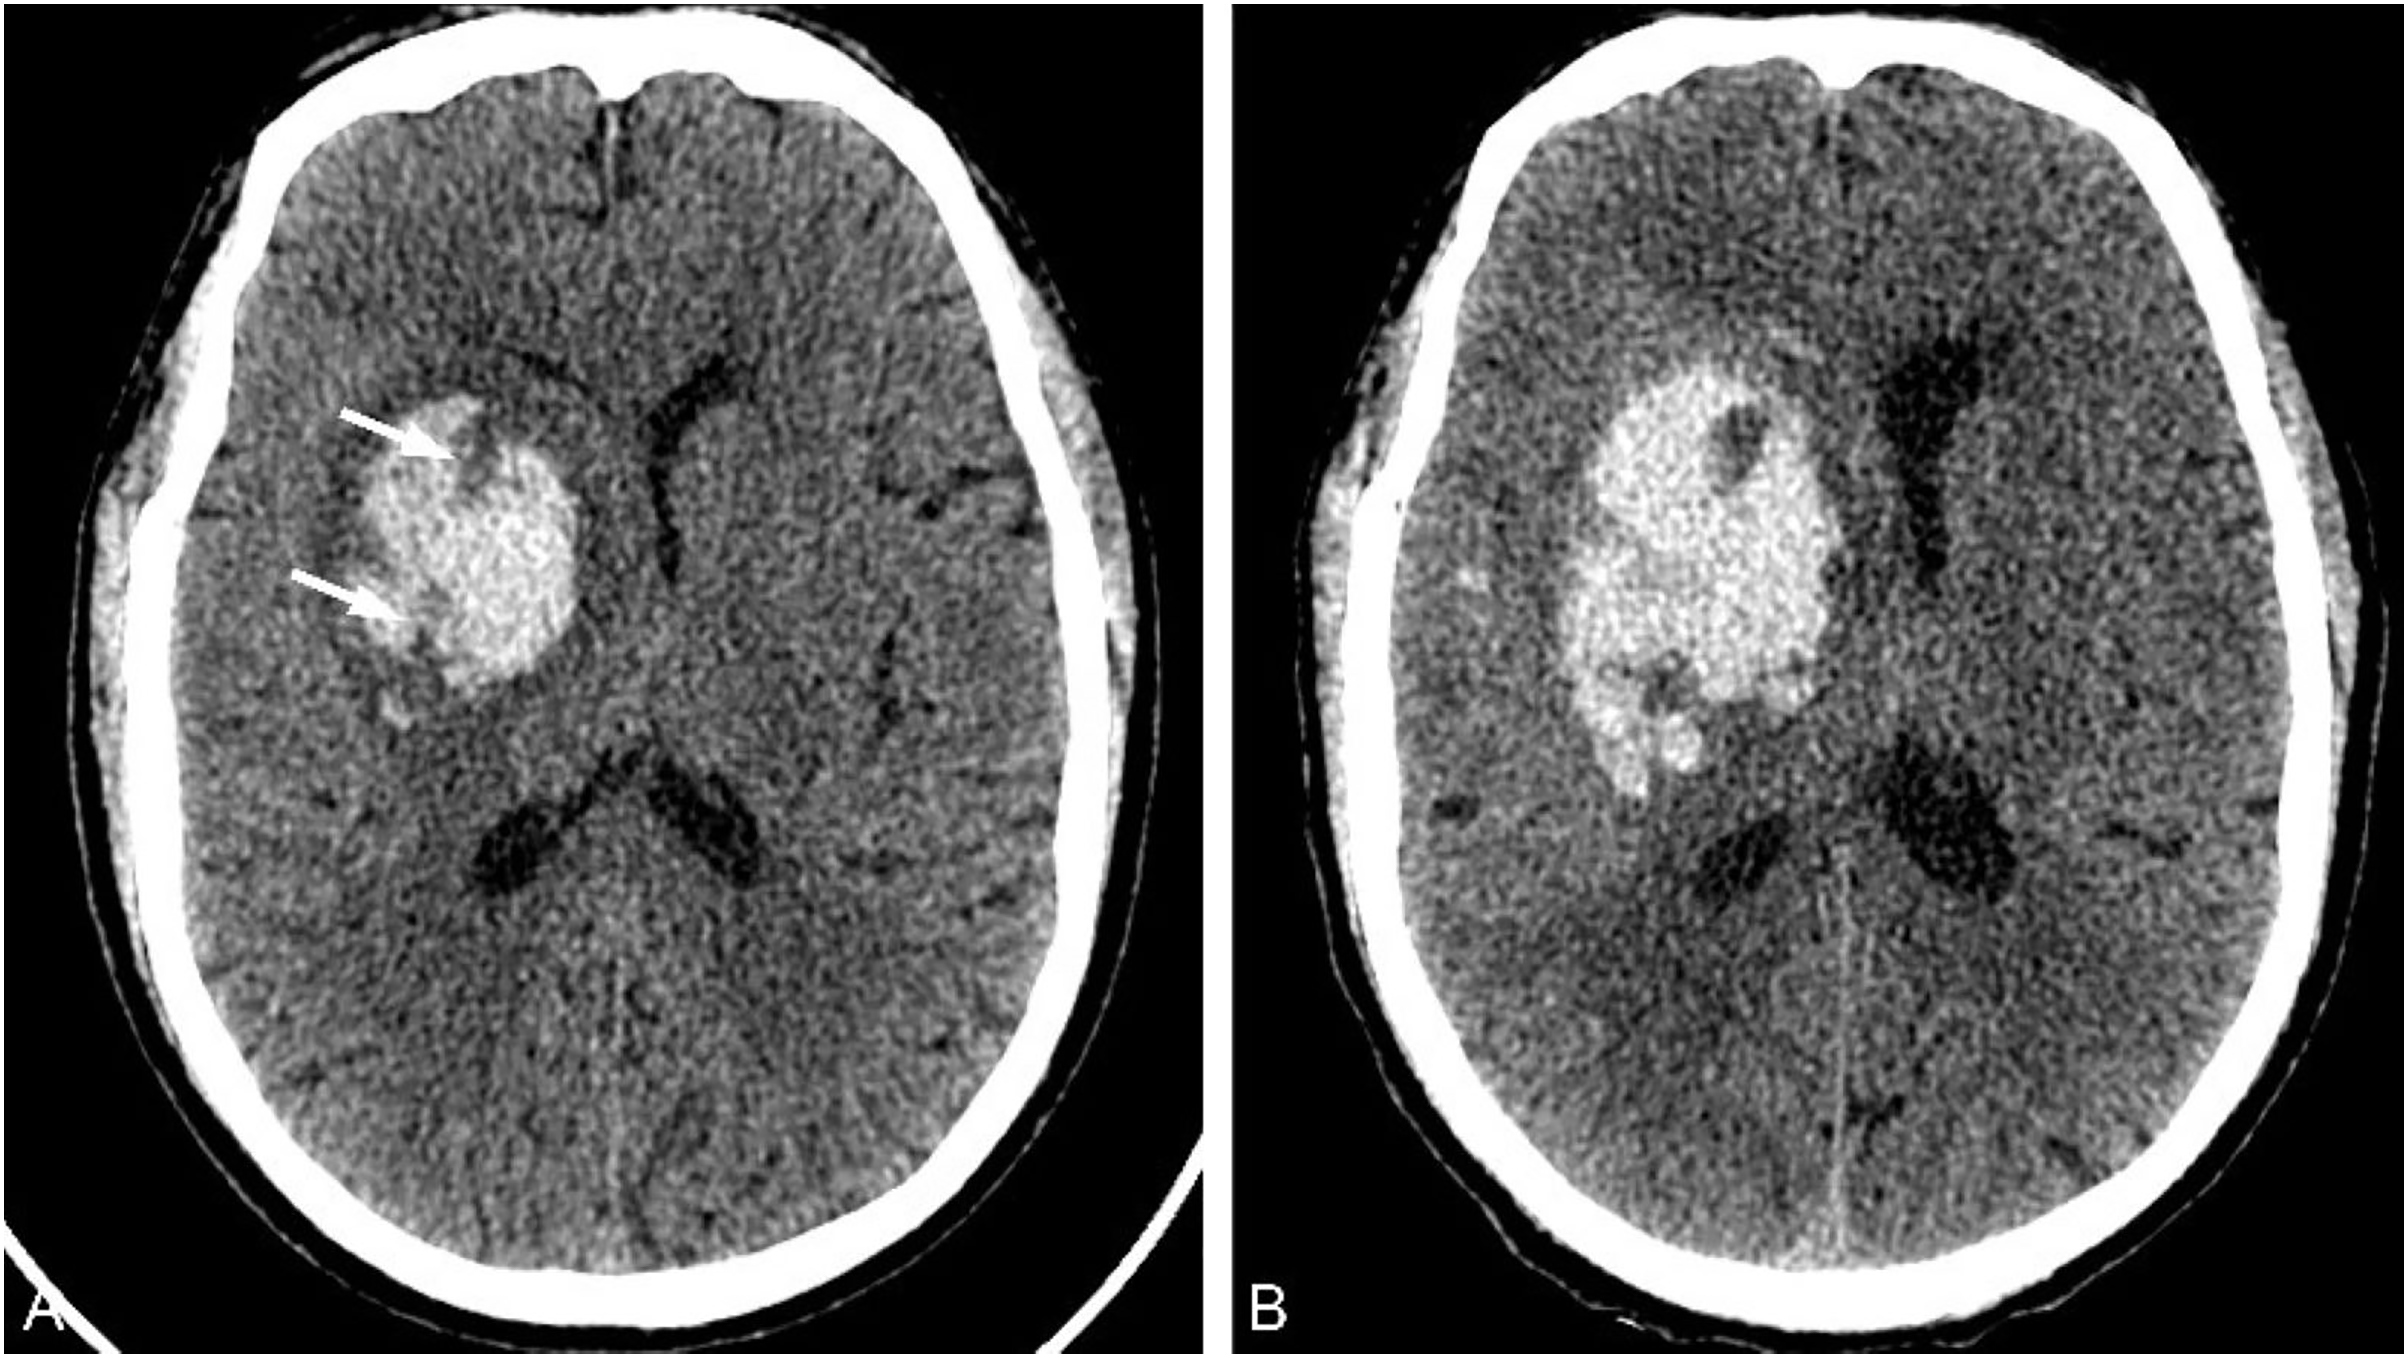
Island sign
In 2017, Li et al. (2017) discovered and proposed the island sign again (Fig. 6), which has been confirmed to be an important imaging marker of early HE and poor clinical prognosis. The island sign is defined as ≥3 small discrete hematomas that separated from the main hematom or ≥4 small hematomas, which may branch off from or be completely connected with the main hematoma, should be round, vesicular, or budlike but not lobulated. Zhou et al. (2021) conducted a meta-analysis study on island sign, which showed that the comprehensive sensitivity and specificity of island sign in predicting HE were 50% and 89%, respectively, and its AUC was 0.73. However, the occurrence of the island sign is low, about 21%, and its clinical use is limited (Wei et al., 2020).
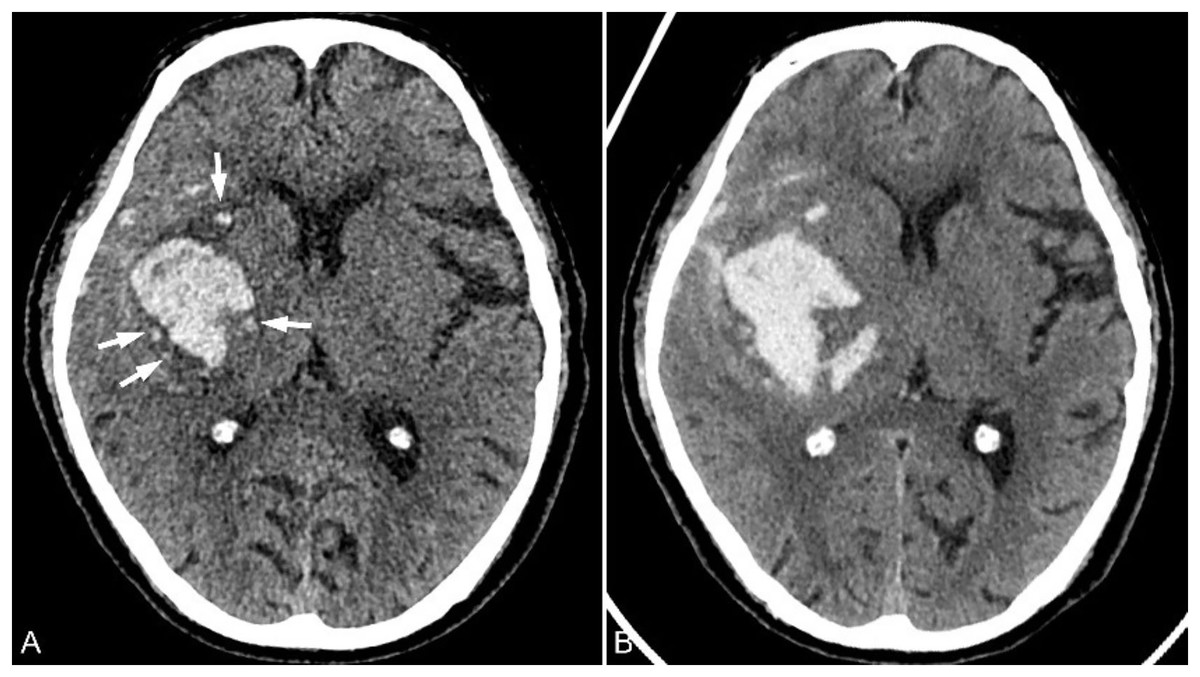
Figure 6: Island sign.
A 78-year-old male patient was admitted to the hospital due to left limb weakness and slurred speech that had lasted for over an hour. He had a history of hypertension for more than 10 years, and his blood pressure upon admission was 183/101 mmHg. (A) CT examination conducted 1 h after the onset of the patient revealed a hematoma in the right basal ganglia area, surrounded by four small hematoma shadows that were separated from the main hematoma (arrow). (B) The CT reexamination about 8.5 h after the onset of the patient showed that the volume of hematoma had increased and the occupying effect was slightly aggravated.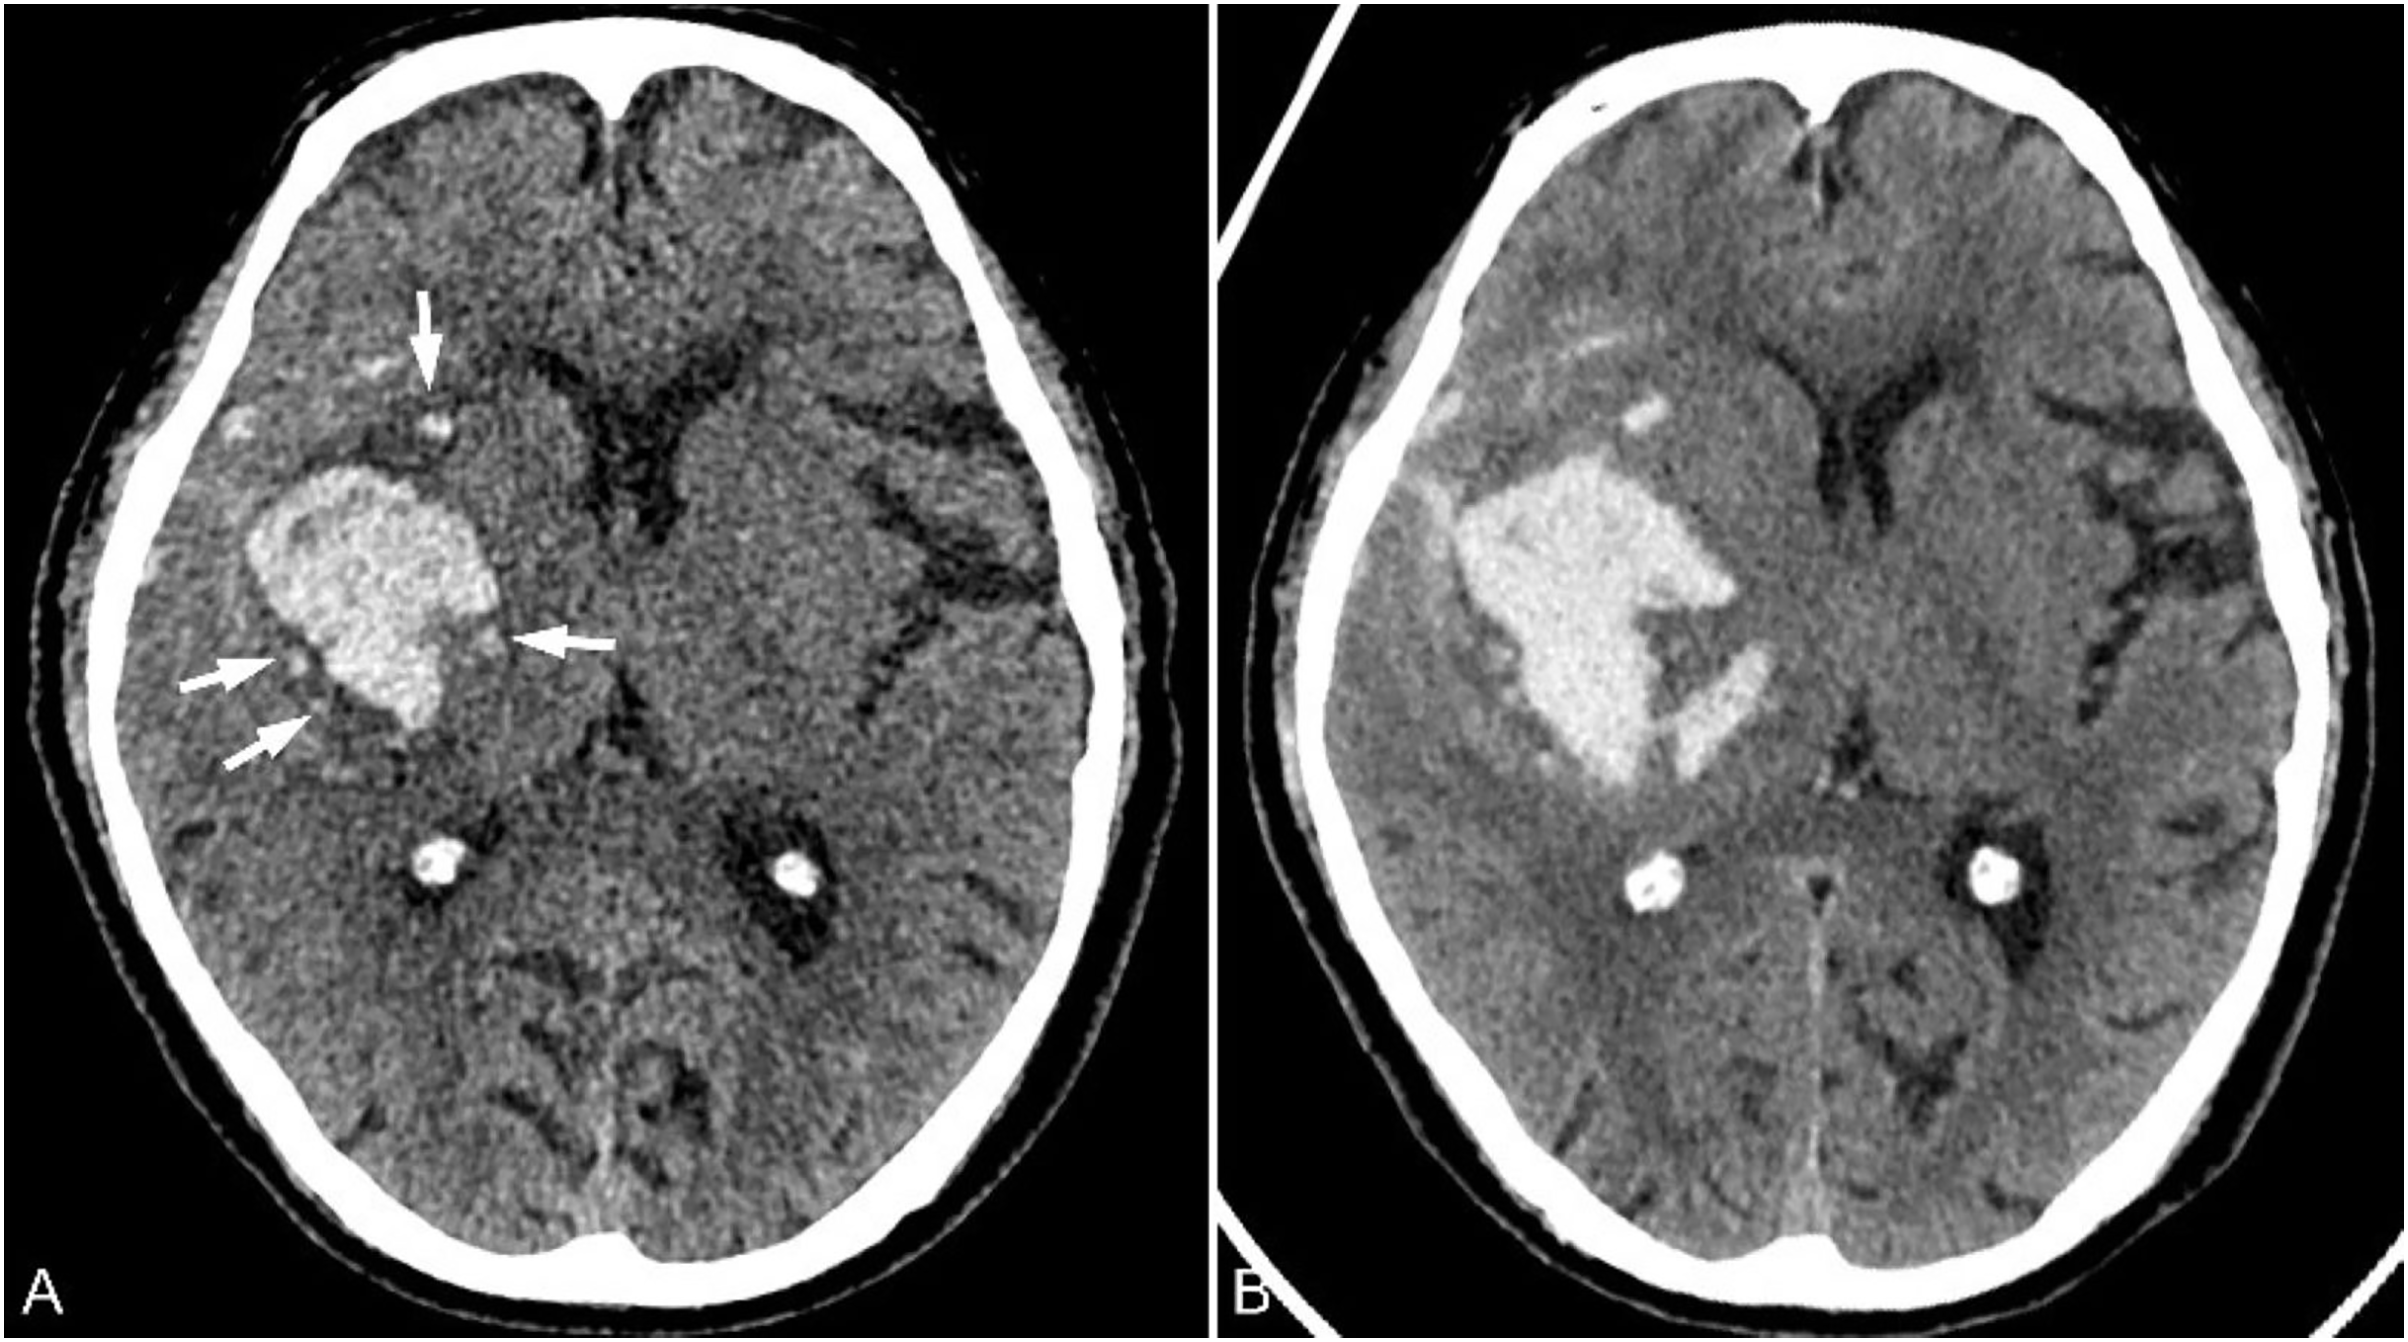
Satellite sign
The satellite sign is defined as a small hemorrhagic focus that surrounds the main hematoma (Fig. 7), no more than 1 cm in maximum diameter, 1 to 2 cm from the main hematoma, and not within the ventricles and subarachnoid space (Lv et al., 2021; Songsaeng et al., 2023). In a meta-analysis, the satellite sign has been shown to predict HE with a sensitivity of 50% and a specificity of 71% (Yang et al., 2020), which was an effective marker for predicting HE. The incidence of the satellite sign was 49.2%, which was significantly higher than that of the island sign. The incidence of HE with the positive satellite sign was 40.4%, and the incidence of HE with the positive island sign was 91.3%.
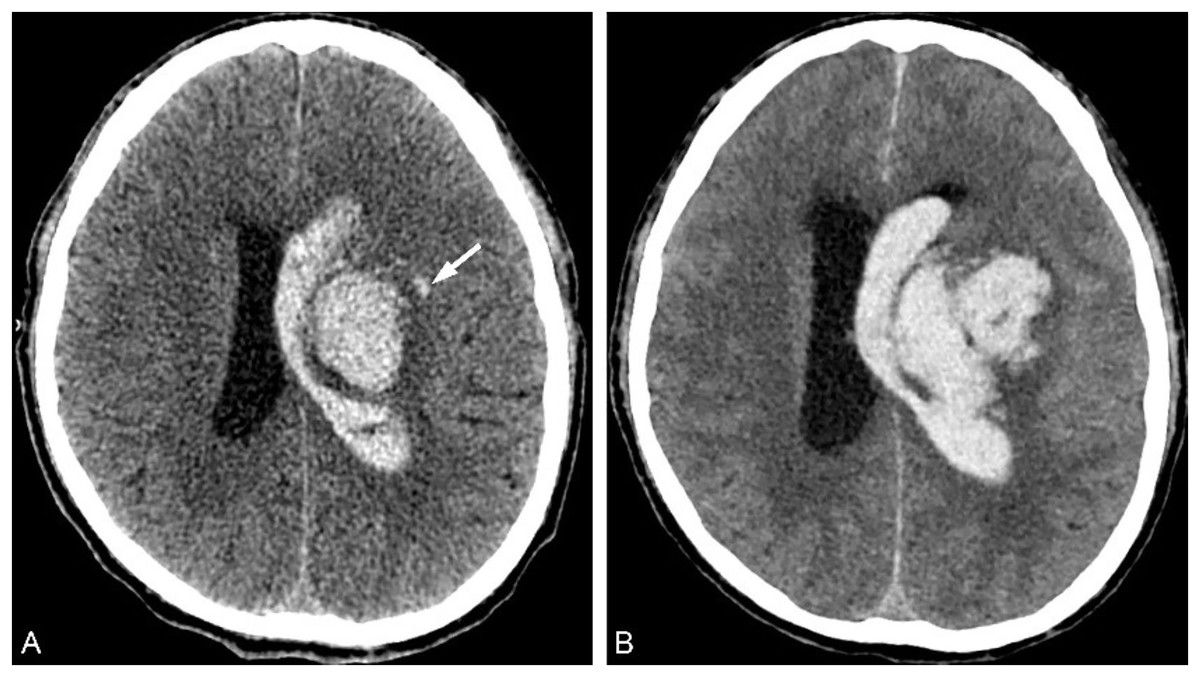
Figure 7: Satellite sign.
A 58-year-old male patient was admitted to the hospital with a sudden disturbance of consciousness and dysfunction in his right limb for 2 h. He had a history of hypertension for several years, and his blood pressure measured 186/116 mmHg. (A) The CT examination conducted 2 h after the onset of the patient revealed a high-density hematoma shadow near the left ventricle and a small hematoma surrounding the main hematoma. (B) CT examination conducted approximately 6 h after the onset of the disease revealed a significant increase in hematoma volume and occupying effect.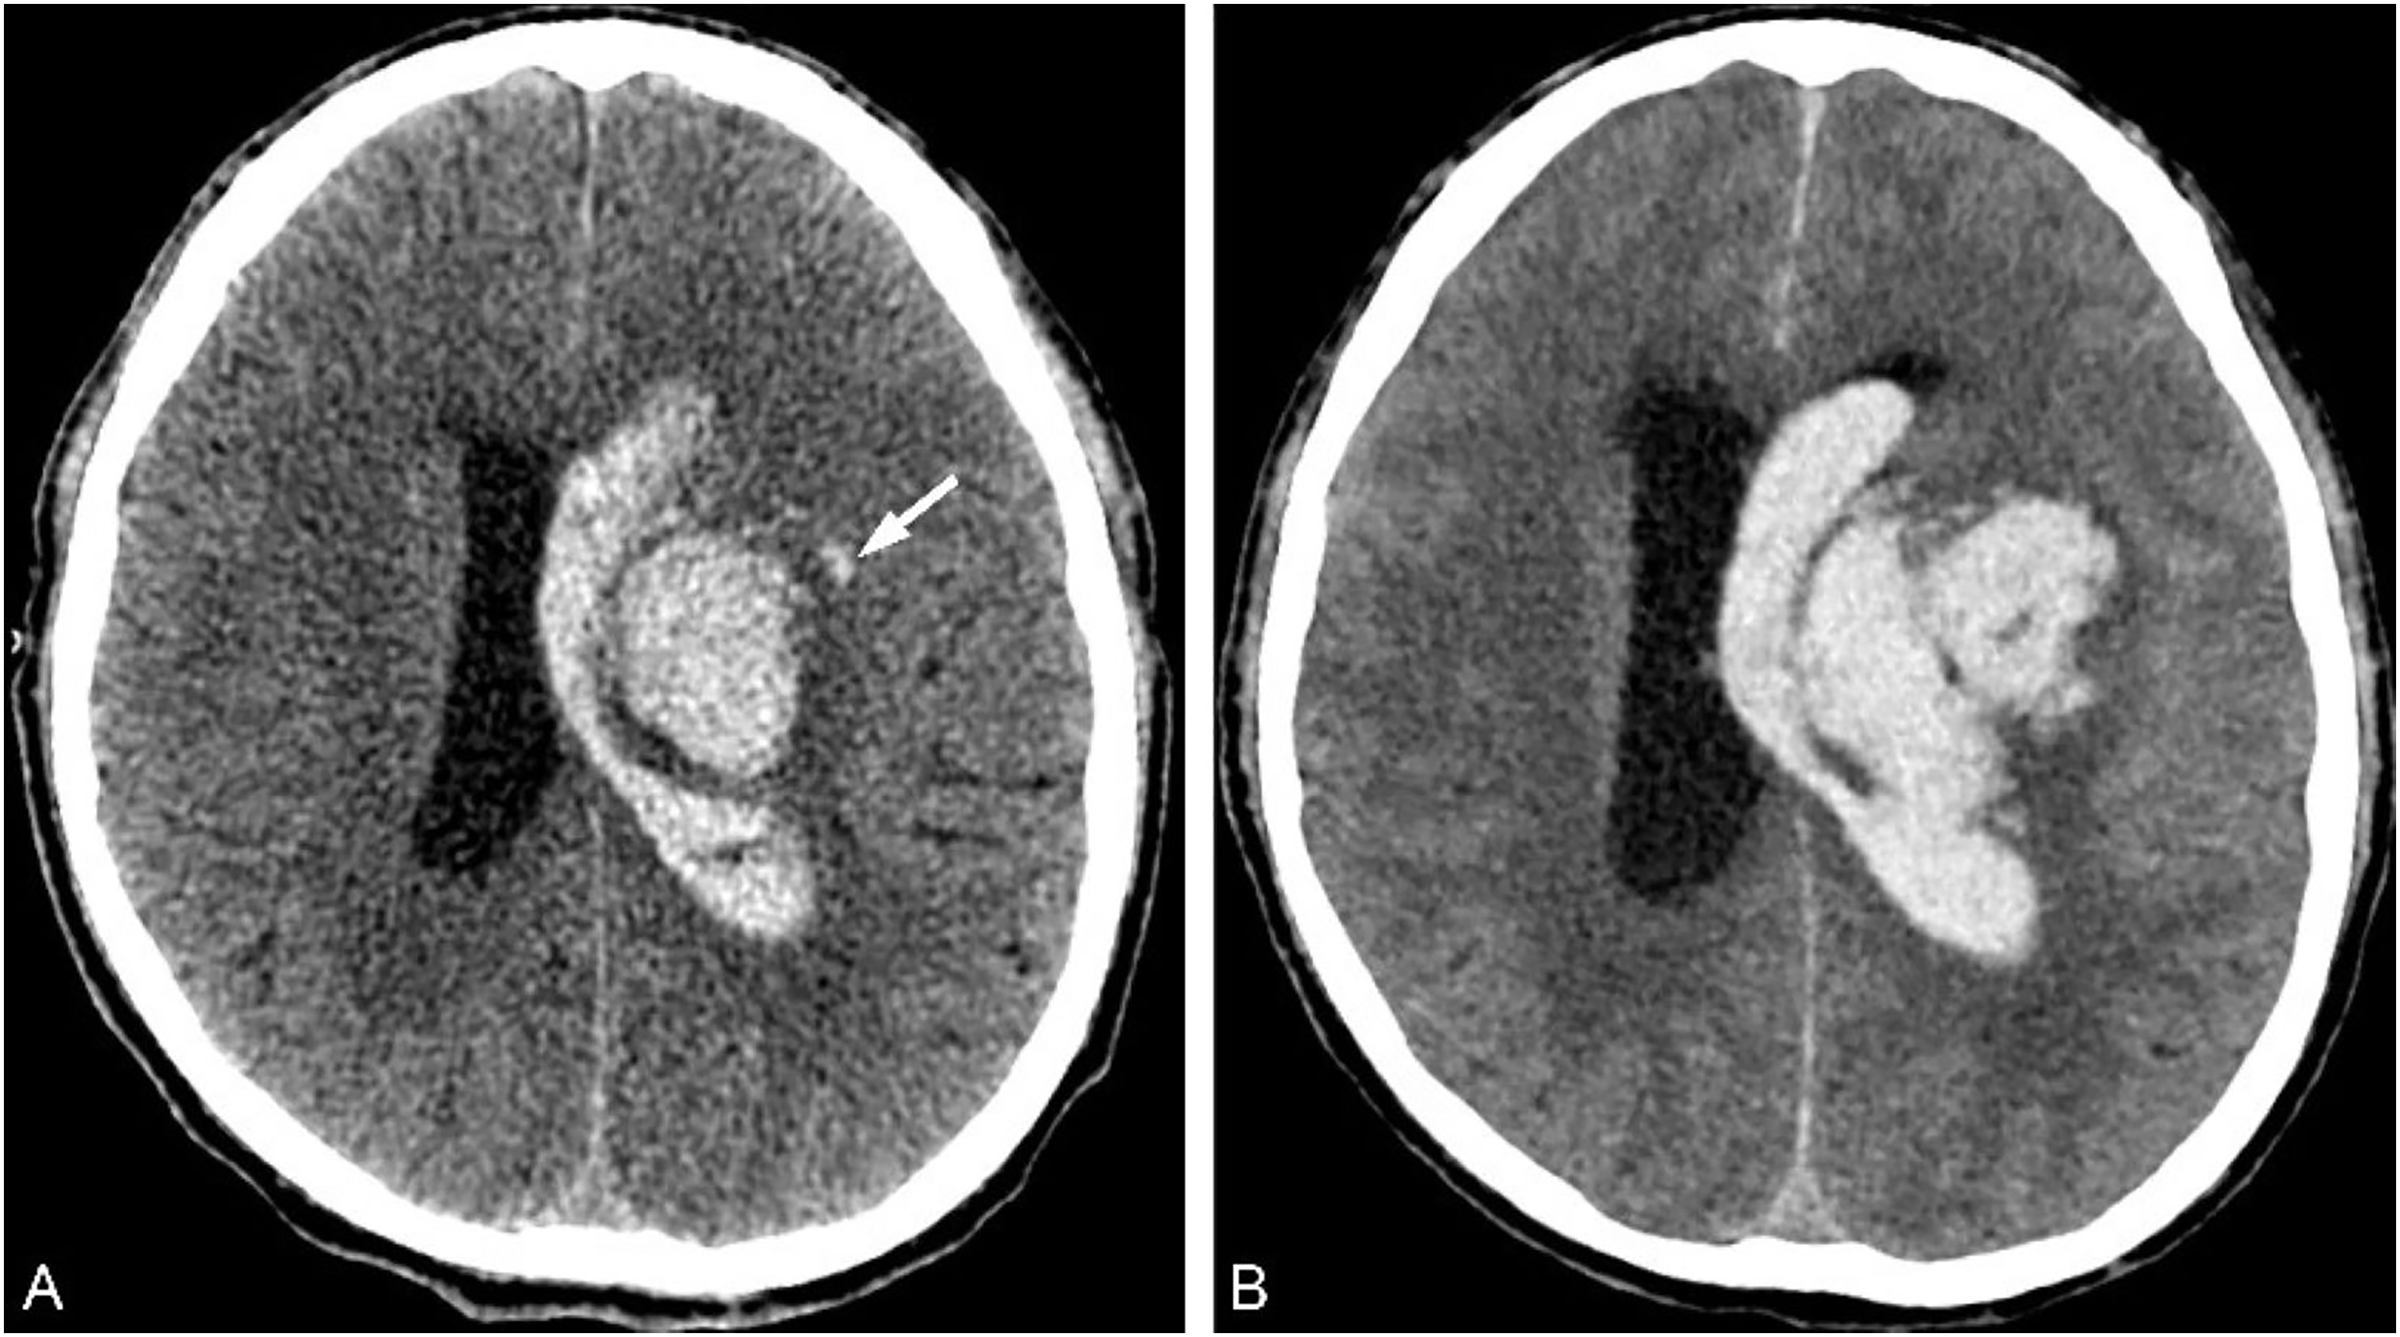
Fluid level sign
The fluid level is a stratified phenomenon in the cerebral parenchyma (Fig. 8), with areas of low CT attenuation above and high CT attenuation below a discrete line of separation in an area of intraparenchymal hemorrhage, which is rarely seen in ICH patients and lacks validation (Morotti et al., 2023). At present, there are few studies on this sign, and it is included in the scoring scale as a predictor in some HE prediction scales (Mendes Pedro et al., 2021).
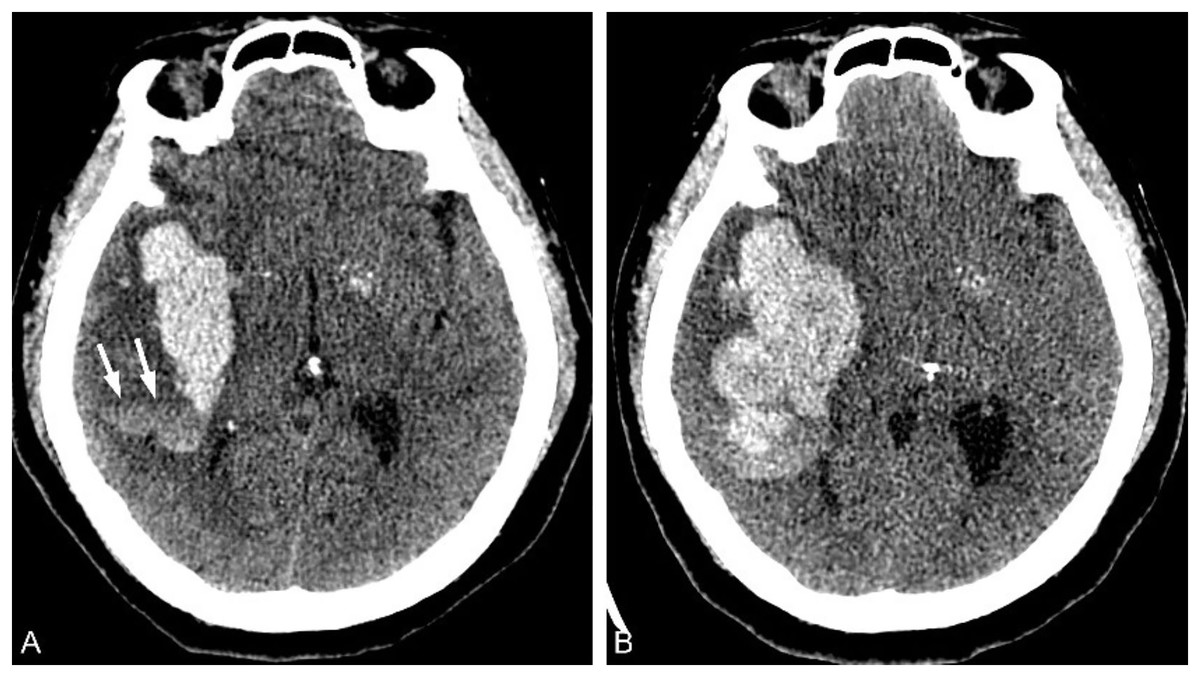
Figure 8: Fluid level sign.
A 66-year-old female patient was admitted to the hospital because of sudden dizziness accompanied by weakness in her left limb that lasted for more than 5 h. She had been diagnosed with hypertension for over 7 years, and her blood pressure measured at 192/101 mmHg. (A) CT examination conducted approximately 5 h after the onset of the disease revealed a high-density hematoma in the right basal ganglia and temporal lobe, with uneven density and stratified signs (arrow). (B) CT reexamination conducted about 15 h after the onset of the disease revealed an increase in both hematoma volume and occupying effect.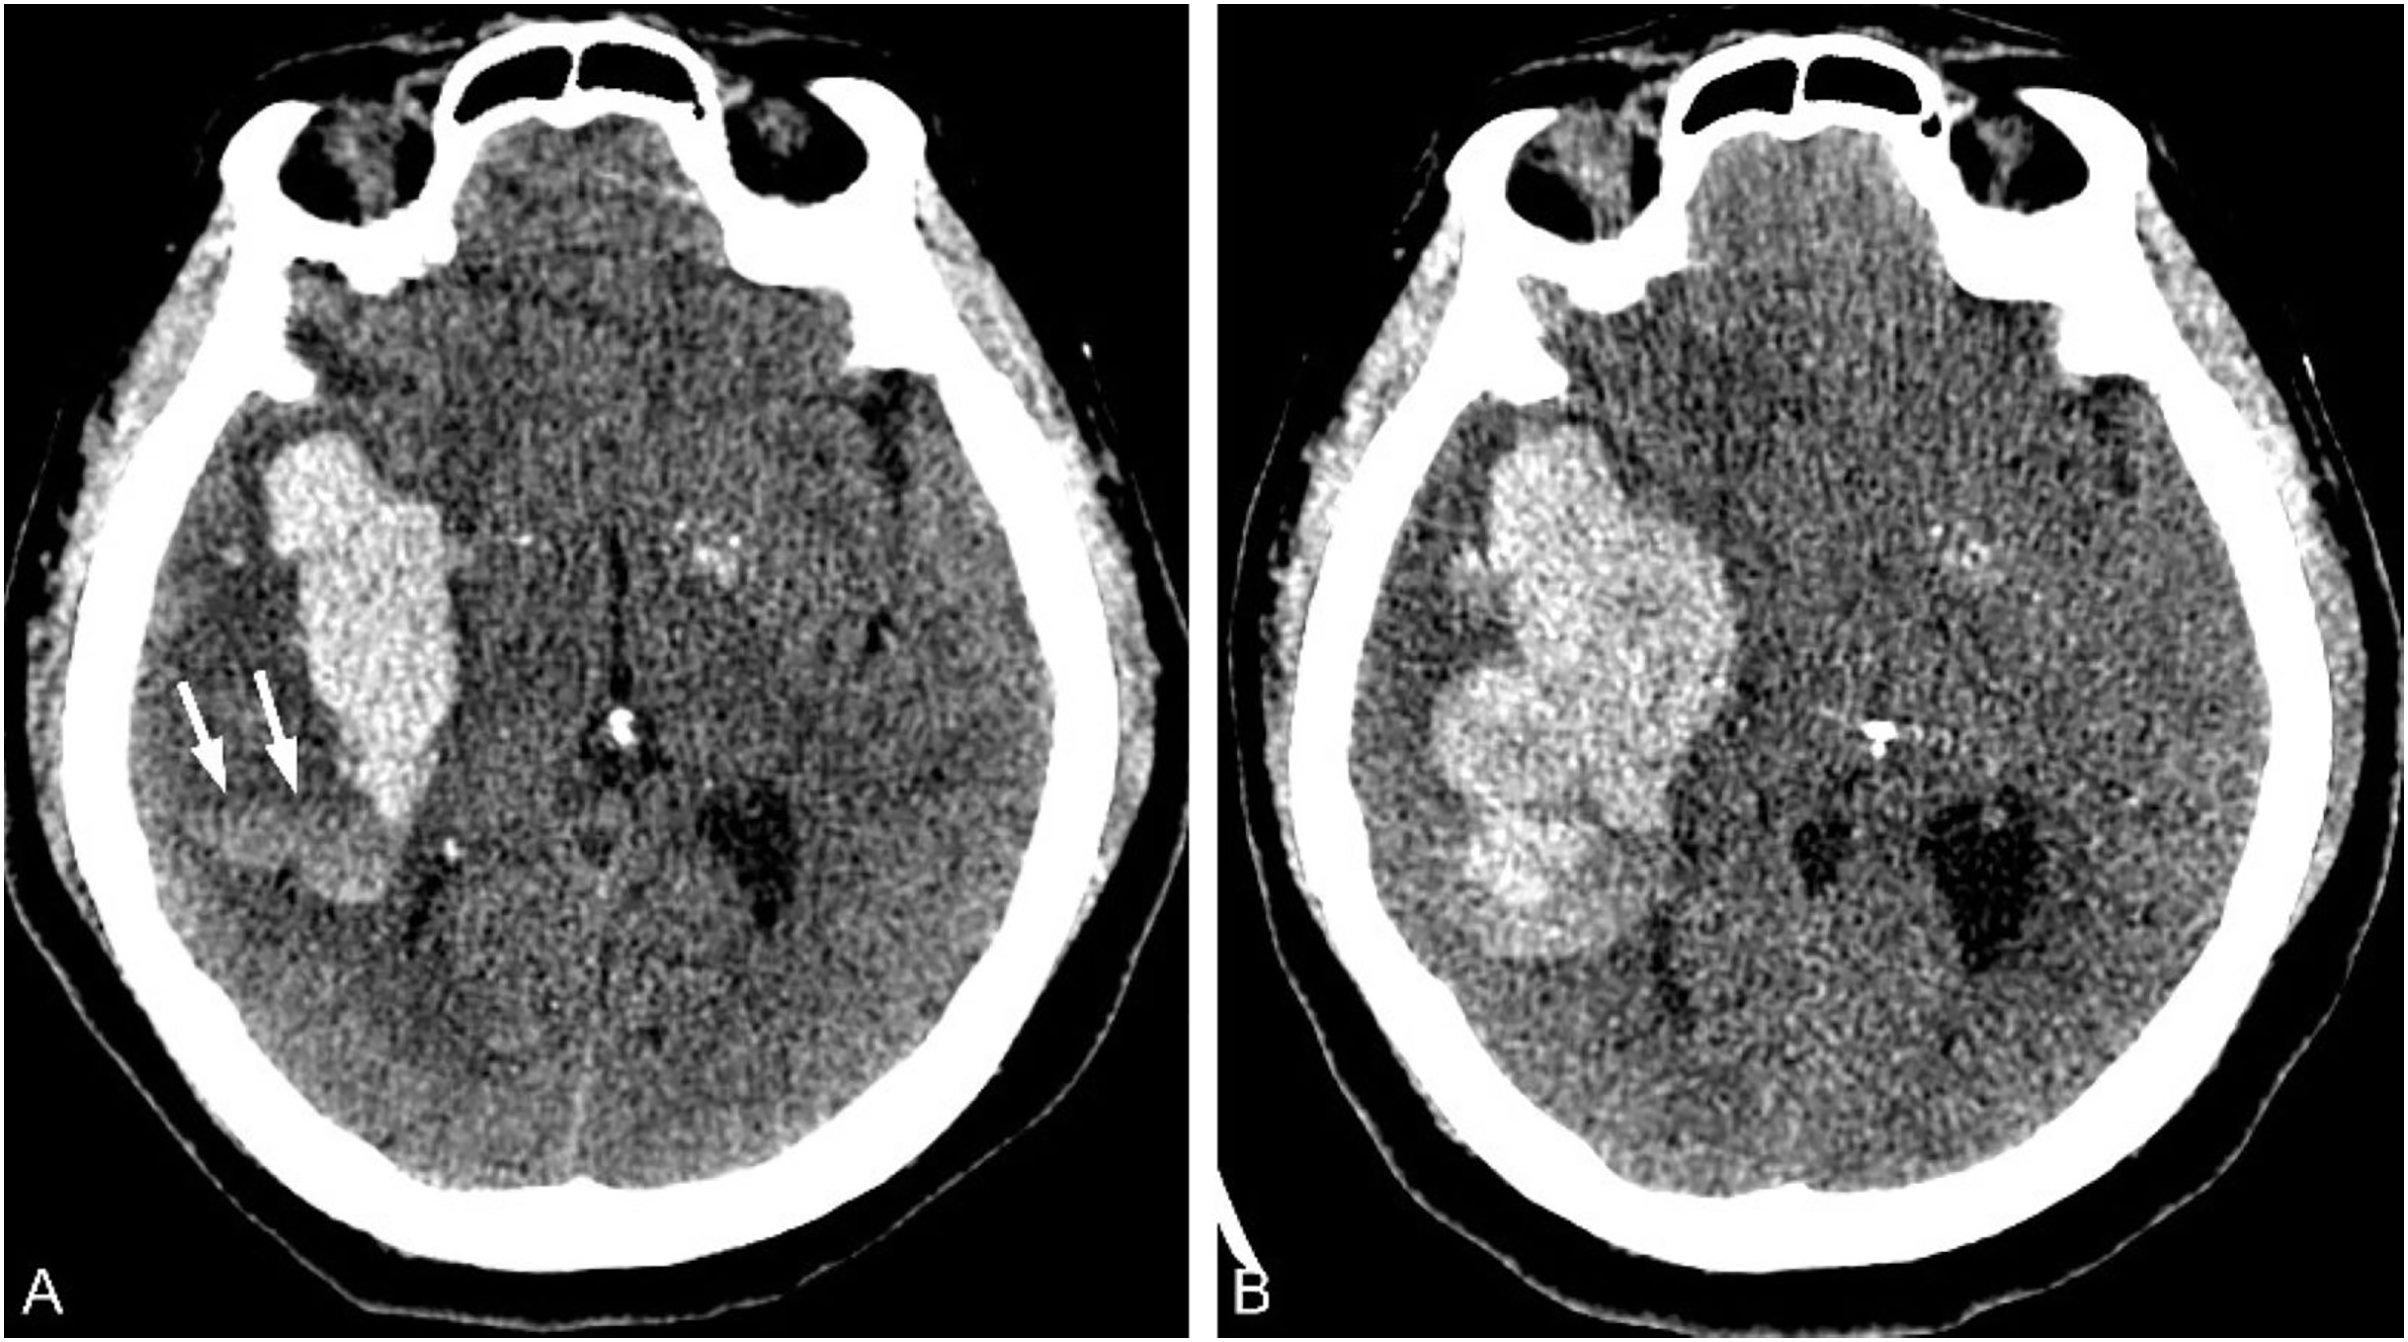
The overlapping CT plain scan imaging signs
There are some overlap in the attenuation between the imaging signs of hematoma density, such as the swirl sign, fluid level sign, black hole sign, and the hypodensities in the hematoma that is not connected with the adjacent brain parenchyma (Fig. 9) (Chung et al., 2022; Nawabi et al., 2023). In the fluid level sign, a hematoma with an attenuating difference of ≥18HU between two areas of differing densities is also the blend sign. The density of a hematoma is considered to be homogeneous when there are 1–2 imaging signs of density characteristics (Barras score I–II) (Delcourt et al., 2016). When more than three imaging signs of density features are present, the density of hematoma is considered heterogeneous (Barras score III–V). There are also some overlap in the attenuation between the imaging signs of the morphology of hematoma. When the number of the satellite sign is ≥3, it is also the island sign (Deng et al., 2019). Regular morphology (Barras score II) is defined when there is only one satellite. The presence of two or more satellite signs or island signs is defined as irregular hematoma shape (Barras score III–V) (Yu et al., 2019b).
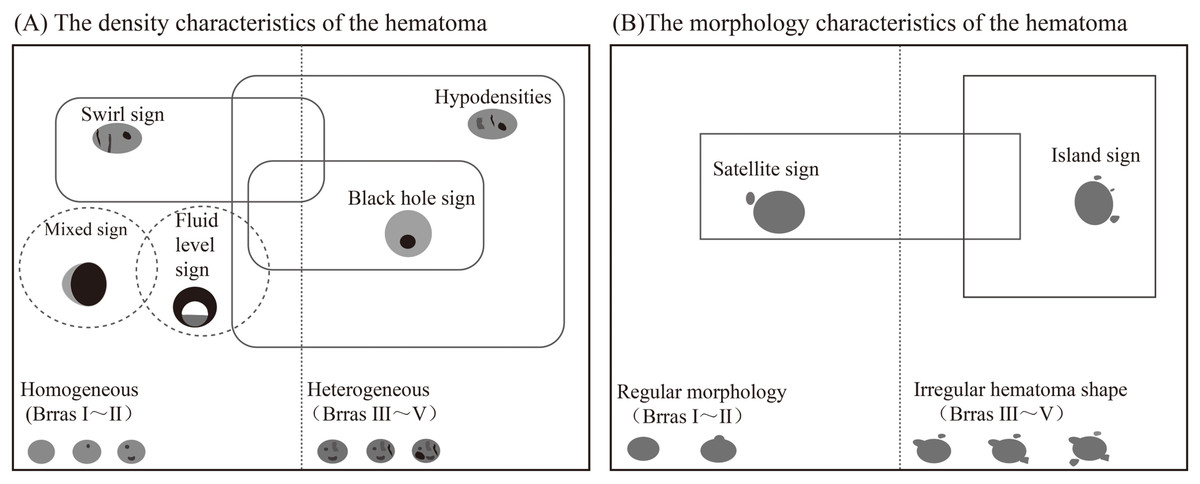
Figure 9: Schematic diagram of potential overlap between CT plain scan imaging signs.
(A) The density characteristics of the hematoma. (B) The morphology characteristics of the hematoma.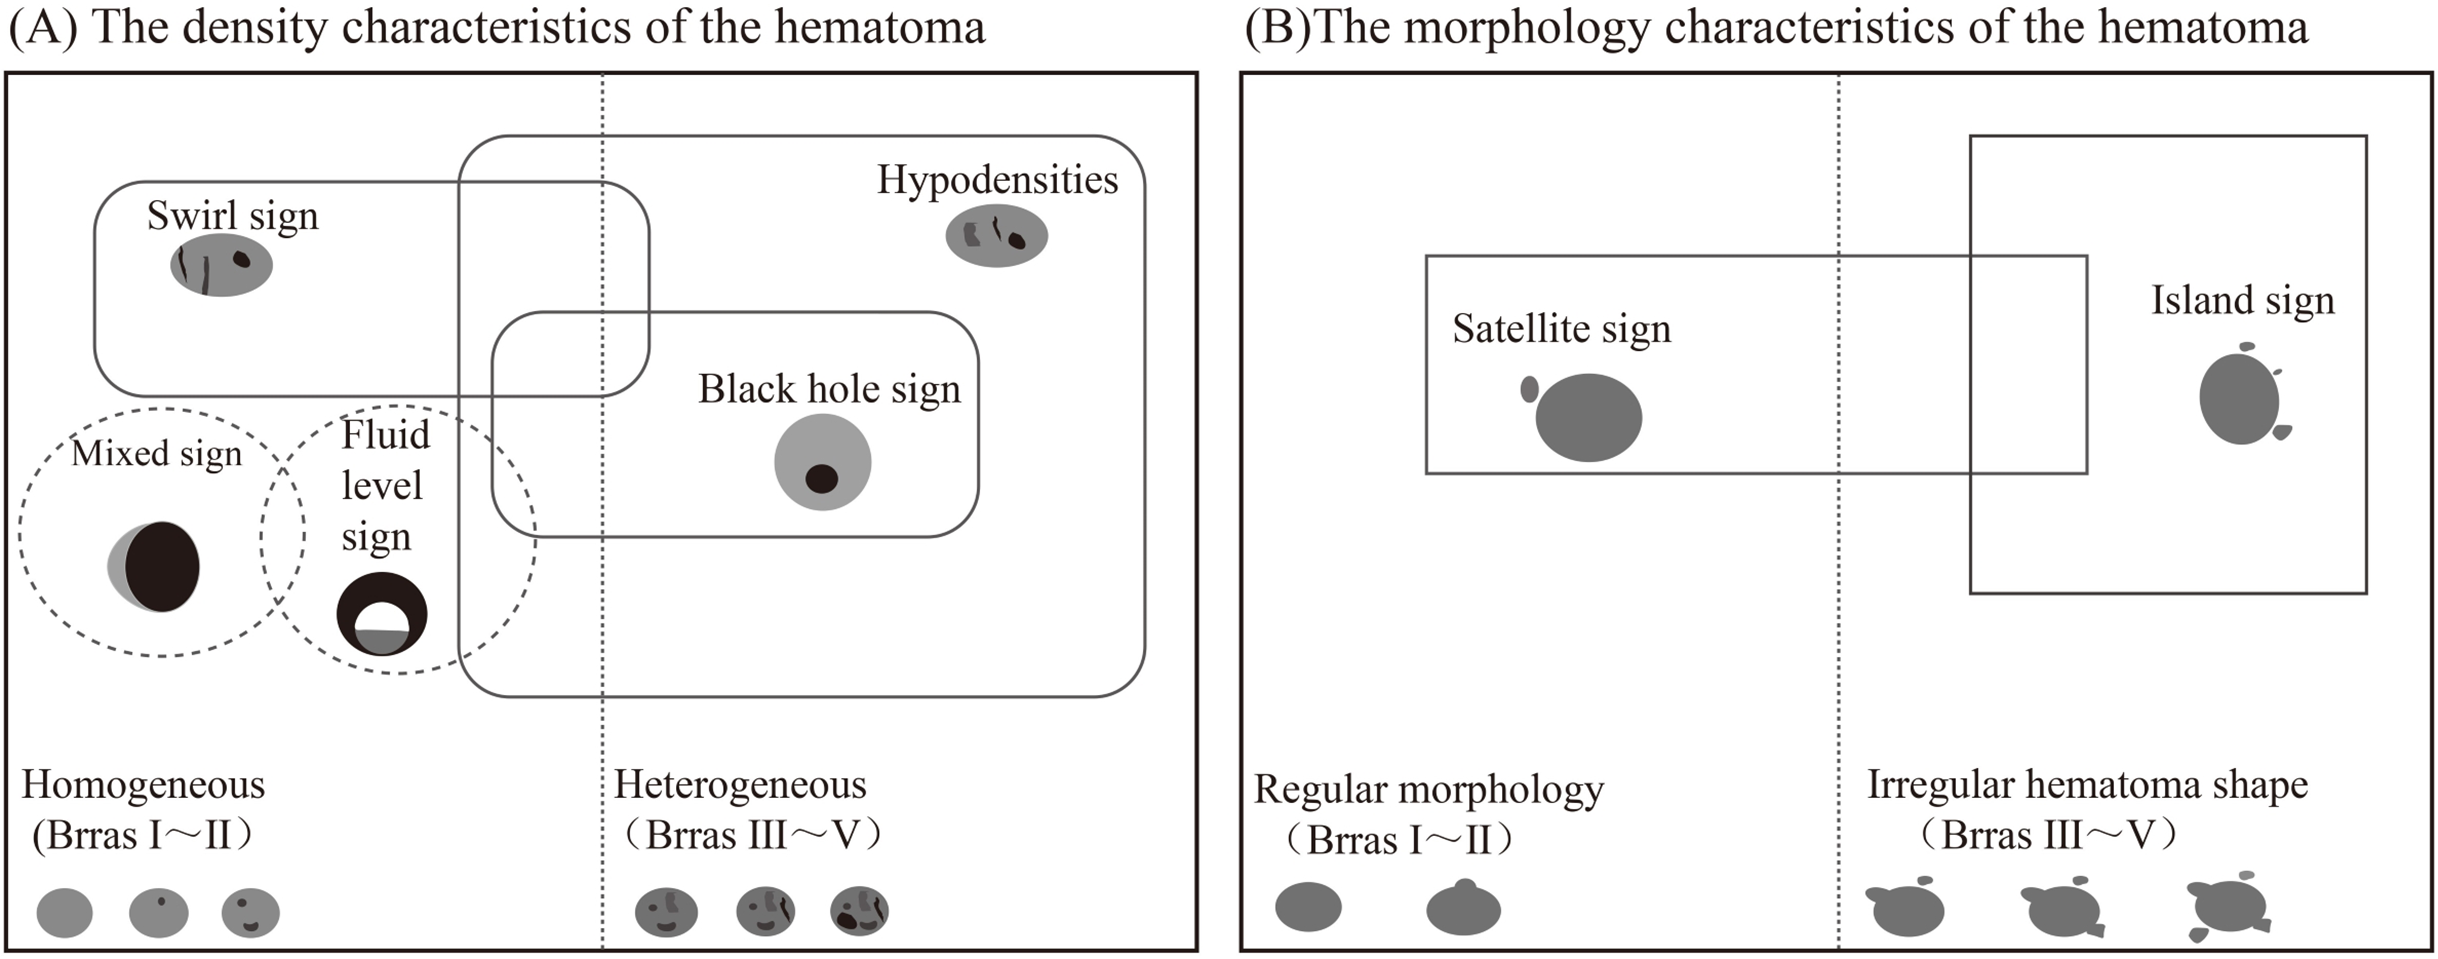
The imaging signs asscociated with he on cta
CTA spot sign
The CTA spot sign was first proposed by Wada et al. (2007) in 2007 (Fig. 10). The spot sign is defined as one or more foci with a diameter of 1–2 cm of enhancement within the hematoma on CTA source images. It has been confirmed in a number of studies and clinical work that it is closely related to the occurrence of HE, and the spot sign can predict HE with 91% sensitivity, 89% specificity, 77% positive predictive value and 96% negative predictive value. Subsequently, many research studies have modified the definition of the CTA point sign, and now the following definition is mostly used (Dowlatshahi et al., 2016; Romero et al., 2012): ① There is ≥1 contrast leakage from the hematoma. ② The CT value of spot foci is at least 120HU higher than that of peripheral hematoma. ③ The spot foci is discontinuous with any adjacent vessels. ④ The spot foci could be of any size and shape, and the above four criteria should be met at the same time. In the research, the inconsistent use of spot sign definitional criteria led to inconsistent conclusions on its predictive value for HE. In 2018, Xu et al. (2018) included a total of 29 studies in a meta-analysis on CTA prediction of HE, and found that the incidence of spot signs was 23.4%, and the predictive sensitivity and specificity of HE were 62% (95% CI, [54–69%]) and 88% (95% CI, [85–91%]), and the OR of spot signs with HE was 8.49 (95% CI, [7.28–9.90]). At present, CTA spot sign is recognized as one of the most effective imaging markers for predicting HE, which shows the contrast agent extravasation from the microvessels and represents the presence of active bleeding. Meanwhile, the presence of spot sign is also a risk factor for in-hospital death and 3-month death of ICH patients, as well as an essential predictor of poor prognosis at discharge and 3 months of patients (Singh et al., 2021).
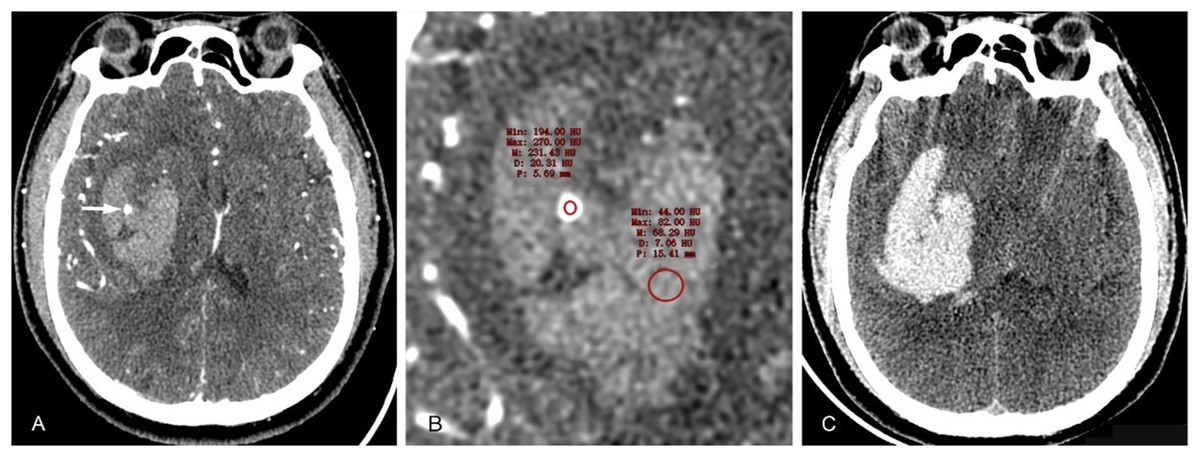
Figure 10: CTA spot sign.
A 40-year-old male patient with a history of hypertension for many years was admitted due to sudden left limb weakness and loss of consciousness for 2 h, with a blood pressure of 214/119 mmHg. (A) CTA examination conducted about 2 h after the onset of the disease revealed a high-density hematoma shadow in the right basal ganglia, with a CT value of approximately 68HU. Additionally, there was a separate contrast agent aggregation shadow (dot sign) that was not connected to the surrounding blood vessels. (B) The CT value of the contrast media in the hematoma was 231HU. (C) The CT examination, conducted 4.7 h after the onset of the disease, revealed a significant increase in hematoma volume.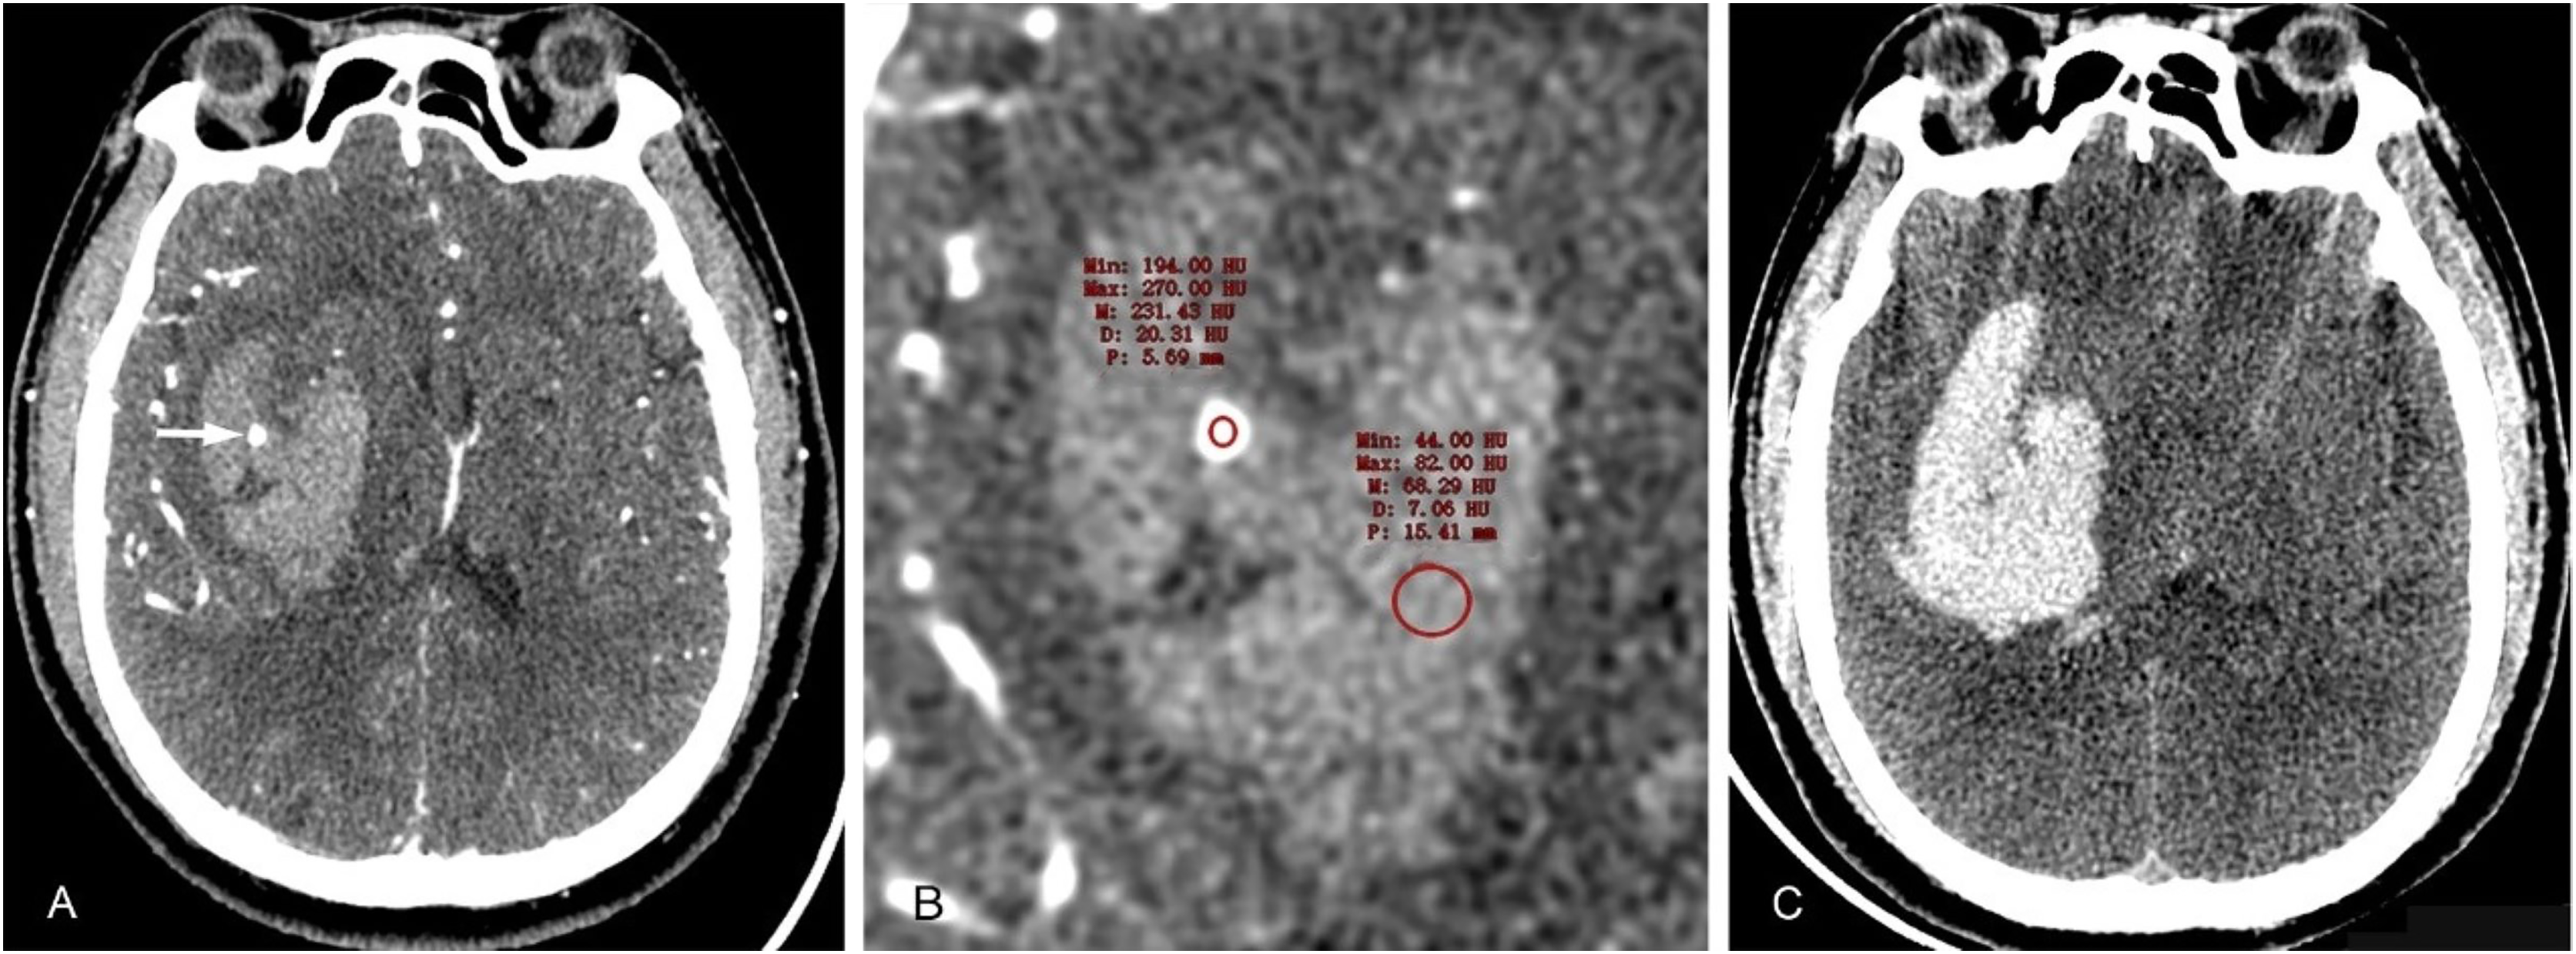
Leakage sign
The leakage sign was first proposed by Orito et al. (2016), which based on the comparison of the arterial and delayed-phase CT images (5 min after CTA phase), each reviewer set a region of interest (ROI) with a 1-cm-diameter on the delayed-phase image, which was considered the region with the highest HU change between the CTA phase and delayed CTA phase, and a 10% increase in HU was considered the positive leakage sign. In this study, researchers performed CTA and delayed scans in 80 patients with spontaneous ICH and found signs of leakage in 43% of patients, with sensitivity of 93.3% and specificity of 88.9% for predicting HE. Brouwers et al. (2015) found that an increase in the extravasation rate of contrast agents, also known as speck signs, significantly enhances the ability to predict hematoma expansion and mortality. Our findings support the hypothesis that speckle signs directly measure active hemorrhage in acute cerebral hemorrhage. The prediction efficiency was significantly higher than that of CT plain scan imaging signs and CTA point signs, which was an effective and sensitive method for HE prediction. However, due to the critical condition of HICH patients, delayed phase scanning is not conducive to the treatment of patients, so the leakage sign is rarely promoted and used in clinical practice.
Predicting he with ct radiomics
Overview of radiomics
Radiomics is a feature set which high-throughput converts medical images into the data features, and then quantitative analysia of these data features, which offer the diagnose and predict efficacy and prognosis (Mayerhoefer et al., 2020). Radiomics is a natural extension of computer-aided diagnosis and detection system, which has the advantages of non-invasiveness, repeatability, multi-level and even the microscopic characteristics of the whole lesion data mining and comprehensive evaluation, the ability to interpret the microscopic characteristics of the lesion from the overall spatial heterogeneity, and can play the role of virtual biopsy, ect (Huang et al., 2023a). Radiomics usually involves the following four workflows (Fig. 11): (1) Imaging image acquisition, including CT, MRI, and ultrasound images. (2) ROI drawing and image segmentation. (3) Feature extraction and selection: the data features for quantitative analysis of lesion heterogeneity, including morphological characteristics, first-order statistical characteristics, second-order statistical characteristics, and higher-order statistical characteristics, were extracted from the segmented images. Due to the large number of radiomics features extracted, even up to thousands of different features, too many dimensions will cause the risk of model overfitting, so it is particularly important to carry out feature reduction and selection (Huang et al., 2023a). Common methods include least absolute shrinkage and selection operator regression algorithm, principal-component analysis, etc. (4) Model construction and validation: the extracted and screened features are used to construct prediction models, and Logistic regression analysis is the most common method. In recent years, machine learning algorithms have also been widely used in model construction and have obtained greater discrimination ability. Finally, assessing of the radiomics modle, which include internal and/or external verification, as well as ROC curve, calibration curve and clinical decision curve.
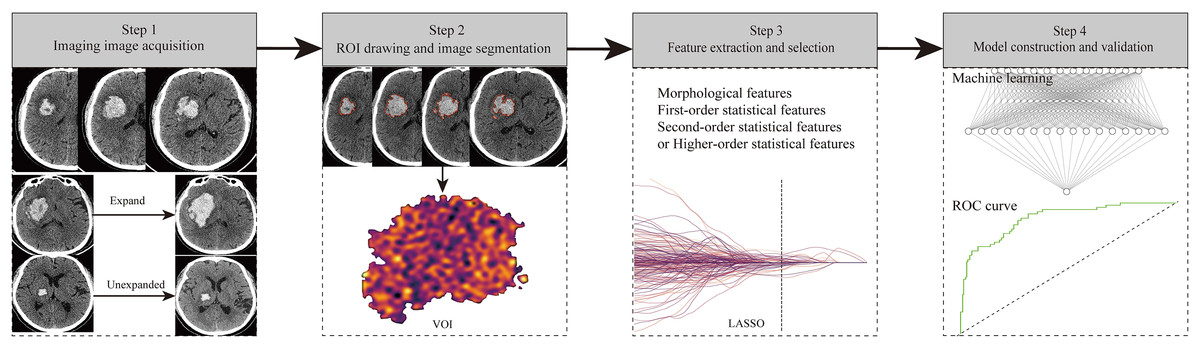
Figure 11: The flow chart of radiomics study design.
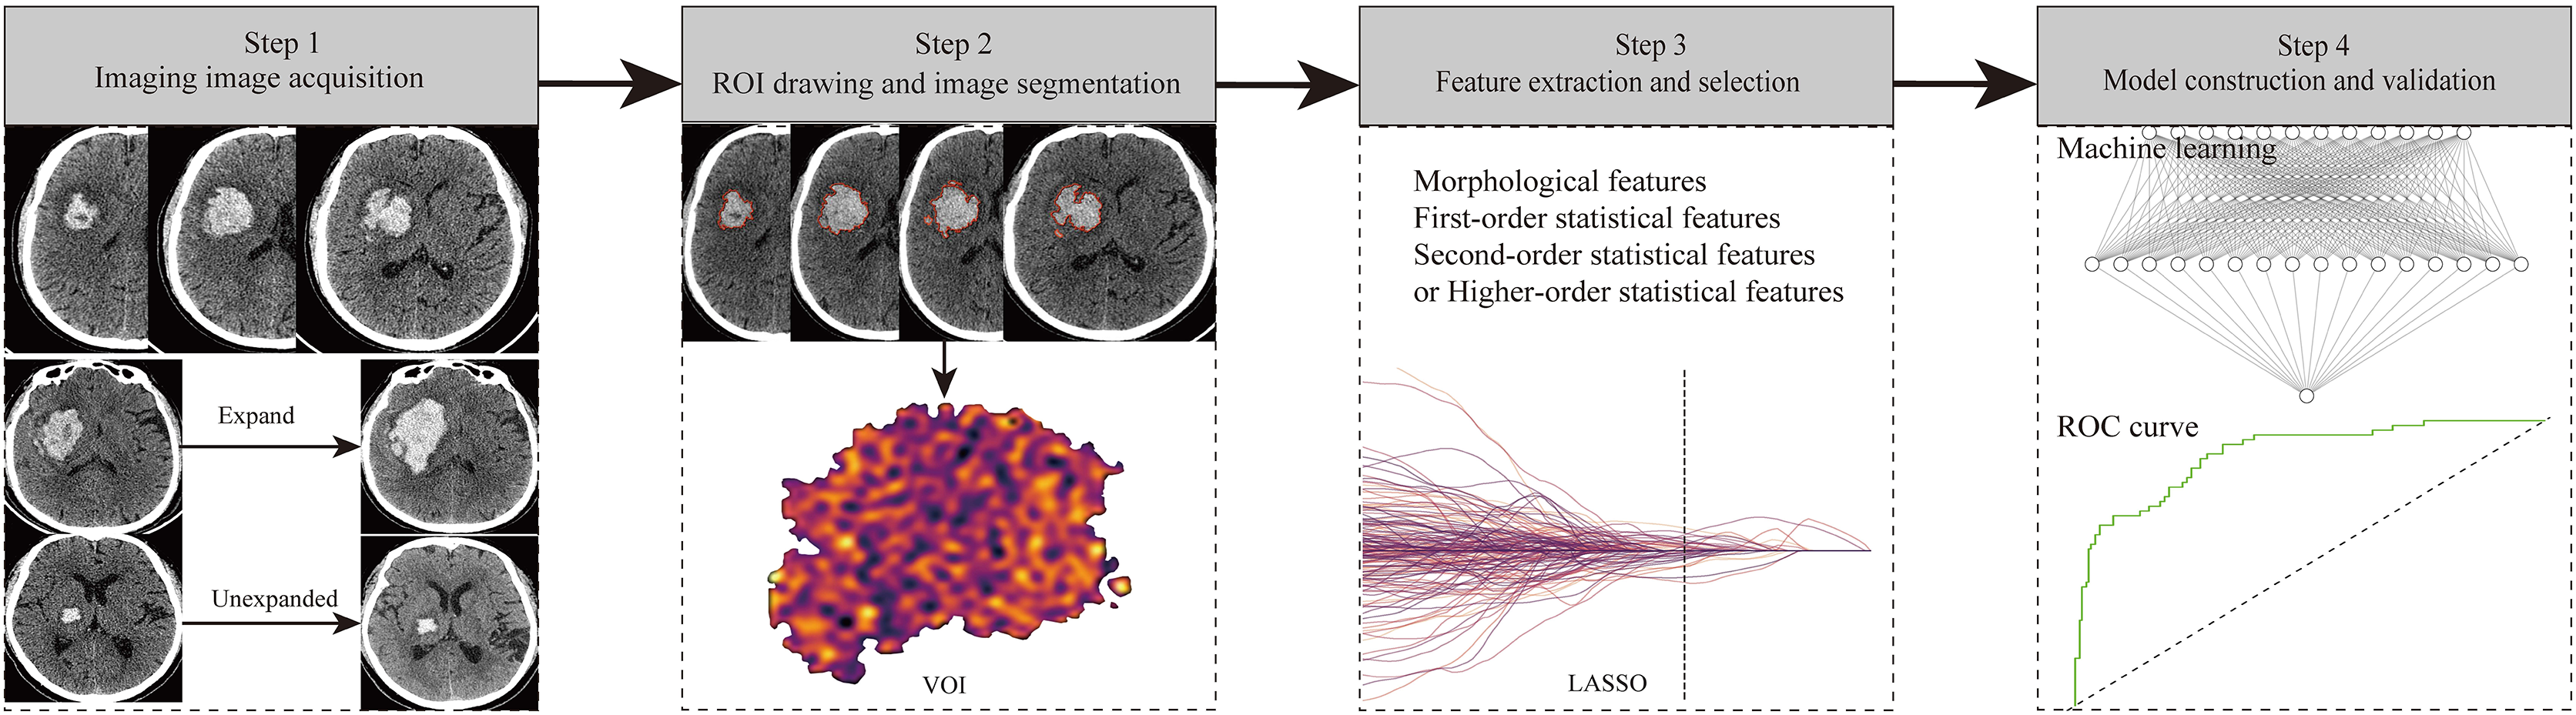
Research progress of radiomics in HE
Machine learning (ML) is a part of artificial intelligence, which refers to the ability of computers to learn by programming them to imitate human learning behavior, that is, learning how to perform a specific task from a large amount of data, and gradually improving the execution performance of the task during the learning process, eventually producing computer algorithms that can perform assigned tasks executed smoothly (Greener et al., 2022; Nie et al., 2020; Zhu et al., 2021). At present, there are more than a dozen commonly used ML algorithms, including the k-nearest neighbor (k-NN) algorithm, logistic regression, support vector machine (svm), random forest, and XGBoost, etc (Handelman et al., 2018; Valkenborg et al., 2023). These ML algorithms have strong big data processing ability and high-precision classification ability, so they play an important role in the construction of prediction models. The combination of radiomics and ML has greatly enhanced work efficiency. The integration of artificial intelligence and medicine has profoundly influenced the medical system, considerably broadening the significance of medical imaging in clinical practice. Presently, it is extensively employed in HE diagnosis and prognosis assessment (Table 1). Tanioka et al. (2022) investigated whether ML methods can accurately and broadly predict hematoma expansion in acute cerebral hemorrhage (ICH). The k-NN algorithm, logistic regression, support vector machine (SVM), random forest, and XGBoost were applied to patient data in the development cohort. The results showed that among all ML models, the k-NN algorithm had the highest area under the subject operating characteristic curve (AUC), which was 0.790; sensitivity was 0.846; specificity was 0.733; and accuracy was 0.775. Among all scoring methods, BRAIN scores had an AUC of 0.676, lower than that of the k-NN algorithm (P = 0.016). This model demonstrated better predictive ability and performance compared to previous scoring methods. Cheng et al. (2021) innovatively developed a dual-mode ML strategy to predict HE, achieving an accuracy of 86.5%, which is significantly higher than that of the single-mode predictor (69.5%). This model may serve as a potentially useful tool for screening patients at high risk for HICH. Ma et al. (2019) further increased the sample size study and conducted a retrospective analysis of 254 patients with HICH, extracted and screened five radiomics features to construct a prediction model. The AUC of the model was 0.892 (95%CI [0.824–0.959]), and the accuracy was 85.2%. The sensitivity and specificity were 84.4% and 85.5%, respectively. Researchers consider that the single radiomics feature is effective in predicting HE, but the calibration and practicability of the model have not been tested, and the validity of the model needs further verification. Radiomics shows better efficiency than traditional CT imaging signs in predicting HE. Xie et al. (2020) extracted radiomics features from CT images of 251 patients with HICH and constructed a radiomics model for predicting HE. Compared with the traditional CT imaging signs model, the prediction performance of the radiomics model was higher than that of the traditional model (AUC of Training Dataset: 0.954 vs. 0.869, AUC in Validation Dataset: 0.891 vs. 0.811, all P < 0.001). Traditional imaging signs and radiomics have their own advantages and drawbacks. Traditional imaging signs are easy to obtain, and the model construction is relatively fast. However, it is low discrimination, low sensitivity, and low specificity in predicting HE. Moreover, the interpretation of imaging signs is subjective, which requires sufficient clinical experience of observers. Radiomic features extraction and model construction are relatively complicated. However, radiomics objectively reflects the deep features that cannot be identified by the naked eye in the form of data. Therefore, the discrimination, sensitivity and specificity of predicting HE can be significantly improved, and it has the characteristics of non-invasiveness and repeatability. Liu et al. (2019) used SVM algorithm to construct a HE prediction model based on the clinical data and CT imaging signs of 1,157 patients with ICH, and the sensitivity, specificity and AUC were 81.3%, 84.8% and 0.833, respectively. Compared with the traditional model construction method, the prediction efficiency was greatly improved. ML uses computer programming and learning to construct models from big data. The discrimination ability of the model can be significantly improved by the processing of big data, but the model construction with large samples is needed to ensure the stability of the model. Duan et al. (2022) extracted radiomic features from CT images of 108 HICH patients, and used k-nearest neighbor (KNN), SVM and random forest (RF) to construct HE prediction models, and found that the AUC of each model was high (all greater than 0.75). Among them, SVM and KNN had the largest AUC (both 0.91), which were the best prediction models. Song et al. (2021) constructed HE prediction models based on CT radiomics and different ML algorithms of RF, LR, SVM and KNN in 261 patients with HICH, all of them showed good prediction efficiency, with AUC greater than 0.850 in the training dataset (RF had the largest AUC of 0.984). The AUC of the validation dataset was greater than 0.804 (SVM had the largest AUC of 0.862). Comparing the former two studies, it was found that the stability of the model was not good, and the AUC of the ML algorithms used to predict HE was quite different, which may be related to the different sample size and data processing methods. Compared with the modle of traditional clinical imaging signs, the radiomics model combined with ML prediction performance can be significantly improved. Chen et al. (2021) developed a clinical-radiomic model to evaluate the risk of early HE. The established hybrid model demonstrated satisfactory identification and calibration in detecting HE (AUC = 0.771, sensitivity = 87.0%; AUC = 0.820, sensitivity = 88.1%, respectively). This non-invasive tool can provide risk stratification for HE. Dai et al. (2023) developed a nomogram model based on a combined prediction model using radiomics and mixed symbols. The nomogram model was established in the training set (ROC: 0.90 95% CI [0.83–0.96]) and validation set (ROC: 0.88 95% CI [0.71–0.93]), demonstrating excellence, which can provide strong reference for clinical practice.
| Radiomics features | Models | Clinical features | Imaging signs | Author | Year | Study design | Paticipants (n) | AUC | Sen(%) | Spe(%) |
|---|---|---|---|---|---|---|---|---|---|---|
| Radiomics and imaging signs | LR machine learning | / | Spot sign | Li et al. | 2024 | Retrospective single-center | 182 | 0.925 | 0.786 | 0.913 |
| Radiomics, clinical features and imaging signs | LASSO-LR | NIHSS score | Swirl sign, black hole sign, irregular shape | Haider et al. | 2023 | Retrospective multi-center | 897 | 0.64 | / | / |
| Radiomics and imaging signs | Multivariate logistic | / | Blend sign | Dai et al. | 2023 | Retrospective single-center | 187 | 0.88 | / | / |
| Radiomics and clinical features | SVM | Systolic blood pressure, history of cerebral infarction, history of ICH, NIHSS score, age, INR, anticoagulant treatment, diastolic blood pressure, ICH score, history of hypertension | / | Rezaei et al. | 2023 | Retrospective single-center | 116 | 0.89 | / | / |
| Radiomics, clinical features and imaging signs | Multivariate logistic | Age, sex, time to ICH onset, hypertension, diabetes, renal disease, warfarin use,GCS score | Barras density, swirl sign, hypodensities, black hole sign, blend sign, fluid level, barras irregularity, island sign, satellite sign | Chen et al. | 2023 | Retrospective multi-center | 317 | 0.877 | 0.682 | 0.789 |
| Clinical features and imaging signs | KNN | PT-INR, anticoagulant use, platelet count, sex, time from onset to baseline CT scan. | Baseline hematoma volume, intrahematoma hypodensities, lobar hemorrhage, irregular hematoma shape, cerebellar hemorrhage. | Tanioka et al. | 2022 | Retrospective multi-center | 422 | 0.79 | 0.846 | 0.733 |
| Radiomics, clinical features and imaging signs | Multivariate logistic | Time to baseline NCCT, NLR | Hypodensity, blend sign | Xu et al. | 2022 | Retrospective single-center | 388 | 0.85 | 0.801 | 0.893 |
| Radiomics and clinical features | Multivariate logistic regression | Initial GCS score, hematoma broken into ventricle, Serum calcium concentration | / | Li et al. | 2022 | Retrospective single-center | 258 | 0.82 | / | / |
| Radiomics | SVM/LR | / | / | Seymour et al. | 2022 | Retrospective single-center | 200 | 0.70/0.70 | 0.72/0.73 | 0.71/0.71 |
| Radiomics | ML classifiers | / | / | Xia et al. | 2022 | Retrospective single-center | 376 | 0.8124 | 0.875 | 0.6731 |
| Radiomics | SVM/KNN | / | / | Duan et al. | 2022 | Retrospective single-center | 108 | 0.91/0.91 | 0.93/0.86 | 0.68/0.79 |
| Radiomics, clinical features and imaging signs | Generalised linear model | Age, gender, treatment allocation, baseline volume, systolic blood pressure, previous antiplatelet therapy | Onset to CT scan, ultra-early haematoma growth, blend sign, black hole sign, hypodensities, island sign | Pszczolkowski et al. | 2021 | Retrospective multi-center | 1,732 | 0.704 | 0.65 | 0.711 |
| Radiomics | MLP | / | / | Cheng et al. | 2021 | Retrospective single-center | 140 | 0.91 | 0.826 | 0.889 |
| Radiomics, clinical features and imaging signs | SVM/RF/LR/KNN | Sex, diabetes mellitus, platelet count, apoA-I | Blend sign, black hole sign, swirl sign, hypodensity, heterogeneity | Song et al. | 2021 | Retrospective single-center | 261 | 0.862/0.829/0.850/0.804 | / | / |
| Radiomics and clinical features | Multivariate logistic | Sex, GCS score, Time to baseline NCCT | / | Chen et al. | 2021 | Retrospective single-center | 1,153 | 0.82 | 0.881 | 0.68 |
| Radiomics, clinical features and imaging signs | Multivariate logistic | Time to initial NCCT, neutrophil to lymphocyte ratio | Hypodensity, blend sign | Xu et al. | 2020 | Retrospective single-center | 129 | 0.857 | 0.95 | 0.766 |
| Clinical features and imaging signs | SVM | Sex, time to initial CT scan, glasgow coma scale, fibrinogen level | Black hole sign, blend sign | Liu et al. | 2019 | Retrospective single-center | 1,157 | 0.89 | 0.813 | 0.848 |
| Radiomics | LASSO | / | / | Ma et al. | 2019 | Retrospective single-center | 254 | 0.892 | 0.844 | 0.855 |
| Radiomics and imaging signs | LASSO | / | Location, hypodensities, island sign, density, shape | Xie et al. | 2019 | Retrospective single-center | 251 | 0.891 | 0.735 | 0.925 |
| Radiomics | SVM | / | / | Li et al. | 2019 | Retrospective single-center | 167 | 0.729 | 0.717 | 0.736 |
Note:
Li et al. (2024), Haider et al. (2023), Dai et al. (2023), Rezaei et al. (2023), Chen et al. (2023), Tanioka et al. (2022), Xu et al. (2022), Li et al. (2022), Seymour et al. (2022), Xia et al. (2022), Duan et al. (2022), Pszczolkowski et al. (2021), Cheng et al. (2021), Song et al. (2021), Chen et al. (2021), Xu et al. (2020), Liu et al. (2019), Ma et al. (2019), Li et al. (2019).
Research progress of artificial intelligence based on deep learning in he prediction
Research progress of hematoma segmentation
At present, deep learning is considered the most efficient machine learning algorithm and has achieved remarkable success in processing various types of data. Some predictive models based on deep learning have been successfully utilized for predicting HE outcomes (Table 2). Yu et al. (2022) retrospectively collected 12,568 CT images from 512 patients with cerebral hemorrhage and prospectively collected 1,257 CT images from 50 patients with cerebral hemorrhage. The two datasets were used for network training, validation, internal testing, and external testing. Additionally, the study divided 13 irregular hematoma cases, 11 subdural and epidural hematoma cases, and 50 patients with different types of HV into three groups (30, 30–60, and 60 ml) to further evaluate the robustness of DR-UNet. The image segmentation performance of DR-UNet was compared with UNet, fuzzy clustering method, and active contour method. The measurement performance of HV was compared using DR-UNet, UNet,and Coniglobus formula. The results showed that the segmentation model using DR-UNet achieved similar performance to expert clinicians on two independent test datasets: internal test data (Dice coefficient: 0.861 ± 0.139) and external test data (Dice coefficient: 0.874 ± 0.130). There was a strong correlation between the HV measured by DR-UNet and manual segmentation (R2 = 0.9979; P < 0.0001). DR-UNet demonstrated greater robustness than UNet in segmenting hematoma and measuring HV in irregularly shaped subdural and epidural hematoma groups. The proposed DR-UNet can accurately segment hematoma and quantify HV from computed tomography scans of patients with cerebral hemorrhage more efficiently than existing methods while achieving similar performance to expert clinicians. Strong performance is observed across different ICHs.
| Models | Clinical features | Imaging signs | Author | Year | Study design | Paticipants (n) | AUC | Sen(%) | Spe(%) |
|---|---|---|---|---|---|---|---|---|---|
| Convolutional neural network | Age, GCS, fibrinogen, | / | Lee et al. | 2024 | Retrospective single-center | 572 | 0.83 | 0.762 | 0.826 |
| Deep features of the VGG-19 network | / | / | Wu et al. | 2024 | Retrospective single-center | 254 | 0.921 | 0.889 | 0.927 |
| Deep learning-CNN | / | / | Tran et al. | 2024 | Retrospective multi-center | 793 | 0.81 | 0.62 | 0.81 |
| Deep learning-CNN | / | / | Bo et al. | 2023 | Retrospective single-center | 408 | 0.949 | – | – |
| Deep learning-CNN | / | Irregularity, satellite, mixed, whirlool | Feng et al. | 2023 | Retrospective multi-center | 561 | 0.82 | 0.54 | 0.95 |
| Convolutional neural networks | Age,GCS, anticoagulant, coagulation orders, ischemic stroke, time from onset to examination | Shape, location, the midline shift, blend sign, time from offset to examination | Bo et al. | 2023 | Retrospective single-center | 408 | 0.949 | / | / |
| Deep learning-CNN | Age, coagulopathy, baseline national institutes of health stroke scale, glasgow Coma Scale scores | Cerebral hemorrhage and breaking into the ventricle | Tang et al. | 2022 | Retrospective single-center | 223 | 0.88 | 0.9197 | 0.8837 |
| Deep learning-AI | / | / | Guo et al. | 2022 | Retrospective single-center | 102 | / | 0.8 | 0.736 |
| ResNet-34 | / | / | Ma et al. | 2022 | Retrospective single-center | 253 | 0.9267 | / | / |
| Deep learning | Time from onset to NCCT | Hypodensities, black hole sign, blend sign, fluid level, irregular shape | Zhong et al. | 2021 | Prospective single-center | 266 | 0.8 | 0.91 | 0.58 |
| Deep learning-AI | / | / | Teng et al. | 2021 | Retrospective multi-center | 3,134 | 0.78 | 0.732 | 0.709 |
Research progress of deep learning in predicting HE
Convolutional neural network (CNN) is a commonly used deep learning statistical method for image recognition. U-net is a network and training strategy that heavily relies on data augmentation, enabling the ideal method to be achieved with less data and in less time. In a prospective collection of 266 patients with primary supratentorial intracerebral hemorrhage from the Second Affiliated Hospital of Zhejiang University, Zhong et al. (2021) developed a deep learning model based on CNN and U-net networks to predict hematoma expansion (HE) and compared it with traditional noncontrast CT (NCCT) markers. The results showed that the deep learning model has the highest C statistic (0.80). The C statistics for hypodensities, black hole sign, blend sign, fluid level, and irregular shape were 0.64, 0.65, 0.51, 0.58, and 0.55 respectively; swirl sign had a C statistic of 0.70 (P = 0.211), while heterogenous density had a C statistic of 0.70 (P = 0.141), which was not significantly higher than the deep learning model’s performance. Additionally, the prediction value of the deep learning model was significantly better than that of the hematoma volume logistic model (C statistic = 0.62; P = 0.042) and BAT score (C statistic = 0.65; P = 0.042). The results of this study demonstrate that the deep learning algorithm has distinct advantages in predicting early hematoma expansion in patients with cerebral hemorrhage, and can be widely applied in clinical practice. Tang et al. (2022) used deep learning technology to predict hematoma expansion in ICH patients. The average sensitivity, specificity, and accuracy values for CNN predicting HE were found to be 0.9197, 0.8837,and 0.9058 respectively. CNN also outperformed five machine-learning methods based on clinical variables. The study showed that deep learning techniques accurately classify over 90% of hematomas with or without dilation, surpassing other methods solely relying on clinical variables.
Research progress of combined deep learning and radiomics in predicting HE
Some researchers have proposed that combining deep learning with radiomics can further improve work efficiency and accuracy (Bo et al., 2023). Feng et al. (2023) examined NCCT in 561 patients with spontaneous intracerebral hemorrhage (sICH). Indicators of hematoma detection were evaluated through cross-comparison (IoU), Dice coefficient (Dice), and accuracy (ACC). The EfficientNet-B0 classification model was used to assess the semantic features of sICH. Radiomic analysis based on regions of interest and automatic segmentation through deep learning were conducted. A multivariate binary logistic regression was employed to construct a combined model for predicting early hematoma expansion, and a nomogram and calibration curve were drawn to verify the prediction effect using ROC analysis. The results showed that the detection accuracy of the hematoma segmentation model with an IoU greater than 0.6 was 98.2%, while it was 76.5% for an IoU greater than 0.8. In the validation cohort, the accuracy rate was 86.6% for an IoU greater than 0.6 and 70% for an IoU greater than 0.8. The AUC range of the deep learning model for judging semantic features during training ranged from 0.95 to 0.99, while it ranged from 0.71 to 0.83 in the validation queue. The AUC value of the deep learing-combined radiomics model in both internal validation cohort (0.83) and external validation cohort (0.82) was higher compared to that obtained by using only semantic features or Radscore. This study demonstrated that deep learning models can significantly enhance efficiency in segmenting spontaneous intracerebral hemorrhages as well as classifying their semantic features. Additionally, the combination of deep learning and imaging radiomics models exhibits good predictive performance regarding early hematoma expansion.
Evaluation of AI software for predicting HE
The AI software used to predict hematoma expansion is diverse and complex. Evaluating its safety and accuracy is currently a hot research topic. Guo et al. (2022) utilized commercial artificial intelligence (AI) software to assess initial CT scan images, predict hematoma expansion using both a deep learning algorithm and a radiologist, and calculate/compare the corresponding sensitivity, specificity, and accuracy of the two groups. They compared the gold standard diagnostic time for hematoma dilation with the diagnostic time of artificial intelligence software and doctors’ reading time. It was discovered that among 102 patients with HICH, the AI group exhibited higher sensitivity, specificity, and accuracy in predicting hematoma expansion compared to the doctor group (80.0% vs. 66.7%, 73.6% vs. 58.3%, 75.5% vs. 60.8%), with statistically significant differences (P < 0.05). Artificial intelligence diagnosis time (2.8 ± 0.3 s) as well as doctor diagnosis time (11.7 ± 0.3 s) were significantly shorter than gold standard diagnosis time (14.5 ± 8.8 h, P < 0.05), while artificial intelligence diagnosis time was notably shorter than doctor diagnosis time (P < 0.05). This study demonstrates that utilizing a deep learning algorithm can effectively predict early hematoma expansion from initial CT scan images after HICH onset, providing high sensitivity and specificity while greatly reducing diagnosis time—a new accurate, user-friendly, rapid method for early prediction of hematomas.
Discussion
HICH is a complex and dynamic process (Chiquete et al., 2007). A large amount of blood can compress and damage surrounding tissues, leading to impaired nerve function. Patients may experience symptoms such as headaches, changes in consciousness, and movement disorders (Weimar & Kleine-Borgmann, 2017). If the hematoma expands, it often indicates a deterioration of neurological function and an increase in mortality rate. Therefore, early and accurate identification or prediction of HE is beneficial for developing personalized treatment plans and improving patient prognosis (Romero & Rojas-Serrano, 2023).
With the development of medical technology, various methods have shown important potential in predicting HE. CT plain scan has the advantages of simple operation and fast examination speed, which has been widely used in clinical practice (Ma & Zhou, 2022). It can provide a large amount of lesion information, including bleeding volume, density, location, and displacement of surrounding structures. By accurately obtaining and analyzing this information, it can help predict whether the hematoma will further expand. The irregular shape and heterogeneous density of hematoma are considered as risk factors for HE (Liu et al., 2022). However, they have relatively low specificity, which limits their clinical application. The specificitiy of characteristics including mixed sign, black hole sign, and island sign are higher, but their incidence is low (Gupta & Seth, 2019). Meanwhile, there may be overlapping features on CT images, which poses a certain challenge for radiologists. The dot sign on CTA is currently recognized as one of the most effective imaging markers for HE (Kim et al., 2019). Its appearance suggests extravasation of contrast agent and active bleeding, which has high sensitivity and specificity. However, due to the need for intravenous contrast agents in CTA, there is risks of allergies and renal dysfunction for this examination. Therefore, it is difficult to predict HE by conventional CT imaging features, even for experienced radiologists.
Radiomics is a newly emerging computer-aided technology that can quantify the internal information of hematoma by high-throughput extraction of massive features from medical images (Dai et al., 2023). This technology is low-cost, non-invasive, simple, and repeatable, without the need for additional scanning equipment, which has broad application prospects. At present, various radiomics models have been established to predict hematoma enlargement, demonstrating good accuracy and clinical value (Li et al., 2022). Deep learning, such as convolutional neural networks and stacked autoencoder networks, can automatically learn a large amount of data features and achieve high-precision prediction and classification through continuous optimization. Deep learning algorithms can continuously adjust parameters to adapt to different scenarios and data structures. According to literature reports, the accuracy of deep learning models in predicting hematoma enlargement exceeds that of traditional clinical variable models and machine learning models (Zhao et al., 2023). However, radiomics and deep learning are still in their early stages in this field, lacking real-world research, and some models may not perform well when applied to external data. In future research, real-world randomized controlled trials should be conducted. On the other hand, the knowledge of radiology experts with clinical experience should be introduced into artificial intelligence to achieve a closed loop between artificial intelligence and human intelligence.
Conclusions
HE is an important risk factor for neurological deterioration and death in HICH patients. Accurately predicting the risk of HE is of great significance for achieving precise intervention and improving patient prognosis. Previous studies have found that many imaging features have important clinical value in predicting HE. However, cerebral hemorrhage is a complex and dynamic process, and traditional CT imaging features have a certain degree of subjectivity and poor predictive accuracy. The rise of radiomics and artificial intelligence technology has provided a new method for quantitative research on HE, significantly improving the accuracy of HE prediction. However, current artificial intelligence methods face the problem of long time for delineating regions of interest and model building. In the future, artificial intelligence technology should solve this problem and achieve fast and automated prediction. Once this issue is resolved, it will achieve widespread clinical application and promotion, which has important clinical significance.