
Stable isotope compositions of precipitation over Central Asia
- Published
- Accepted
- Received
- Academic Editor
- Graciela Raga
- Subject Areas
- Atmospheric Chemistry, Ecohydrology
- Keywords
- Central Asia, Stable isotope, Precipitation, Environmental variables, Moisture transport
- Copyright
- © 2021 Yao et al.
- Licence
- This is an open access article distributed under the terms of the Creative Commons Attribution License, which permits unrestricted use, distribution, reproduction and adaptation in any medium and for any purpose provided that it is properly attributed. For attribution, the original author(s), title, publication source (PeerJ) and either DOI or URL of the article must be cited.
- Cite this article
- 2021. Stable isotope compositions of precipitation over Central Asia. PeerJ 9:e11312 https://doi.org/10.7717/peerj.11312
Abstract
Central Asia is one of the driest regions in the world with a unique water cycle and a complex moisture transport process. However, there is little information on the precipitation δ18O content in Central Asia. We compiled a precipitation δ18O database from 47 meteorological stations across Central Asia to reveal its spatial-temporal characteristics. We determined the relationship between precipitation δ18O and environmental variables and investigated the relationship between δ18O and large-scale atmospheric circulation. The Central Asia meteoric water line was established as δ2H = 7.30 δ18O + 3.12 (R2 = 0.95, n = 727, p < 0.01), and precipitation δ18O ranged from +2‰ to −25.4‰ with a mean of −8.7‰. The precipitation δ18O over Central Asia was related to environmental variables. The δ18O had a significant positive correlation with temperature, and the δ18O-temperature gradient ranged from 0.28‰/°C to 0.68‰/°C. However, the dependence of δ18O on precipitation was unclear; a significant precipitation effect was only observed at the Zhangye and Teheran stations, showing δ18O-precipitation gradients of 0.20‰/mm and −0.08‰/mm, respectively. Latitude and altitude were always significantly correlated with annual δ18O, when considering geographical controls on δ18O, with δ18O/LAT and δ18O/ALT gradients of −0.42‰/° and −0.001‰/m, respectively. But both latitude and longitude were significantly correlated with δ18O in winter. The relationship between δ18O and large-scale atmospheric circulation suggested that the moisture in Central Asia is mainly transported by westerly circulation and is indirectly affected by the Indian monsoon. Meanwhile, the East Asian monsoon may affect the precipitation δ18O content in westerly and monsoon transition regions. These results improve our understanding of the precipitation δ18O and moisture transport in Central Asia, as well as the paleoclimatology and hydrology processes in Central Asia.
Introduction
Stable water isotopes, including δ18O, and δ2H, are critical indicators of global and regional water cycles and paleoclimatic investigations improve our understanding of hydrological and atmospheric processes (Dansgaard, 1964; Craig & Gordon, 1965; Song et al., 2007; Sophocleous, 2002; Zhang et al., 2004; Yao et al., 2013). Precipitation is a critical variable of the global hydrological cycles. The isotope composition of precipitation from different sources varies and can be used as natural tracers to determine the sources and moisture transport of water vapor as well as water cycle processes in different climatic regions (Yamanaka et al., 2007; Li et al., 2012; Dansgaard, 1953; Chen, 2014; Zhang & Wang, 2016).
In 1961, the International Atomic Energy Agency (IAEA), in conjunction with the World Meteorological Organization (WMO), initiated the Global Network of Isotopes in Precipitation (GNIP) on a global scale to survey the stable hydrogen and oxygen isotope and tritium composition in precipitation. The number of observation stations has since gradually increased. In terms of the spatial distribution, the GNIP observation stations are mainly concentrated in low-latitude wet regions, with few stations inland and in arid regions. For example, there are only ten GNIP stations that record δ18O in Central Asia and surrounding regions, including three stations in the arid region of Northwest China (i.e., the Urumqi, Hetian, and Zhangye stations) (Gu, 2012). However, most recording stopped in the mid-1990s (Liu et al., 2014) and information on the stable isotope composition of precipitation in Central Asia and the surrounding regions is limited.
Since the 1980s, China has become expert in the observation and investigation of stable isotope compositions in precipitation, mostly focusing on the Tibetan Plateau (Gao et al., 2011; Tian et al., 1997; Tian et al., 2001; Yao et al., 2006). Similar to the GNIP database, the Tibetan Network for Isotopes in Precipitation (TNIP) was established to observe and monitor the Tibetan Plateau and the surrounding regions; the China Network of Isotopes in Precipitation and Rivers (CHIRP) was developed for nationwide observation (Yao, 2009; Liu et al., 2014). In 2004, the Chinese Network of Isotopes in Precipitation (CHNIP) was started by the Chinese Ecosystem Research Network (CERN) (Song et al., 2007). However, there were only two CHNIP stations in Northwest China (the Fukang and Cele stations). An observation network was established in 2012 around the Tianshan Mountains (TSNIP) to investigate the types of precipitation isotopes in the high mountains over Central Asia (Wang et al., 2016).
Few studies have investigated precipitation isotopes around the Tibetan Plateau and Northwest China. Using observations and simulations, Yao et al. (2013) systematically examined the spatial-temporal distribution of precipitation δ18O over the Tibetan Plateau and determined its relationship with the mechanisms of the westerlies, Indian monsoons, and transitions in between.
Central Asia is one of the largest arid regions in the world and includes five Central Asian countries and the arid region of Northwest China. The topography is complex, with desert and oases coexisting. Precipitation is the main source of water for the mountainous regions but is unevenly distributed (Chen, 2012; Yao et al., 2014). The moisture source, transport path, and atmospheric processes are complex and are particularly sensitive to climate change in the unique mountain-basin structure of Central Asia (Chen, 2014). Few studies have reported the changes and mechanisms of moisture transport processes in Central Asia (Huang et al., 2015, 2018; Shi & Sun, 2008; He et al., 2016; Chen et al., 2010; Yao et al., 2020). Previous studies have mainly focused on the effects of spatial-temporal characteristics, compositions, and climatic controls on precipitation isotopes on a regional scale, such as in the Tianshan Mountains and at Urumqi station (Yao et al., 1999; Kong, Pang & Froehlich, 2013; Kong & Pang, 2016; Liu et al., 2015; Wang et al., 2016, 2017; Zhang & Wang, 2018). However, only a few studies have been conducted on the composition of stable isotopes in the precipitation over the Central Asian region.
Central Asia has a unique water cycle and complex moisture transport processes. We compiled a database of information from 47 stations to evaluate precipitation δ18O over Central Asia to reveal its spatial-temporal characteristics. We determined the relationships between precipitation δ18O and local factors, such as geography (latitude and altitude) and climatic parameters (temperature and precipitation). We also investigated the relationship between δ18O and large-scale atmospheric circulation.
Materials & methods
We studied the precipitation isotopes data (δ18O and δ2H) from Central Asia to comprehensively evaluate the processes and characteristics of the composition of the stable isotopes in the precipitation of that region.
From the observed monthly precipitation, δ18O and δ2H was obtained from 47 observation stations over Central Asia, including 12 stations of the GNIP, 22 stations of the TSNIP (Wang et al., 2016), two TNIP stations (Yao et al., 2013), two CHNIP stations (Liu et al., 2014), and nine stations from reference studies (Fig. 1 and Table 1).
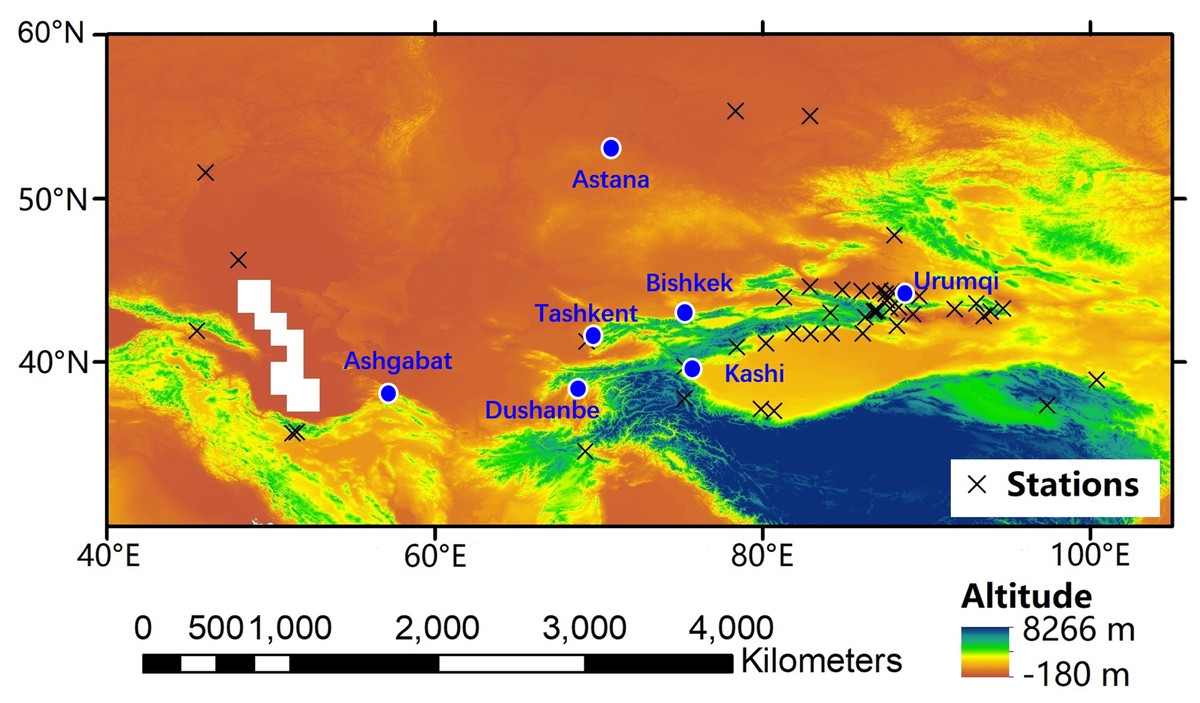
Figure 1: Locations of the sampling stations over Central Asia.
| No | Station | Latitude (°N) | Longitude (°E) | Altitude (m) | Precipitation (mm) | Temperature (°C) | Database |
|---|---|---|---|---|---|---|---|
| 1 | Urumqi | 43.78 | 87.62 | 918 | 304 | 7.4 | GNIP |
| 2 | Hetian | 37.13 | 79.93 | 1375 | 209 | 9.1 | GNIP |
| 3 | Zhangye | 38.93 | 100.43 | 1483 | 154 | 7.8 | GNIP |
| 4 | Kabul | 34.57 | 69.21 | 1860 | 330 | 11.6 | GNIP |
| 5 | Barabinsk | 55.33 | 78.37 | 120 | 389 | 1 | GNIP |
| 6 | Astrakhan | 46.25 | 48.03 | −18 | 228 | 10.5 | GNIP |
| 7 | Saratov | 51.56 | 46.03 | 166 | 490 | 6.6 | GNIP |
| 8 | Teheran | 35.68 | 51.32 | 1,200 | 227 | 16.7 | GNIP |
| 9 | Tashkent | 41.27 | 69.27 | 428 | 478 | 13.9 | GNIP |
| 10 | Teheran East | 35.74 | 51.58 | 1,350 | 297 | 15.4 | GNIP |
| 11 | Novosibirsk | 55.03 | 82.9 | 162 | 479 | 2.5 | GNIP |
| 12 | Telavi | 41.93 | 45.48 | 590 | 679 | 13.1 | GNIP |
| 13 | Taxkorgen | 37.77 | 75.27 | 3,100 | 115 | 1.6 | TNIP |
| 14 | Delingha | 37.37 | 97.37 | 2,981 | 186 | 2.2 | TNIP |
| 15 | Fukang | 44.29 | 87.93 | 460 | 167 | 7.5 | CHNIP |
| 16 | Cele | 37.02 | 80.73 | 1,306 | 51 | 12.9 | CHNIP |
| 17 | Yining | 43.95 | 81.33 | 662.5 | 298.9 | 9.5 | TSNIP |
| 18 | Jinghe | 44.62 | 82.9 | 320.1 | 112.1 | 8.2 | TSNIP |
| 19 | Kuytun | 44.4 | 84.87 | 562 | 183.5 | 8.5 | TSNIP |
| 20 | Shihezi | 44.32 | 86.05 | 442.9 | 226.9 | 7.8 | TSNIP |
| 21 | Caijiahu | 44.2 | 87.53 | 440.5 | 153.8 | 6.5 | TSNIP |
| 22 | Qitai | 44.02 | 89.57 | 793.5 | 200.9 | 5.4 | TSNIP |
| 23 | Wuqia | 39.72 | 75.25 | 2,175.7 | 188.7 | 7.7 | TSNIP |
| 24 | Akqi | 40.93 | 78.45 | 1,984.9 | 237.7 | 6.8 | TSNIP |
| 25 | Bayinbuluke | 43.03 | 84.15 | 2,458 | 280.5 | −4.2 | TSNIP |
| 26 | Baluntai | 42.73 | 86.3 | 1,739 | 220.4 | 7 | TSNIP |
| 27 | Balikun | 43.57 | 93.05 | 1,677.2 | 230.5 | 2.7 | TSNIP |
| 28 | Yiwu | 43.27 | 94.7 | 1,728.6 | 104.4 | 4.2 | TSNIP |
| 29 | Aksu | 41.17 | 80.23 | 1,103.8 | 80.4 | 10.8 | TSNIP |
| 30 | Baicheng | 41.78 | 81.9 | 1,229.2 | 136.6 | 8.2 | TSNIP |
| 31 | Kuqa | 41.72 | 82.97 | 1,081.9 | 76.7 | 11.3 | TSNIP |
| 32 | Luntai | 41.78 | 84.25 | 976.1 | 78.6 | 11.6 | TSNIP |
| 33 | Korla | 41.75 | 86.13 | 931.5 | 59.2 | 12 | TSNIP |
| 34 | Kumux | 42.23 | 88.22 | 922.4 | 59.9 | 9.8 | TSNIP |
| 35 | Dabancheng | 43.35 | 88.32 | 1,103.5 | 76.7 | 6.9 | TSNIP |
| 36 | Turpan | 42.93 | 89.2 | 34.5 | 15.4 | 15.1 | TSNIP |
| 37 | Shisanjianfang | 43.22 | 91.73 | 721.4 | 22.6 | 12.5 | TSNIP |
| 38 | Hami | 42.82 | 93.52 | 737.2 | 43.7 | 10.3 | TSNIP |
| 39 | UG1 | 43.1 | 86.84 | 3,693 | 460 | −5.6 | TGS |
| 40 | Zongkong | 43.11 | 86.89 | 3,404 | 400 | −4.6 | TGS |
| 41 | Daxigou | 43.11 | 86.86 | 3,539 | 458 | −5 | TGS |
| 42 | Altay | 47.73 | 88.08 | 735 | 193 | 4.5 | Tian et al., 2001 |
| 43 | Gaoshan | 43.1 | 86.83 | 3,545 | 390 | −4.3 | Kong, Pang & Froehlich, 2013 |
| 44 | Houxia | 43.28 | 87.8 | 2,100 | 424 | 1.5 | Kong, Pang & Froehlich, 2013 |
| 45 | Yuejinqiao | 43.12 | 87.05 | 2,526 | 330 | −2.5 | Yao et al., 1999 |
| 46 | Yingxiongqiao | 44.37 | 87.2 | 1,920 | 210 | 2.3 | Sun et al., 2015 |
| 47 | Yushugou | 43.08 | 93.95 | 1,670 | 94.3 | 18.6 | Wang et al., 2015 |
Note:
GNIP, Global Network of Isotopes in Precipitation; TNIP, Tibetan Network for Isotopes in Precipitation; CHNIP, Chinese Network of Isotopes in Precipitation; TSNIP, Tianshan Network of Isotopes in Precipitation; and TGS, Tianshan Glaciological Station, Chinese Academy of Sciences.
The Kabul station had the longest data record, with monthly data starting in the 1960s and continuous data for 1962–1964, 1967–1975, and 1982–1989. The Urumqi station kept monthly data starting in 1986 and had continuous data for 1961–1976, 1979–1981, 1986–1987, and 2000–2004. Among the stations from which data was collected, five GNIP stations (Teheran, Kabul, Astrakhan, Urumqi, and Zhangye stations) took samples for more than 10 years and data were available for interannual variability studies (Fig. 1). Furthermore, eight GNIP stations (Teheran, Kabul, Saratov, Barabinsk, Astrakhan, Urumqi, Hetian, and Zhangye stations) were sampled for more than 30 months and data were available to evaluate the relationship of precipitation δ18O with temperature and precipitation over Central Asia (Fig. 1). Spatial patterns of observed precipitation δ18O over Central Asia were available from all stations. All precipitation δ18O data were employed with respect to the Vienna Standard Mean Ocean Water (VSMOW) and were shown in precipitation amount-weighted values. In addition, meteorological variables, including precipitation amount and air temperature, were recorded at each observation station.
The precipitation δ18O was determined by atmospheric characteristics and their dynamics. We selected three atmospheric characteristic indices to discuss their effects on the precipitation δ18O over Central Asia, including the westerly circulation index (WCI), East Asian summer monsoon index (EASMI), and Indian monsoon index (IMI). Monthly EASMI and IMI were obtained from Dr. Jianping Li’s webpage (http://ljp.gcess.cn/dct/page/65610) (Li & Zeng, 2002, 2003).
Temperature averages are calculated for monthly/annual analyses, and the corresponding precipitation amounts are calculated as monthly/annual data for each observation station. A stepwise linear regression analysis technique was employed to fit the precipitation δ18O with geographical parameters. The following geographical parameters were considered: altitude (ALT, m), latitude (LAT, °N), and longitude (LON, °E). The Pearson correlation coefficient was used to investigate the relationship between precipitation δ18O and meteorological variables or atmospheric circulation indices.
Results and discussion
Local meteoric water lines (MWL)
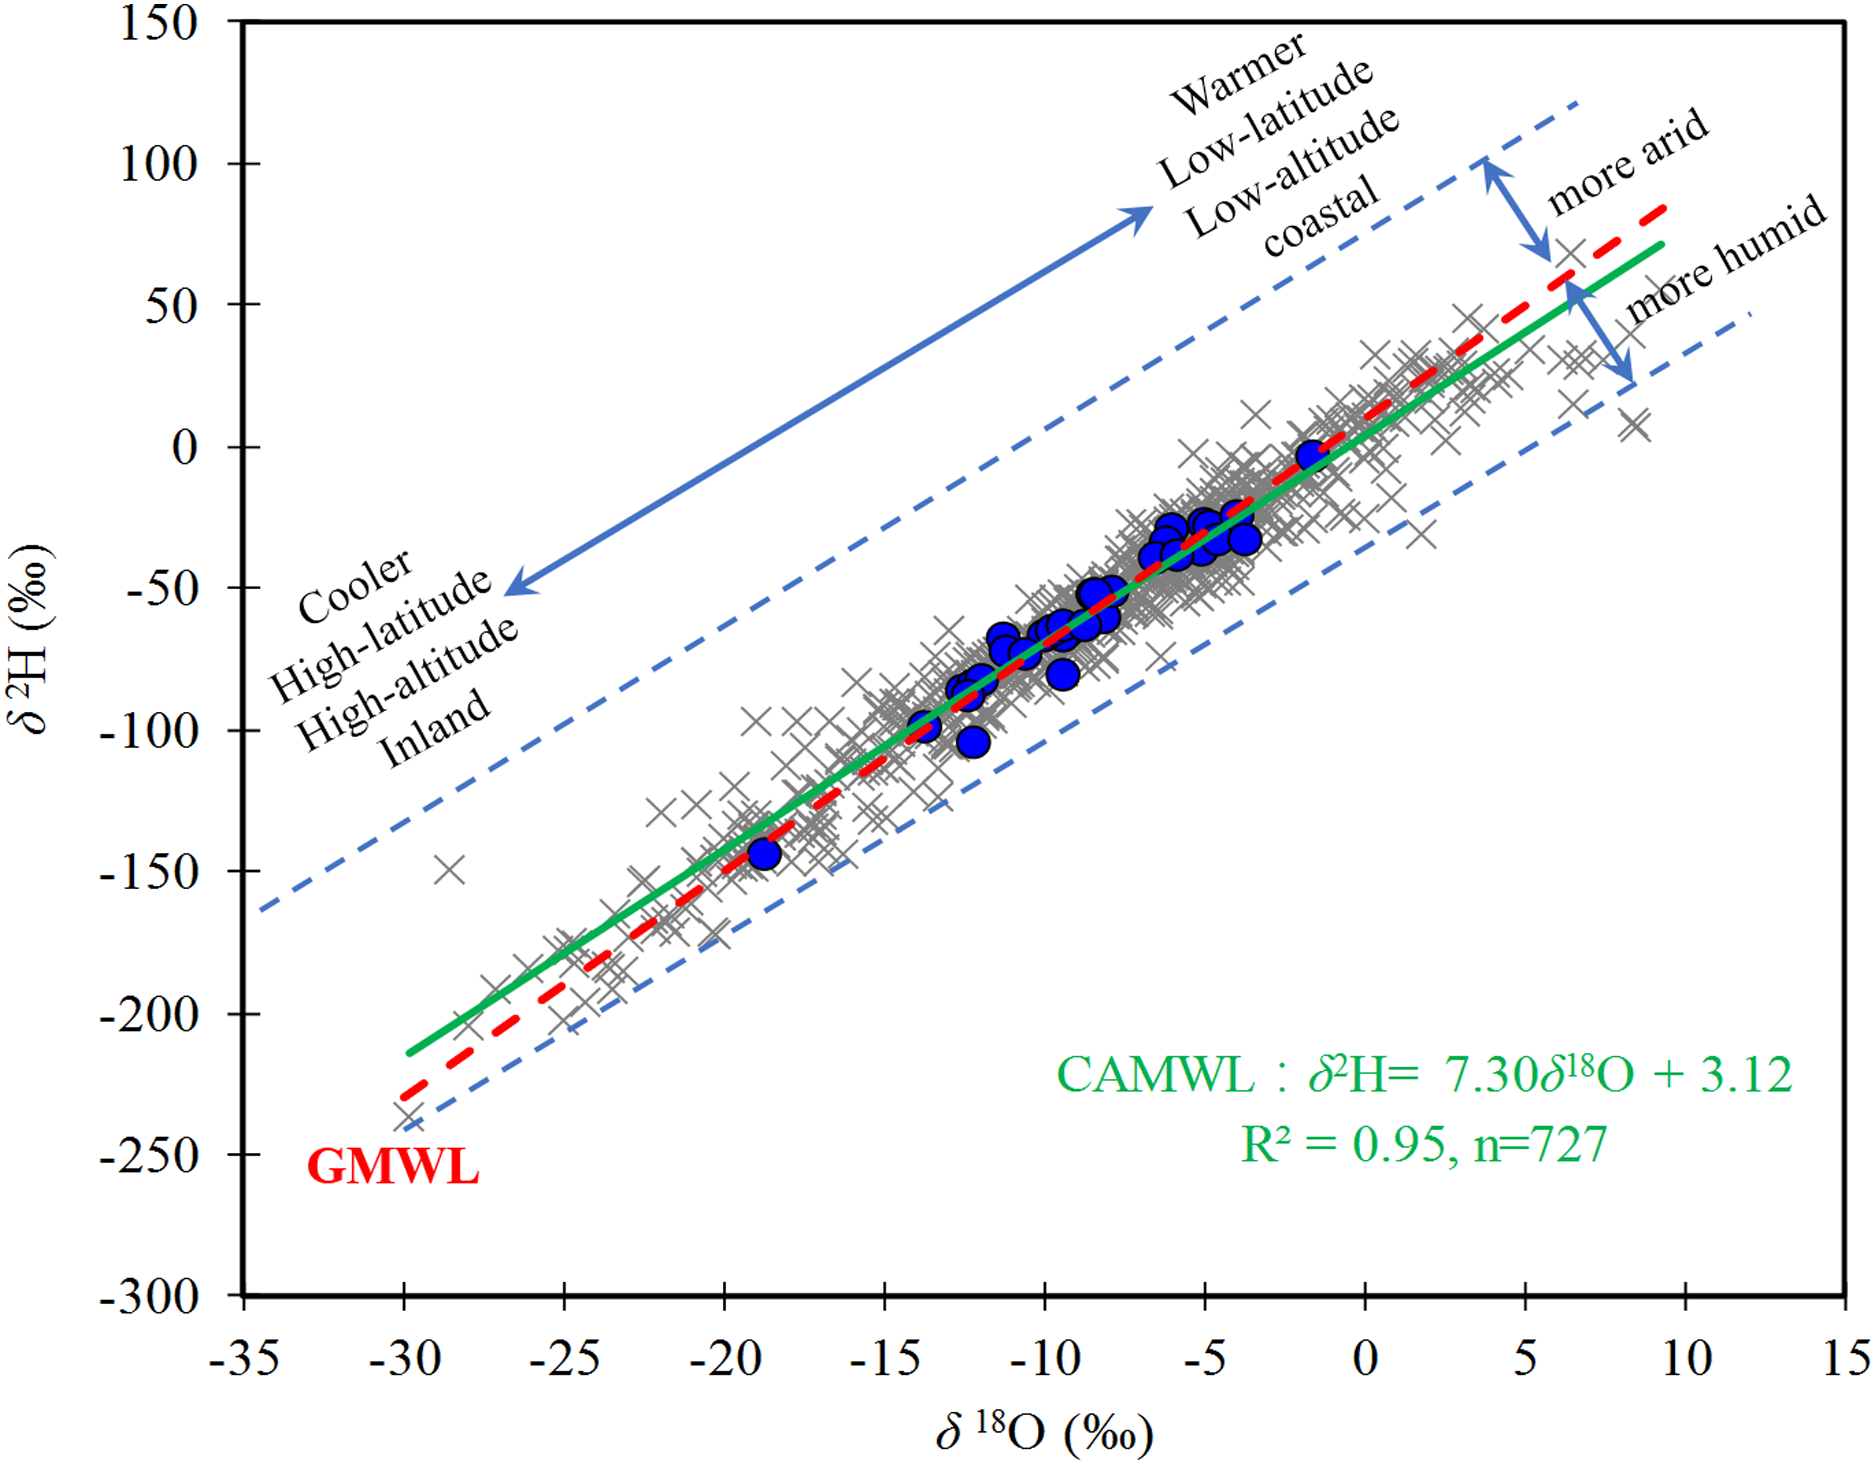
The local meteoric water lines (MWLs) of precipitation, δ2H, and δ18O, provide important information on the water cycle, water vapor sources, and water transport (Jonesl, Leng & Arrowsmith, 2007; Lutz, Thomas & Panorska, 2011). A Central Asia MWL (CAMWL) was established as δ2H = 7.30δ18O + 3.12 (R2 = 0.95, n = 727, p < 0.01, R is the Pearson correlation coefficient) (Fig. 2) based on 727 precipitation groups. The slope of the CAMWL was slightly lower than that of the global MWL (GMWL), which was eight (Craig, 1961) and the Chinese MWL of 7.48 (Liu et al., 2014). Differences in the local MWLs slope often occur because of deviations in humidity at the source of moisture or evaporation. Central Asia is located in the Eurasian hinterland, and has a significant variation in the annual cycle and alternating dry or wet seasons. A low LMWL slope is associated with non-equilibrium conditions that affect falling raindrops during dry conditions (Liu et al., 2014), leading to the potential for significant sub-cloud evaporation.
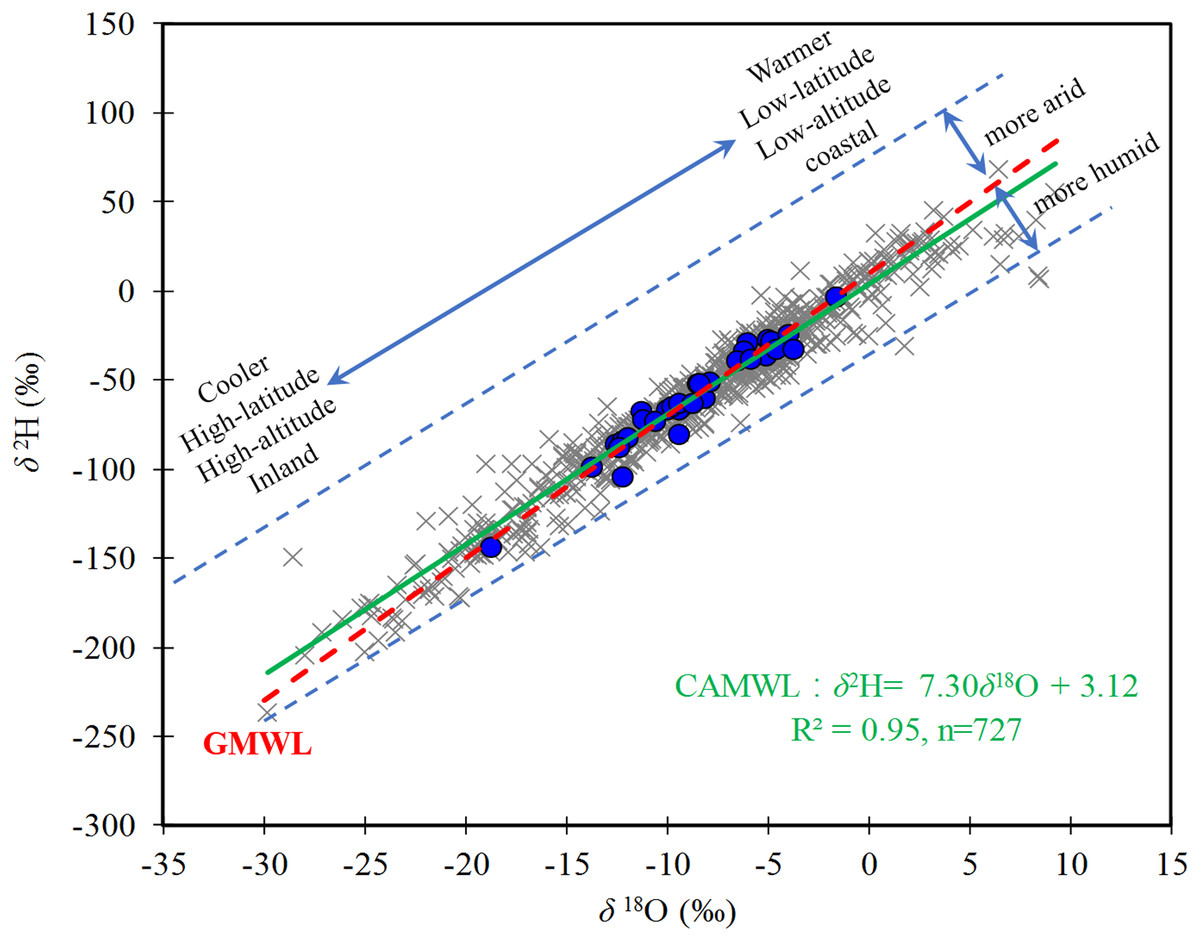
Figure 2: Linear δ2H–δ18O relationships (CAMWL) based on all precipitation measurements over Central Asia.
The precipitation δ18O over Central Asia ranged from +2‰ to −25.4‰ with a mean of −8.7‰, and δ2H ranged from −4.2 ‰ to −191.4‰ with a mean of −67.1 ‰.
Seasonal variations in precipitation δ18O
The arid Central Asian region is affected by monsoons and westerlies, resulting in annual differences in climatic variables and precipitation δ18O. The variation in the annual air temperature represents a continental climate. The maximum and minimum temperatures occur in July and January, respectively. In this study, the temperature variation was unimodal, and the precipitation amount represented three distribution types (Fig. 3). The three precipitation patterns observed in different regions are shown in Fig. 3. (1) Maximum precipitation in occurred in the summer, with summer precipitation accounting for 41.4% of the total precipitation. These stations (including Hetian, Zhangye, Barabinsk, and Urumqi stations) are mainly distributed in northern Central Asia and are primarily influenced by the intensity and location of the westerly circulation. (2) Maximum precipitation values in winter and spring, with winter and spring precipitation accounting for 39.6% and 37.8% of the total precipitation, respectively, while the summer precipitation accounted for only 6.4% of the total precipitation. These stations (including the Kabul and Teheran stations) are mainly located in southern Central Asia and are primarily influenced by the Indian monsoon. (3) A well-distributed seasonal precipitation pattern was observed at Astrakhan and Saratov stations. These are present in northwestern Central Asia and are primarily influenced by airflow from the Arctic. This result also highlighted the complexity of the spatial–temporal variations in precipitation in Central Asia.
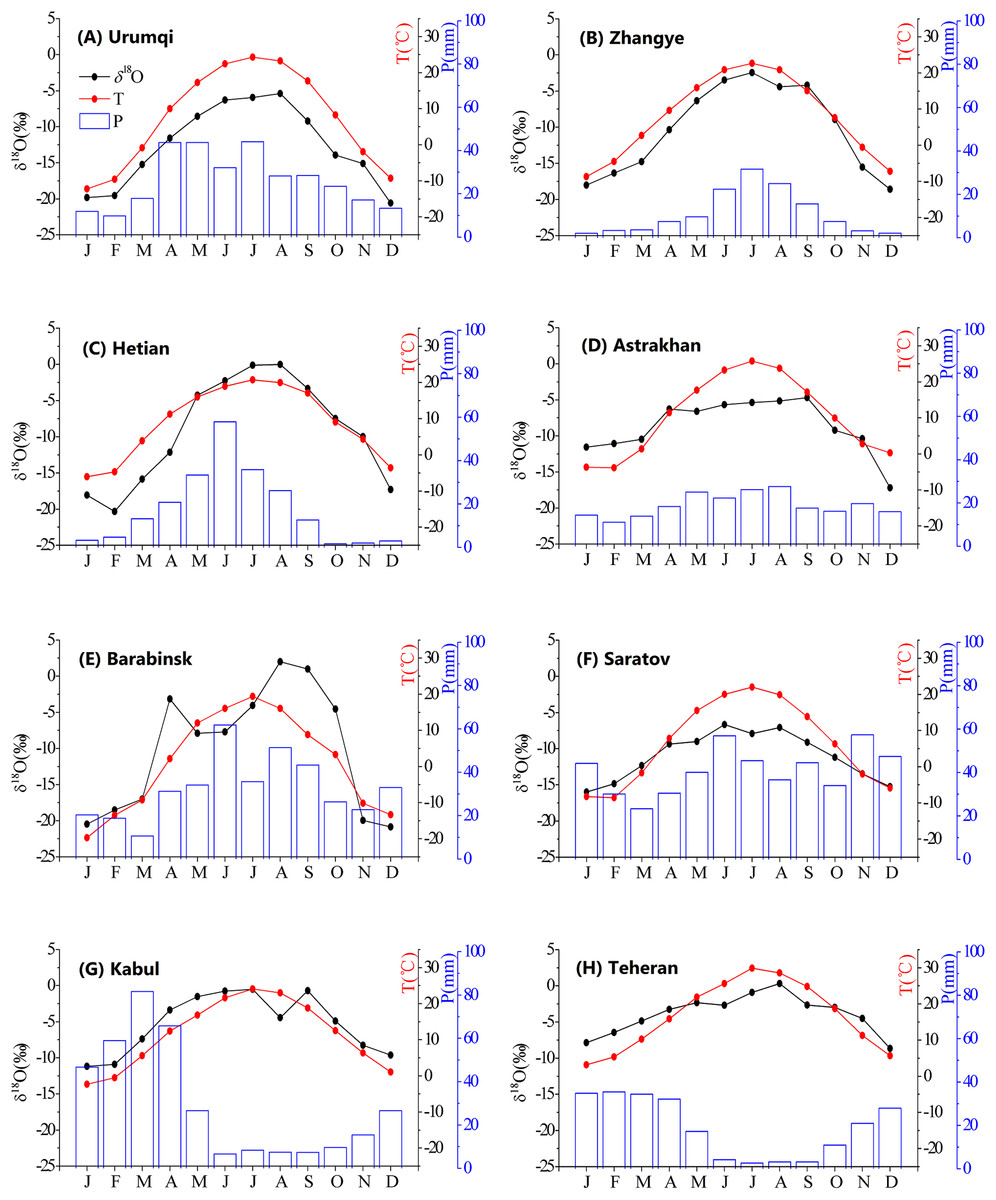
Figure 3: Seasonal patterns of observed precipitation δ18O, precipitation amount (P), and temperature (T) at different stations (A–H).
For each station, data were averaged over the observation periods.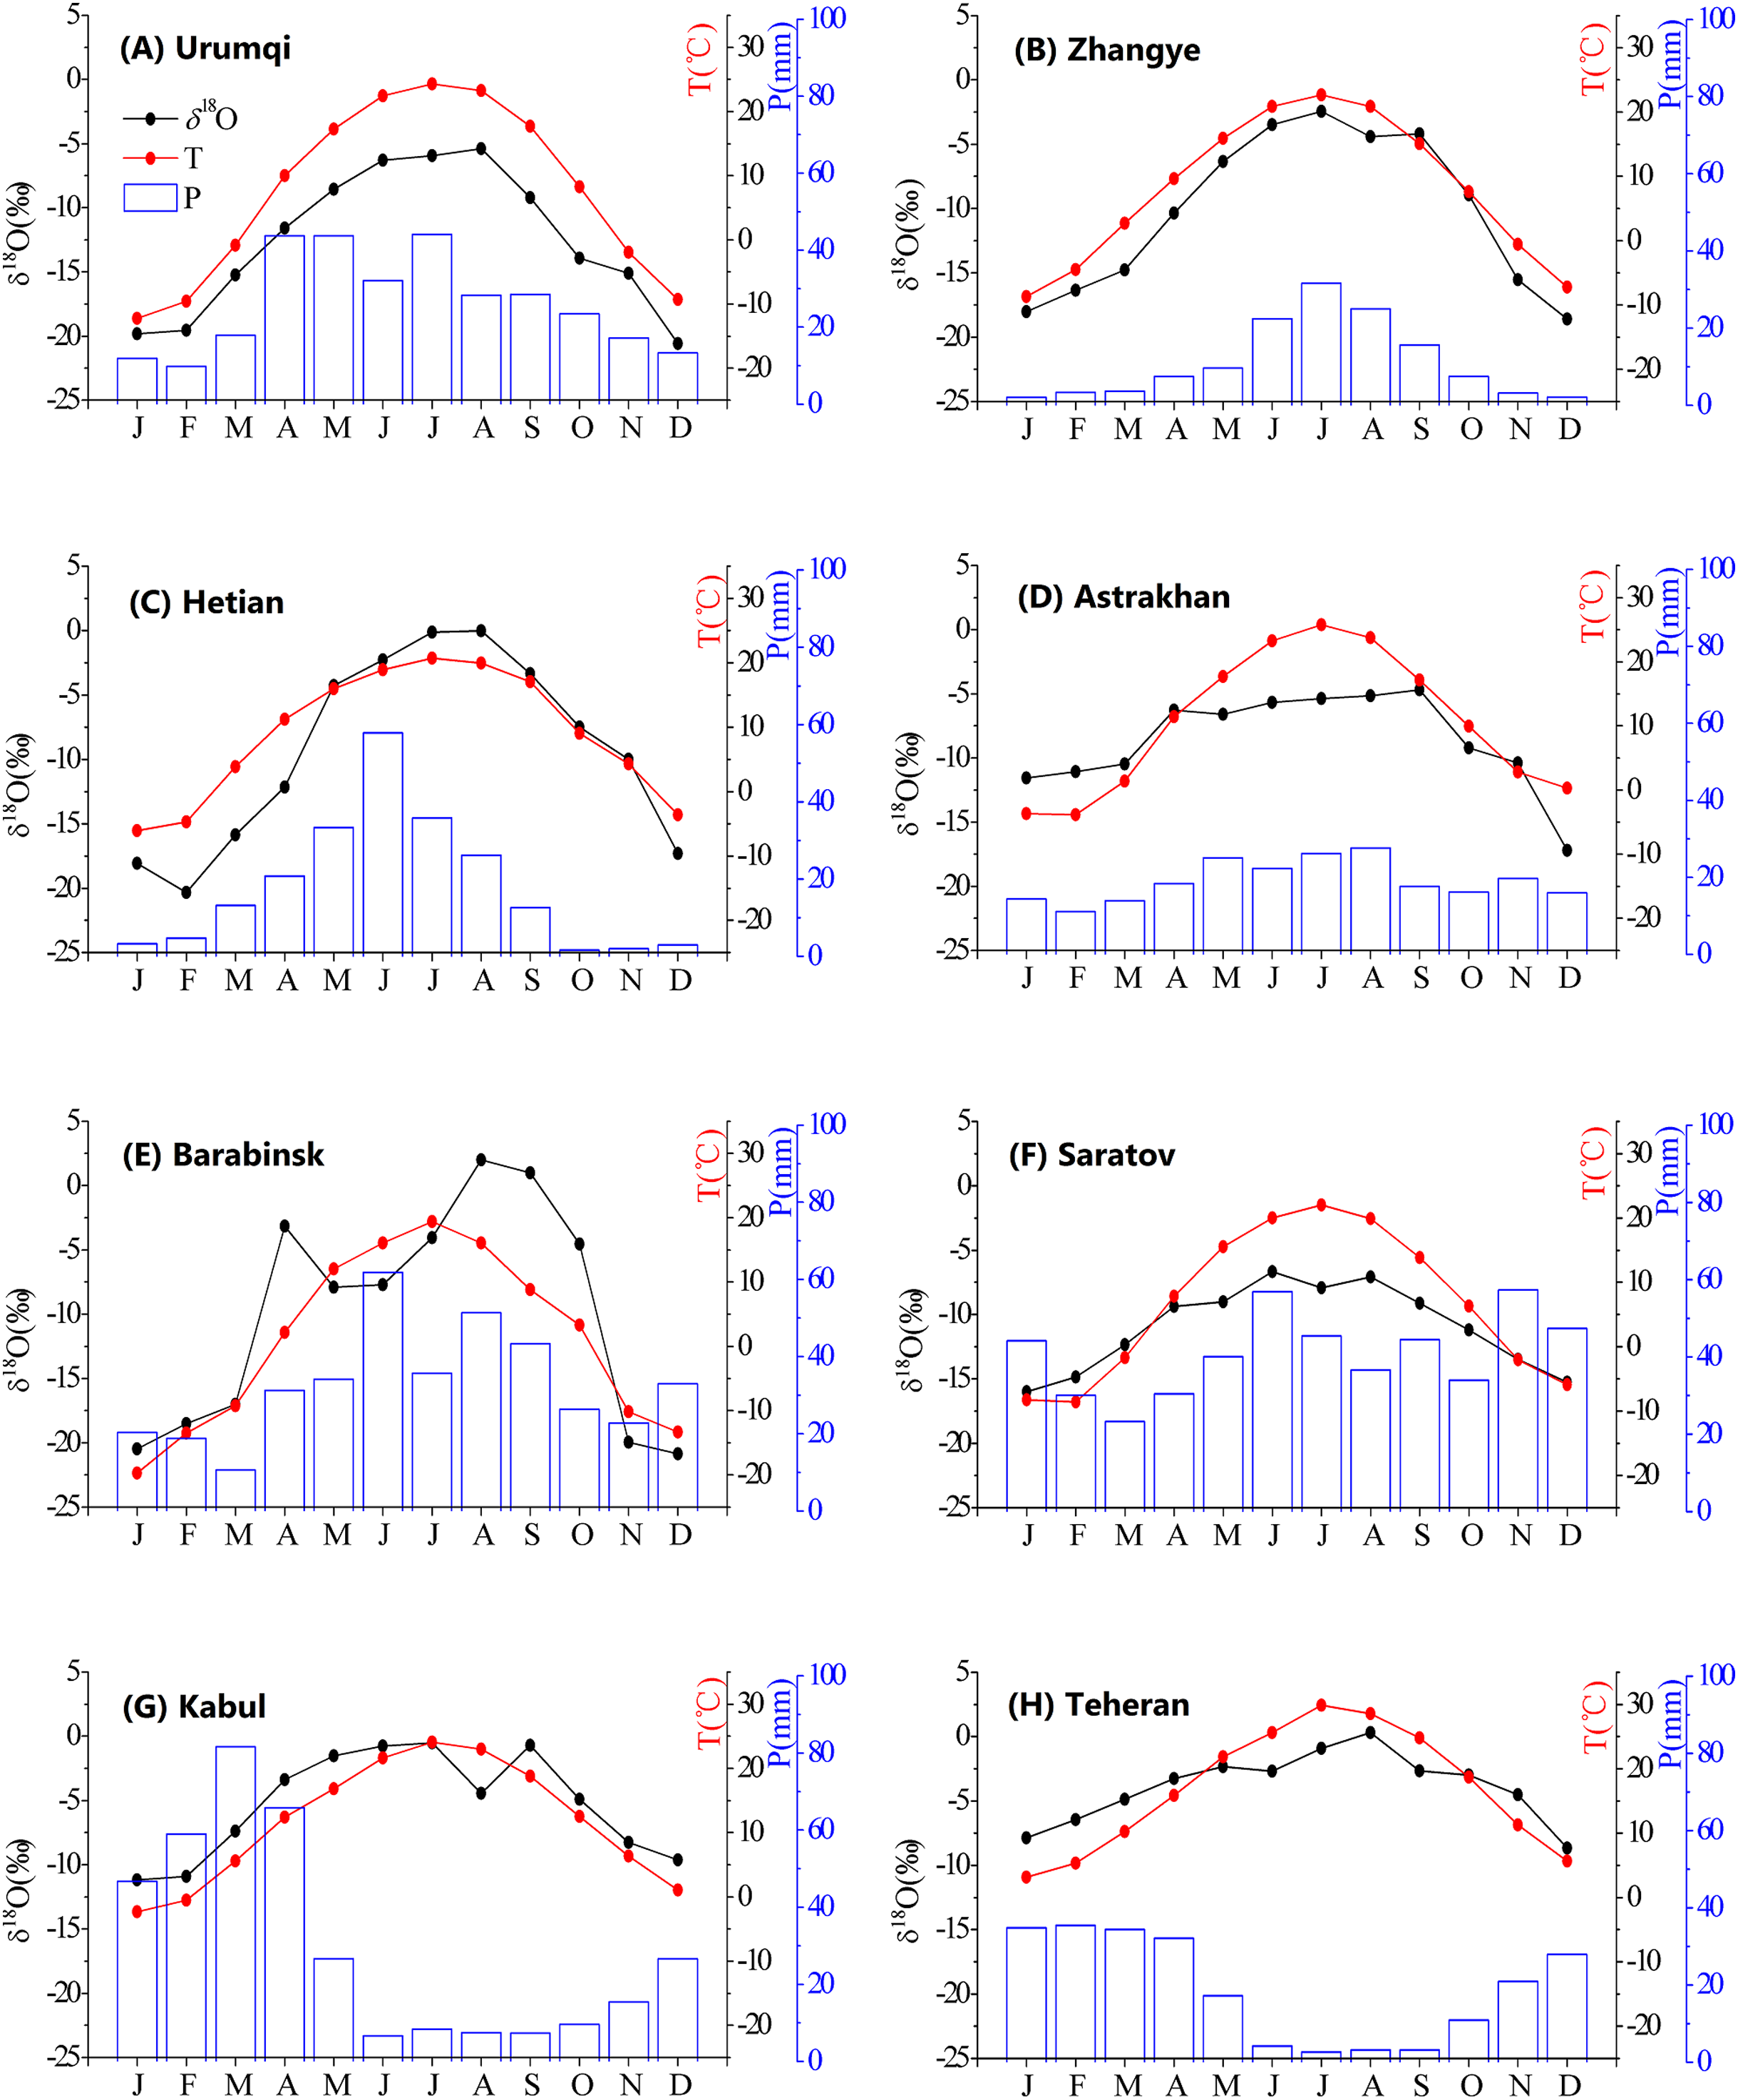
The annual temperature and precipitation influenced the annual precipitation δ18O cycle. The maximum δ18O occurred from June to August (JJA). Maximum precipitation δ18O at the Urumqi, Hetian, Barabinsk, and Teheran stations were −5.4‰, 0‰, 2‰, and −0.3‰ in August, respectively. The maximum values at the Zhangye and Kabul stations occurred in July. The maximum values occurred in June and September, respectively, at the Saratov and Astrakhan stations. All minimum values occurred from December to February (DJF). Therefore, the δ18O content in precipitation was higher in summer than in winter, and the seasonal pattern of the δ18O in precipitation reflected the climate regime during the annual cycle. In winter, air masses were relatively cold and dry and the amount of precipitation was very low, while in summer, the opposite was true.
Spatial characteristics of precipitation δ18O
Figure 4 shows the spatial distribution of precipitation δ18O throughout the year, and for summer and winter seasons at each station in Central Asia. The maximum value of the annual mean δ18O (−1.47‰) was at Cele station, located in southern Xinjiang, and the minimum value (−18.6‰) was observed at Hami station. For the summer months, the maximum δ18O value (2.8 ‰) was observed at Cele station, and the minimum value (−13.4‰) was observed at Altay station, located in northeastern Central Asia. The maximum δ18O value (−7.7 ‰) during the winter months was observed at the Teheran station, located in southern Central Asia, and the minimum value (−35.3‰) was observed at the Dabancheng station.
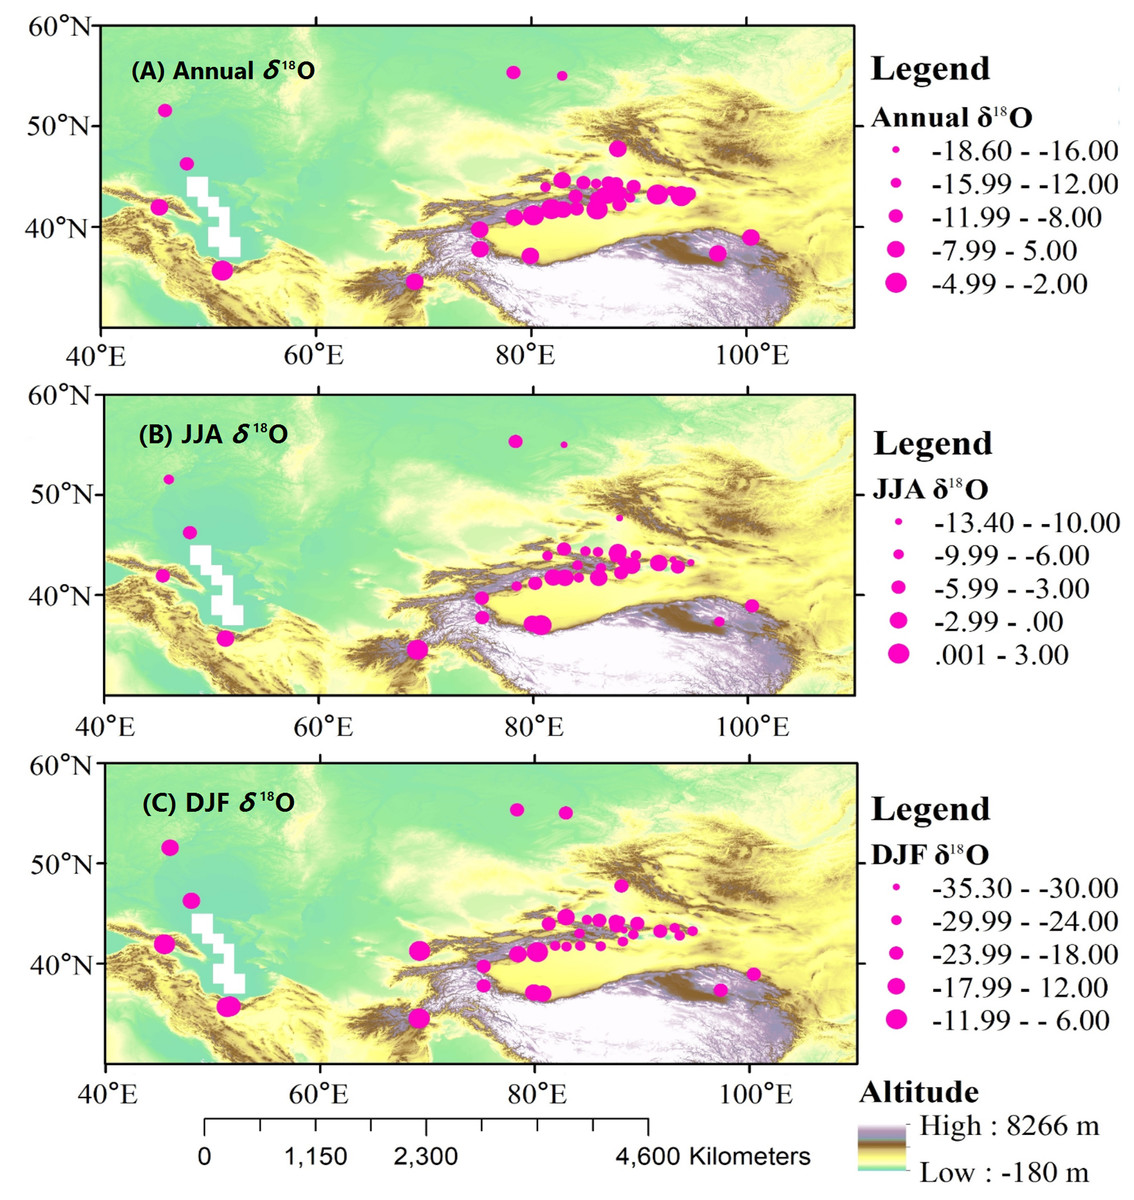
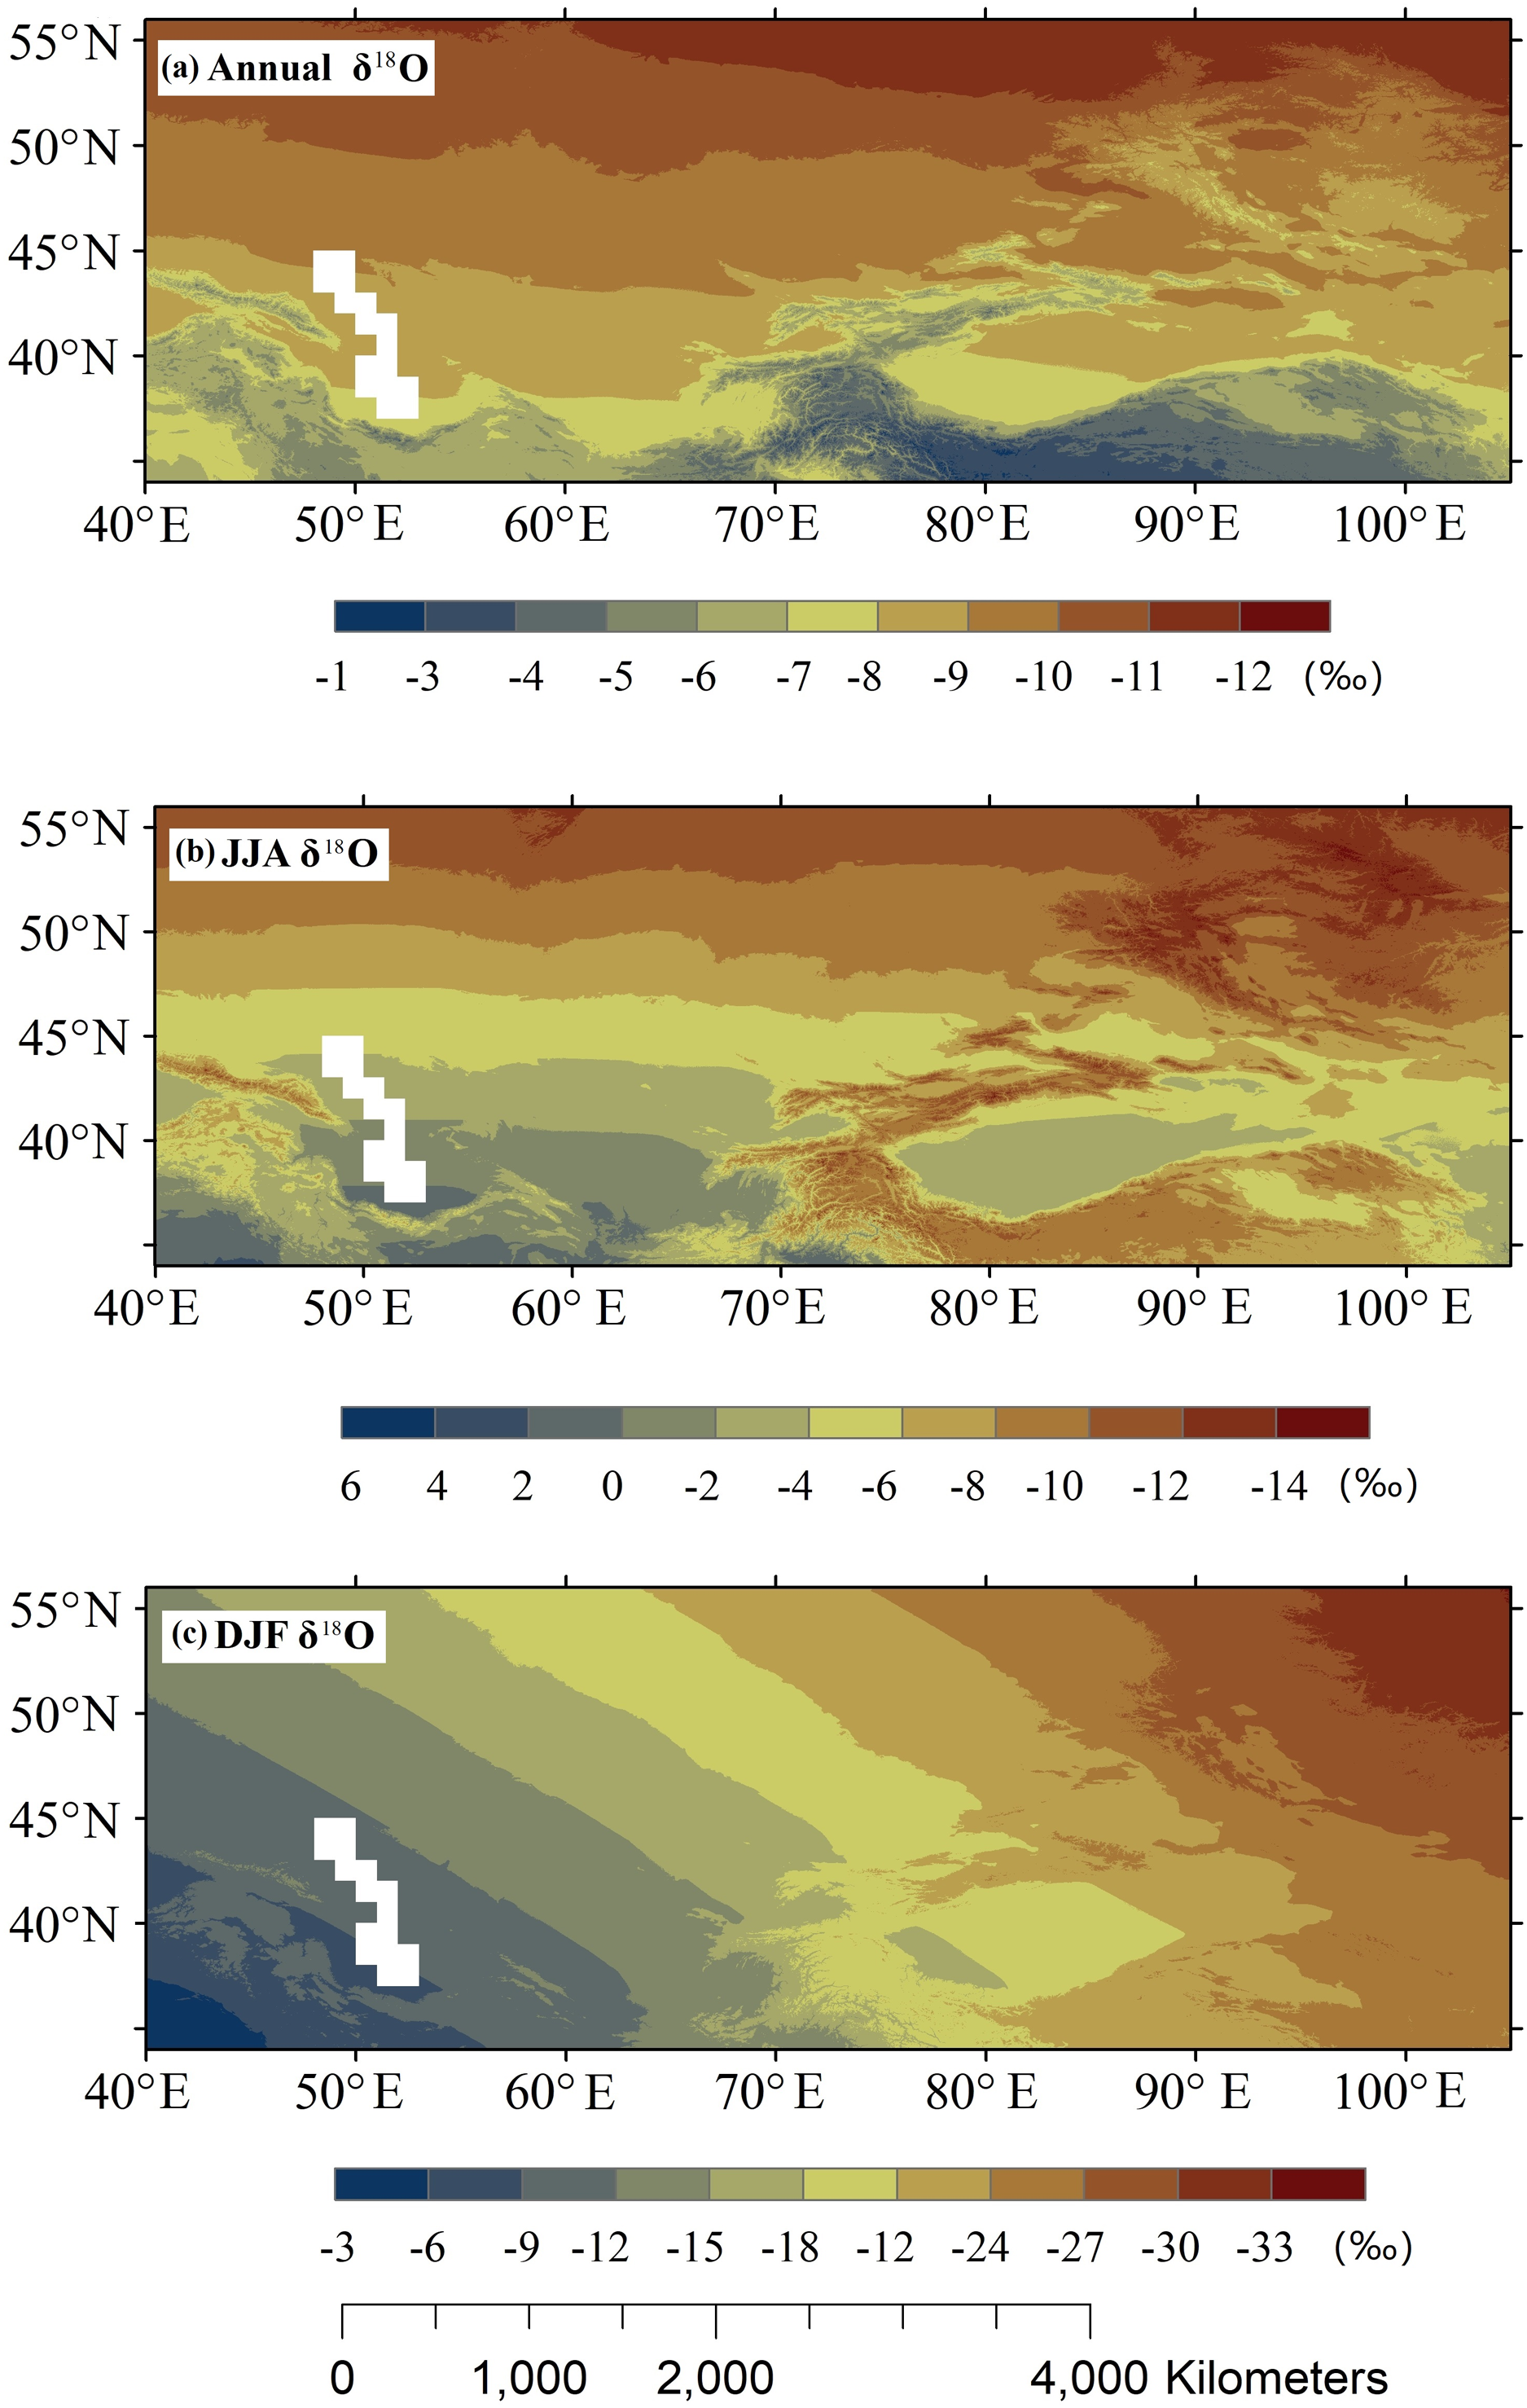
Figure 4: Spatial patterns of annual (A), JJA (B), and DJF (C) observed precipitation δ18O at meteorological stations over Central Asia.
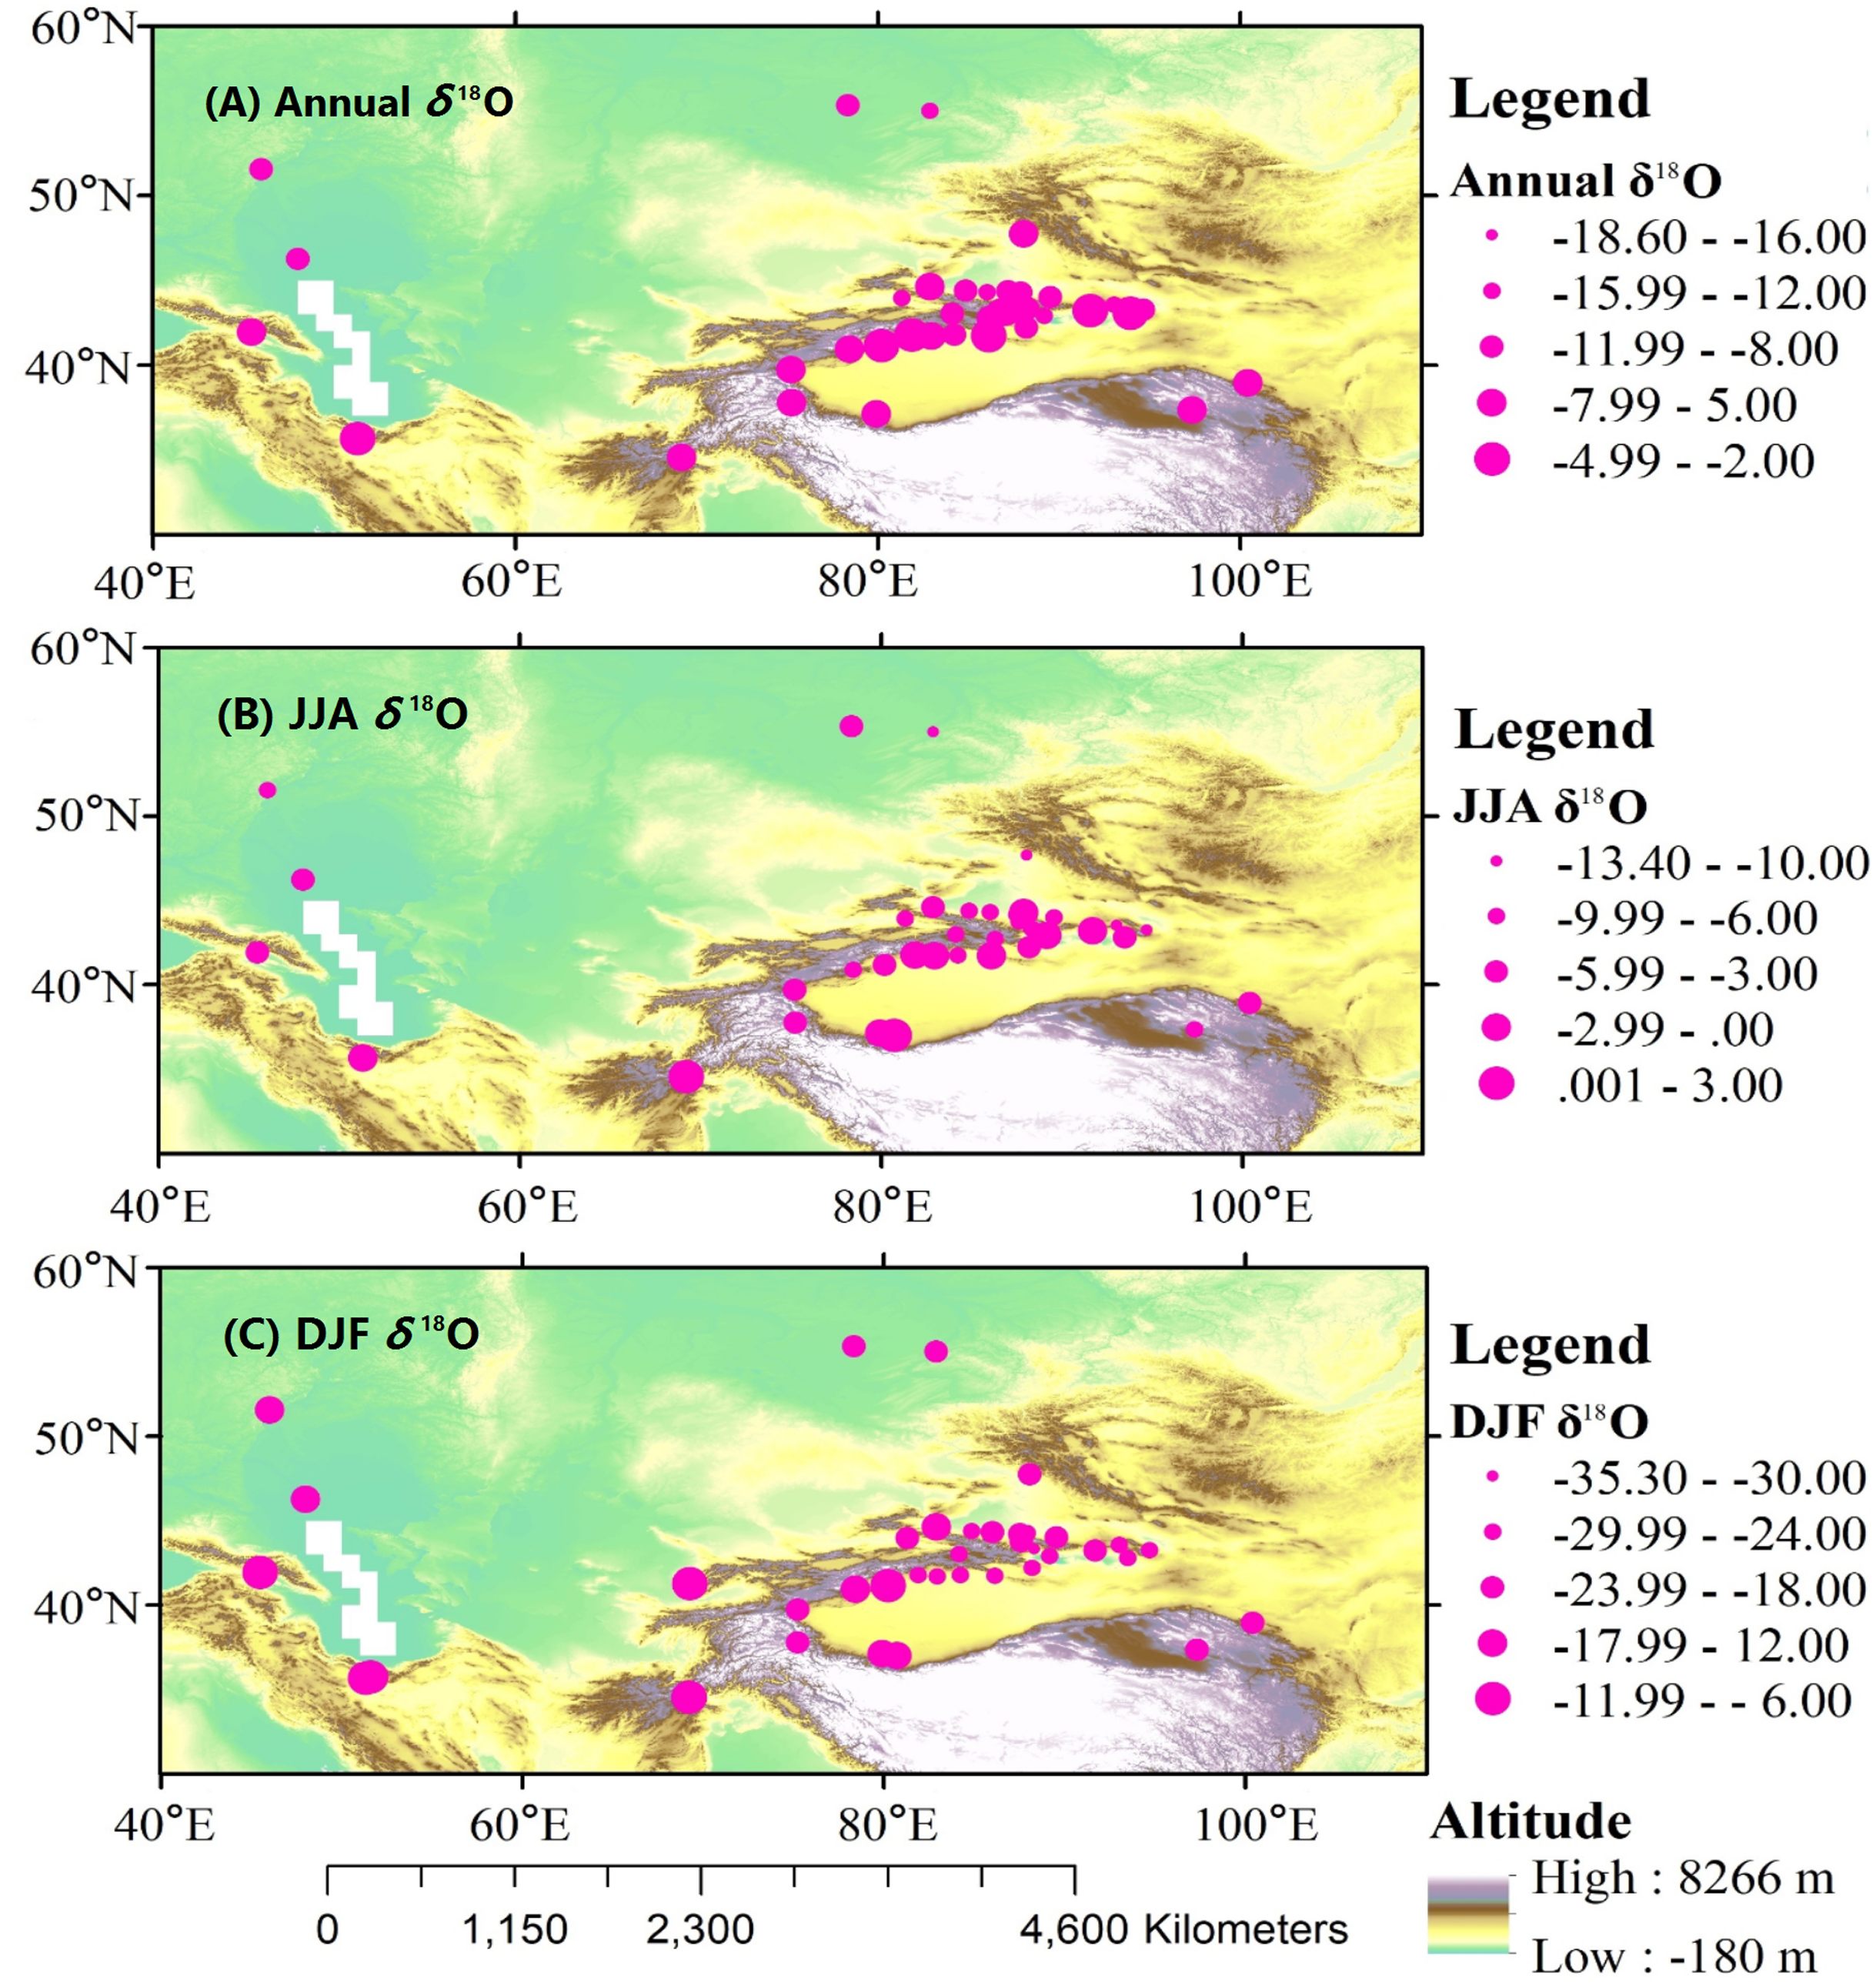
There were remarkable spatial differences in precipitation δ18O over Central Asia. The spatial distribution of precipitation δ18O was mainly affected by the thermodynamics of water vapor condensation during the Rayleigh fractionation process and included meteorological elements, water vapor transport, and geographic factors (Dansgaard, 1964; Yurtsever & Gat, 1981; Rozanski, Araguas-Araguas & Gonfiantini, 1993).
Several studies have verified that altitude and latitude are the main geographic factors that affect changes in temperature and water vapor condensation, and can be referred to as geographic factor effects of precipitation δ18O (Liu, Tian & Yao, 2009; Yao et al., 2013). The correlation of precipitation δ18O with latitude, altitude, and longitude was investigated using partial correlation analysis, and the R were 0.53 (p < 0.05), 0.32 (p < 0.05), and 0.17 (p > 0.05), respectively, indicating that latitude is the most significant factor. In summer, latitude was significantly correlated with precipitation δ18O (R = 0.54, p < 0.05), while both latitude and longitude were significantly correlated with precipitation δ18O in winter (R = 0.31, p < 0.05; R = 0.67, p < 0.01, respectively). For the annual δ18O, the δ18O/LAT gradient was −0.42‰/°, implying that the precipitation δ18O was reduced by approximately 0.42‰ for every one-degree variation in latitude, which was larger than the gradient in China (−0.22‰/°). Similarly, the δ18O/ALT gradient was −0.001‰/m, which was lower than the global value of −0.0022‰/m and the value of −0.0016‰/m in China (Liu, Tian & Yao, 2009; Bowen & Wilkinson, 2002). In Central Asia, altitudes range from −18 to 4,200 m, with a complex topography and various climatic characteristics.
Several researchers have constructed models to explain the relationship between precipitation δ18O and geographic factors (Liu, Tian & Yao, 2009; Yao et al., 2013), including the Bowen and Wilkinson (BW) model (Bowen & Wilkinson, 2002). To confirm the effects of altitude and latitude on precipitation δ18O over Central Asia, we evaluated the relationship between precipitation δ18O and geographical factors using stepwise regression analysis.
In Central Asia, geographical controls on precipitation δ18O were best expressed by a stepwise linear regression, including altitude (ALT, m), latitude (LAT, °N) and longitude (LON, °E):
(1)
The best model accounting for JJA δ18O included both altitude (ALT, m) and latitude (LAT, °N):
(2)
The DJF δ18O model was expressed by linear regression as:
(3)
Our model comprehensively explained the effect of altitude, latitude, and longitude on precipitation δ18O over Central Asia, and revealed that the variation in precipitation δ18O depended on geographical factors at each station. These results showed that our models were suitable for use in Central Asia.
We used the aforementioned models to obtain the spatial distribution of precipitation δ18O over Central Asia (Fig. 5). The annual precipitation δ18O gradually decreased as the latitude increased (Fig. 5A). In the summer, higher δ18O values were observed in southwest Central Asia and lower δ18O values were observed in northern Central Asia and the Pan-Third Polar region (including the Tibetan Plateau, Iranian Plateau, and Tianshan Mountains) (Fig. 5B). This pattern shows the effects of latitude and altitude on precipitation δ18O. However, precipitation δ18O in Central Asia was higher than that in the Tibetan Plateau (Fig. 5B). This was mainly due to the transport of moist air originating from the Arabian Sea and the Bay of Bengal into Central Asia, which resulted in more summer precipitation (Zhao et al., 2014). A strong anti-cyclonic pattern was noted in the Arabian Sea, Indian subcontinent, and the Bay of Bengal, and was associated with a strong southerly flow controlling the Indian subcontinent and extending north up to the valley between the Iranian Plateau and Tibetan Plateau regions. Furthermore, the valley between the Iranian Plateau and the Tibetan Plateau is below 1,500 m, and the anomalous southerlies can transport moisture into Central Asia (Zhao et al., 2014; Zhao & Zhang, 2015). The cyclonic pattern observed in Central Asia was associated with this pattern, and an anomalous southwesterly wind may have transported moisture into Central Asia. Tian et al. (2001) indicated that there was a different moisture source between the northern and southern Tibetan Plateau, and that the northern limit of the summer monsoon was north of the Yarlung Zangbo River located in the middle of the Tibetan Plateau.
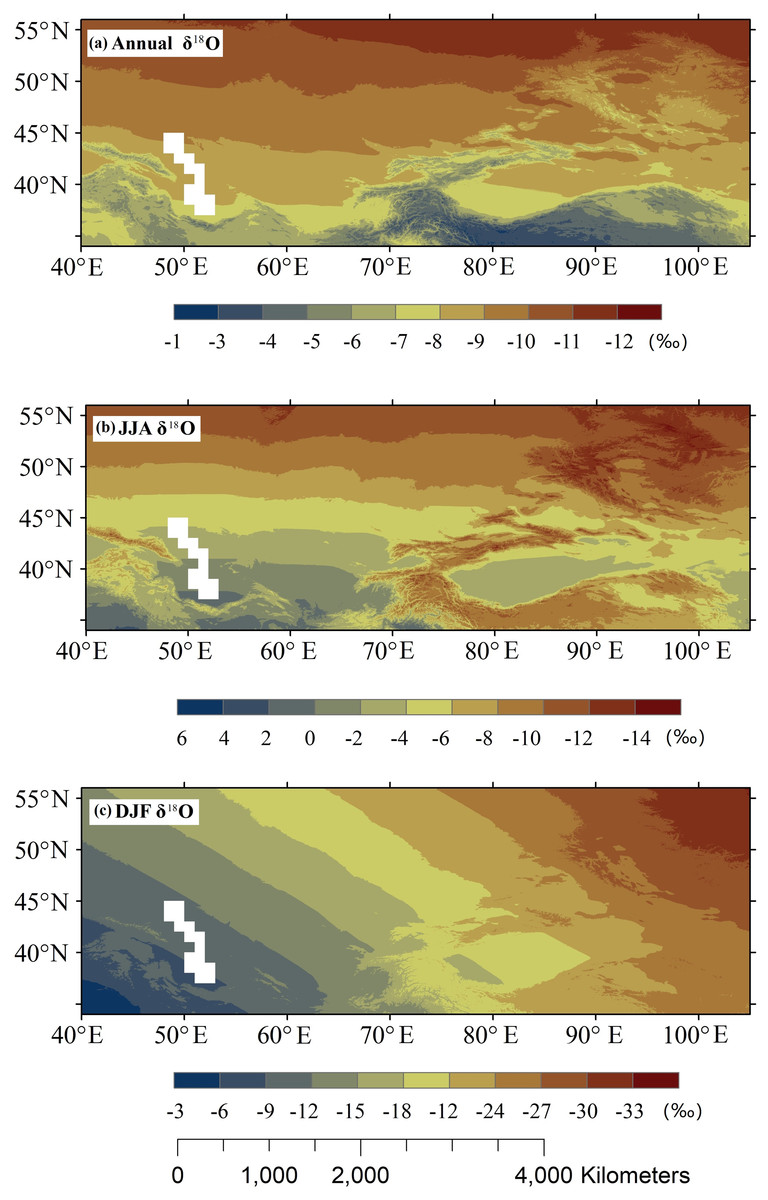
Figure 5: Spatial distribution of annual (A), JJA (B), and DJF (C) mean estimated δ18O in precipitation based on the model using spatial variables.
In the winter, precipitation δ18O gradually decreased with increasing longitude (Fig. 5C). The δ18O values in Central Asia was lower than that in the eastern Asia and Mongolian Plateau. The moisture transported from the Eurasian continent and the Mediterranean Sea into northern Central Asia generated more winter precipitation and westerly wind was needed to transport moist air into inland regions.
Correlation between precipitation δ18O and meteorological variables
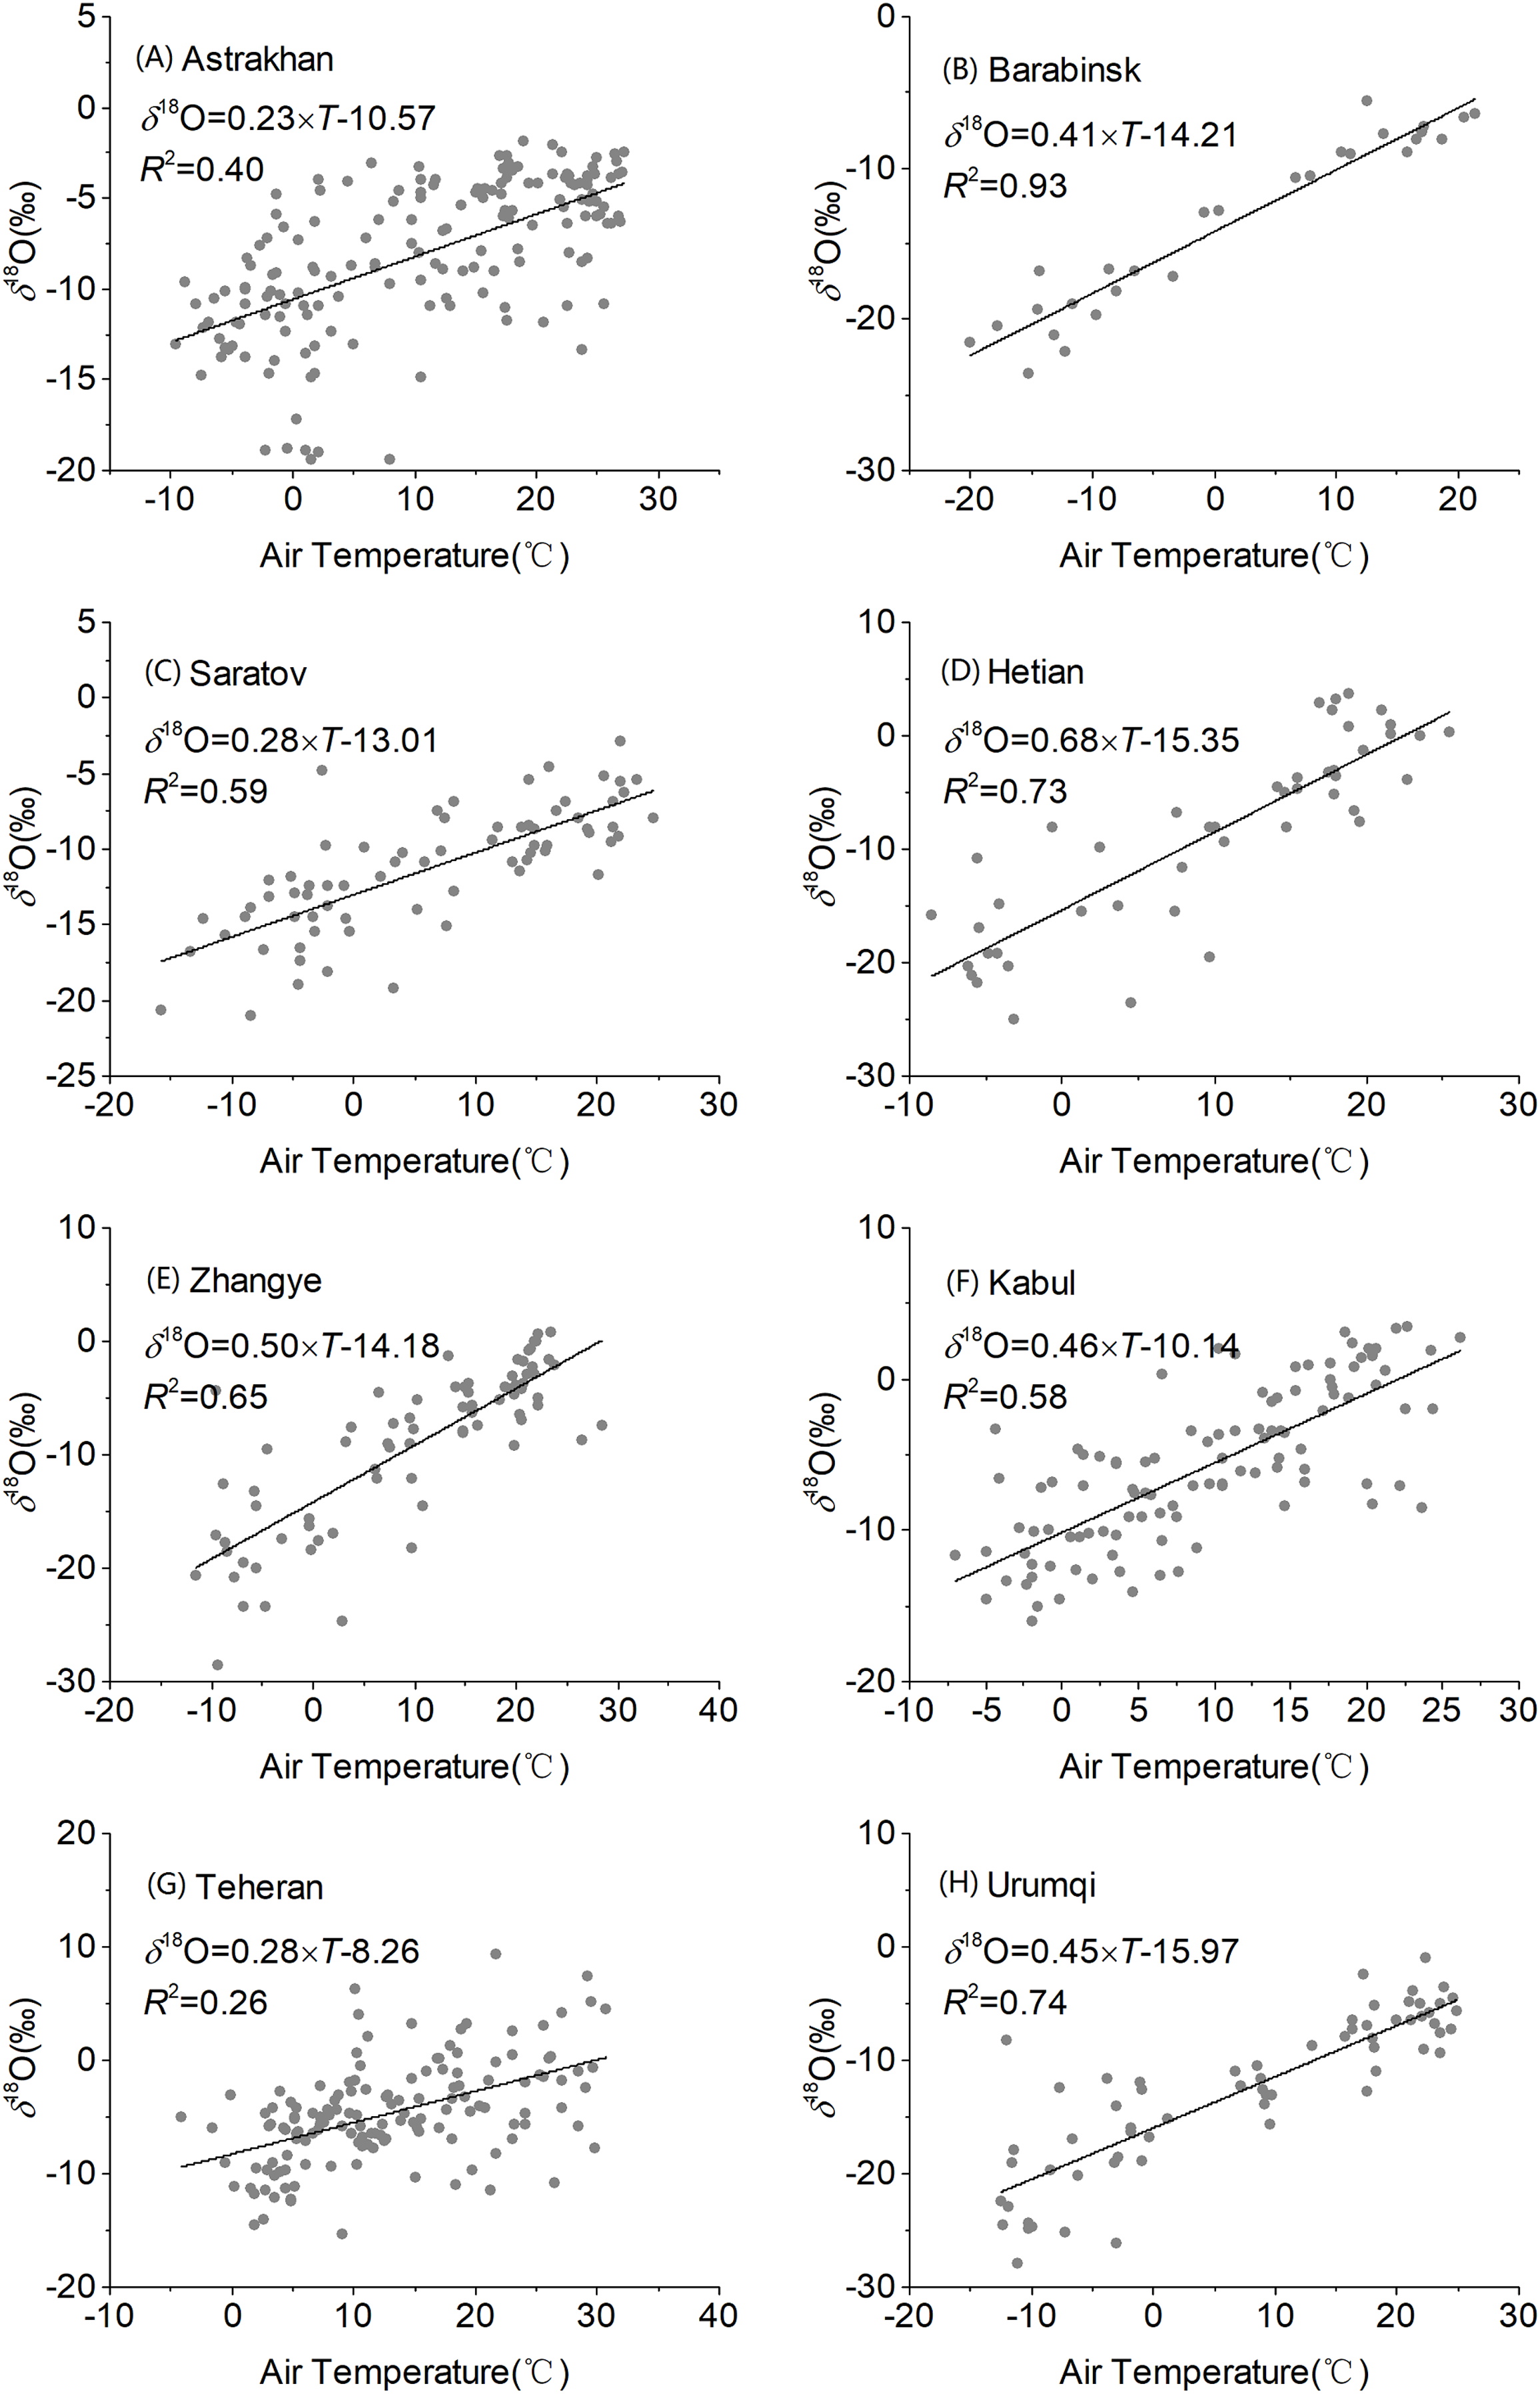
We investigated correlations between monthly precipitation δ18O, monthly air temperature (Fig. 6), and precipitation at eight stations in Central Asia (Fig. 7). As shown in the figure, monthly precipitation δ18O at each station had a significant positive correlation with temperature (R = 0.51–0.96, p < 0.01). Moreover, the latitude effect with δ18O gradually increased as the temperature increased. The effect of temperature was the strongest at the Barabinsk station, followed by those at the Urumqi, Hotan, Zhangye, Saratov, and Kabul stations, while it was the weakest at the Astrakhan and Teheran stations. The gradients between δ18O and air temperature ranged from 0.28‰/°C at the Saratov and Teheran stations to 0.68‰/°C at the Hetian station. These results were similar to global mid- and high-latitudes with gradients of 0.55‰/°C (Rozanski, Araguas-Araguas & Gonfiantini, 1993) and elsewhere in China with gradients of 0.36‰/°C (Gu, 2011).
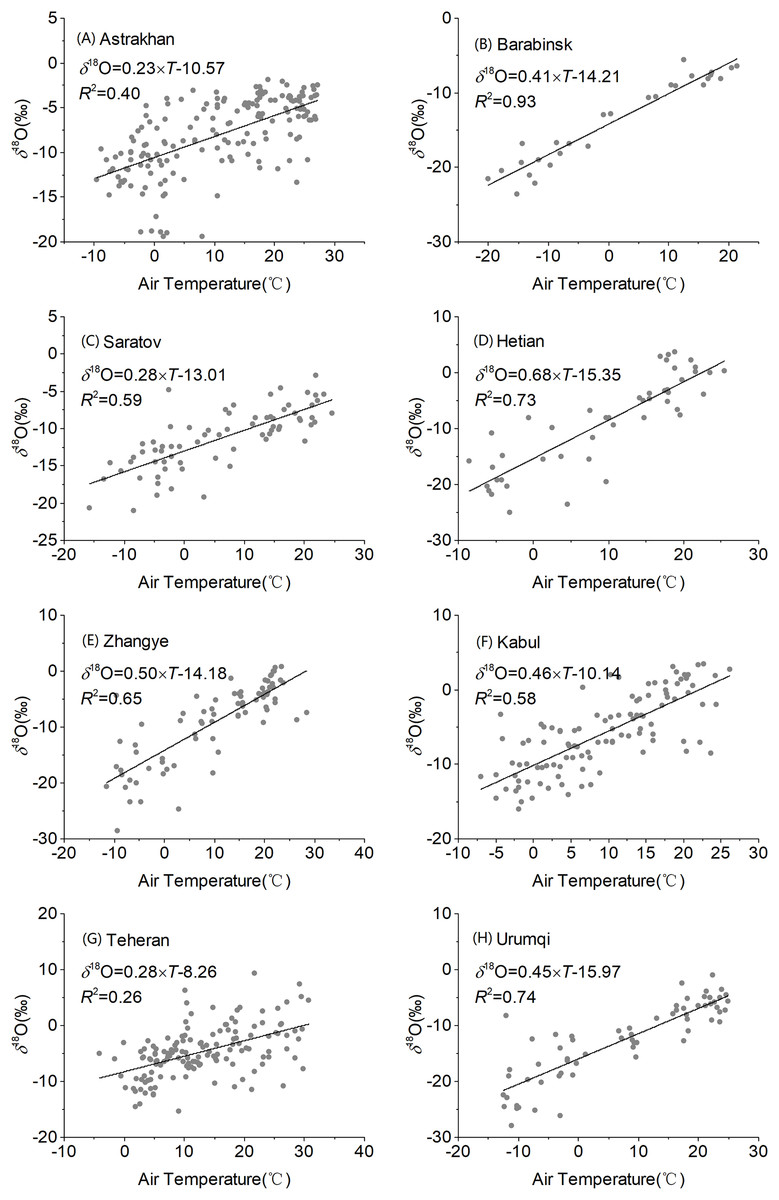
Figure 6: Regression of observed precipitation δ18O with temperature over Central Asia at different stations (A–H).
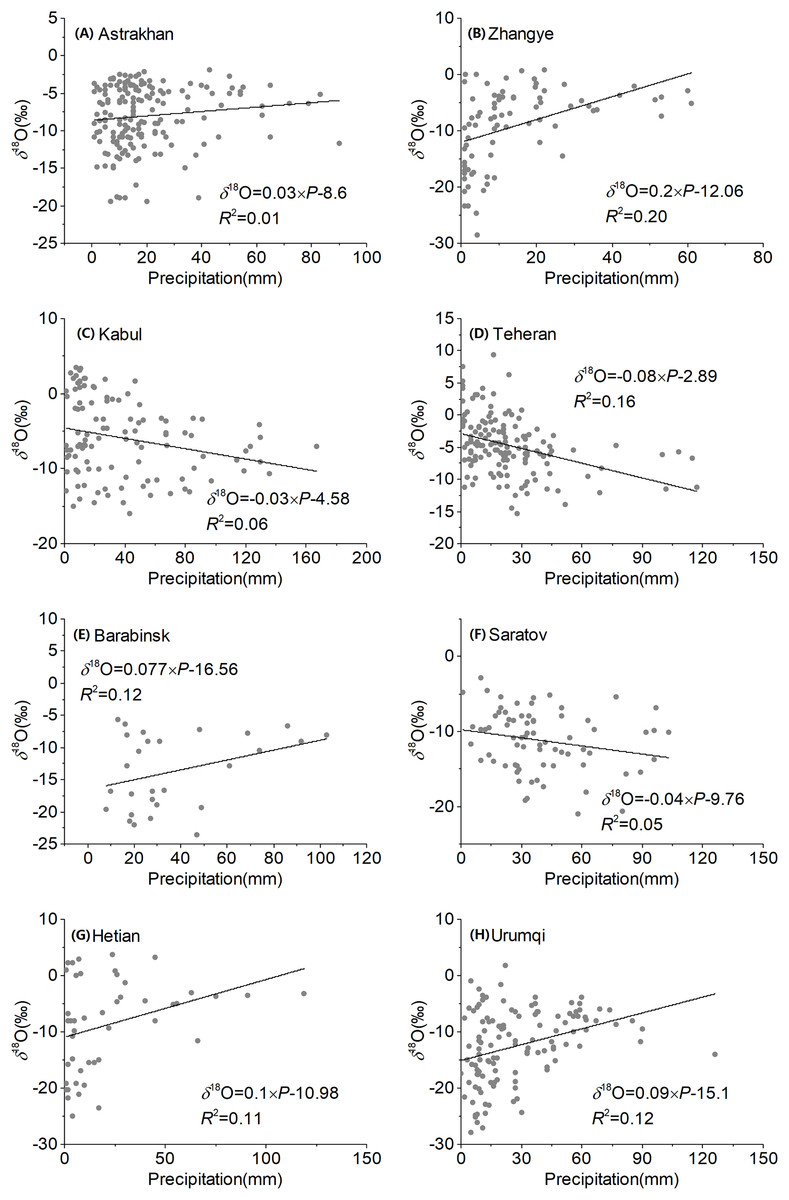
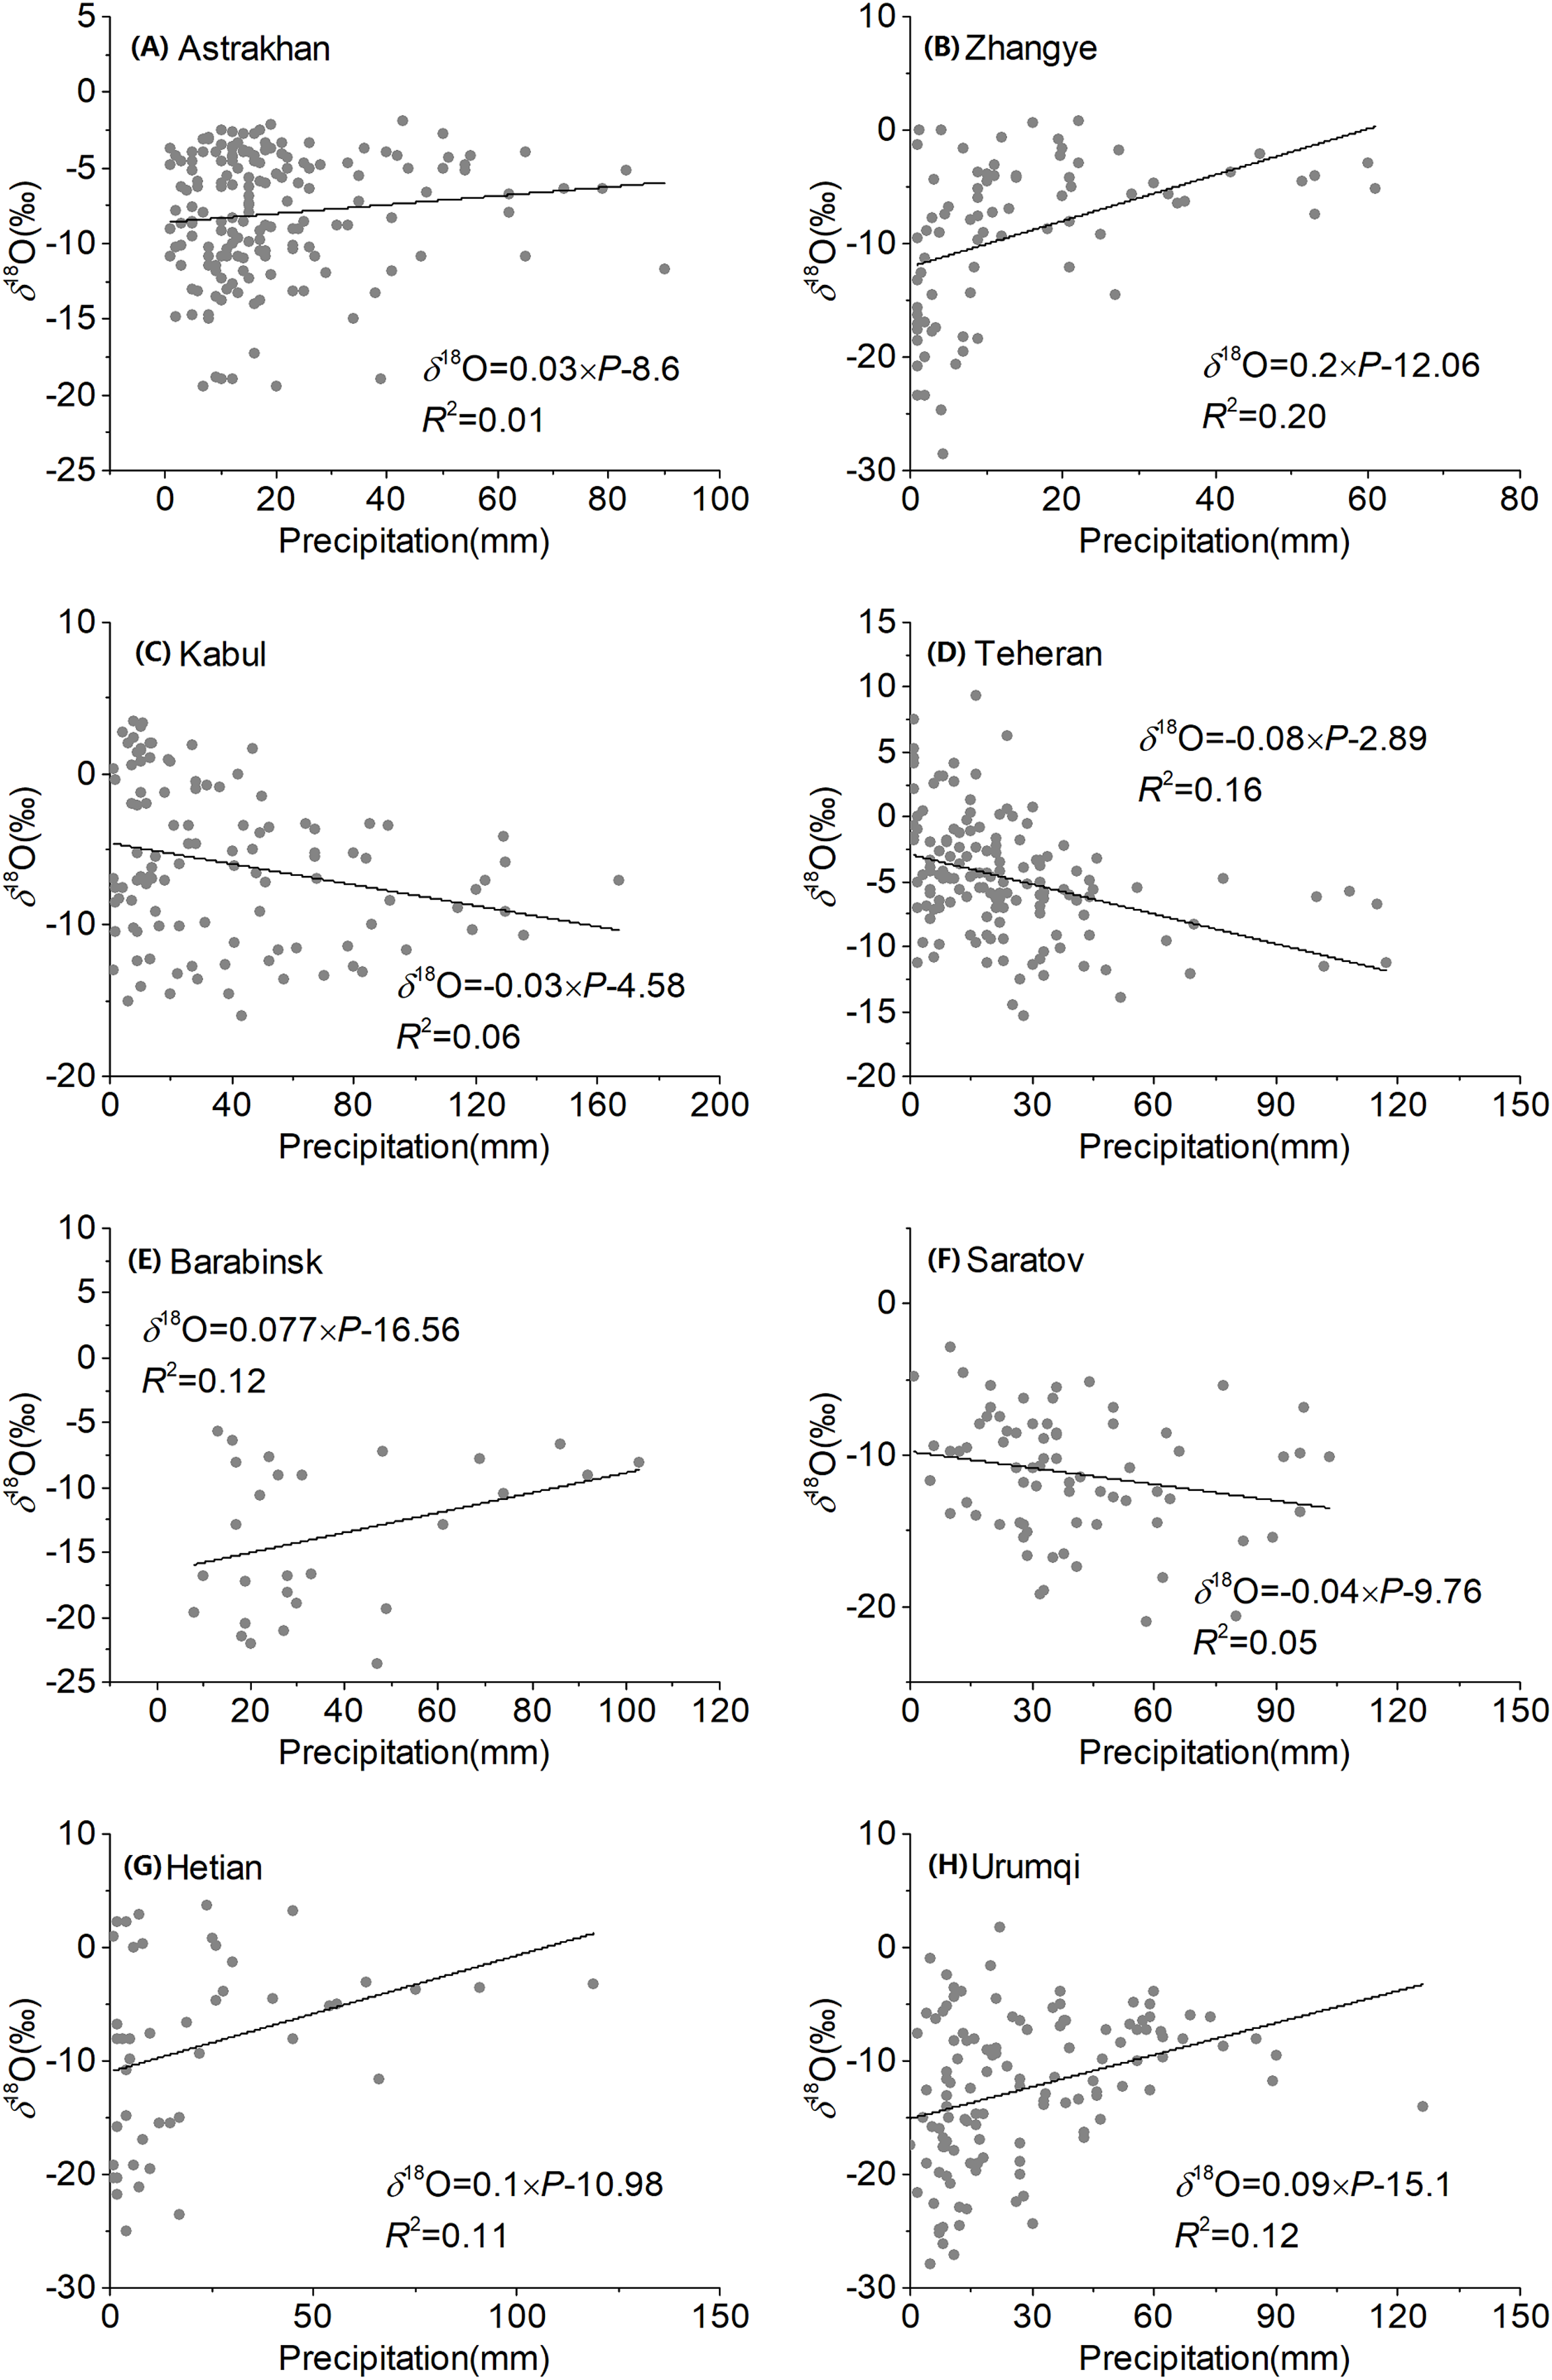
Figure 7: Regression of observed precipitation δ18O with amount of precipitation over Central Asia at different stations (A–H).
Significant positive correlations between precipitation δ18O and precipitation were observed at four stations (Zhangye, Barabinsk, Hetian, and Urumqi), and only one station had a significant negative correlation (Teheran station). Correlations for other stations were not significant. These results reveal an indeterminant dependence of precipitation δ18O on precipitation, which is in accordance with the insignificant effect of precipitation in inland regions (Gu, 2012). The δ18O–precipitation gradients ranged from −0.08‰/mm (Teheran station) to 0.20 ‰/mm (Zhangye station). In addition, the Zhangye and Teheran stations had a significant precipitation effect as a result of their location on the edge of the East Asian monsoon and Indian monsoon regions, respectively.
The Urumqi station has the longest and most systematic GNIP observations in Central Asia, with an observation period spanning from 1986 to 2003. Based on a subset of selected predictors, we established a model using stepwise regression analysis and the corresponding monthly temperature and precipitation data. The δ18O model in Urumqi station was expressed by linear regression as:
(4)
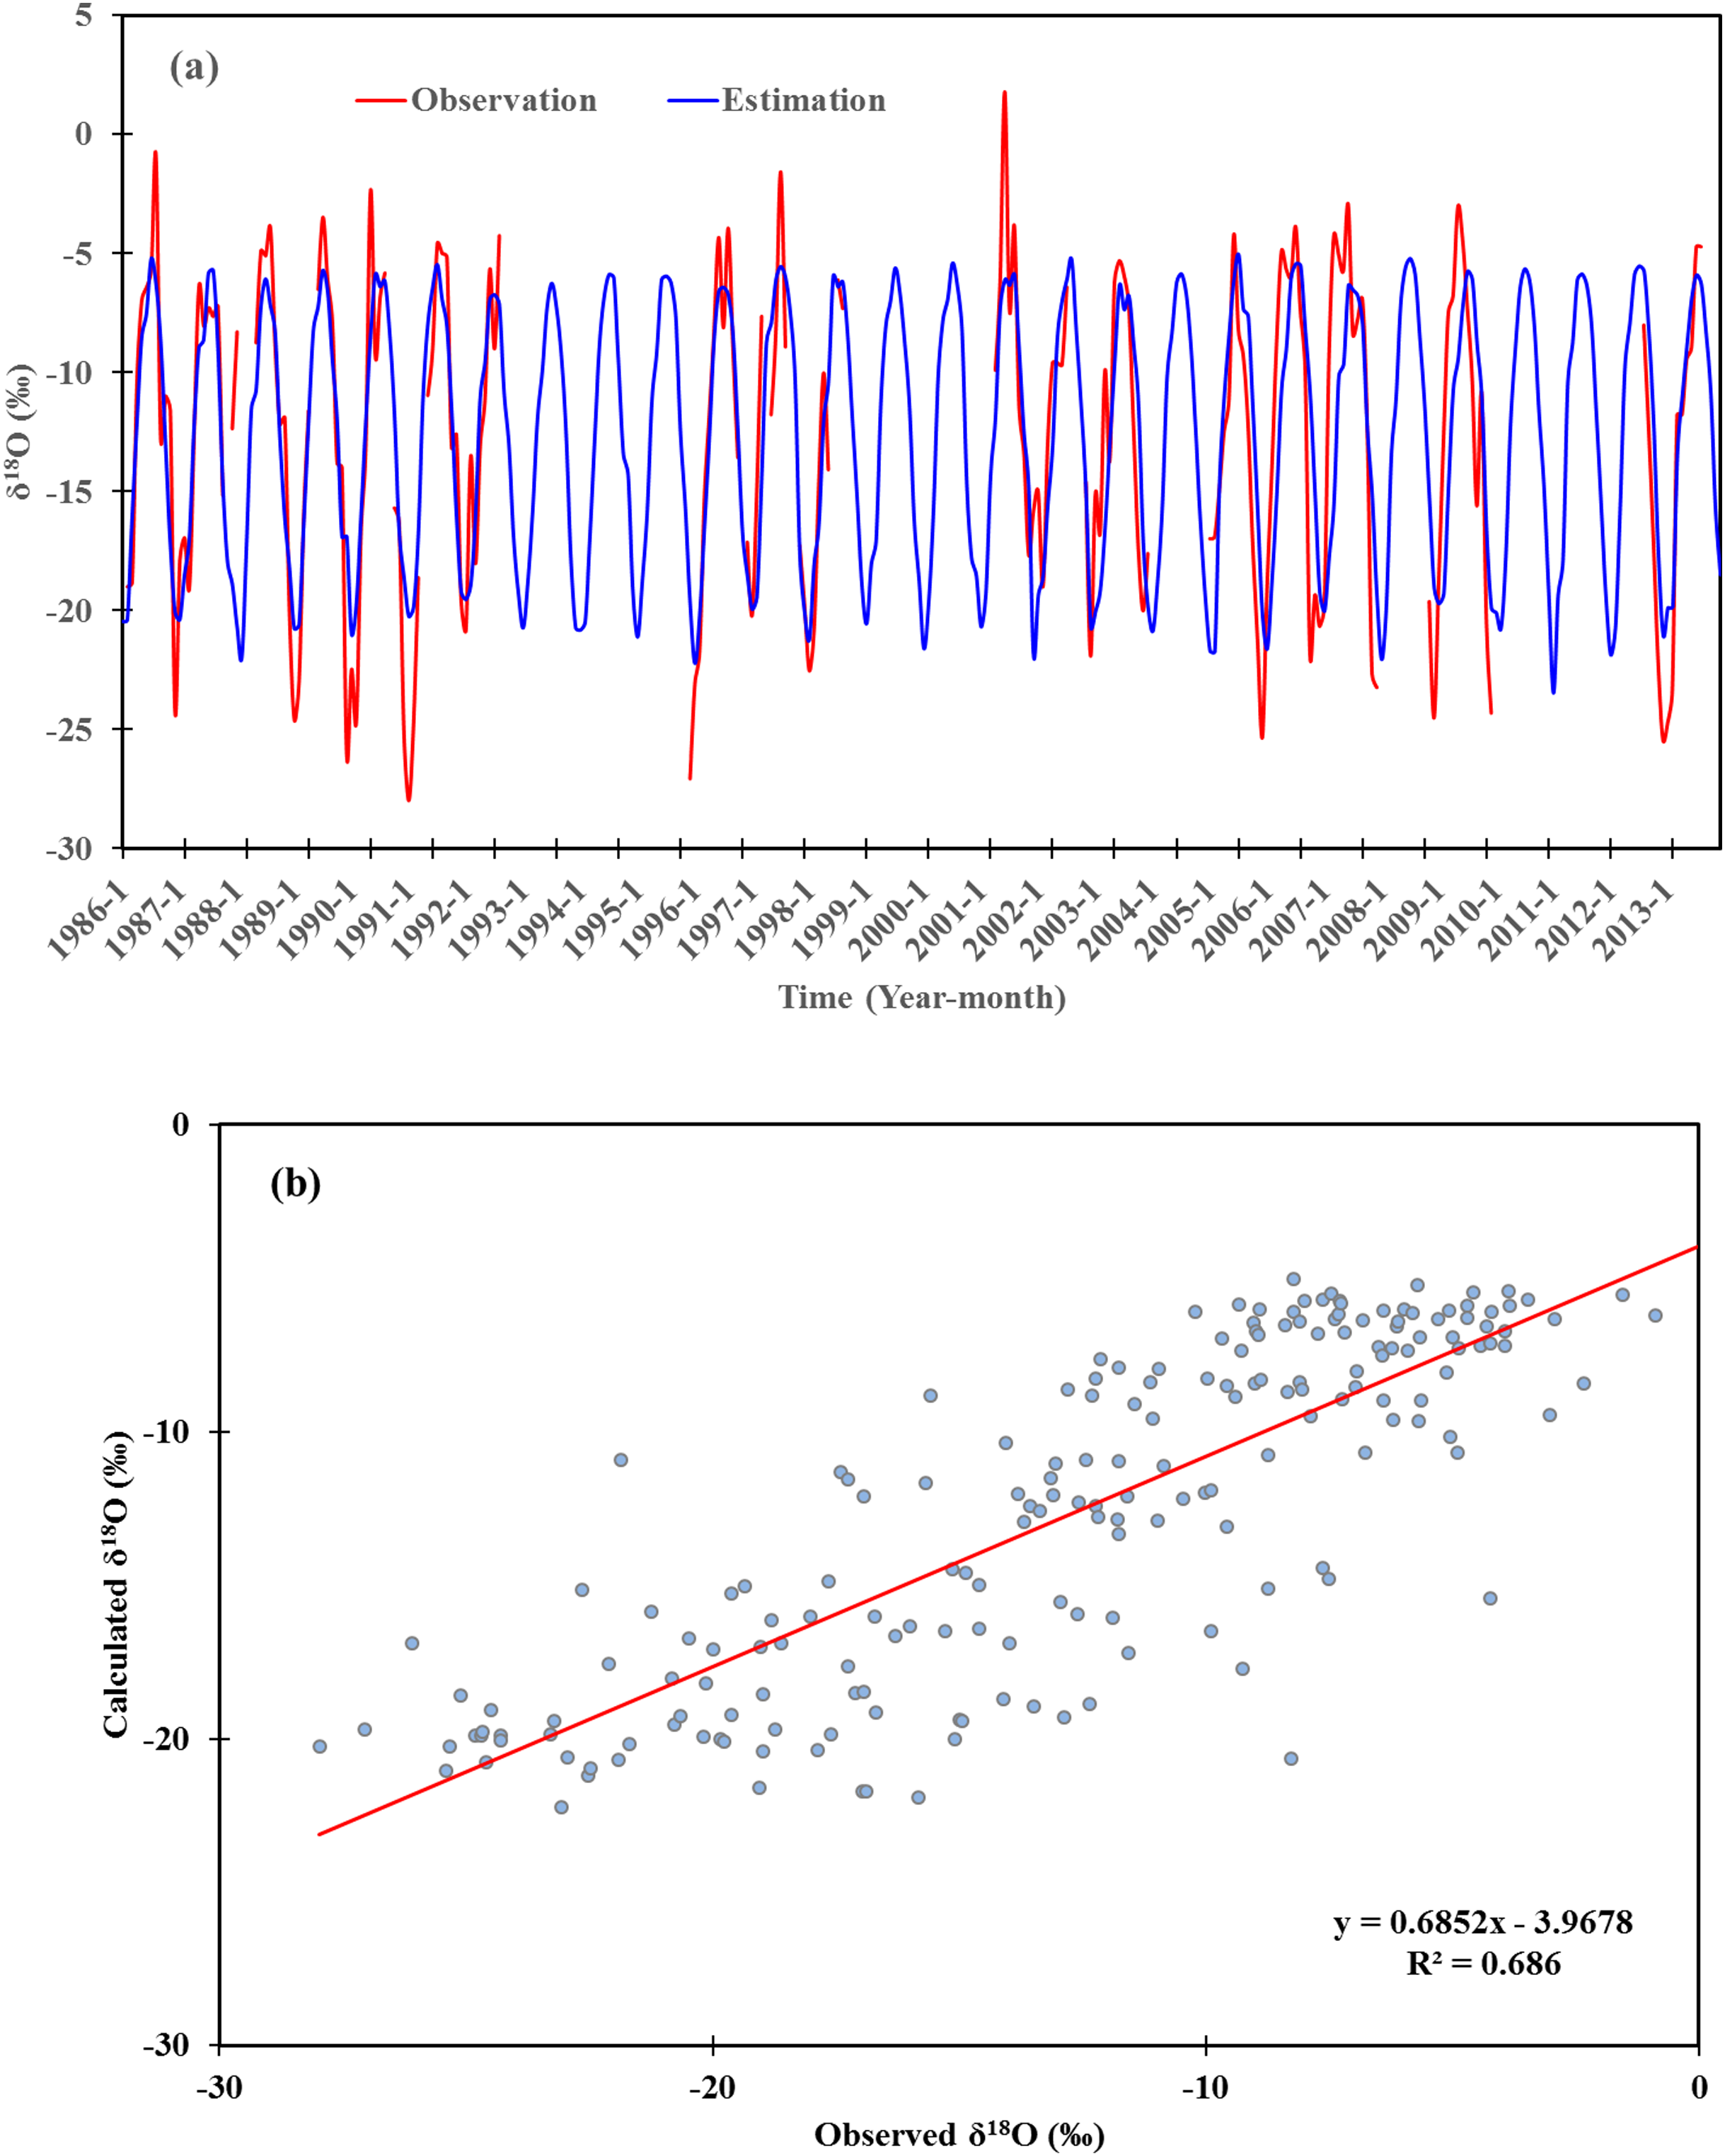
We reconstructed and estimated the monthly precipitation δ18O time series from 1985 to 2013 at Urumqi station (Fig. 8A). The reconstructed precipitation δ18O was high-positively correlated with the observed values at Urumqi stations (R = 0.83, p < 0.01), and the results clearly depicted the seasonal cycle of precipitation δ18O, except for some values during extreme cold or hot months. Furthermore, the reconstructed precipitation δ18O values for most spring and autumn seasons are similar to the observations. This indicates that basic fractionation mechanisms can be reflected using the reconstructed model. The reconstructed model indicates that the temperature effect of precipitation δ18O values was reflected in Urumqi Station. Several previous studies confirmed the temperature effect of precipitation isotopes existed in arid Central Asia (Yao et al., 1999, 2013; Wang et al., 2016). Thus, the selected control factors and established regressions can be used to reconstruct the long-term variation in precipitation δ18O, and also act as a proxy of an historic environment. In High Asia, the climatic controls on precipitation isotopes was used as a base for ice core sampling (Tian & Yao, 2016). In Central Asia, the δ18O of ice cores were in good agreement with temperatures at nearby stations, which indicates its value in paleoclimate reconstruction using ice cores (Tian et al., 2006; Zhang & Wang, 2018).
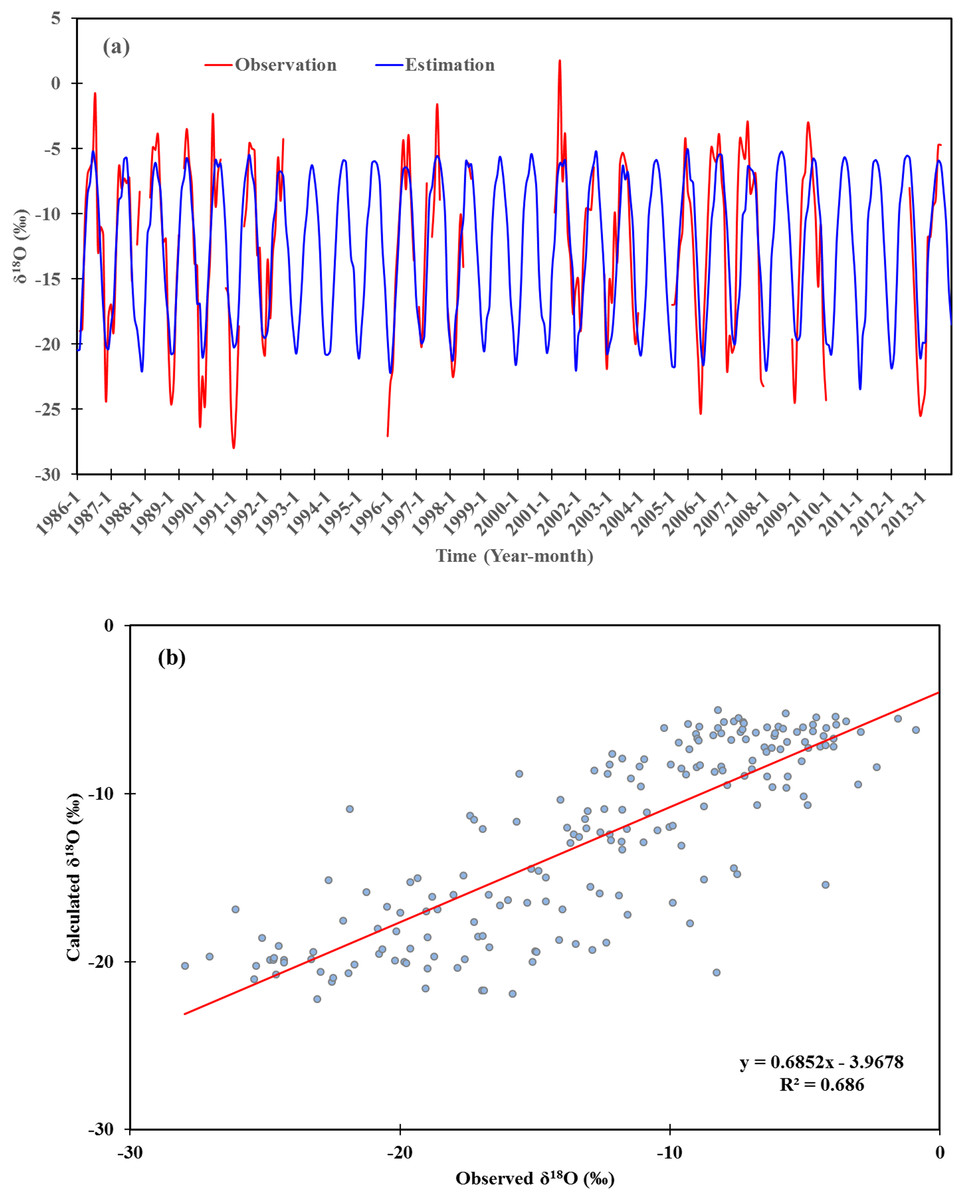
Figure 8: (A) Reconstruction of monthly δ18O time series during 1986–2013 based on the regression model established for Urumqi station. (B) Reconstructed values of monthly δ18O plotted versus observed values.
Relationship of precipitation δ18O with general atmospheric circulation
To reveal the relationship between precipitation δ18O and large-scale atmospheric circulation, we analyzed the correlation between precipitation δ18O at each station using long-term observation data and atmospheric circulation (e.g., IMI, SASMI, and WCI).
Our results showed that the precipitation δ18O at the Zhangye station was positively correlated with the EASMI (R = 0.62, p < 0.05), indicating that the East Asian summer monsoon has an important effect on precipitation δ18O in Zhangye. It is located on the eastern side of the arid northwest China and at the northeastern edge of the Tibetan Plateau as well as at the transition zone between the East Asian monsoon and westerlies. The East Asian monsoon can affect the precipitation δ18O in the westerly and monsoon transition regions.
The precipitation δ18O was negatively correlated with the IMI at both the Urumqi and Teheran stations (R = −0.57 and −0.41, respectively, p < 0.05), revealing an important effect of the Indian monsoon on precipitation δ18O. In general, the stronger the monsoon, the lower the δ18O value, and vice versa. The Teheran station is close to the Indian Ocean and is one of the main moisture paths for the Indian monsoon moving towards the north. Therefore, precipitation δ18O at the Teheran station was mainly influenced by the Indian monsoon. However, Urumqi is located in the Asian hinterland and is indirectly influenced by the Indian monsoon. At Urumqi, precipitation δ18O is affected by an anomalous moisture transport path through a multi-step process. A weakened Indian monsoon can cause an anomalous cyclone in the middle and upper troposphere in Central Asia, resulting in cooling, which is directly correlated with the increased precipitation in Xinjiang (Zhao et al., 2014). Furthermore, the Indian monsoon affects moisture transport from the Bay of Bengal and the Arabian Sea to Xinjiang through a two-step process (Zhao et al., 2014). The extreme summer precipitation in northern Xinjiang was controlled by moisture sources originating from the Indian Ocean, which was closely related to a stronger meridional circulation (Huang et al., 2017). The anomalous circulation can also transport some moisture from the Indian Ocean along the eastern periphery of the Tibetan Plateau to North Xinjiang (Huang et al., 2017).
The moisture in Central Asia is mainly transported by the westerly circulation from the North Atlantic Ocean and the Eurasian continent. The westerly circulation is one of the most important factors affecting precipitation δ18O over Central Asia. However, we found a weak positive correlation between precipitation δ18O and the WCI index. This may be related to the moisture transported by the westerly circulation, which originates from the Atlantic and Arctic oceans and dissipates along the way. The water vapor transported by the westerly is exhausted by the time it reaches Central Asia because of substantial evapotranspiration and evaporation below the clouds in arid regions.
The precipitation d-excess parameter can provide supplementary information to precipitation δ18O and δ2H values, and it is largely controlled by the moisture source and water transport paths. Thus, it may be the most important indicator to represent the regional moisture source and atmospheric circulation (Merlivat & Jouzel, 1979). In addition, the precipitation d-excess is closely related to the re-evaporation of raindrops during condensation and precipitation, and is affected by temperature and relative humidity during evaporation (Merlivat & Jouzel, 1979; Jouzel, Merlivat & Lorius, 1982; Jouzel, Froehlich & Schotterer, 1997; Wang, 2014). In Central Asia, the precipitation d-excess values ranged from +21.66 ‰ to −8.5‰, with an average of 8.5 ‰. The temporal variations in precipitation d-excess shows more positive values in spring and more negative values in summer and the opposite pattern for δ18O. This variation is in agreement with variations in the conditions under which the moisture source evaporates. There is a similar seasonal pattern in precipitation d-excess and δ18O of Central Asia and that of the westerly climate regime zone (Yao, 2009). However, there is a dissimilarity with the annual cycle in Lhasa, which is affected by southwest monsoon air mass (Wang, 2014). This demonstrates that the moisture transported to Central Asia was derived predominantly from the westerlies and the polar air masses. Moreover, the high precipitation d-excess values showed that recycled moisture derived from local sources makes a significant contribution to precipitation, especially in Central Asia. Yao et al. (2020) also suggested that the warming and increased moisture content of the atmosphere contributed to the local moisture cycle and increased precipitation recycling in eastern Central Asia.
Conclusions
We established the CAMWL and analyzed the spatial–temporal characteristics of precipitation δ18O and its relationship with meteorological variables and geographical factors based on the precipitation δ18O values observed at 47 stations over Central Asia, with information from GNIP, TNIP, CHNIP, and TSNIP databases and reference studies. In addition, we revealed the relationship between precipitation δ18O and large-scale atmospheric circulation. We made the following conclusions:
-
The CAMWL was established as δ2H = 7.30δ18O + 3.12 (R2 = 0.95, p < 0.01) for 727 groups of monthly precipitation δ18O over Central Asia. The precipitation δ18O over Central Asia ranged from +2‰ to −25.4‰ with a mean of −8.7‰.
-
The precipitation δ18O over Central Asia was related to meteorological factors. It had a significant positive correlation with temperature, with δ18O-temperature gradients ranging from 0.28‰/°C to 0.68‰/°C. However, the dependence of δ18O on precipitation was unclear, with a significant effect on precipitation observed only at the Zhangye and Teheran stations, showing δ18O-precipitation gradients of 0.20‰/mm and −0.08‰/mm, respectively.
-
In summer, the latitude was significantly correlated with precipitation δ18O (R = 0.54, p < 0.05), while in winter, both latitude and longitude were significantly correlated. The gradient of δ18O/LAT and δ18O/ALT were −0.42‰/° and −0.001‰/m, respectively.
-
The precipitation δ18O at the Zhangye station showed a significantly positive correlation with the EASMI, and a negative correlation with the IMI at the Urumqi and Teheran stations. In addition, there was a weakly positive correlation between δ18O and the WCI. Our results suggest that the moisture in Central Asia is mainly transported by westerly circulation and is indirectly affected by the Indian monsoon. Furthermore, the East Asian monsoon can affect the precipitation δ18O in westerly and monsoon transition regions.