Using network clustering to predict copy number variations associated with health disparities
- Published
- Accepted
- Subject Areas
- Bioinformatics, Genetics, Genomics
- Keywords
- Copy Number Variations (CNVs), Health disparities, Gene Ontology, Clustering, Gene-disease association, Gene networks
- Copyright
- © 2014 Jiang et al.
- Licence
- This is an open access article distributed under the terms of the Creative Commons Attribution License, which permits unrestricted use, distribution, reproduction and adaptation in any medium and for any purpose provided that it is properly attributed. For attribution, the original author(s), title, publication source (PeerJ PrePrints) and either DOI or URL of the article must be cited.
- Cite this article
- 2014. Using network clustering to predict copy number variations associated with health disparities. PeerJ PrePrints 2:e584v1 https://doi.org/10.7287/peerj.preprints.584v1
Abstract
Substantial health disparities exist between African Americans and Caucasians in the United States. Copy number variations (CNVs) are one form of human genetic variations that have been linked with complex diseases and often occur at different frequencies among African Americans and Caucasian populations. Here, we aimed to investigate whether CNVs with differential frequencies can contribute to health disparities from the perspective of gene networks. We inferred network clusters from human gene/protein networks based on two different data sources. We then evaluated each network cluster for the occurrences of known pathogenic genes and genes located in CNVs with different population frequencies, and used false discovery rates to rank network clusters. This approach let us identify five clusters enriched with known pathogenic genes and with genes located in CNVs with different frequencies between African Americans and Caucasians. These clustering patterns predict two candidate causal genes located in four population-specific CNVs that play potential roles in health disparities
Author Comment
This preprint has been submitted for PeerJ for reviewing.
Supplemental Information
Results of gene mapping of SNPs and CNV coordinates
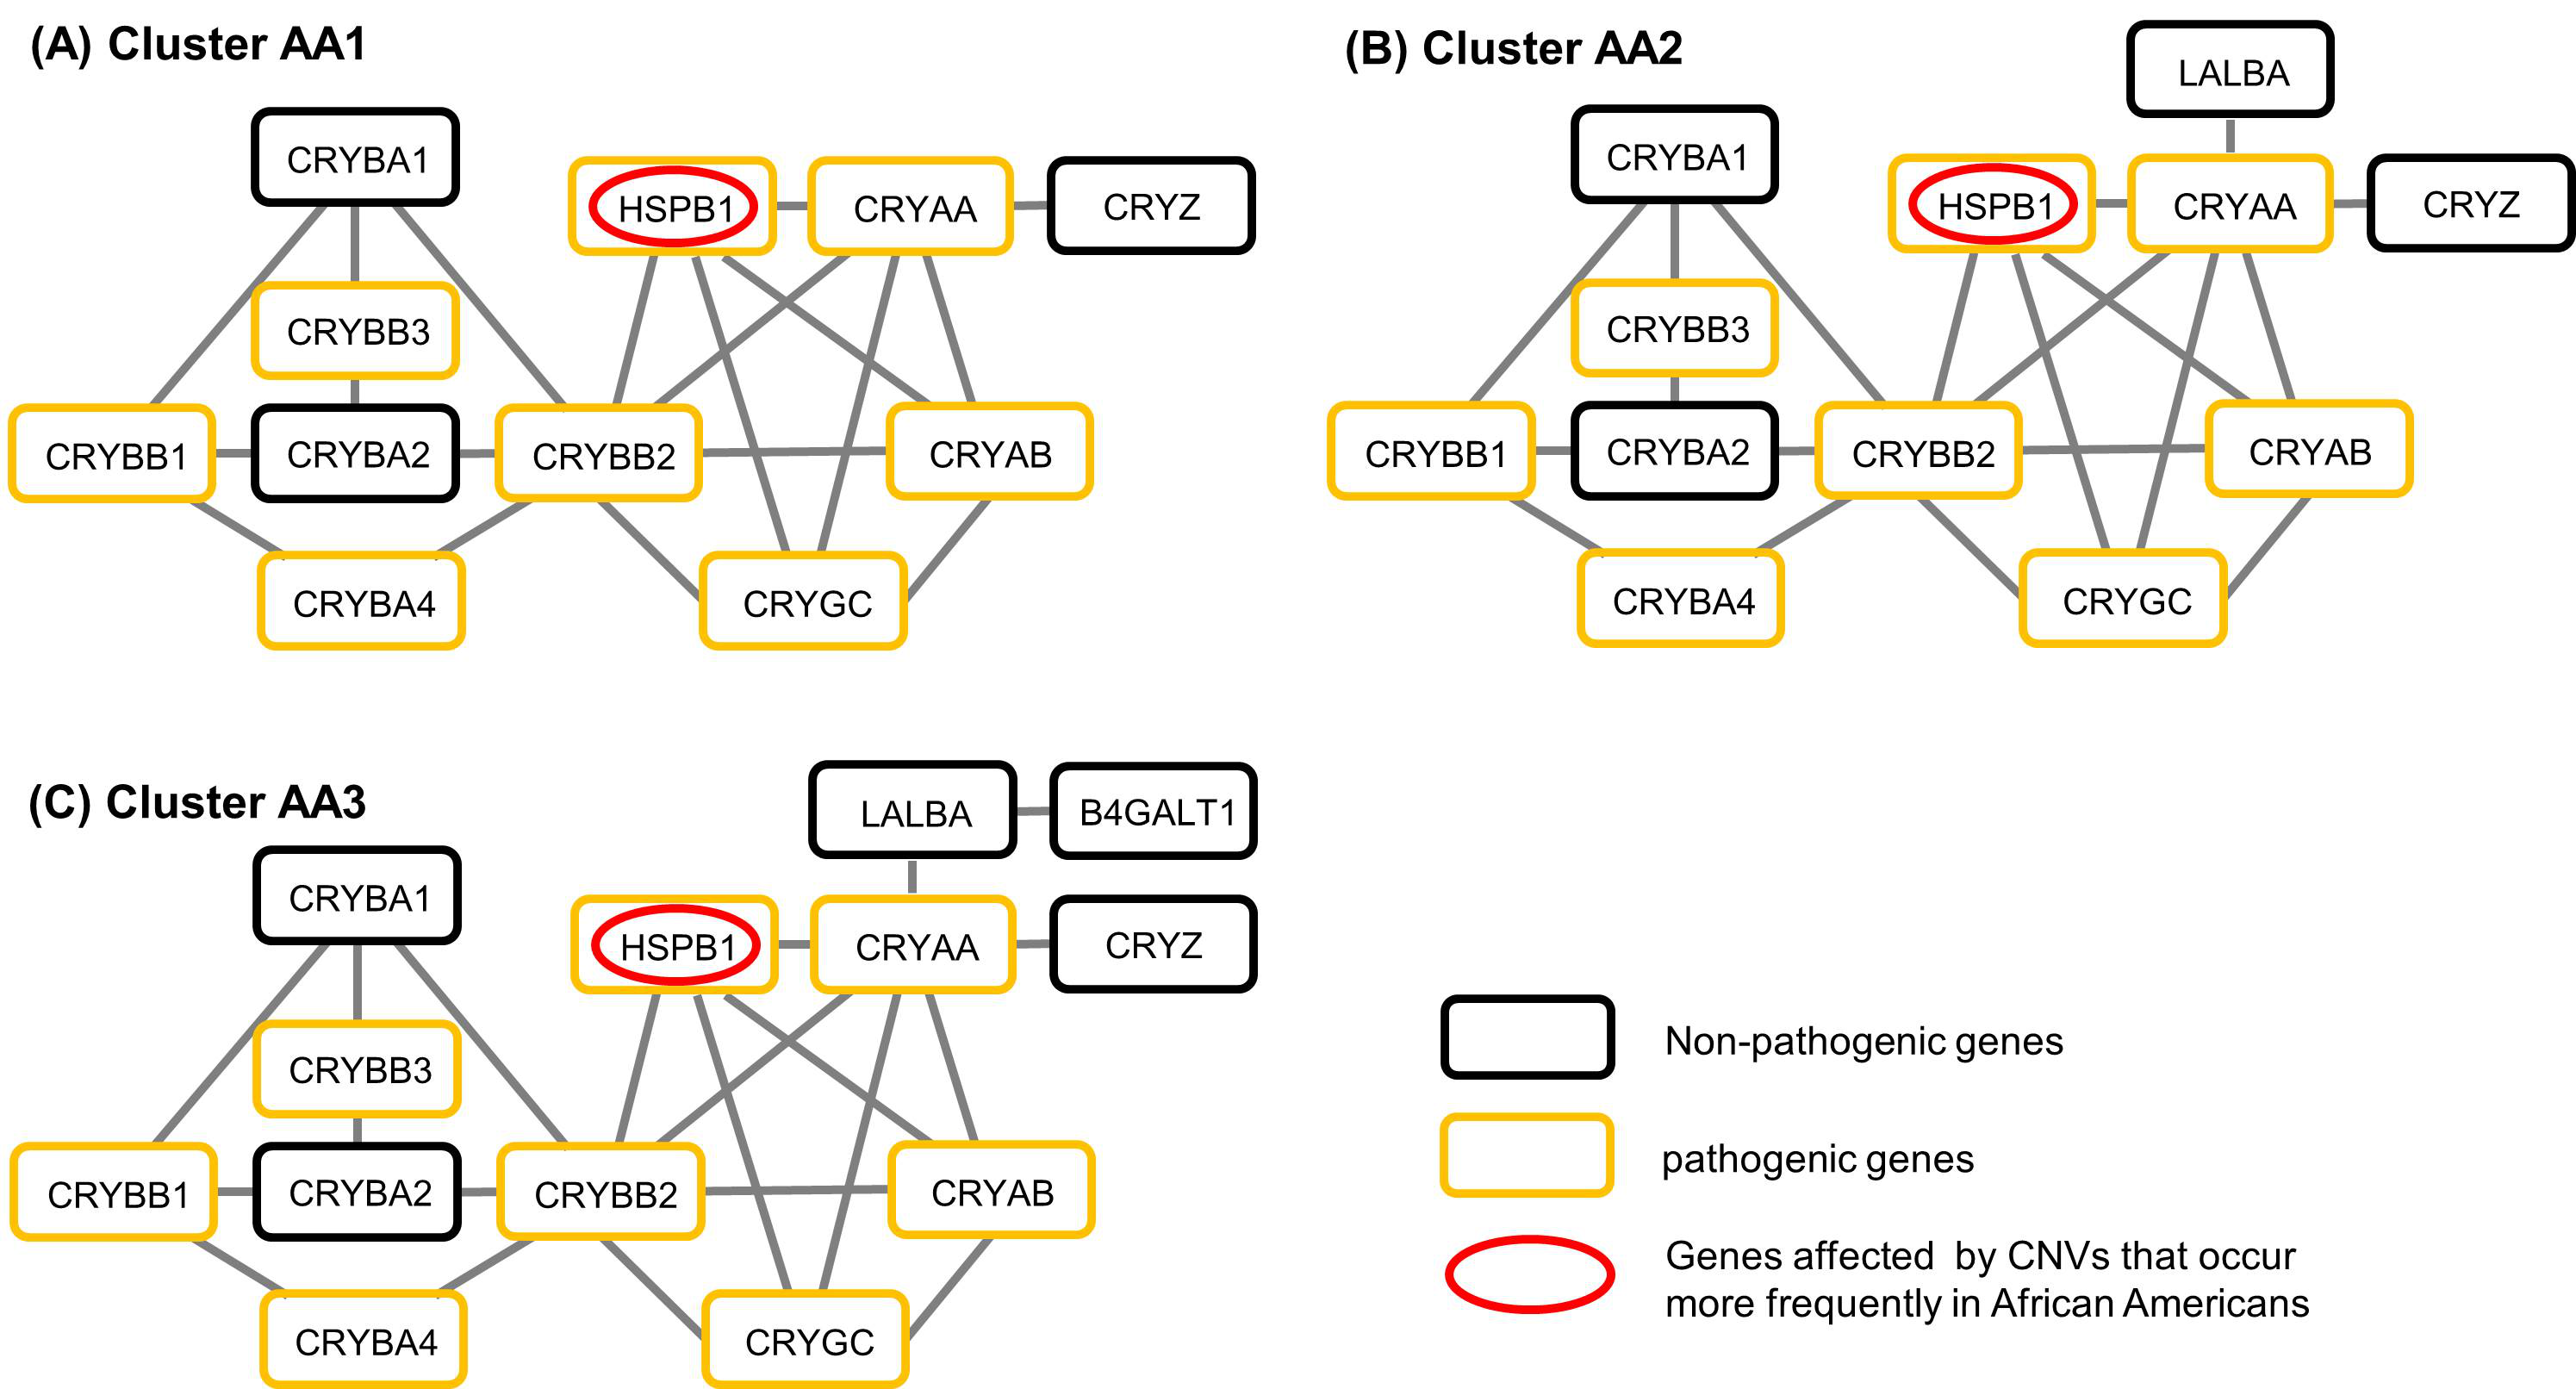
Graph representations of cluster AA1, AA2 and AA3
Each rounded rectangle represents a gene and each gray line represents a gene-gene interaction. Black rounded rectangles represent non-pathogenic genes and orange rounded rectangles represent pathogenic genes. Genes labeled with red or blue ovals are located in African American CNVs or in Caucasian CNVs.