Combining UAV-based hyperspectral imagery and machine learning algorithms for soil moisture content monitoring
- Published
- Accepted
- Subject Areas
- Ecosystem Science, Soil Science, Natural Resource Management, Environmental Impacts, Spatial and Geographic Information Science
- Keywords
- UAV, Precision farming, Hyperspectral imagery, Machine learning
- Copyright
- © 2019 Ge et al.
- Licence
- This is an open access article distributed under the terms of the Creative Commons Attribution License, which permits unrestricted use, distribution, reproduction and adaptation in any medium and for any purpose provided that it is properly attributed. For attribution, the original author(s), title, publication source (PeerJ Preprints) and either DOI or URL of the article must be cited.
- Cite this article
- 2019. Combining UAV-based hyperspectral imagery and machine learning algorithms for soil moisture content monitoring. PeerJ Preprints 7:e27630v1 https://doi.org/10.7287/peerj.preprints.27630v1
Abstract
Soil moisture content (SMC) is an important factor that affects agricultural development in arid regions. Compared with the spaceborne remote sensing system, the unmanned aerial vehicle (UAV) has been widely used because of its stronger controllability and higher resolution. It also provides a more convenient method for monitoring SMC than normal measurement methods that includes field sampling and oven-drying techniques. However, research based on UAV hyperspectral data has not yet formed a standard procedure in arid regions. Therefore, a universal processing scheme is required. We hypothesized that combining pretreatments of UAV hyperspectral imagery under optimal indices and a set of field observations within a machine learning framework will yield a highly accurate estimate of SMC. Optimal 2D spectral indices act as indispensable variables and allow us to characterize a model’s SMC performance and spatial distribution. For this purpose, we used hyperspectral imagery and a total of 70 topsoil samples (0–10 cm) from the farmland ( 2.5 ×10⁴ m2) of Fukang City, Xinjiang Uygur AutonomousRegion, China. The random forest (RF) method and extreme learning machine (ELM) were used to estimate the SMC using six methods of pretreatments combined with four optimal spectral indices. The validation accuracy of the estimated method clearly increased compared with that of linear models. The combination of pretreatments and indices by our assessment effectively eliminated the interference and the noises. Comparing two machine learning algorithms showed that the RF models were superior to the ELM models, and the best model was PIR (R2val = 0.907, RMSEP = 1.477 and RPD = 3.396). The SMC map predicted via the best scheme was highly similar to the SMC map measured. We conclude that combining preprocessed spectral indices and machine learning algorithms allows estimation of SMC with high accuracy (R2val = 0.907) via UAV hyperspectral imagery on a regional scale. Ultimately, our program might improve management and conservation strategies for agroecosystem systems in arid regions.
Author Comment
This is a submission to PeerJ for review.
Supplemental Information
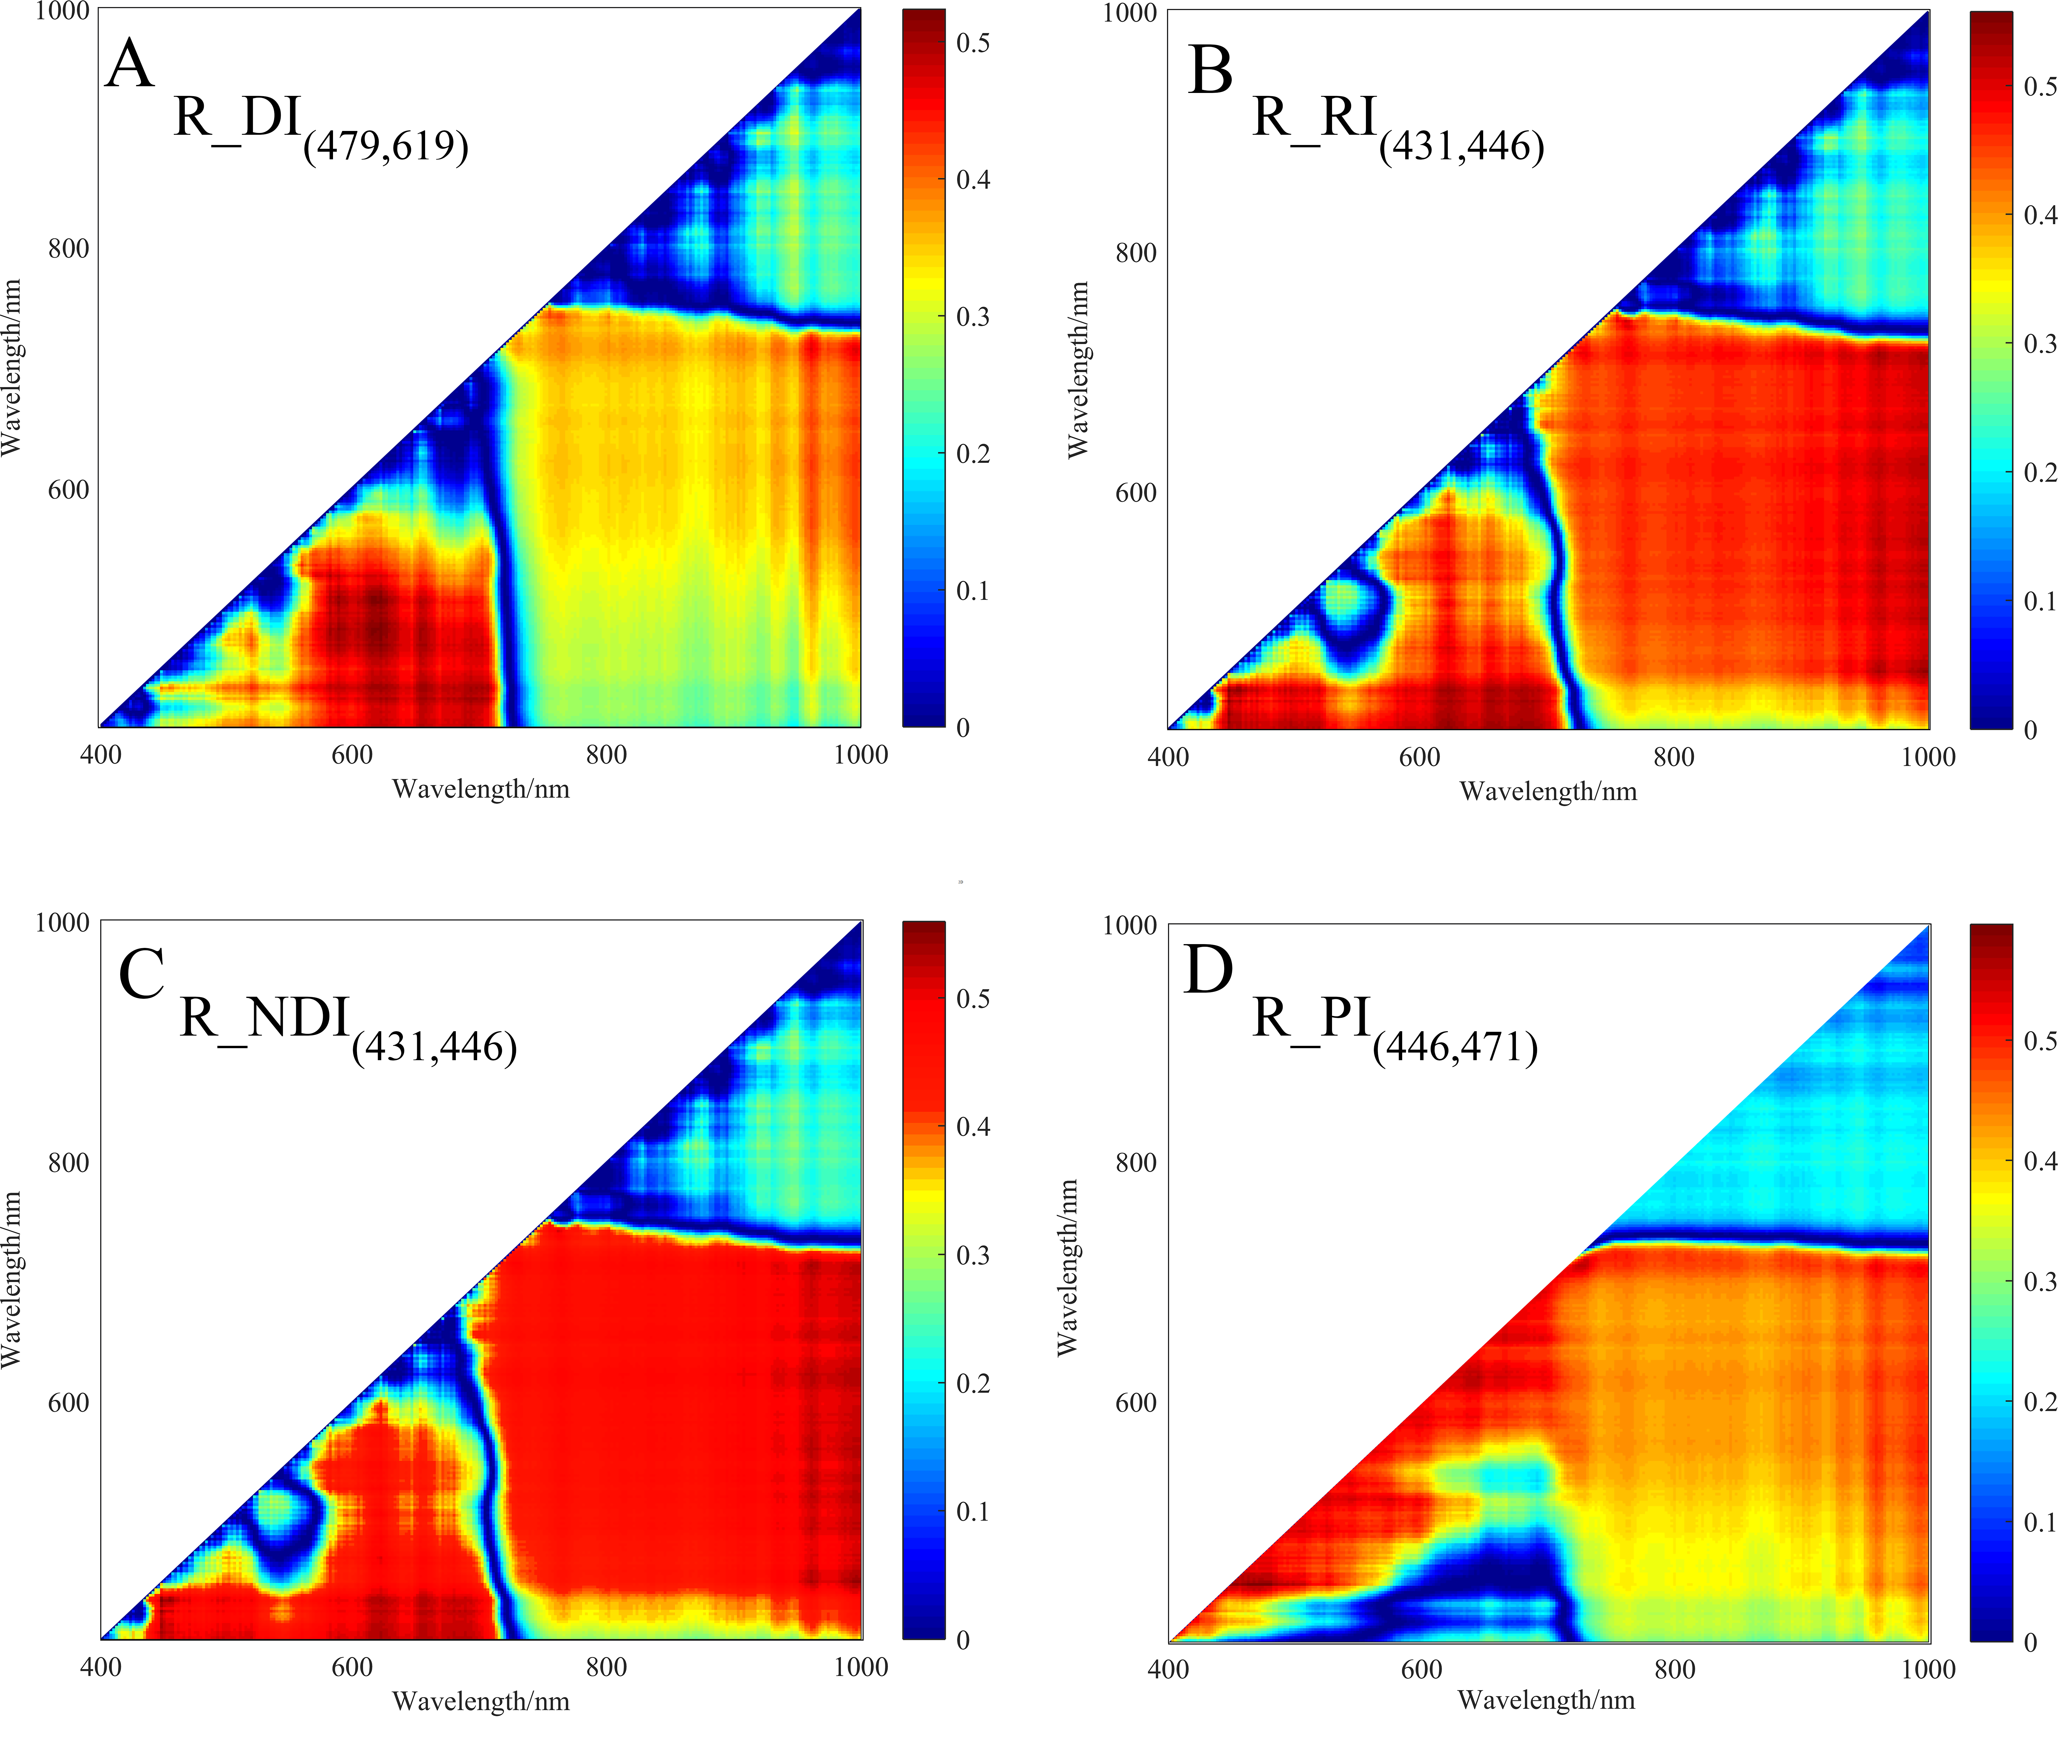
r2 maps of 2D spectral indices based on R
(A) r2 maps of R_DI(479,619). (B) r2 maps of R_RI(431,446). (C) r2 maps of R_NDI(431,446). (D) r2 maps of R_PI(446,471). The colorbar illustrates the value of the square of the correlation coefficient (r2) between SMC and spectral indices, and the x- axes and y-axes indicate the wavebands of 400–1000 nm. Dark red portrays a high r2 between SMC and the spectral indices.
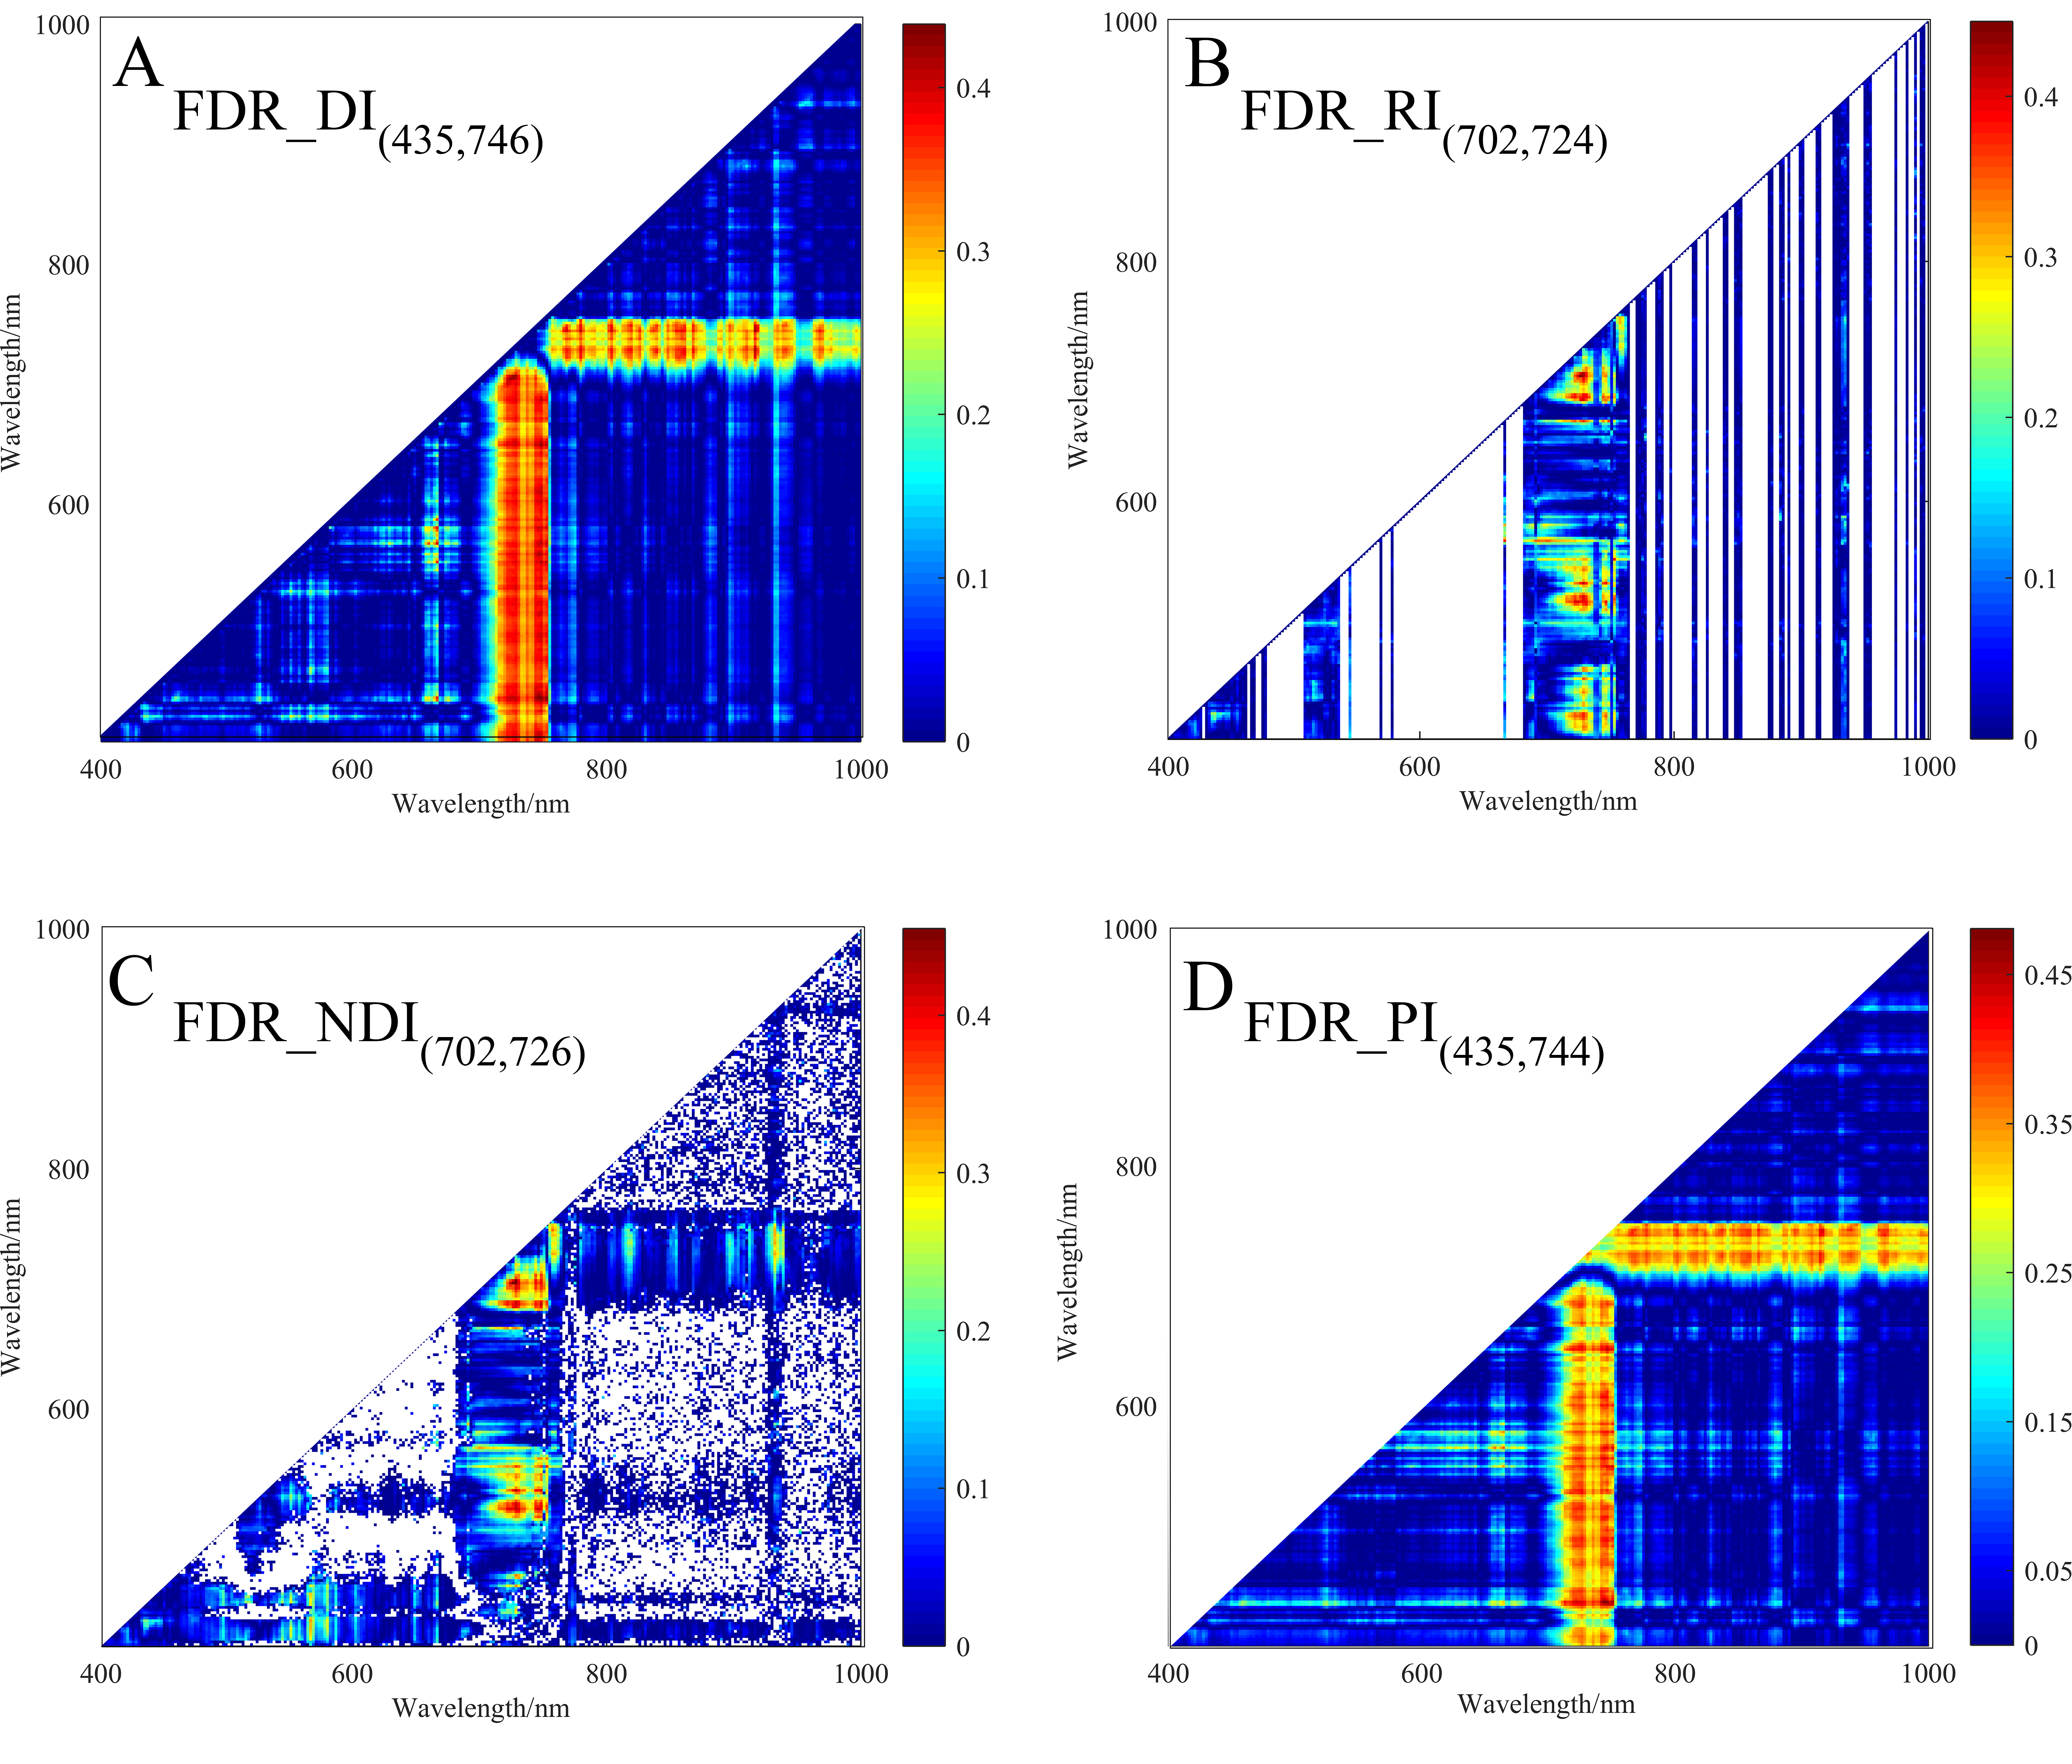
r2 maps of 2D spectral indices based on FDR
(A) r2 maps of FDR_DI(435,746). (B) r2 maps of FDR_RI(702,724). (C) r2 maps of FDR_NDI(702,726). (D) r2 maps of FDR_PI(435,744). The colorbar illustrates the value of the square of the correlation coefficient (r2) between SMC and spectral indices, and the x- axes and y-axes indicate the wavebands of 400–1000 nm. Dark red portrays a high r2 between SMC and the spectral indices.
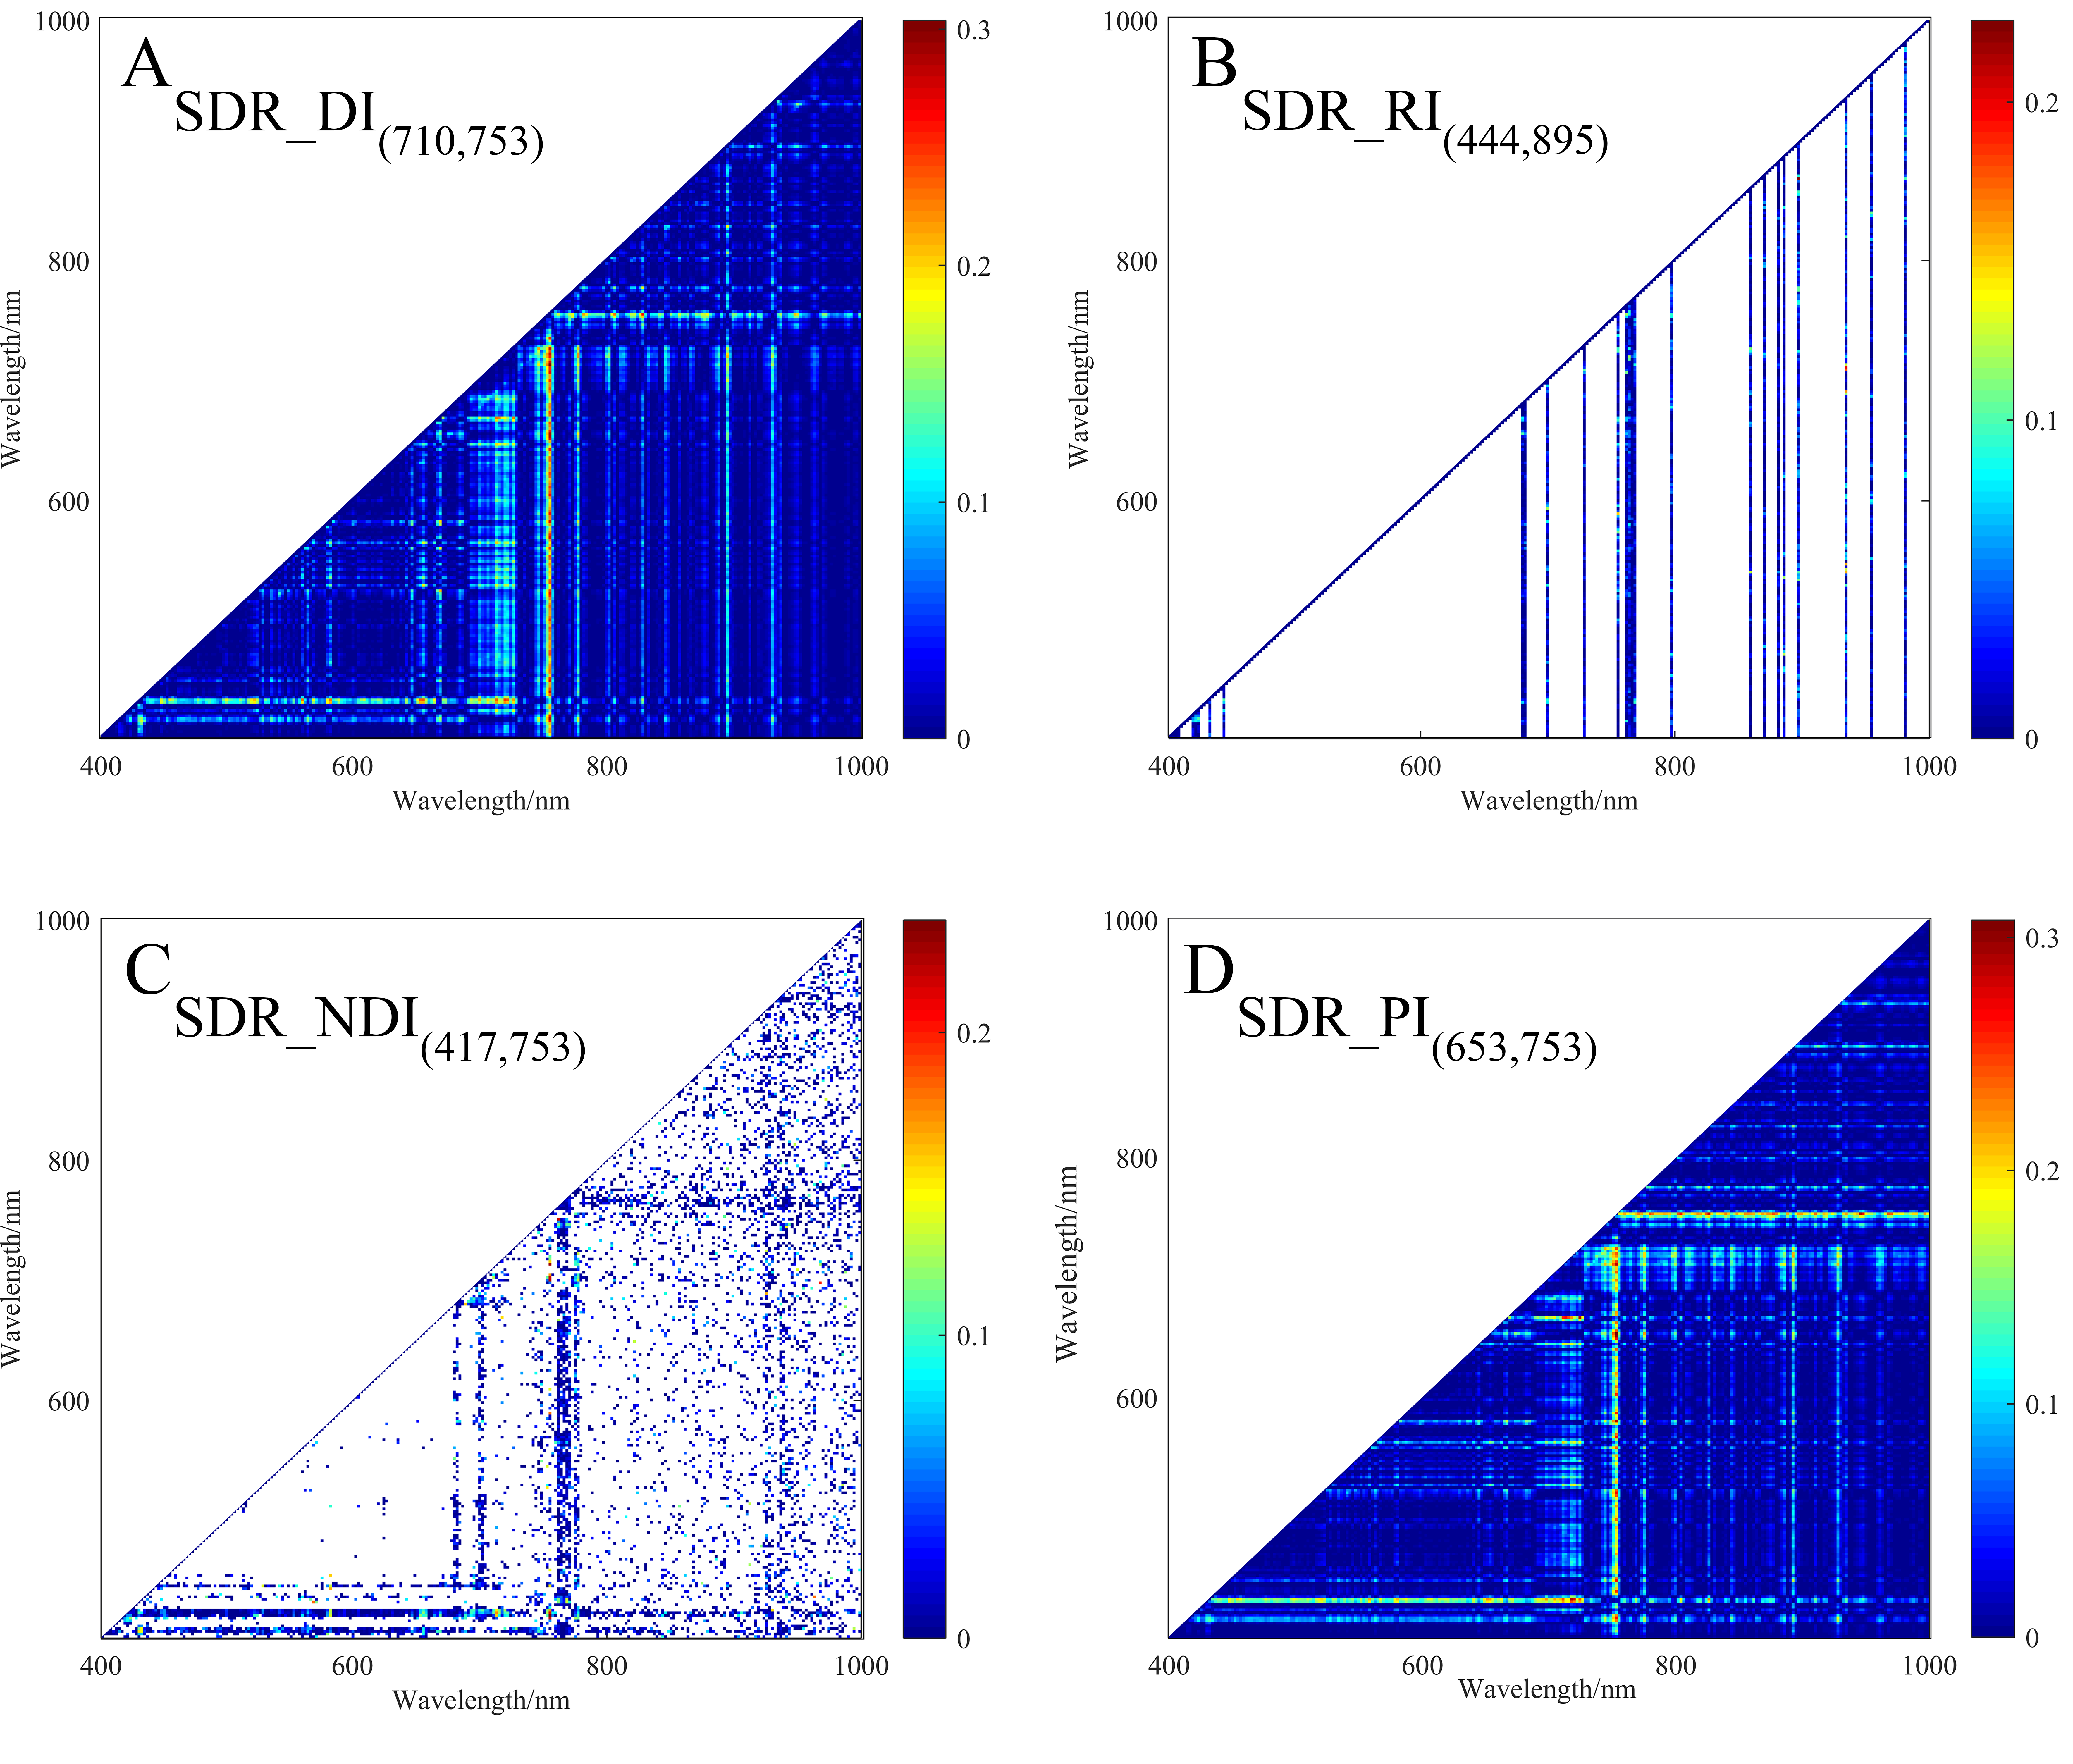
r2 maps of 2D spectral indices based on SDR
(A) r2 maps of SDR_DI(710,753). (B) r2 maps of SDR_RI(444,895). (C) r2 maps of SDR_NDI(417,753). (D) r2 maps of SDR_PI(653,753). The colorbar illustrates the value of the square of the correlation coefficient (r2) between SMC and spectral indices, and the x- axes and y-axes indicate the wavebands of 400–1000 nm. Dark red portrays a high r2 between SMC and the spectral indices.
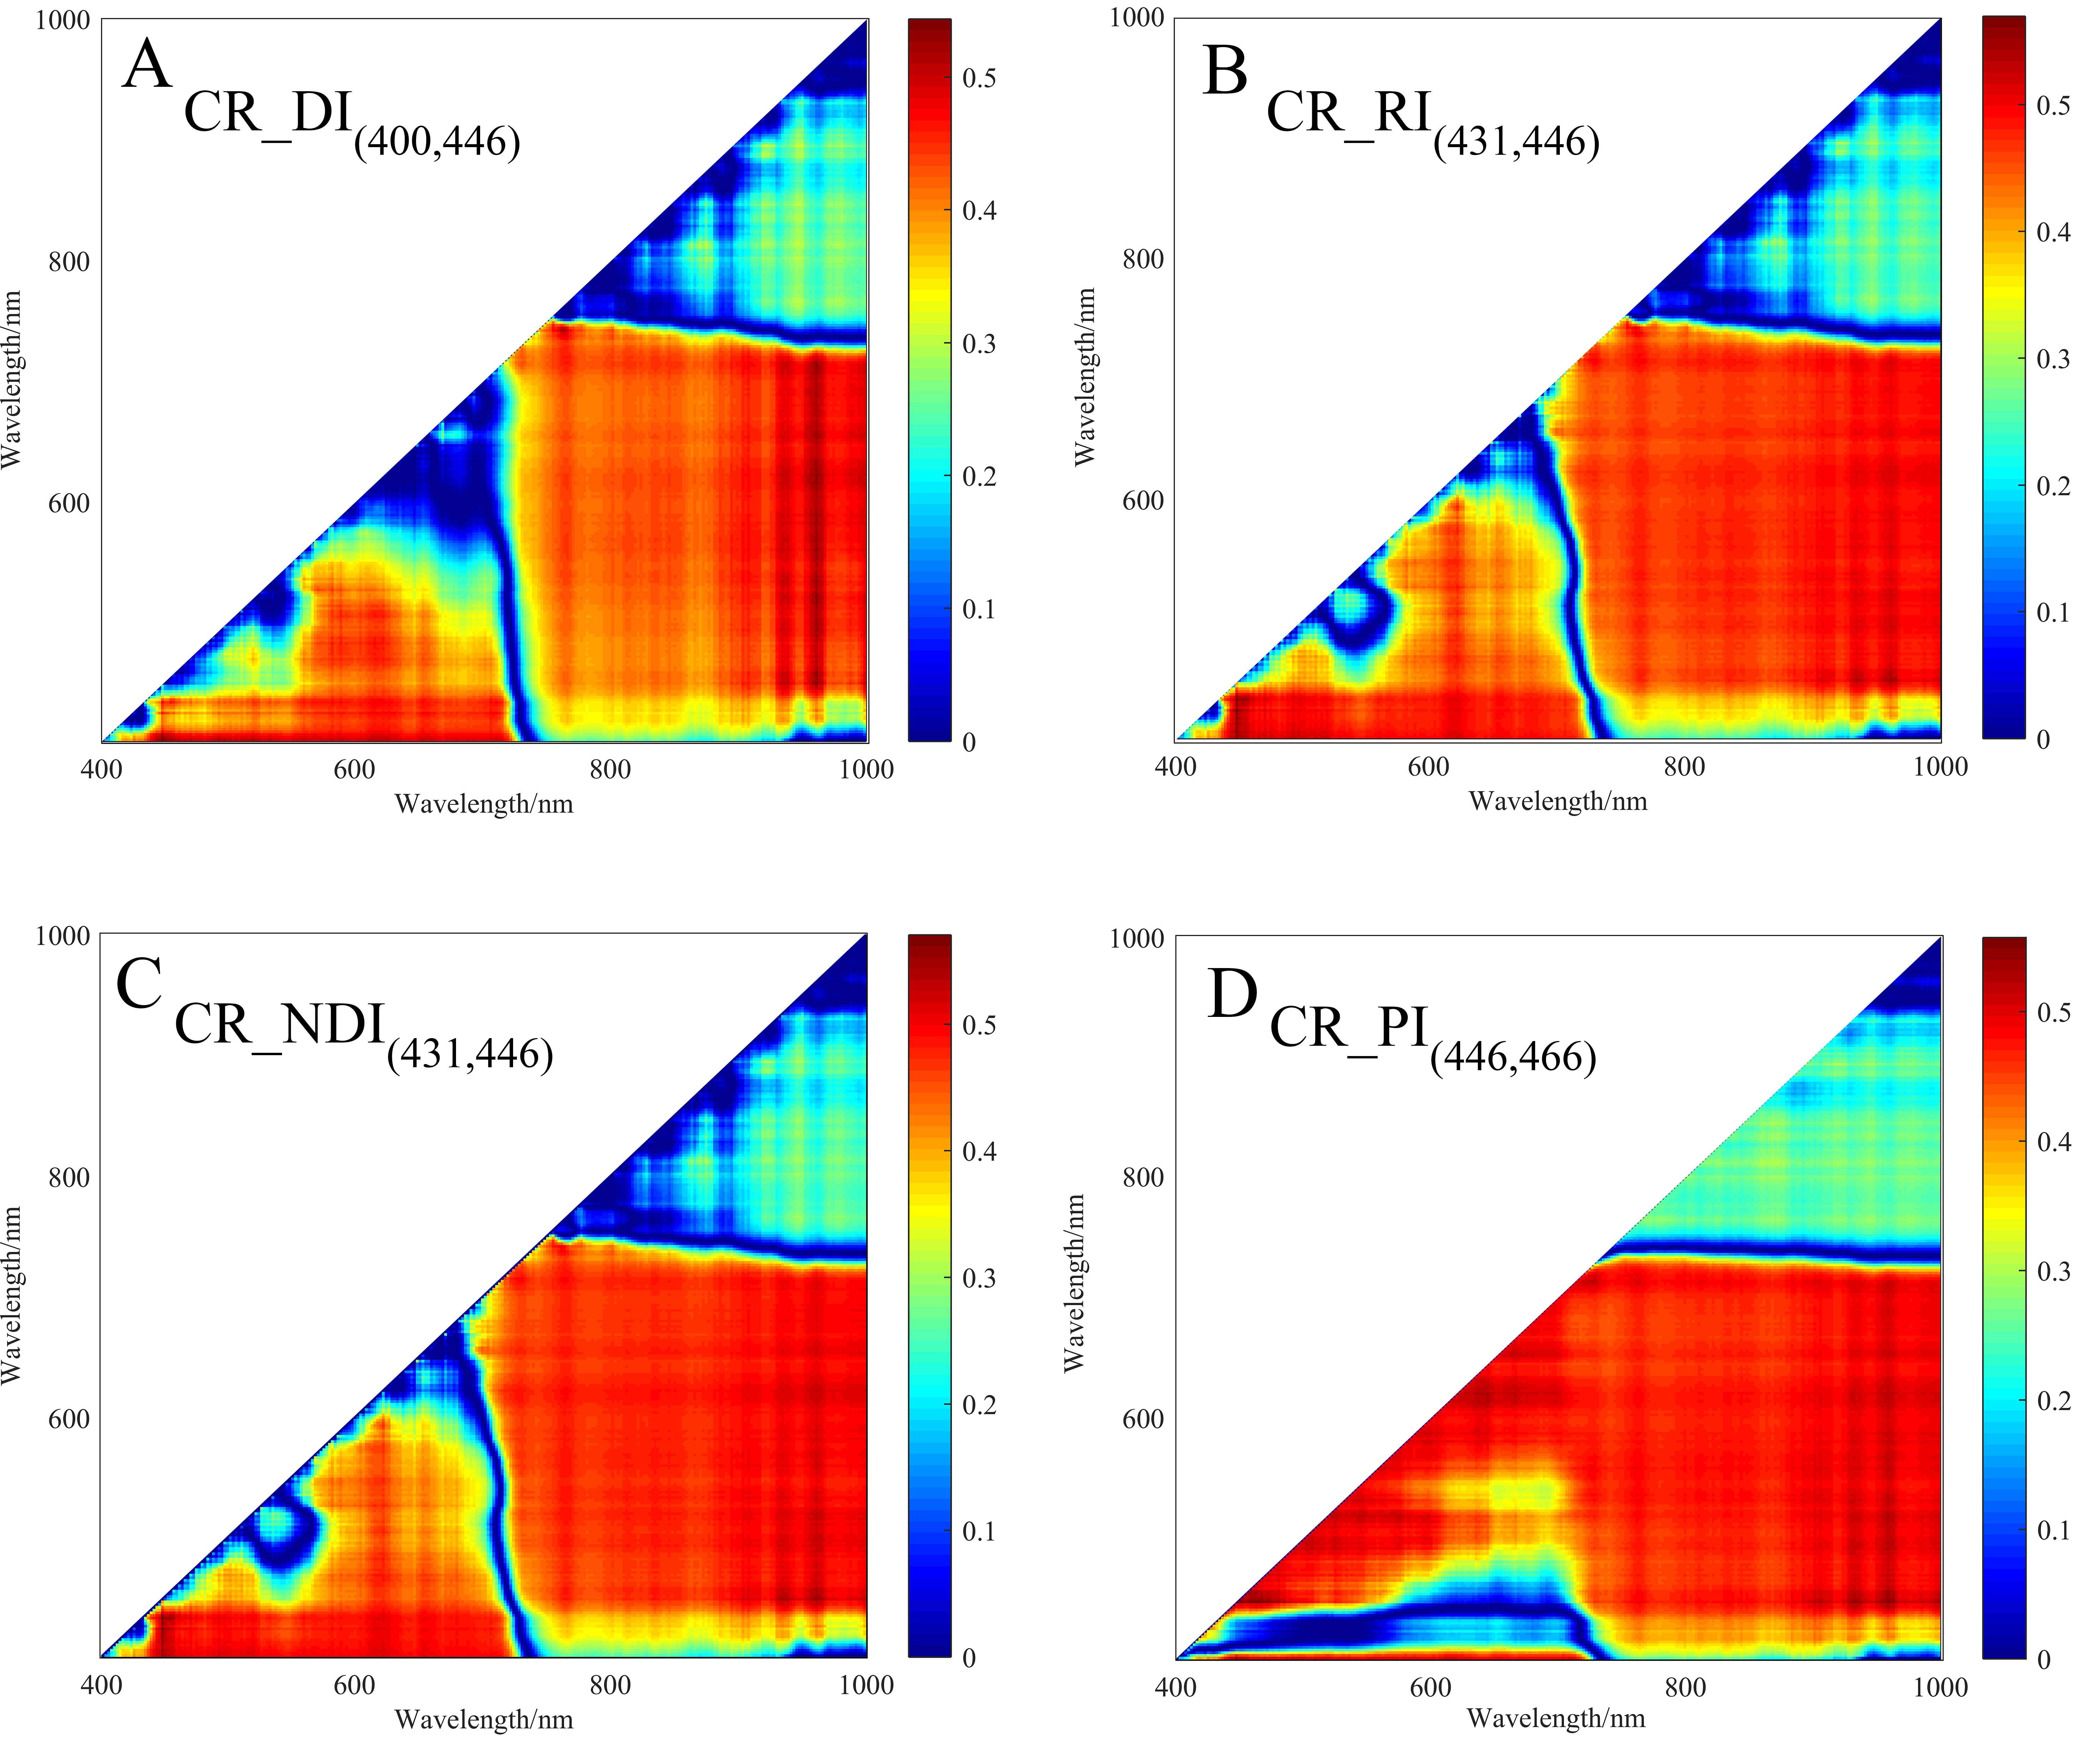
r2 maps of 2D spectral indices based on CR
(A) r2 maps of CR_DI(400,446). (B) r2 maps of CR_RI(431,446). (C) r2 maps of CR_NDI(431,446). (D) r2 maps of CR_PI(446,466). The colorbar illustrates the value of the square of the correlation coefficient (r2) between SMC and spectral indices, and the x- axes and y-axes indicate the wavebands of 400–1000 nm. Dark red portrays a high r2 between SMC and the spectral indices.
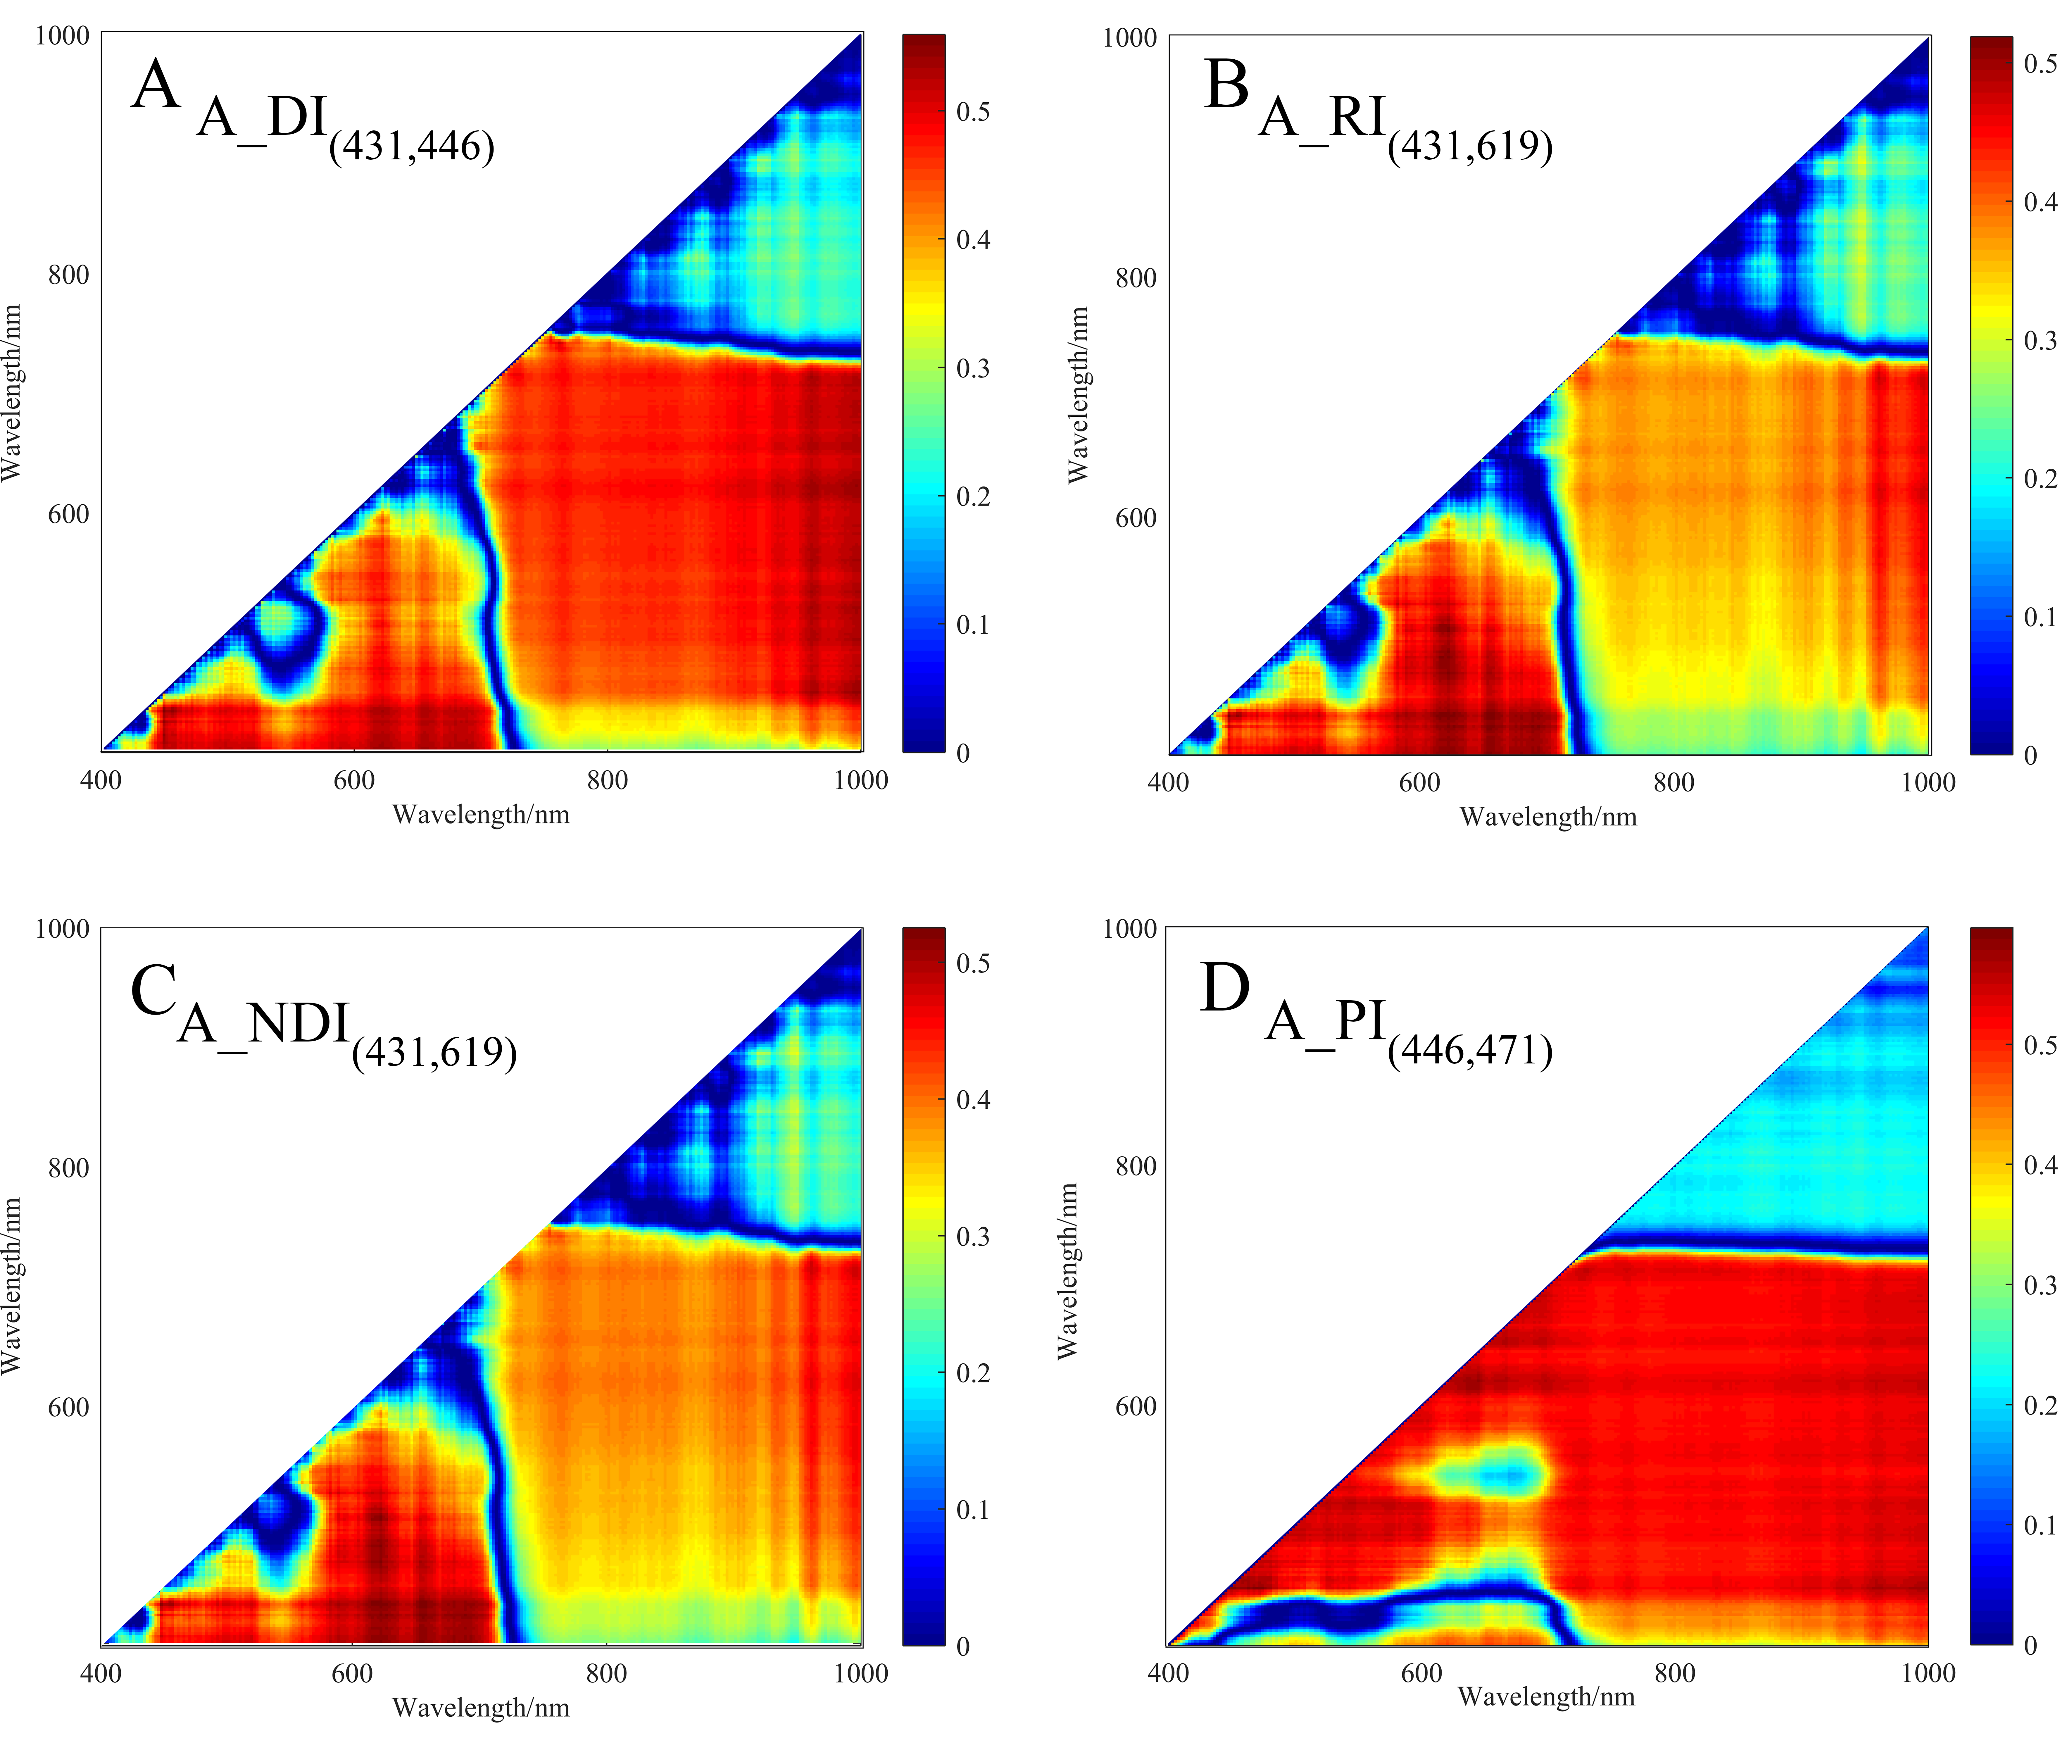
r2 maps of 2D spectral indices based on A
(A) r2 maps of A_DI(431,446) . (B) r2 maps of A_RI(431,619) . (C) r2 maps of A_NDI(431,619). (D) r2 maps of A_PI(446,471). The colorbar illustrates the value of the square of the correlation coefficient (r2) between SMC and spectral indices, and the x- axes and y-axes indicate the wavebands of 400–1000 nm. Dark red portrays a high r2 between SMC and the spectral indices.
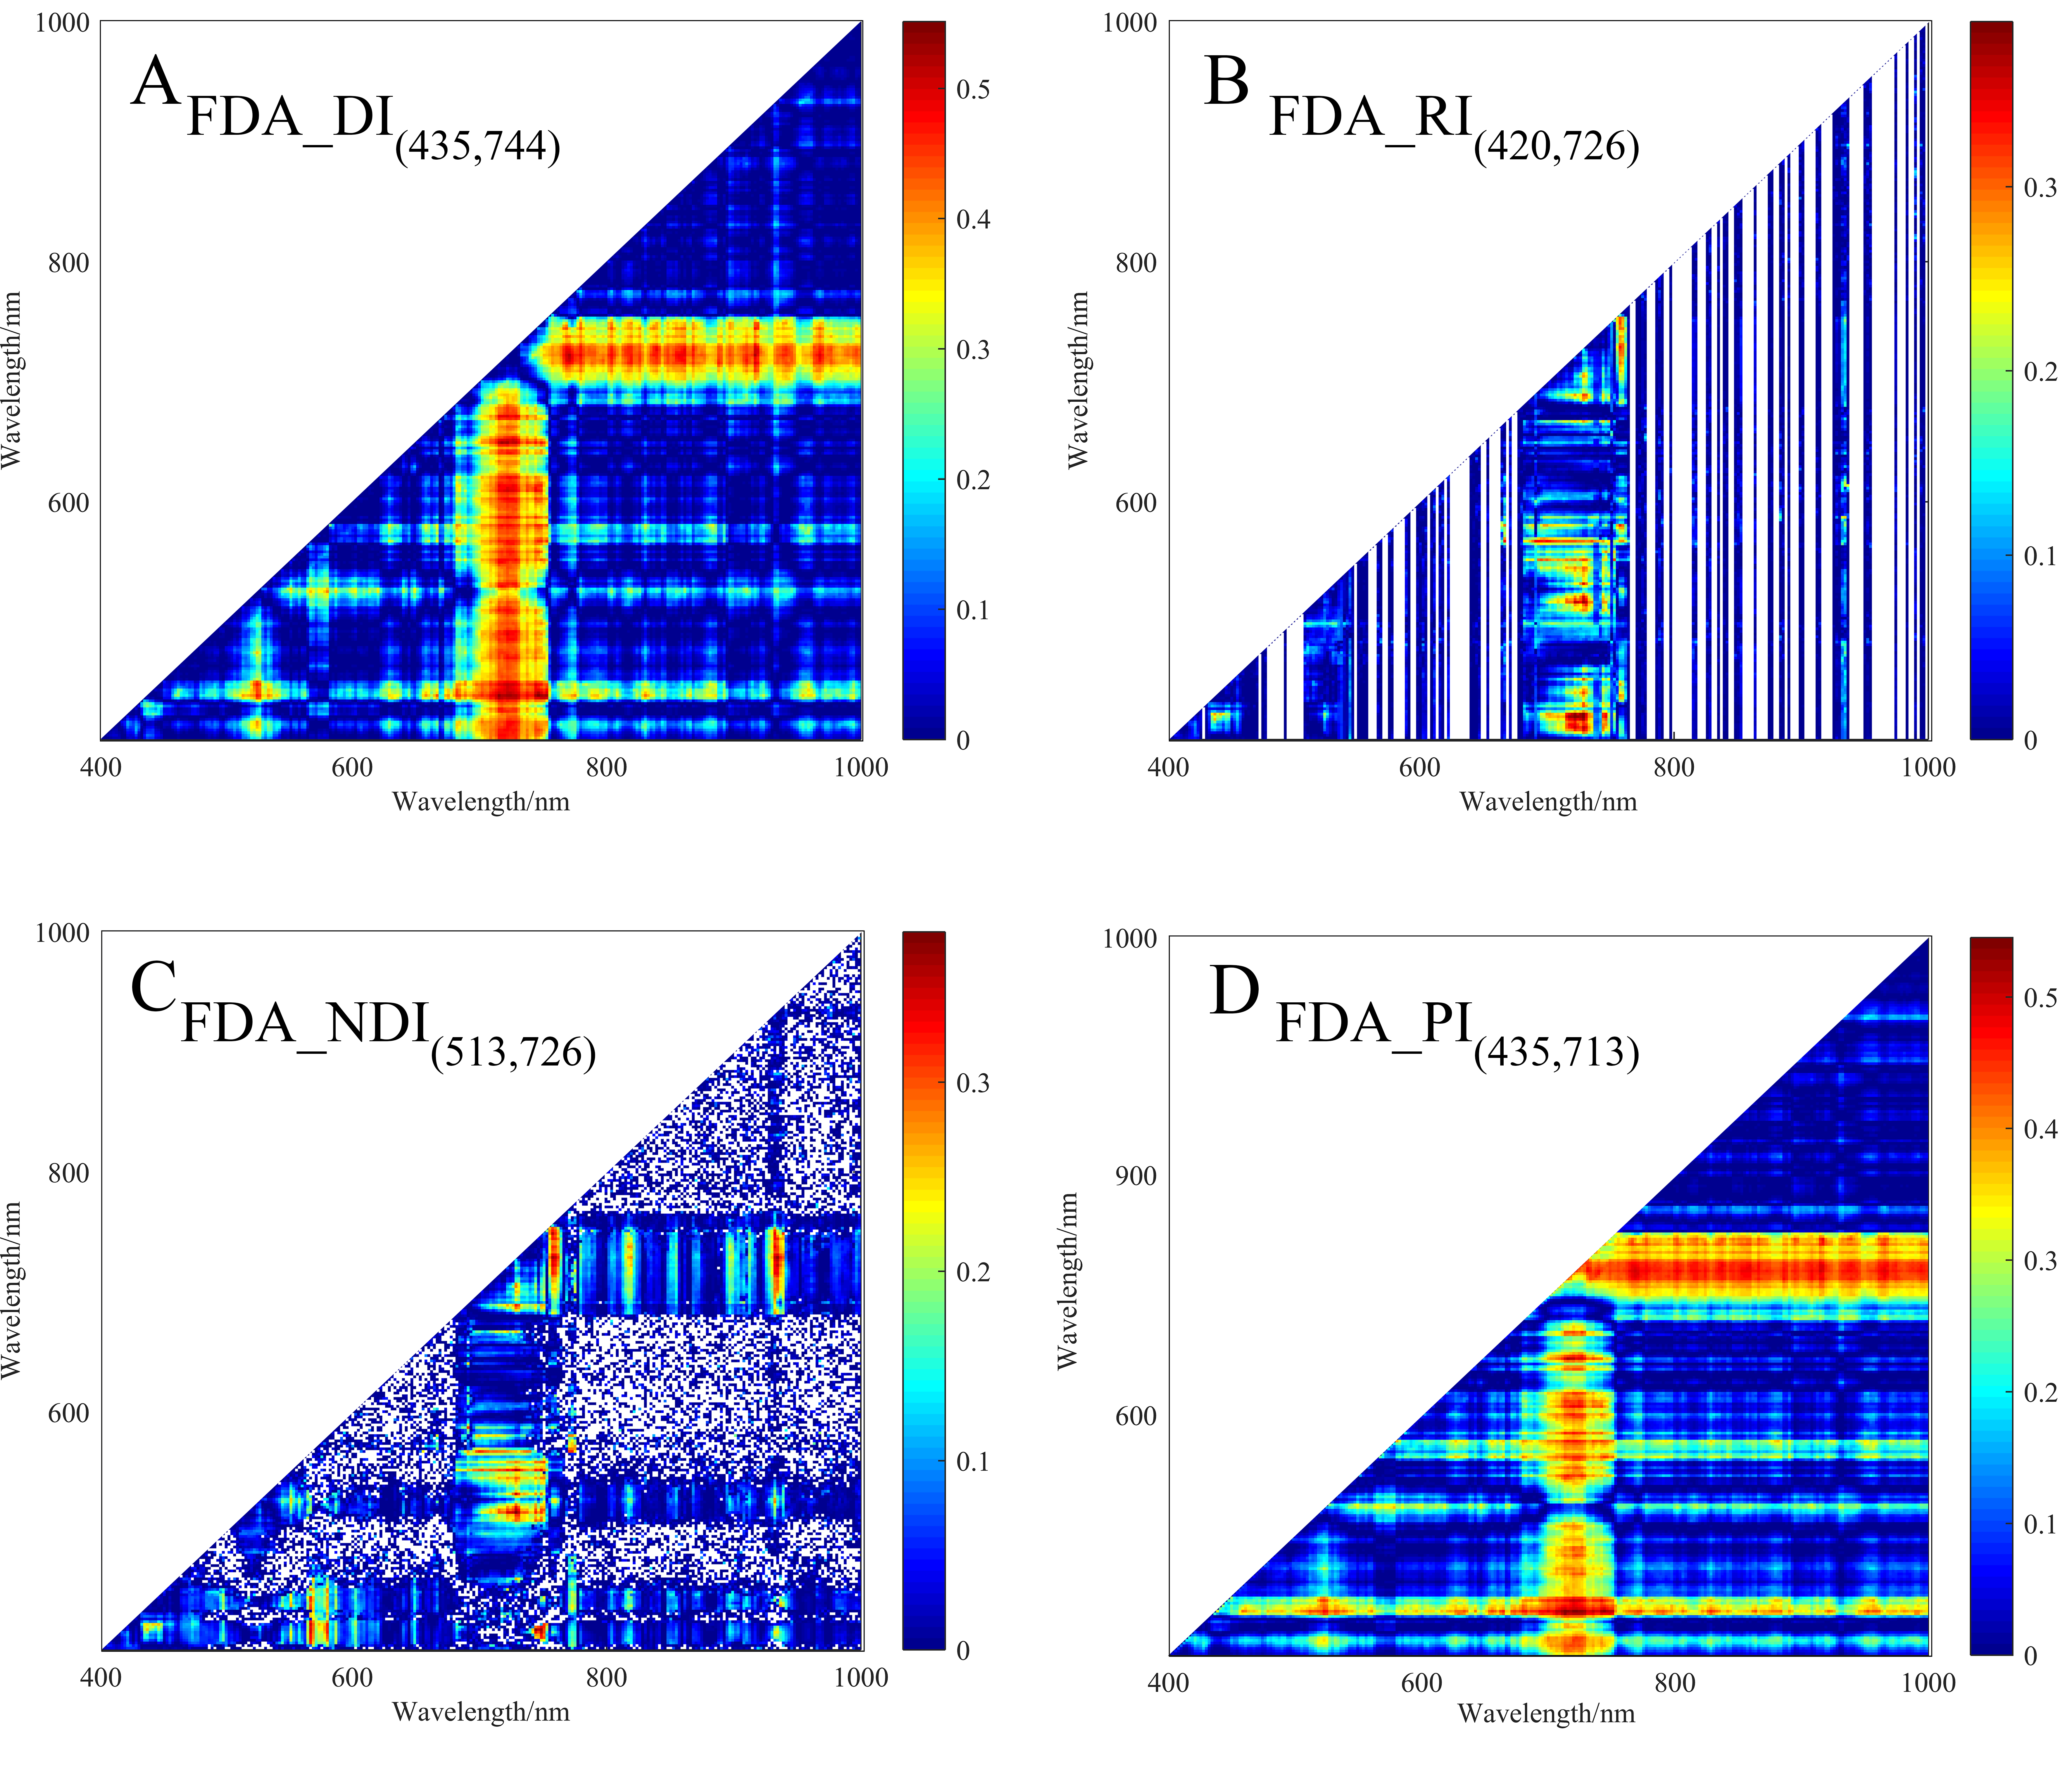
r2 maps of 2D spectral indices based on FDA
(A) r2 maps of FDA_DI(435,744) . (B) r2 maps of FDA_RI(420,726) . (C) r2 maps of FDA_NDI(513,726). (D) r2 maps of FDA_PI(435,713). The colorbar illustrates the value of the square of the correlation coefficient (r2) between SMC and spectral indices, and the x- axes and y-axes indicate the wavebands of 400–1000 nm. Dark red portrays a high r2 between SMC and the spectral indices.
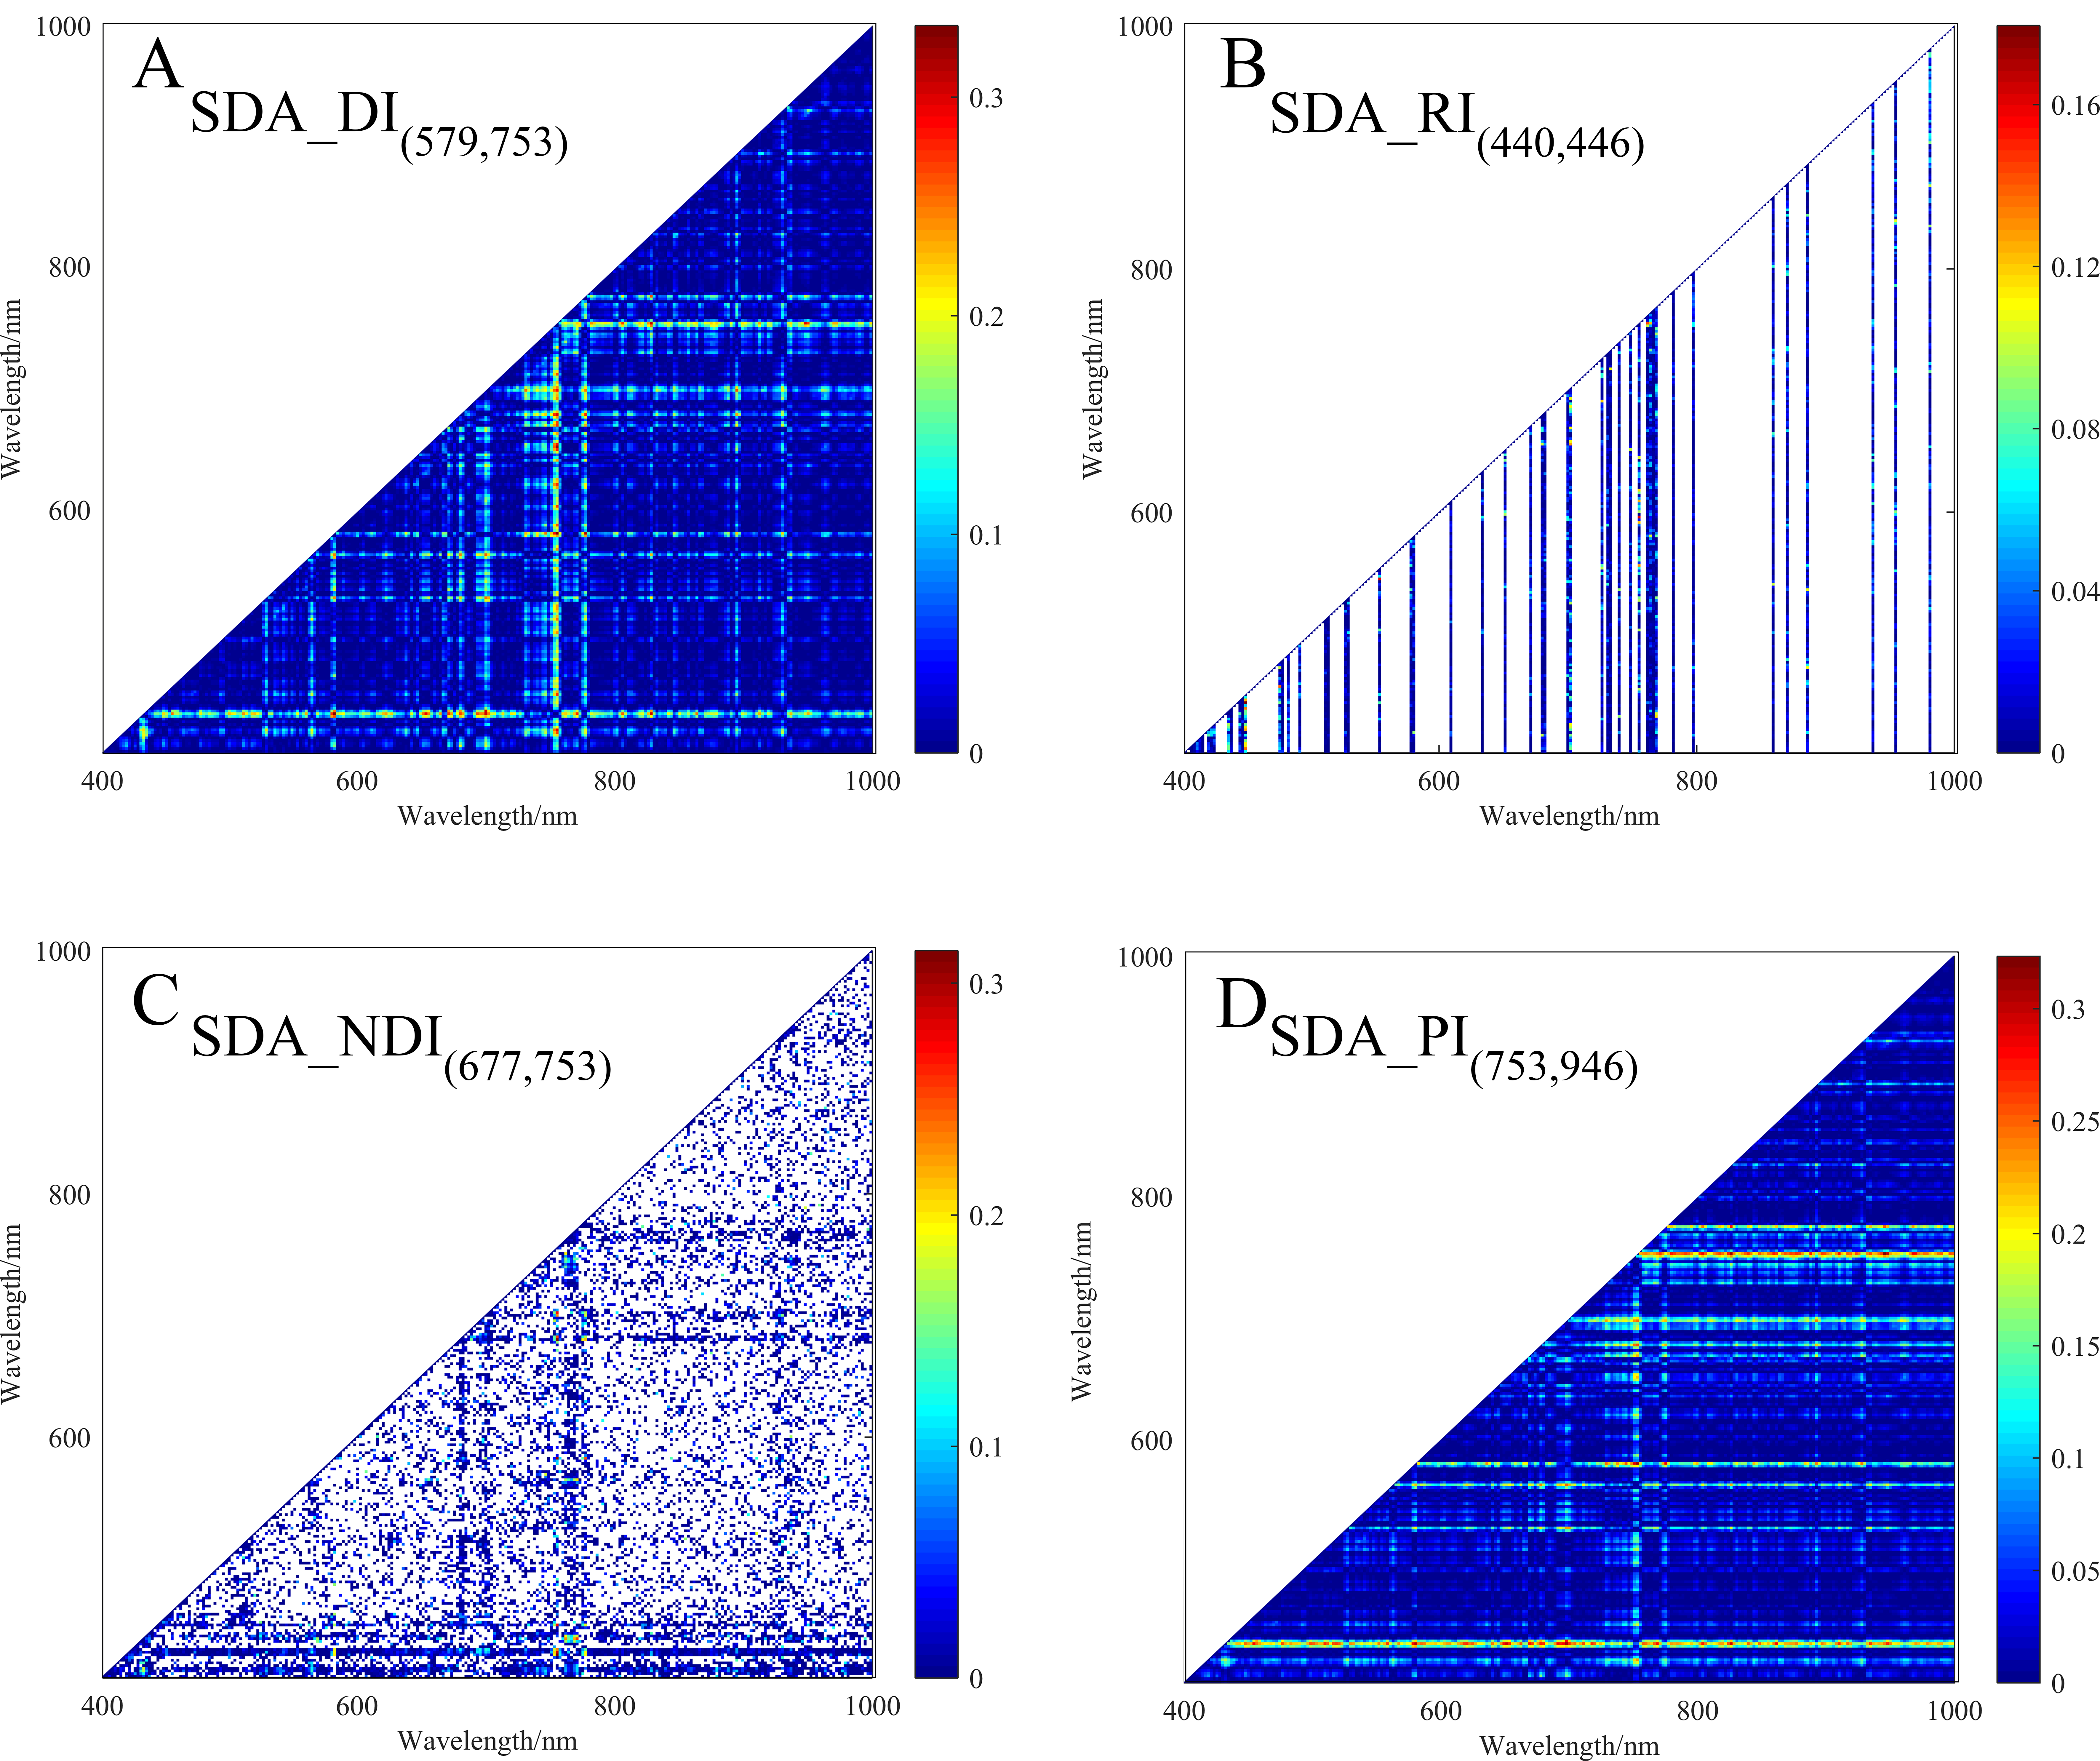
r2 maps of 2D spectral indices based on SDA
(A) r2 maps of SDA_DI(579,753) . (B) r2 maps of SDA_RI(440,446) . (C) r2 maps of SDA_NDI(477,753). (D) r2 maps of SDA_PI(753,946). The colorbar illustrates the value of the square of the correlation coefficient (r2) between SMC and spectral indices, and the x- axes and y-axes indicate the wavebands of 400–1000 nm. Dark red portrays a high r2 between SMC and the spectral indices.
Spectral information extracted from UAV hyperspectral imagery
Reflectance of samples (n= 70)