Cell Differentiation Processes as Spatial Networks: identifying four-dimensional structure in embryogenesis
- Published
- Accepted
- Subject Areas
- Bioinformatics, Computational Biology, Developmental Biology
- Keywords
- Complex Networks, Embryogenesis, Computational Biology
- Copyright
- © 2018 Alicea et al.
- Licence
- This is an open access article distributed under the terms of the Creative Commons Attribution License, which permits unrestricted use, distribution, reproduction and adaptation in any medium and for any purpose provided that it is properly attributed. For attribution, the original author(s), title, publication source (PeerJ Preprints) and either DOI or URL of the article must be cited.
- Cite this article
- 2018. Cell Differentiation Processes as Spatial Networks: identifying four-dimensional structure in embryogenesis. PeerJ Preprints 6:e26587v1 https://doi.org/10.7287/peerj.preprints.26587v1
Abstract
There are two basic forms of animal development: mosaic (as found in roundworms and sea squirts) and regulative (as found in amphibians and mammals). How might one distinguish between each type of development? Using a four-dimensional spatial representation (x,y,z,t), major features of the developmental process are revealed. To establish the role of mosaic mechanisms, we can map the cell division process to a computational representation of C. elegans embryogenesis using a directed, acyclic graph (DAG) and a differentiation code. Mosaic development is identifiable by observing spatial localization of progenitor and descendent cells. This three-dimensional compartmentalization should be consistent with nesting in the cell lineage tree. Regulative development should demonstrate spatial “smearing”, or deviations from the compartmentalization of the mosaic process. In a complementary manner, complex network statistics should confirm this by providing an approximation of embryo geometry. Characterizing the spatial organization and geometry of embryos in this way allows for heuristic indicators of developmental patterns both within and between organisms.
Author Comment
All raw data used in this study are available at Github.
Lineage Tree Raw Data: https://github.com/balicea/DevoWorm/tree/master/Lineage%20Tree%20DB
Differentiation Tree Raw Data: https://github.com/balicea/DevoWorm/tree/master/Differentiation%20Tree%20Dataset
All processed data (used in the analyses) are available from the Open Science Framework: https://osf.io/q9jvb/[p]
Supplemental Information
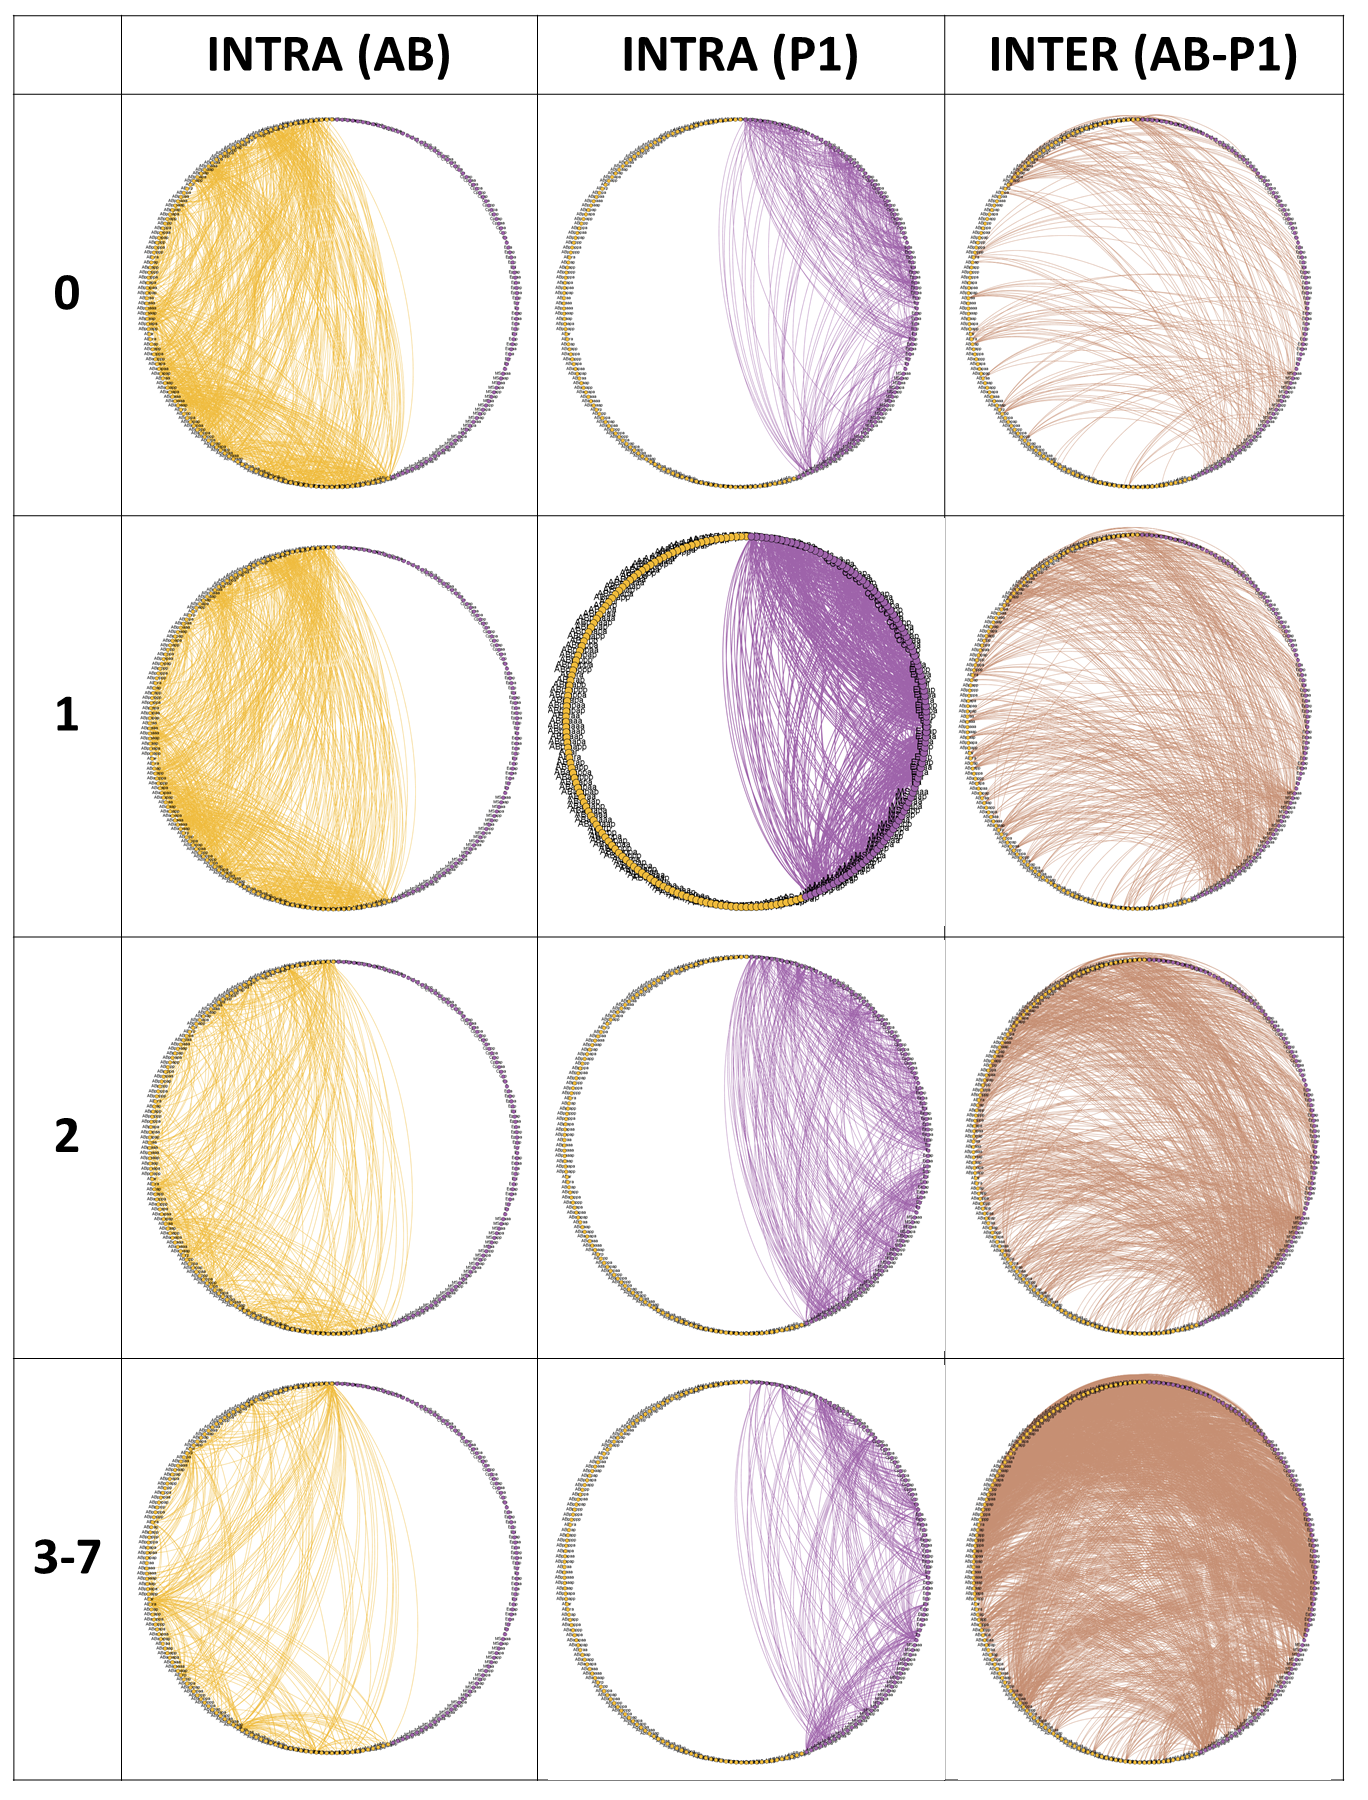
Supplemental File 1: Circular network topologies comparing connections among subtrees and tree levels
The x-axis features a series of circular networks based on the number of above threshold connections between cells at different levels of the tree in a 7 level (128-cell condition) tree.
Rows in descending order: no difference in tree level (0), difference of one level (1), difference of two levels (2), difference of between 3 and 7 levels (3-7).
Columns from left to right: all connections between cells in the AB sublineage only (intra-AB), all connections between cells in the P1 sublineage only (intra-P1), all connections between cells where one cell is from the AB sublineage and the other cell is from the P1 sublineage (inter-AB-P1).
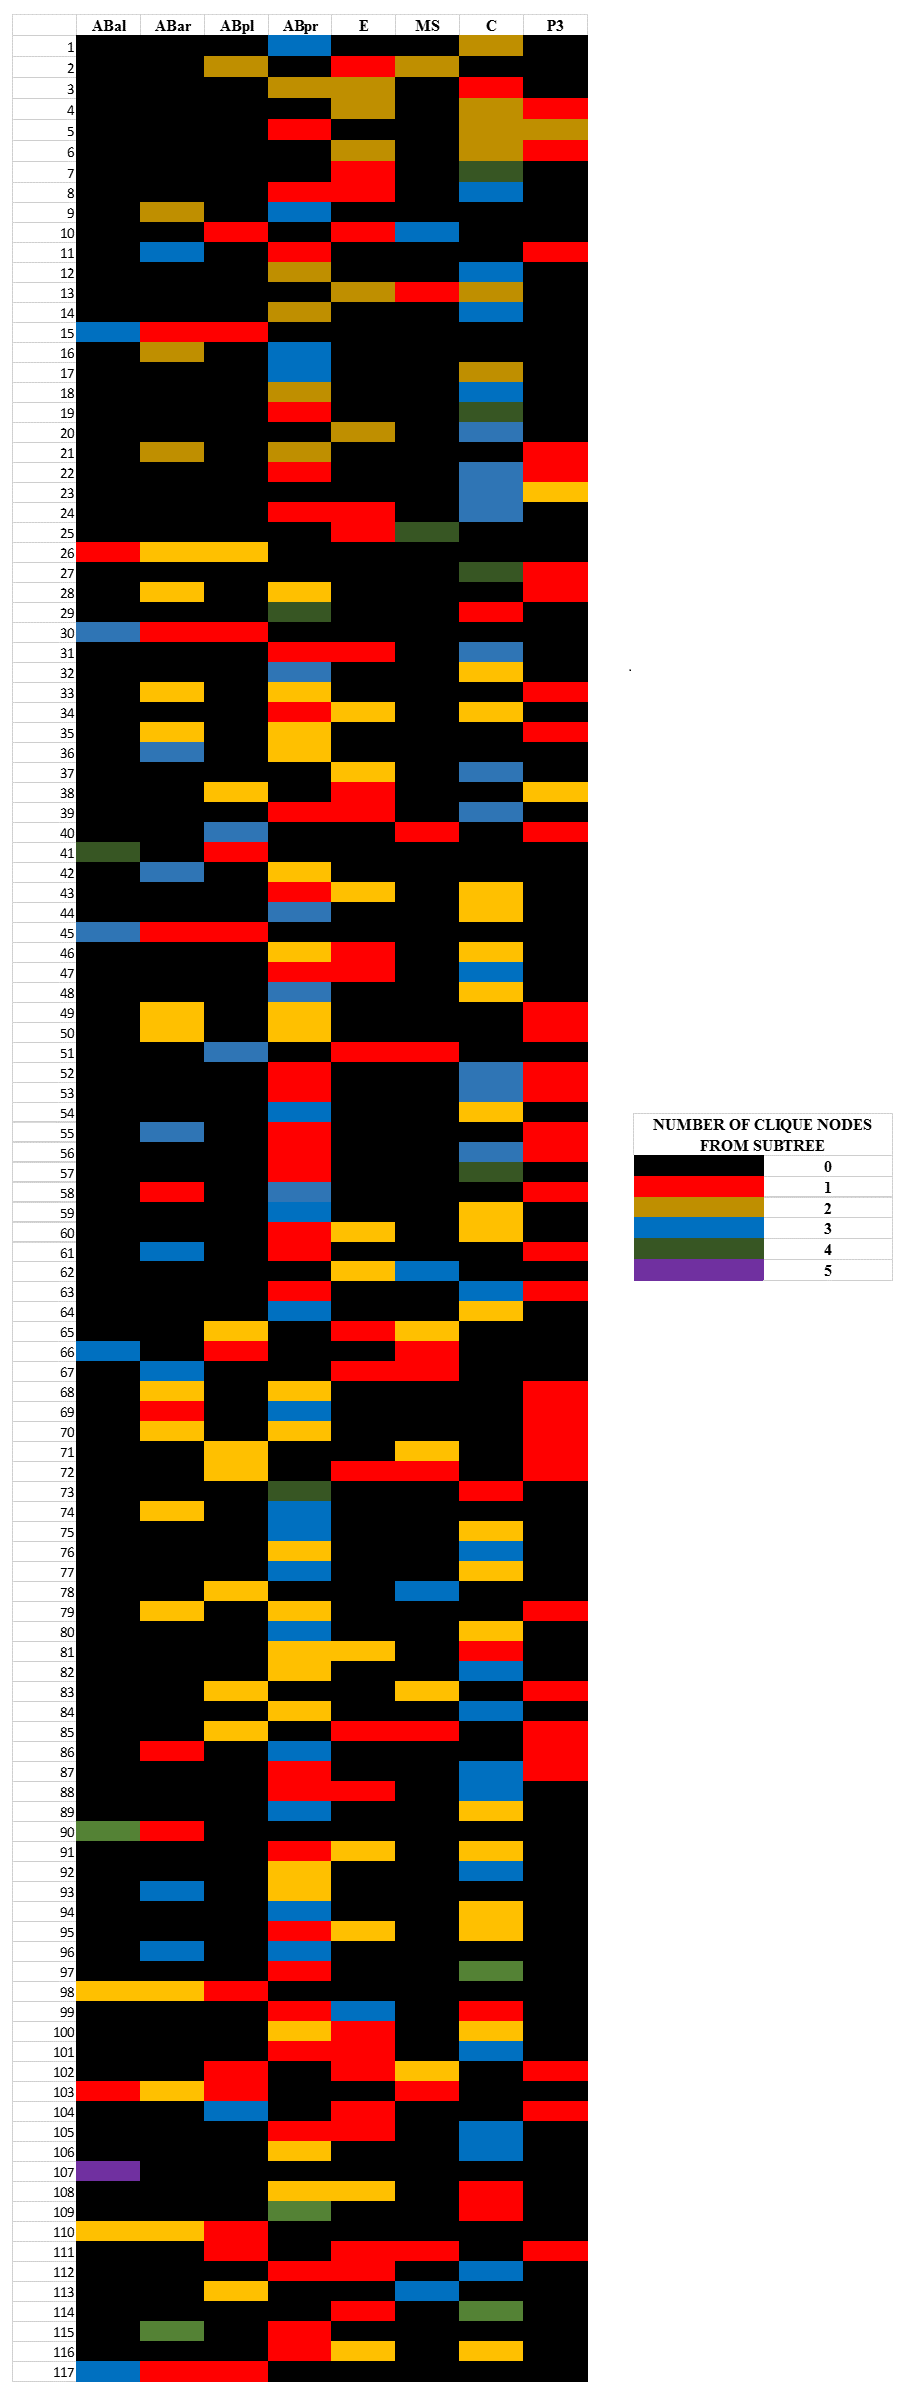
Supplemental File 2: Heat map of the clique analysis for a 7 level (128-cell condition) tree
Each row represents a unique clique generated from a connectivity matrix of the 7 level tree. The heat map columns represent the number of members in the generated cliques from each octopartite subtree (8 categories). Color coding scheme is presented in the legend to the right of the map.