Foliar fungal communities strongly differ between habitat patches in a landscape mosaic
- Published
- Accepted
- Subject Areas
- Agricultural Science, Ecology, Microbiology, Mycology, Plant Science
- Keywords
- Bioaerosols, Dispersal, Landscape, Grapevine, Forest, Selection, Edges, Phyllosphere
- Copyright
- © 2016 Fort et al.
- Licence
- This is an open access article distributed under the terms of the Creative Commons Attribution License, which permits unrestricted use, distribution, reproduction and adaptation in any medium and for any purpose provided that it is properly attributed. For attribution, the original author(s), title, publication source (PeerJ Preprints) and either DOI or URL of the article must be cited.
- Cite this article
- 2016. Foliar fungal communities strongly differ between habitat patches in a landscape mosaic. PeerJ Preprints 4:e2458v1 https://doi.org/10.7287/peerj.preprints.2458v1
Abstract
Dispersal events between habitat patches in a landscape mosaic can structure ecological communities and influence the functioning of agrosystems. Here we investigated whether short-distance dispersal events between vineyard and forest patches shape foliar fungal communities. We hypothesized that these communities homogenize between habitats over the course of the growing season, particularly along habitat edges, because of aerial dispersal of spores.
We monitored the richness and composition of foliar and airborne fungal communities over the season, along transects perpendicular to edges between vineyard and forest patches, using Illumina sequencing of the ITS2 region.
In contrast to our expectation, foliar fungal communities in vineyards and forest patches increasingly differentiate over the growing season, even along habitat edges. Moreover, the richness of foliar fungal communities in grapevine drastically decreased over the growing season, in contrast to that of forest trees. The composition of airborne communities did not differ between habitats. The composition of oak foliar fungal communities change between forest edge and centre.
These results suggest that dispersal events between habitat patches are not major drivers of foliar fungal communities at the landscape scale. Selective pressures exerted in each habitat by the host plant, the microclimate and the agricultural practices play a greater role, and might account for the differentiation of foliar fugal communities between habitats.
Author Comment
This is a submission to PeerJ for review.
Supplemental Information
Dataset and R script used for the statistical analyses
Bray-Curtis dissimilarity of foliar fungal communities between each pair of host species and for each sampling date
These values were calculated exclusively with dissimilarity between samples within sampling sites (mean ± SD).
Results of PERMANOVA for OTU composition for both foliar and airborne fungal communities
The response variables are averaged Jaccard dissimilarity matrices, computed over 100 rarefactions of the OTU matrix. In both models, sampling site was included as a stratification variable. The values in bold are significant.
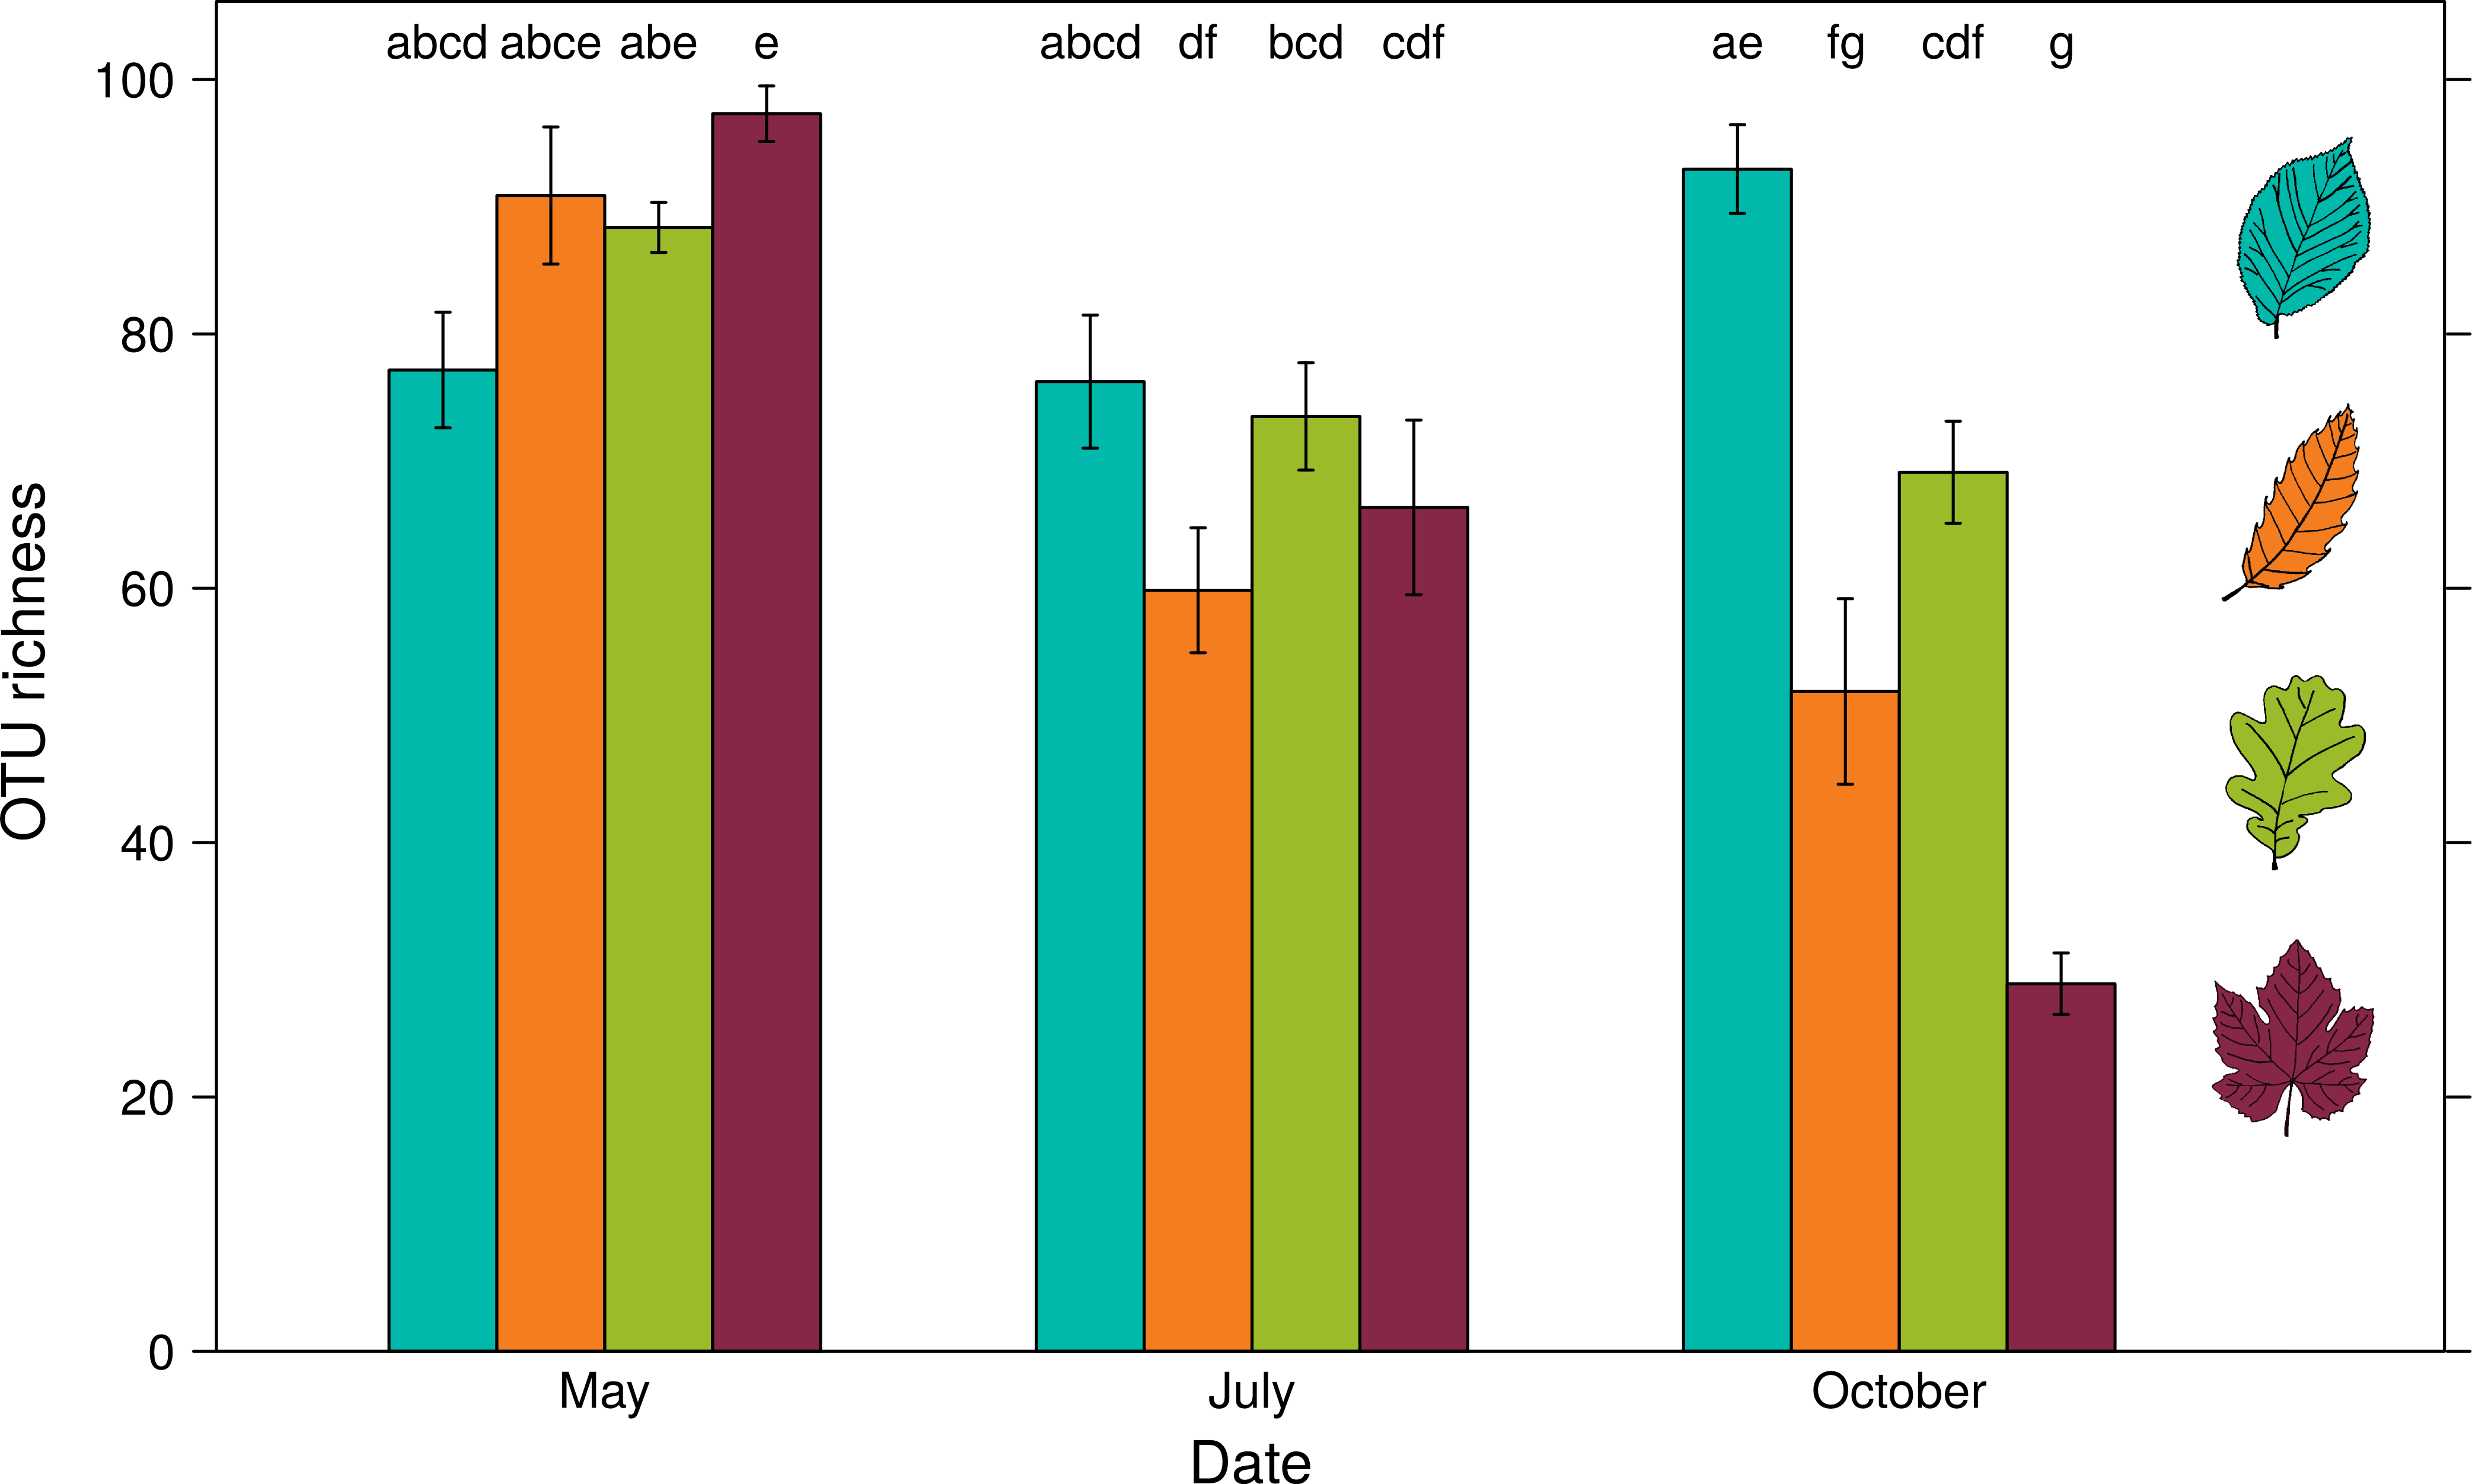
OTU richness of foliar fungal communities for all host species, depending on the sampling date
Oak fungal foliar community richness is represented in green, hornbeam in blue, chestnut in orange and grapevine in red. Error bars represent the SE of the mean. Different letters indicate significant differences in mean (Tukey's post-hoc pairwise comparison test).
Edge effect on the OTU richness of foliar fungal communities for all host species
Error bars represent the SE of the mean.
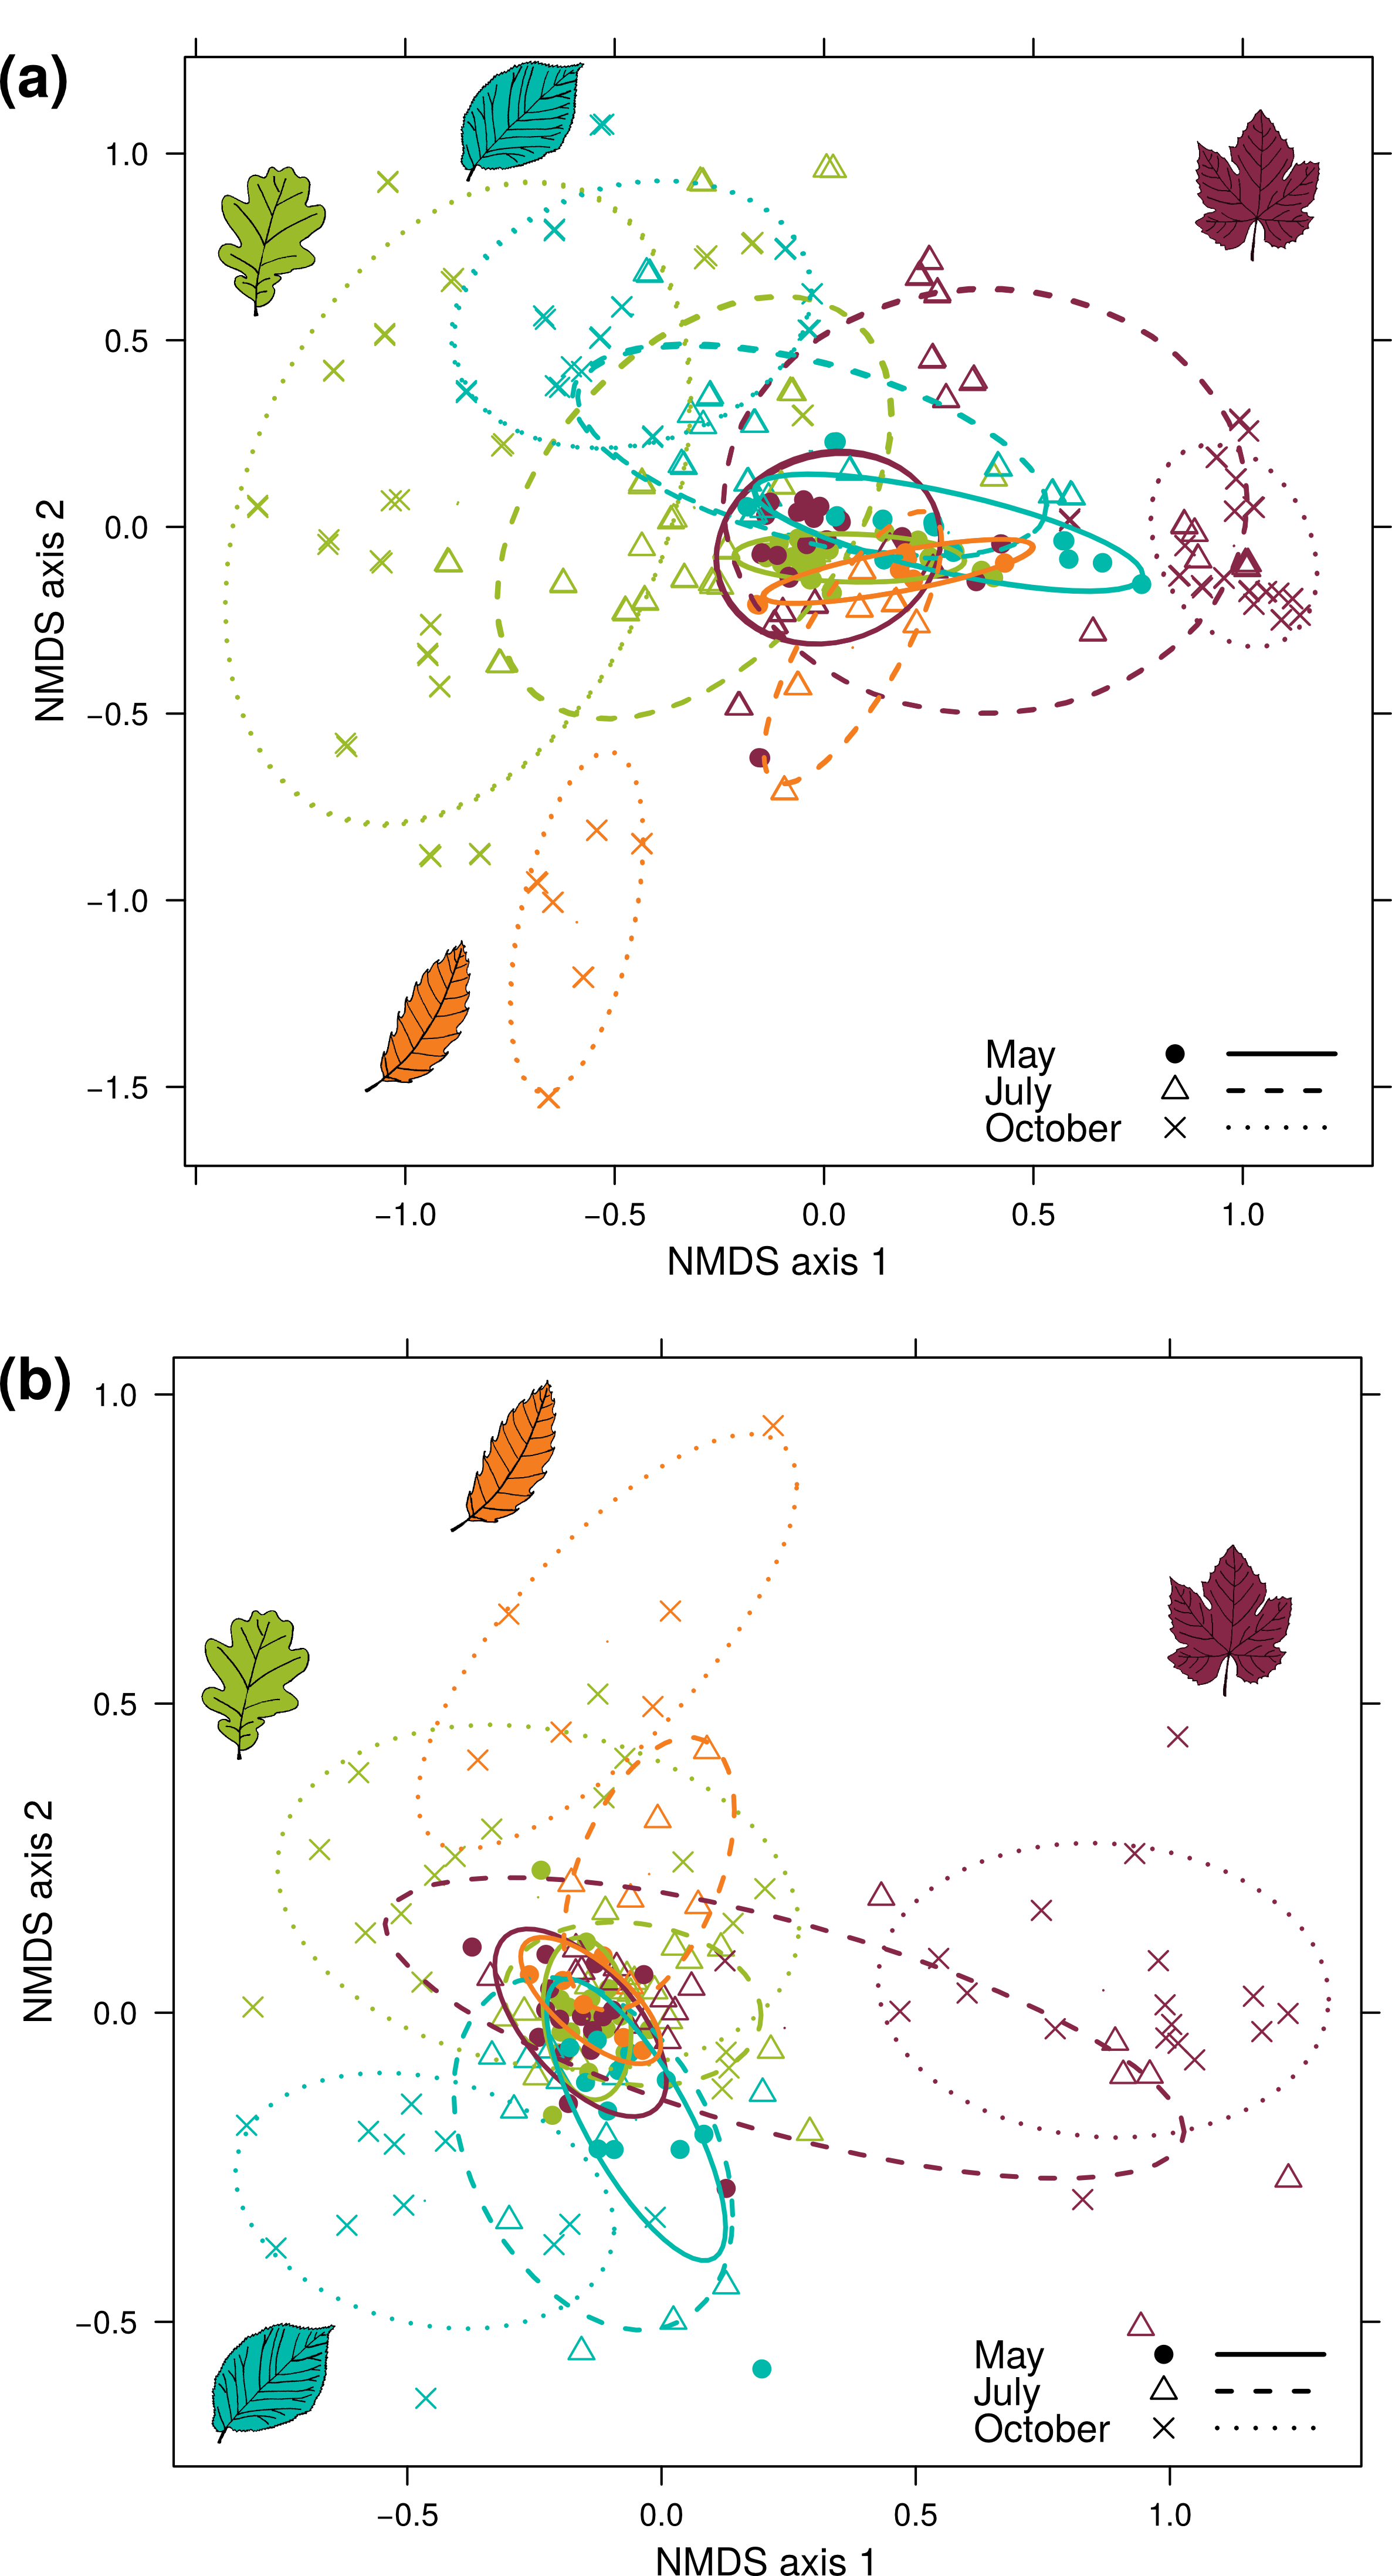
NMDS representing foliar fungal community dissimilarities
(a) Bray-Curtis dissimilarities, computed over 100 random rarefaction matrices. The stress value associated with these representations was 0.170. (b) Jaccard dissimilarities, computed over 100 random rarefaction matrices. The stress value associated with these representations was 0.158. Each point represents a sample: colours indicate the host species (hornbeam in blue, chestnut in orange, oak in green and grapevine in red) and the shape of the symbol indicates the sampling date. The confidence ellipsoid at the 0.68 level is shown for all combinations of these two factors.
ANOVA table performed on the richness calculated with the unrarefied OTU table
Effect of the abundance (number of sequences per sample), sampling date (May, July or October), host species (oak, hornbeam, chestnut or grapevine) or habitat (vineyard or forest), edge (habitat centre or center) and their interaction on OTU richness in foliar and airborne fungal communities. In both models, sampling site was included as a random variable. Rm2 is the marginal coefficient of determination (for fixed effects) and Rc2 the conditional coefficient of determination (for fixed and random effects). Bold values ares the significant ones.
PERMANOVA table, performed on the Bray-Curtis dissimilarity matrix calculated with the unrarefied OTU matrix
Effect of sampling date (May, July or October), host species (oak, hornbeam, chestnut or grapevine) or habitat (vineyard or forest), edge (habitat centre or center) and their interaction on the composition of foliar and airborne fungal communities. In both models, sampling site was included as a stratification variable. Bold values ares the significant ones.