Mining integrated semantic networks for drug repositioning opportunities
- Published
- Accepted
- Subject Areas
- Bioinformatics, Computational Biology, Drugs and Devices, Pharmacology, Computational Science
- Keywords
- data integration, drug repositioning, systems approaches, data mining, semantic networks, semantic subgraphs, bioinformatics, drug target interactions
- Copyright
- © 2015 Mullen et al.
- Licence
- This is an open access article distributed under the terms of the Creative Commons Attribution License, which permits unrestricted use, distribution, reproduction and adaptation in any medium and for any purpose provided that it is properly attributed. For attribution, the original author(s), title, publication source (PeerJ PrePrints) and either DOI or URL of the article must be cited.
- Cite this article
- 2015. Mining integrated semantic networks for drug repositioning opportunities. PeerJ PrePrints 3:e1427v1 https://doi.org/10.7287/peerj.preprints.1427v1
Abstract
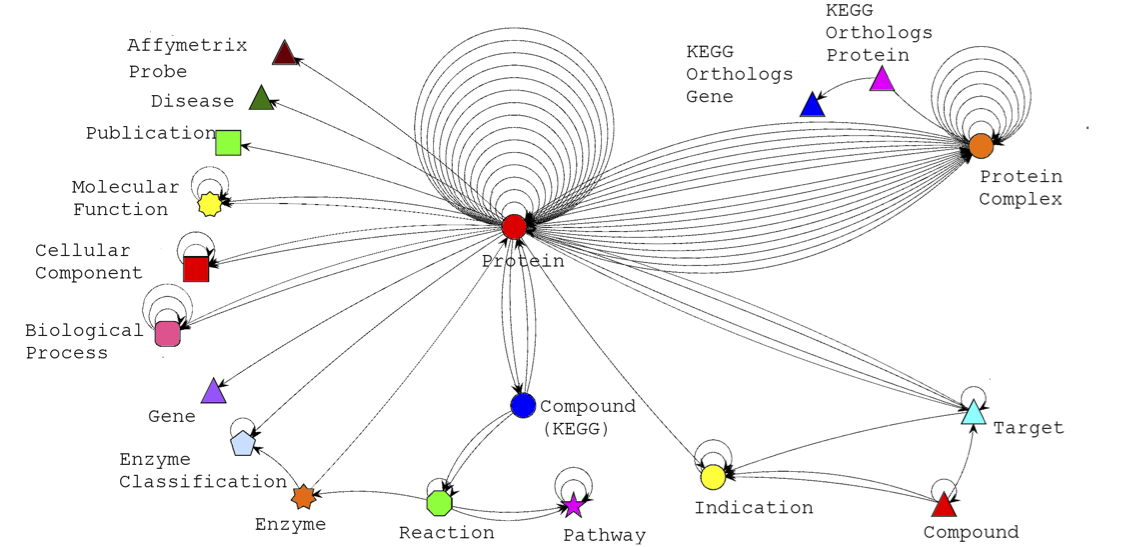
Current research and development approaches to drug discovery have become less fruitful and more costly. One alternative paradigm is that of drug repositioning. Many marketed examples of repositioned drugs have been identified through serendipitous or rational observations, highlighting the need for more systematic methodologies to tackle the problem. Systems level approaches have the potential to enable the development of novel methods to understand the action of therapeutic compounds, but requires an integrative approach to biological data. Integrated networks can facilitate systems level analyses by combining multiple sources of evidence to provide a rich description of drugs, their targets and their interactions. Classically, such networks can be mined manually where a skilled person is able to identify portions of the graph (semantic subgraphs) that are indicative of relationships between drugs and highlight possible repositioning opportunities. However, this approach is not scalable. Automated approaches are required to systematically mine integrated networks for these subgraphs and bring them to the attention of the user. We introduce a formal framework for the definition of integrated networks and their associated semantic subgraphs for drug interaction analysis and describe DReSMin, an algorithm for mining semantically-rich networks for occurrences of a given semantic subgraph. This algorithm allows instances of complex semantic subgraphs that contain data about putative drug repositioning opportunities to be identified in a computationally tractable fashion, scaling close to linearly with network data. We demonstrate the utility of our approach by mining an integrated drug interaction network built from 11 sources. This work identified and ranked 9,643,061 putative drug-target interactions, showing a strong correlation between highly scored associations and those supported by literature. We discuss the 20 top ranked associations in more detail, of which 14 are novel and 6 are supported by the literature. We also show that our approach better prioritizes known drug-target interactions, than other state-of-the art approaches for predicting such interactions.
Author Comment
This is a submission to PeerJ for review.
Supplemental Information
There are 19 different types of ConceptClass included in the dataset
Notes: *Indicates data that was included in the updated dataset, used during this work.
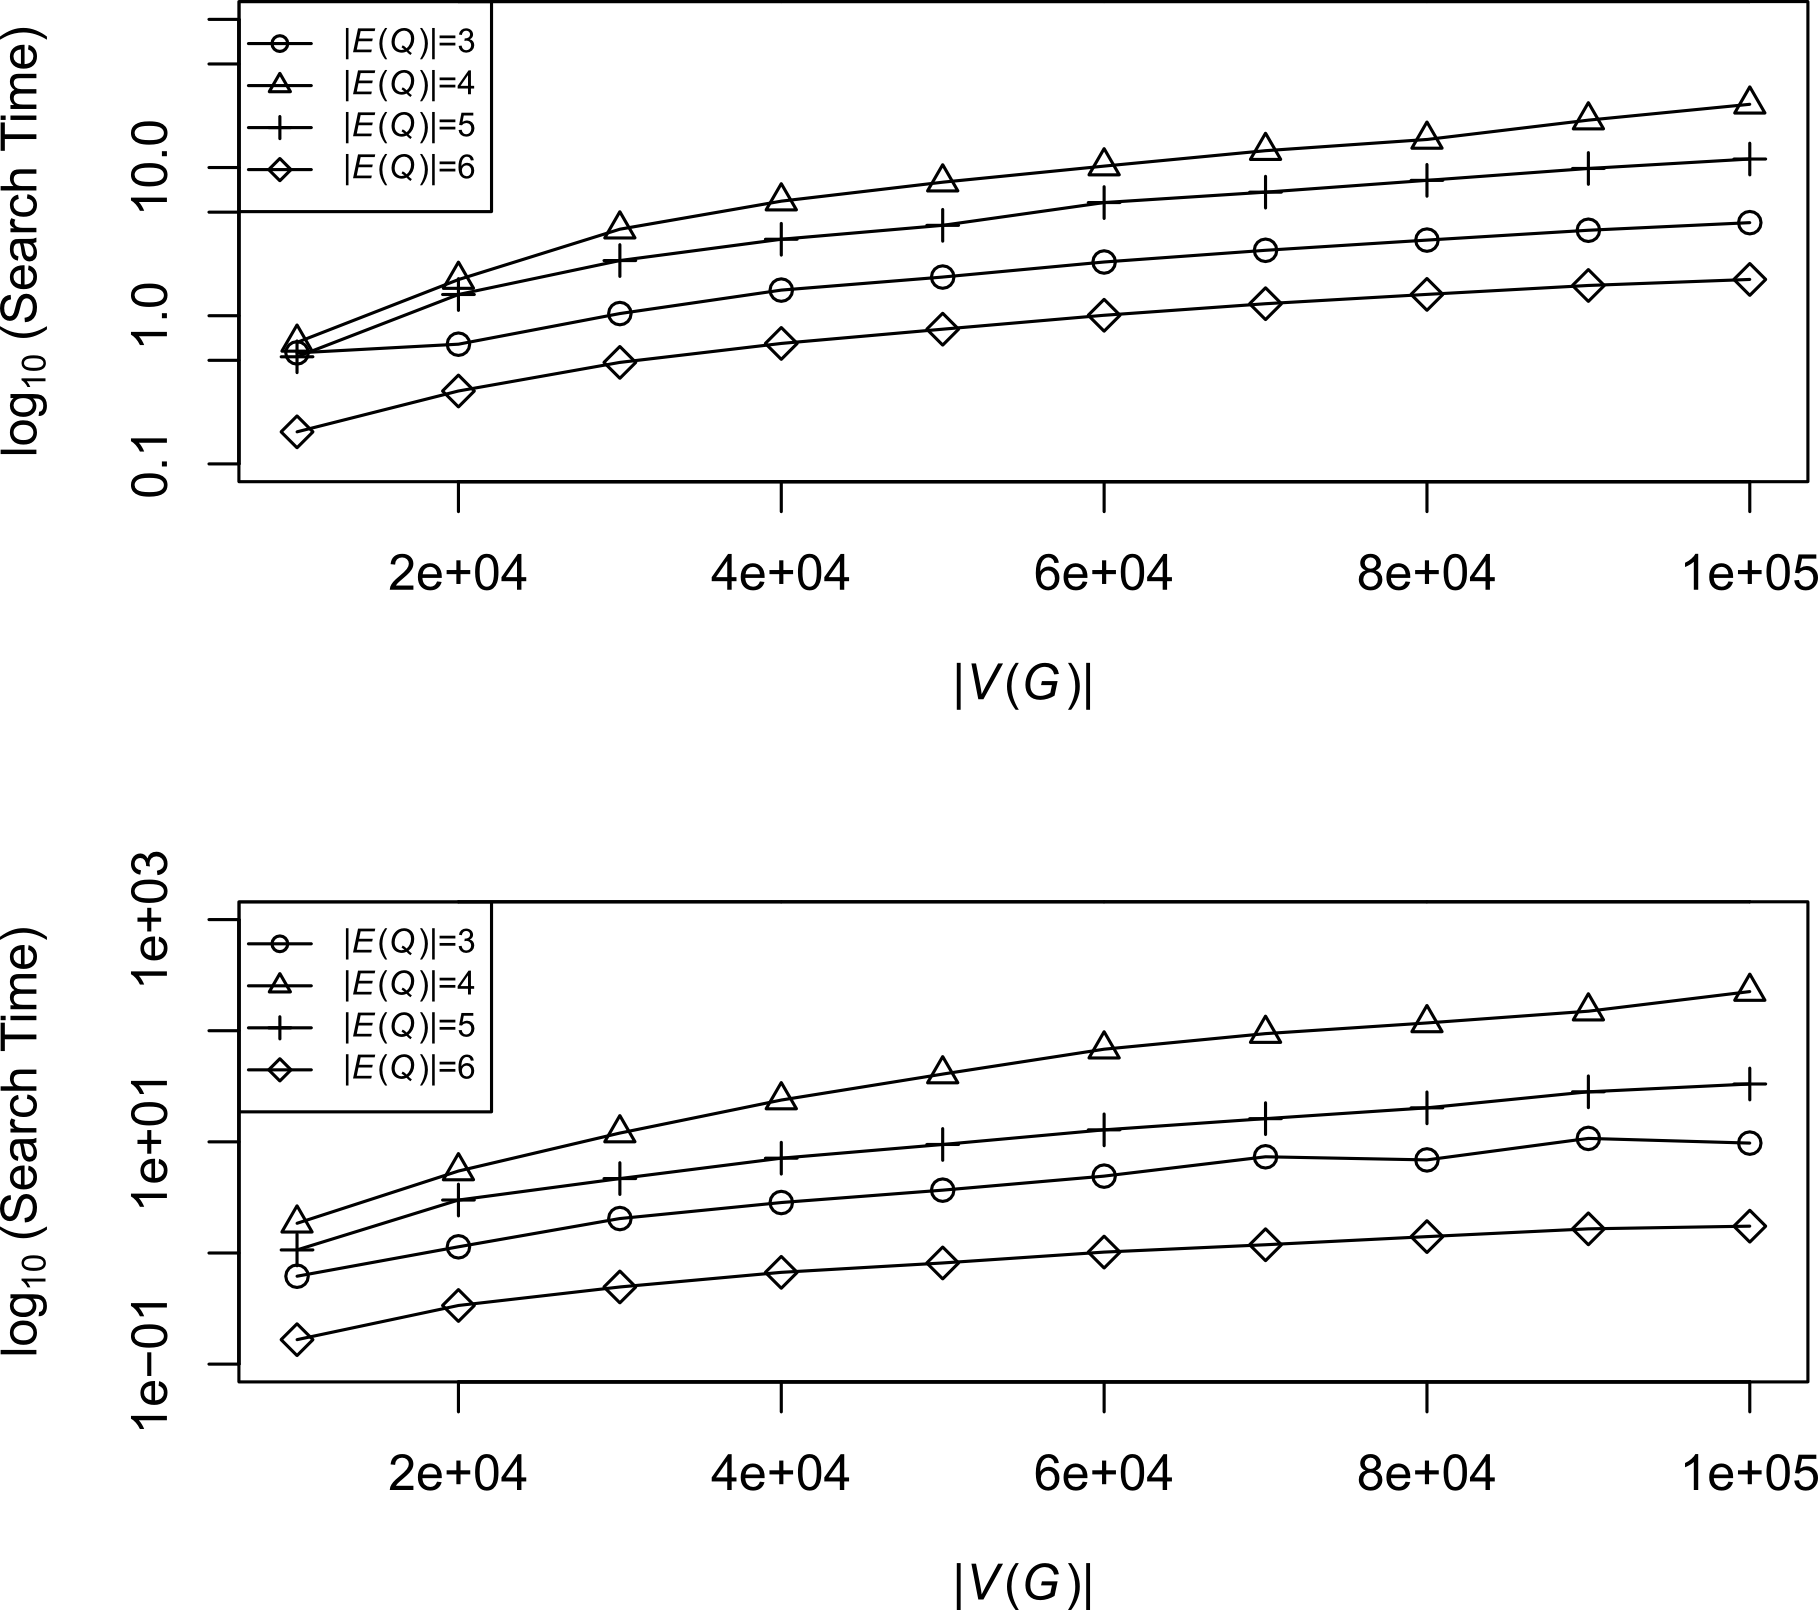
Increasing the edgeset of a semantic subgraph can actually improve the search time (in seconds) of a search
Note: Random semantic subgraphs were created with |V (Q)| of 4. Edgesets (|E (Q)|) of the subgraphs ranged from 3-6. Random target graphs were created with node sets ranging from 1 x 10⁴ to 1 x 10⁵. The algorithm used one of two parameters i) all elements of the match must be greater than ST (top) or ii) all elements must cumulatively be greater than the ST (bottom).
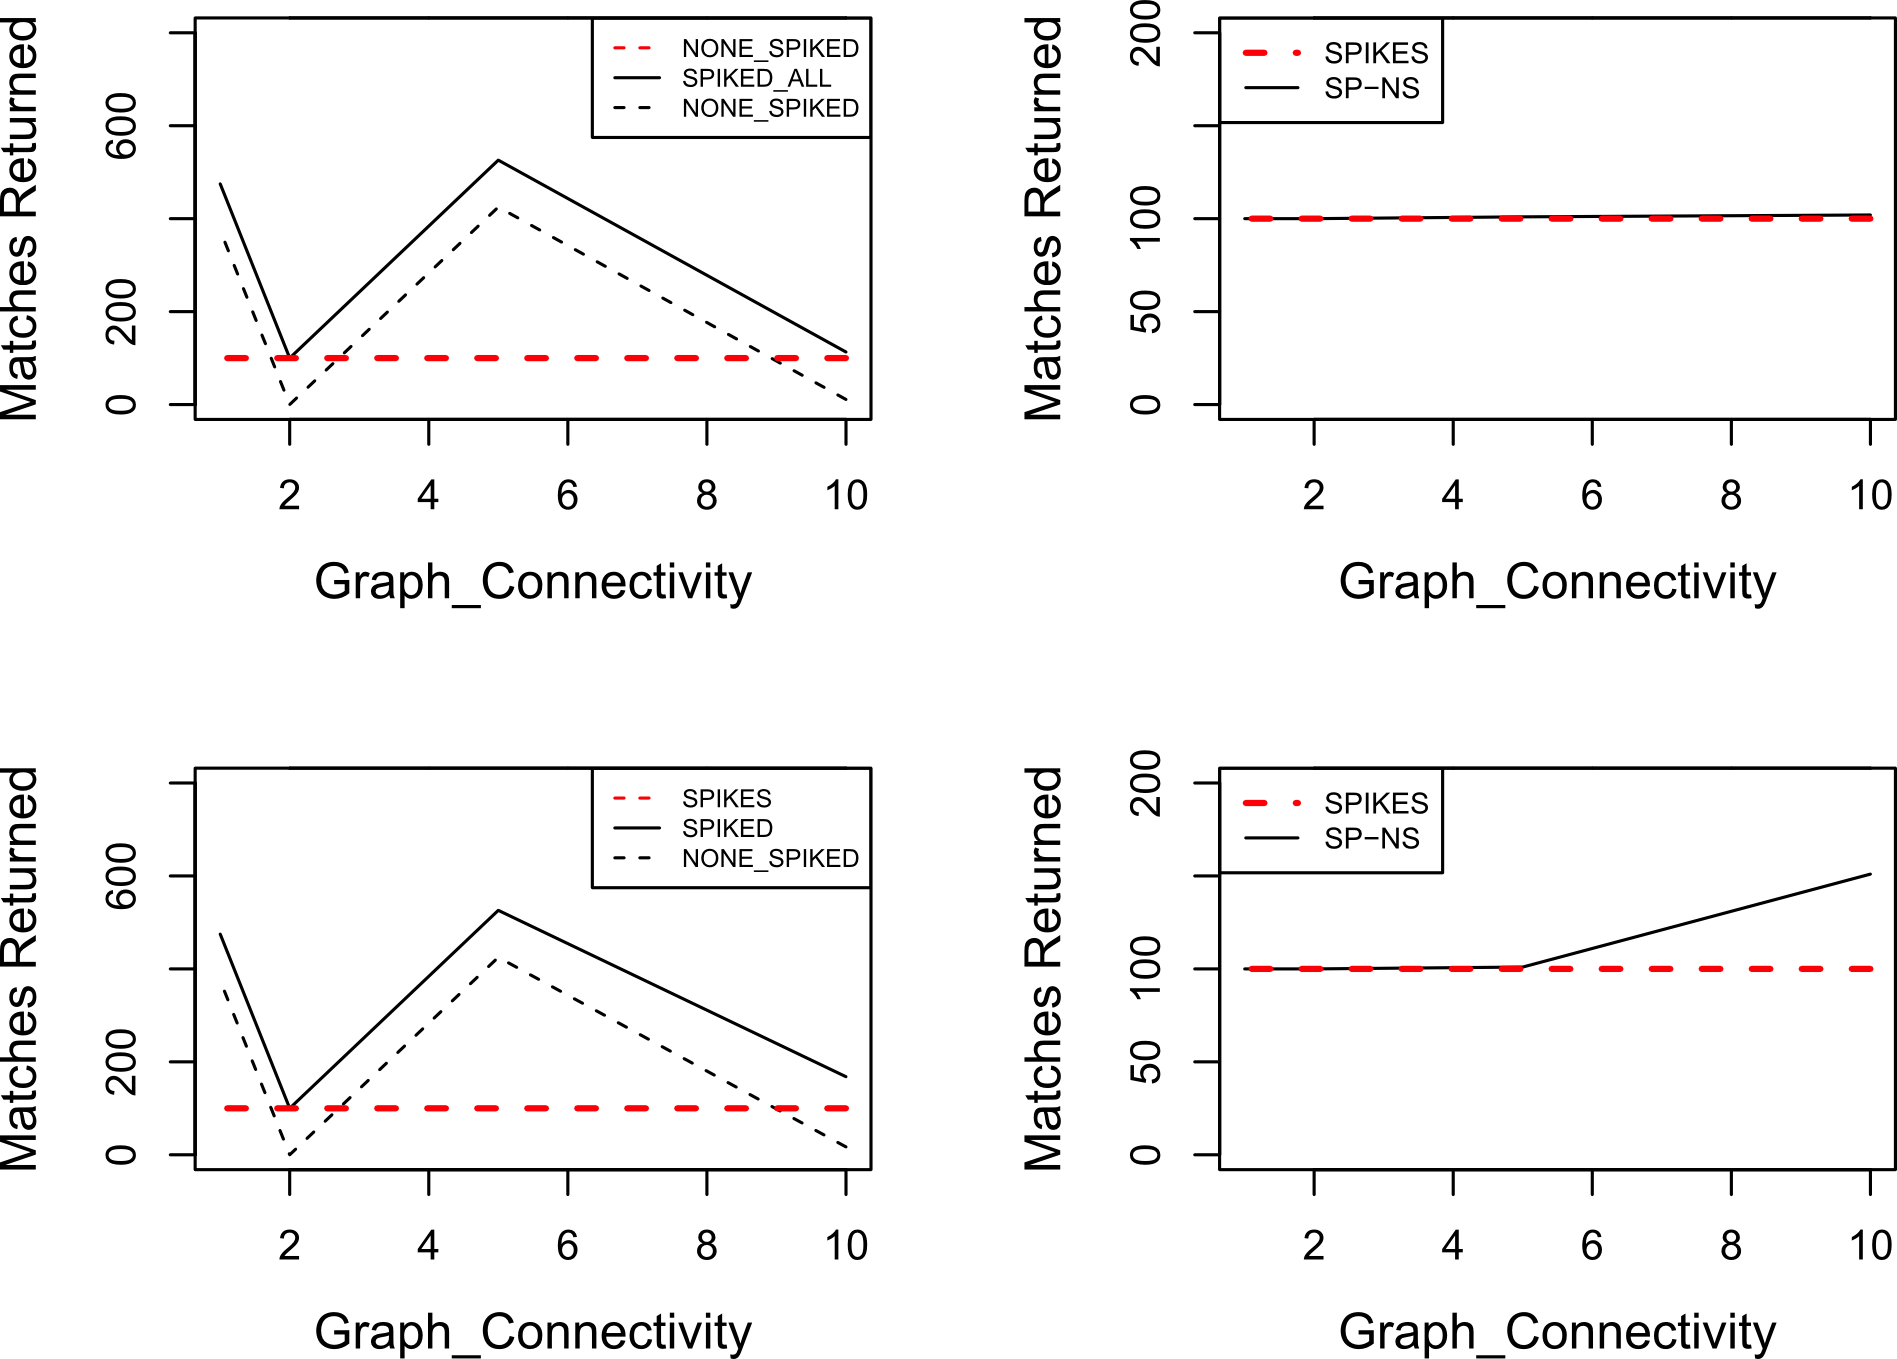
Accuracy of algorithm when altering target graph (G) connectivity
Note: Semantic subgraphs were created at random with a |V (Q)| of between 3 and 6. Runs were duplicated at least five times for each point in the graph, using the algorithm with two alternate parameters: i) all elements of the match must be greater than ST (top left and top right); and ii) all elements must cumulatively be greater than the ST (bottom left and bottom right). Graphs on the left show matches returned before and after spiking the target graph with 100 instances of the semantic subgraph that is to be searched for. Graphs on the right show the difference between the spiked (red) and non-spiked searches (black).
Accuracy of algorithm when altering target graph (G) size
Note: Semantic subgraphs were created at random with a |V (Q)| of between 3 and 6. Runs were duplicated at least five times for each point in the graph, using the algorithm with two alternate parameters: i) all elements of the match must be greater than ST (top left and top right); and ii) all elements must cumulatively be greater than the ST (bottom left and bottom right). Graphs on the left show matches returned before and after spiking the target graph with 100 instances of the semantic subgraph that is to be searched for. Graphs on the right show the difference between the spiked (red) and non-spiked searches (black).
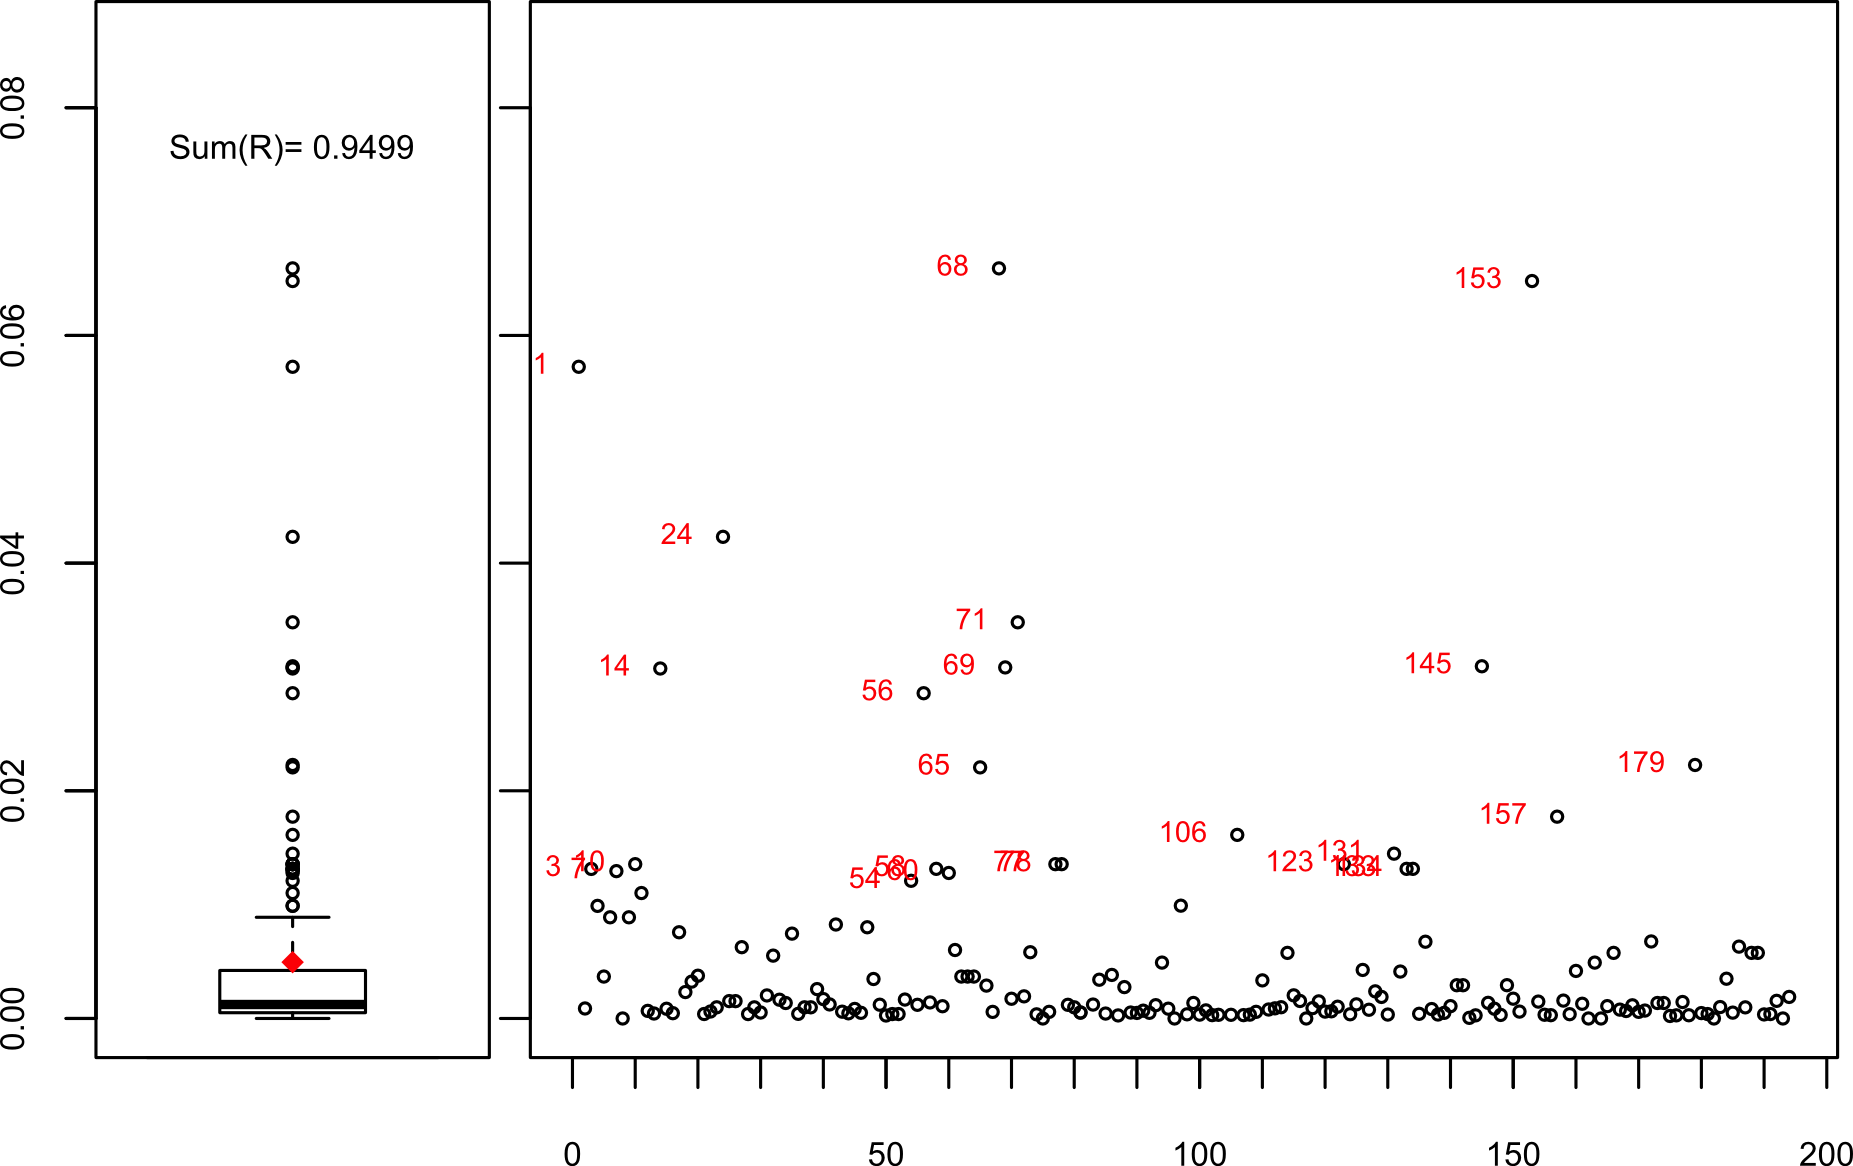
Scored Subgraphs
Left hand graph is a boxplot showing the semantic subgraph scores, with the mean score shown by a red point. Graph on the right shows the scores for subgraphs ranked based on ID. All subgraphs that scored > maximum are labelled with their ID.
There are 19 different types of ConceptClass included in the dataset
Note: *Indicates data that was included in the updated dataset, used during this work.
There are 42 different categories of RelationType included in the dataset
Note: *Indicates data that was included in the updated dataset, used during this work.
Scored subgraphs
Note: # SP refers to the number of drug-target associations captured in DBv3 and not in our dataset whose shortest path is captured via this subgraph. # Interactions refers to the number of drug-target associations inferred via S and # Unique refers to non-redundant inferred drug-target associations. The number of the inferred interactions that are captured in DBv3 are shown in the # Valid column. S score is to five decimal places. As we were using a semantic distance of 0.8 subgraphs that maintain a common topology and a relatively similar semantics (e.g. 62,63 and 64) can return the same set of mappings.
Scored associations
Top 100 ranked drug-target associations inferred by DReSMin.
Graph Split algorithm
Article provides a more concise description of the graph split component of DReSMin.
Calculating Semantic Threshold
Article provides an explanation of the semantic threshold (ST) employed during this work.