Effects of library size variance, sparsity, and compositionality on the analysis of microbiome data
- Published
- Accepted
- Subject Areas
- Bioinformatics, Computational Biology, Ecology, Statistics
- Keywords
- Microbiome, statistics, normalization, differential abundance testing, OTU table analysis, ordination, library size, sparsity, compositional, high-throughput sequencing
- Copyright
- © 2015 Weiss et al.
- Licence
- This is an open access article distributed under the terms of the Creative Commons Attribution License, which permits unrestricted use, distribution, reproduction and adaptation in any medium and for any purpose provided that it is properly attributed. For attribution, the original author(s), title, publication source (PeerJ PrePrints) and either DOI or URL of the article must be cited.
- Cite this article
- 2015. Effects of library size variance, sparsity, and compositionality on the analysis of microbiome data. PeerJ PrePrints 3:e1157v1 https://doi.org/10.7287/peerj.preprints.1157v1
Abstract
Background: Data from 16S amplicon sequencing present challenges to ecological and statistical interpretation. In particular, library sizes often vary over several ranges of magnitude, and the data contains many zeroes. Also, since researchers sample a small fraction of the ecosystem, the observed sequences are relative abundances and therefore the data is compositional. Here we evaluate methods developed in the literature to address these three challenges in the context of normalization and ordination analysis, which is commonly used to visualize overall differences in bacterial composition between sample groups, and differential abundance analysis, which tests for significant differences in the abundances of microbes between sample groups. Results. Effects of normalization on ordination: Most normalization methods successfully cluster samples according to biological origin when many microbes differ between the groups. For datasets in which clusters are subtle and/or sequence depth varies greatly between samples, or for metrics in which rare microbes play an important role, rarefying outperforms other techniques. For abundance-based metrics, rarefying as well as alternatives like DESeq and metagenomeSeq’s cumulative sum scaling (CSS), seem to correctly cluster samples according to biological origin. With these normalization alternatives, clustering by sequence depth as a confounding variable must be checked for, especially for low library sizes. Effects of differential abundance testing model choice: We build on previous work to evaluate each statistical method using rarefied as well as unrarefied data. When the mean library sizes in the differential abundance groups differ by more than 2-3x, or the library sizes differ in distribution, our simulation studies reveal that each statistical method improved in its false positive rate when samples were rarefied. However, when the difference in library size mean is less than 2-3x, and the library sizes are similarly distributed, rarefying results in a loss of power for all methods. In this case, DESeq2 has the highest power to compare groups, especially for less than 20 samples per group. MetagenomeSeq’s fitZIG is a faster alternative to DESeq2, although it does worse for smaller sample sizes (<50 samples per group) and tends to have a higher false positives rate. For larger sample sizes (>50 samples), rarefying paired with a non-parametric test, such as the Mann-Whitney test, can also yield equally high sensitivity. Based on these results, we recommend a stepwise procedure in which sample groups are first tested for significant differences in library size. If there is a significant difference, we recommend rarefying with a non-parametric test. Otherwise, DESeq2 and/or fitZIG offer increased sensitivity, especially for rare OTUs and small sample numbers. Conclusions. These findings help guide which technique to use depending on the data characteristics of a given study.
Author Comment
This is a submission to PeerJ for review.
Supplemental Information
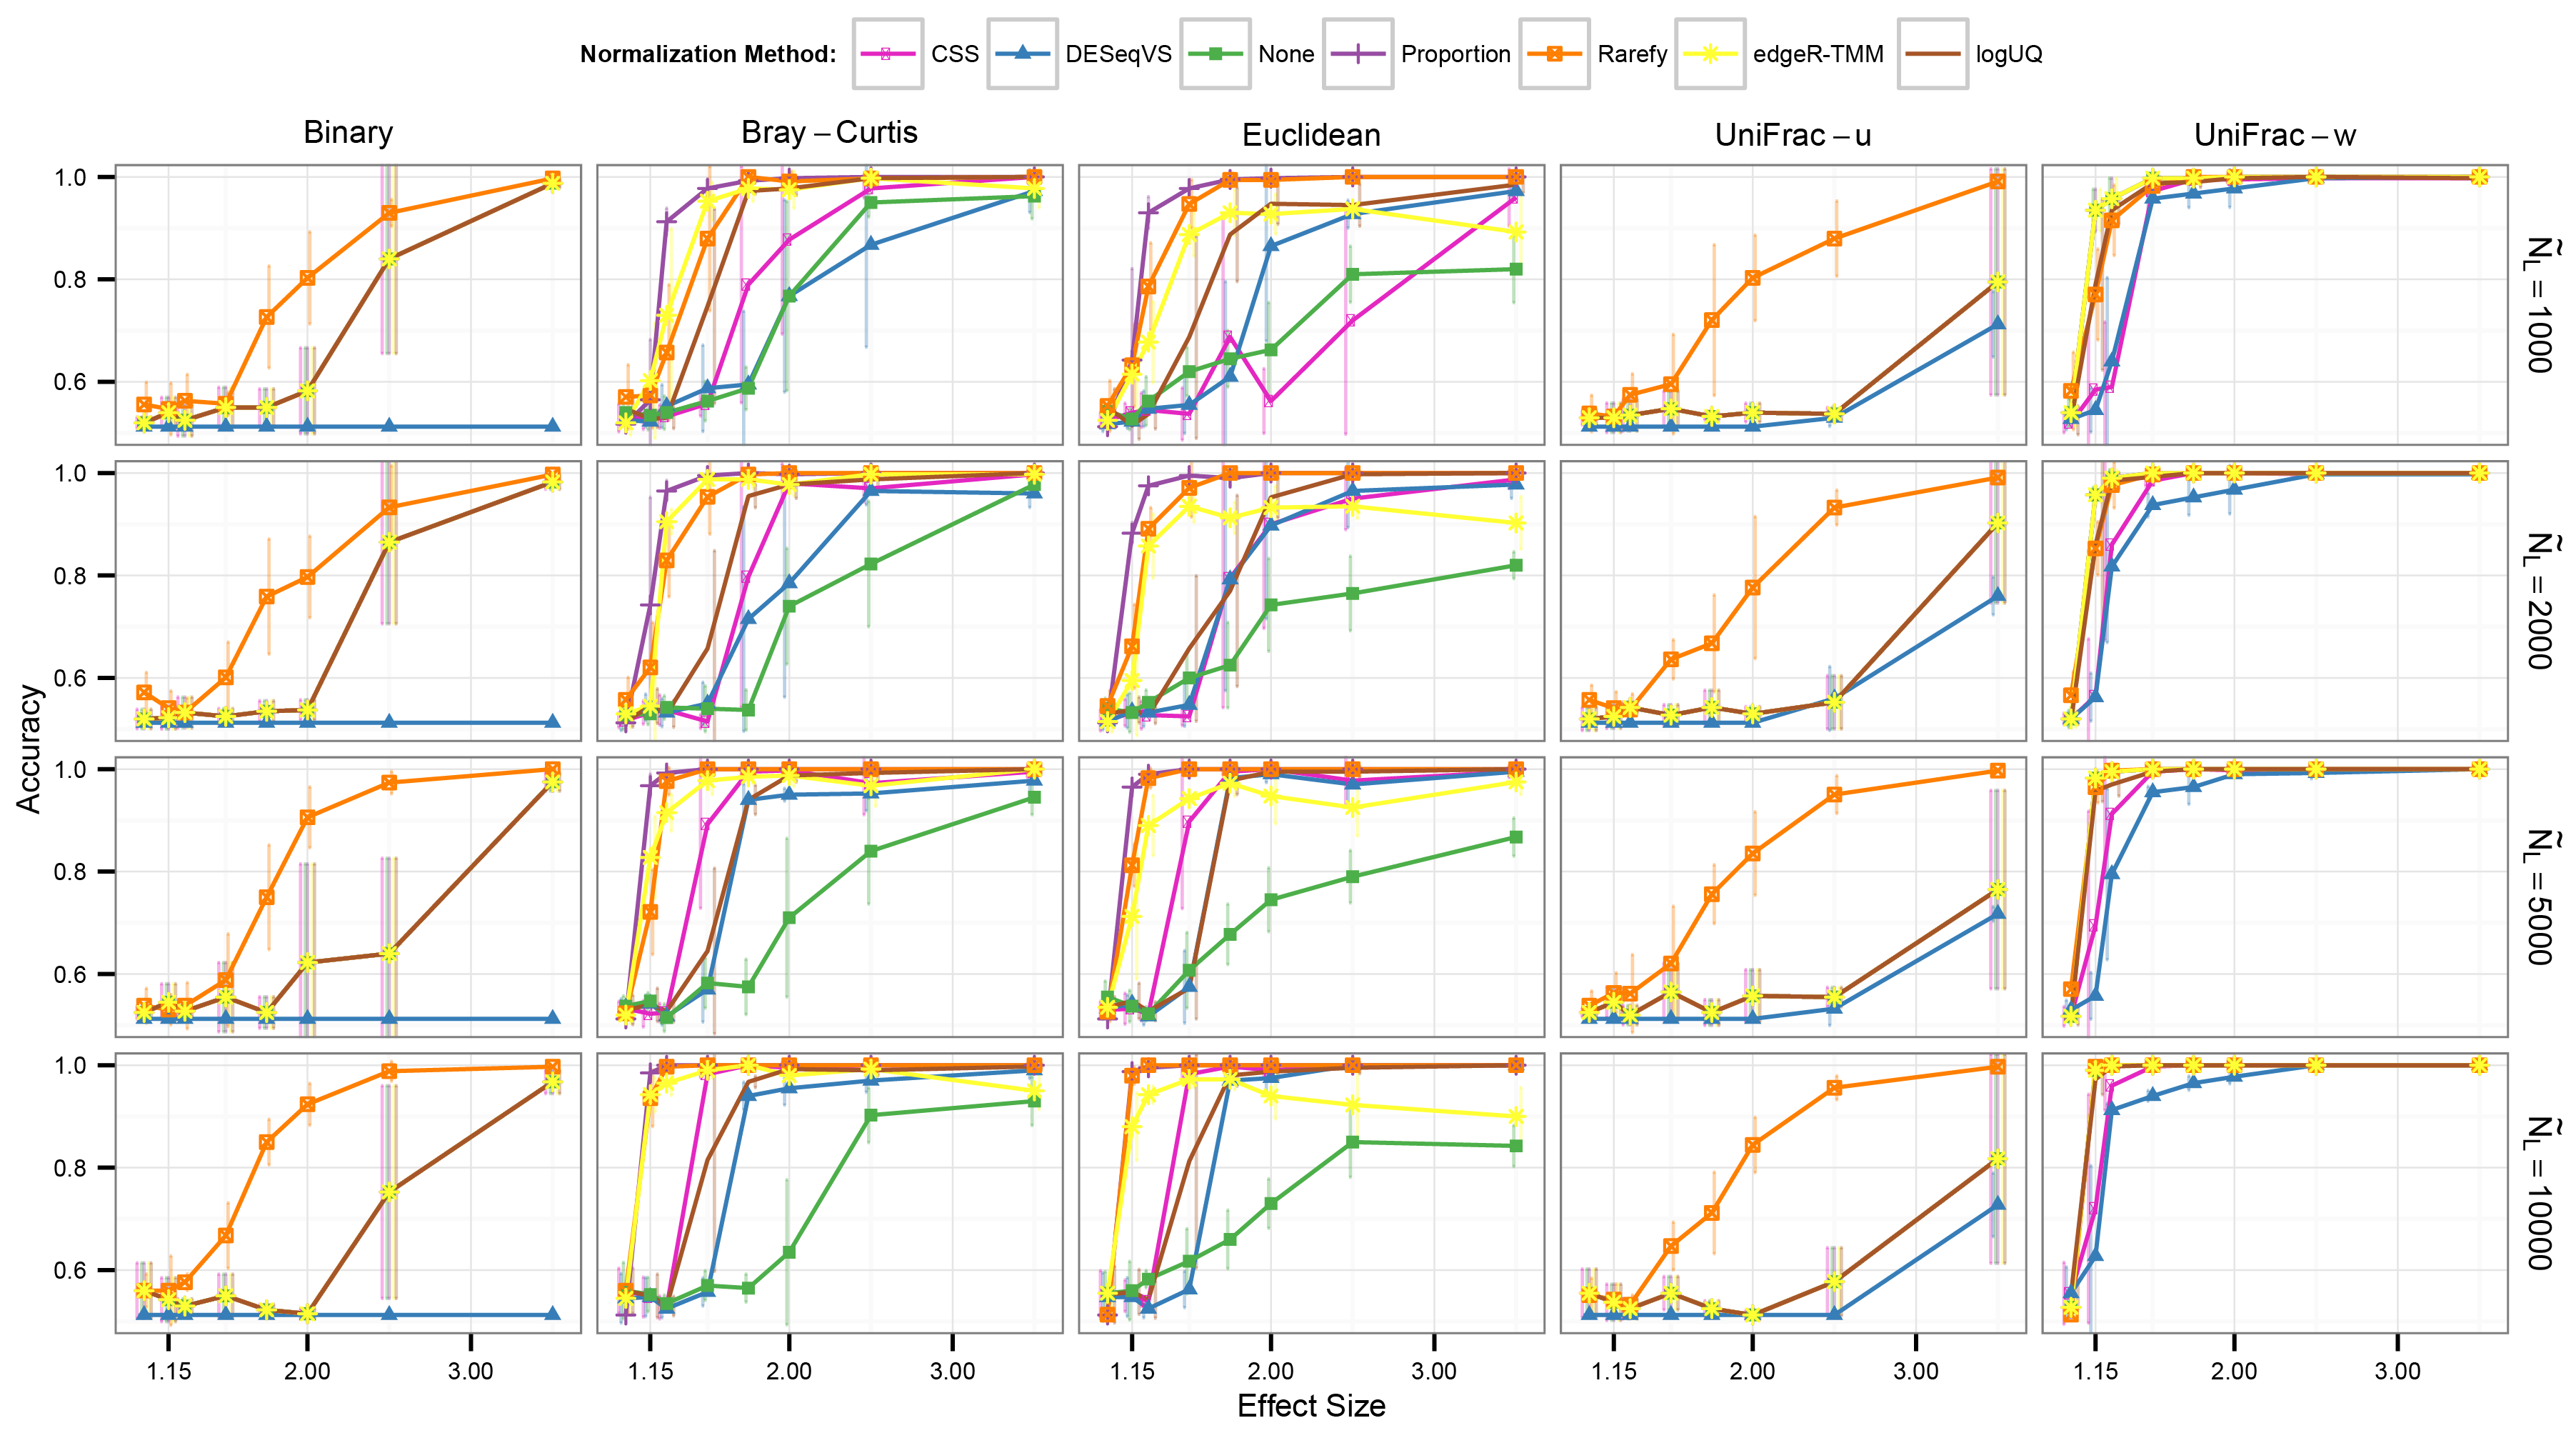
Simulated clustering accuracy if rarefying is not penalized for removing the lowest 15th percentile samples
The right axis represents the median library size (NL), while the x-axis ‘effect size’ is the multinomial mixing proportions of the two classes of samples, ‘Ocean’ and ‘Feces’. See caption for Fig. 2 for further details.
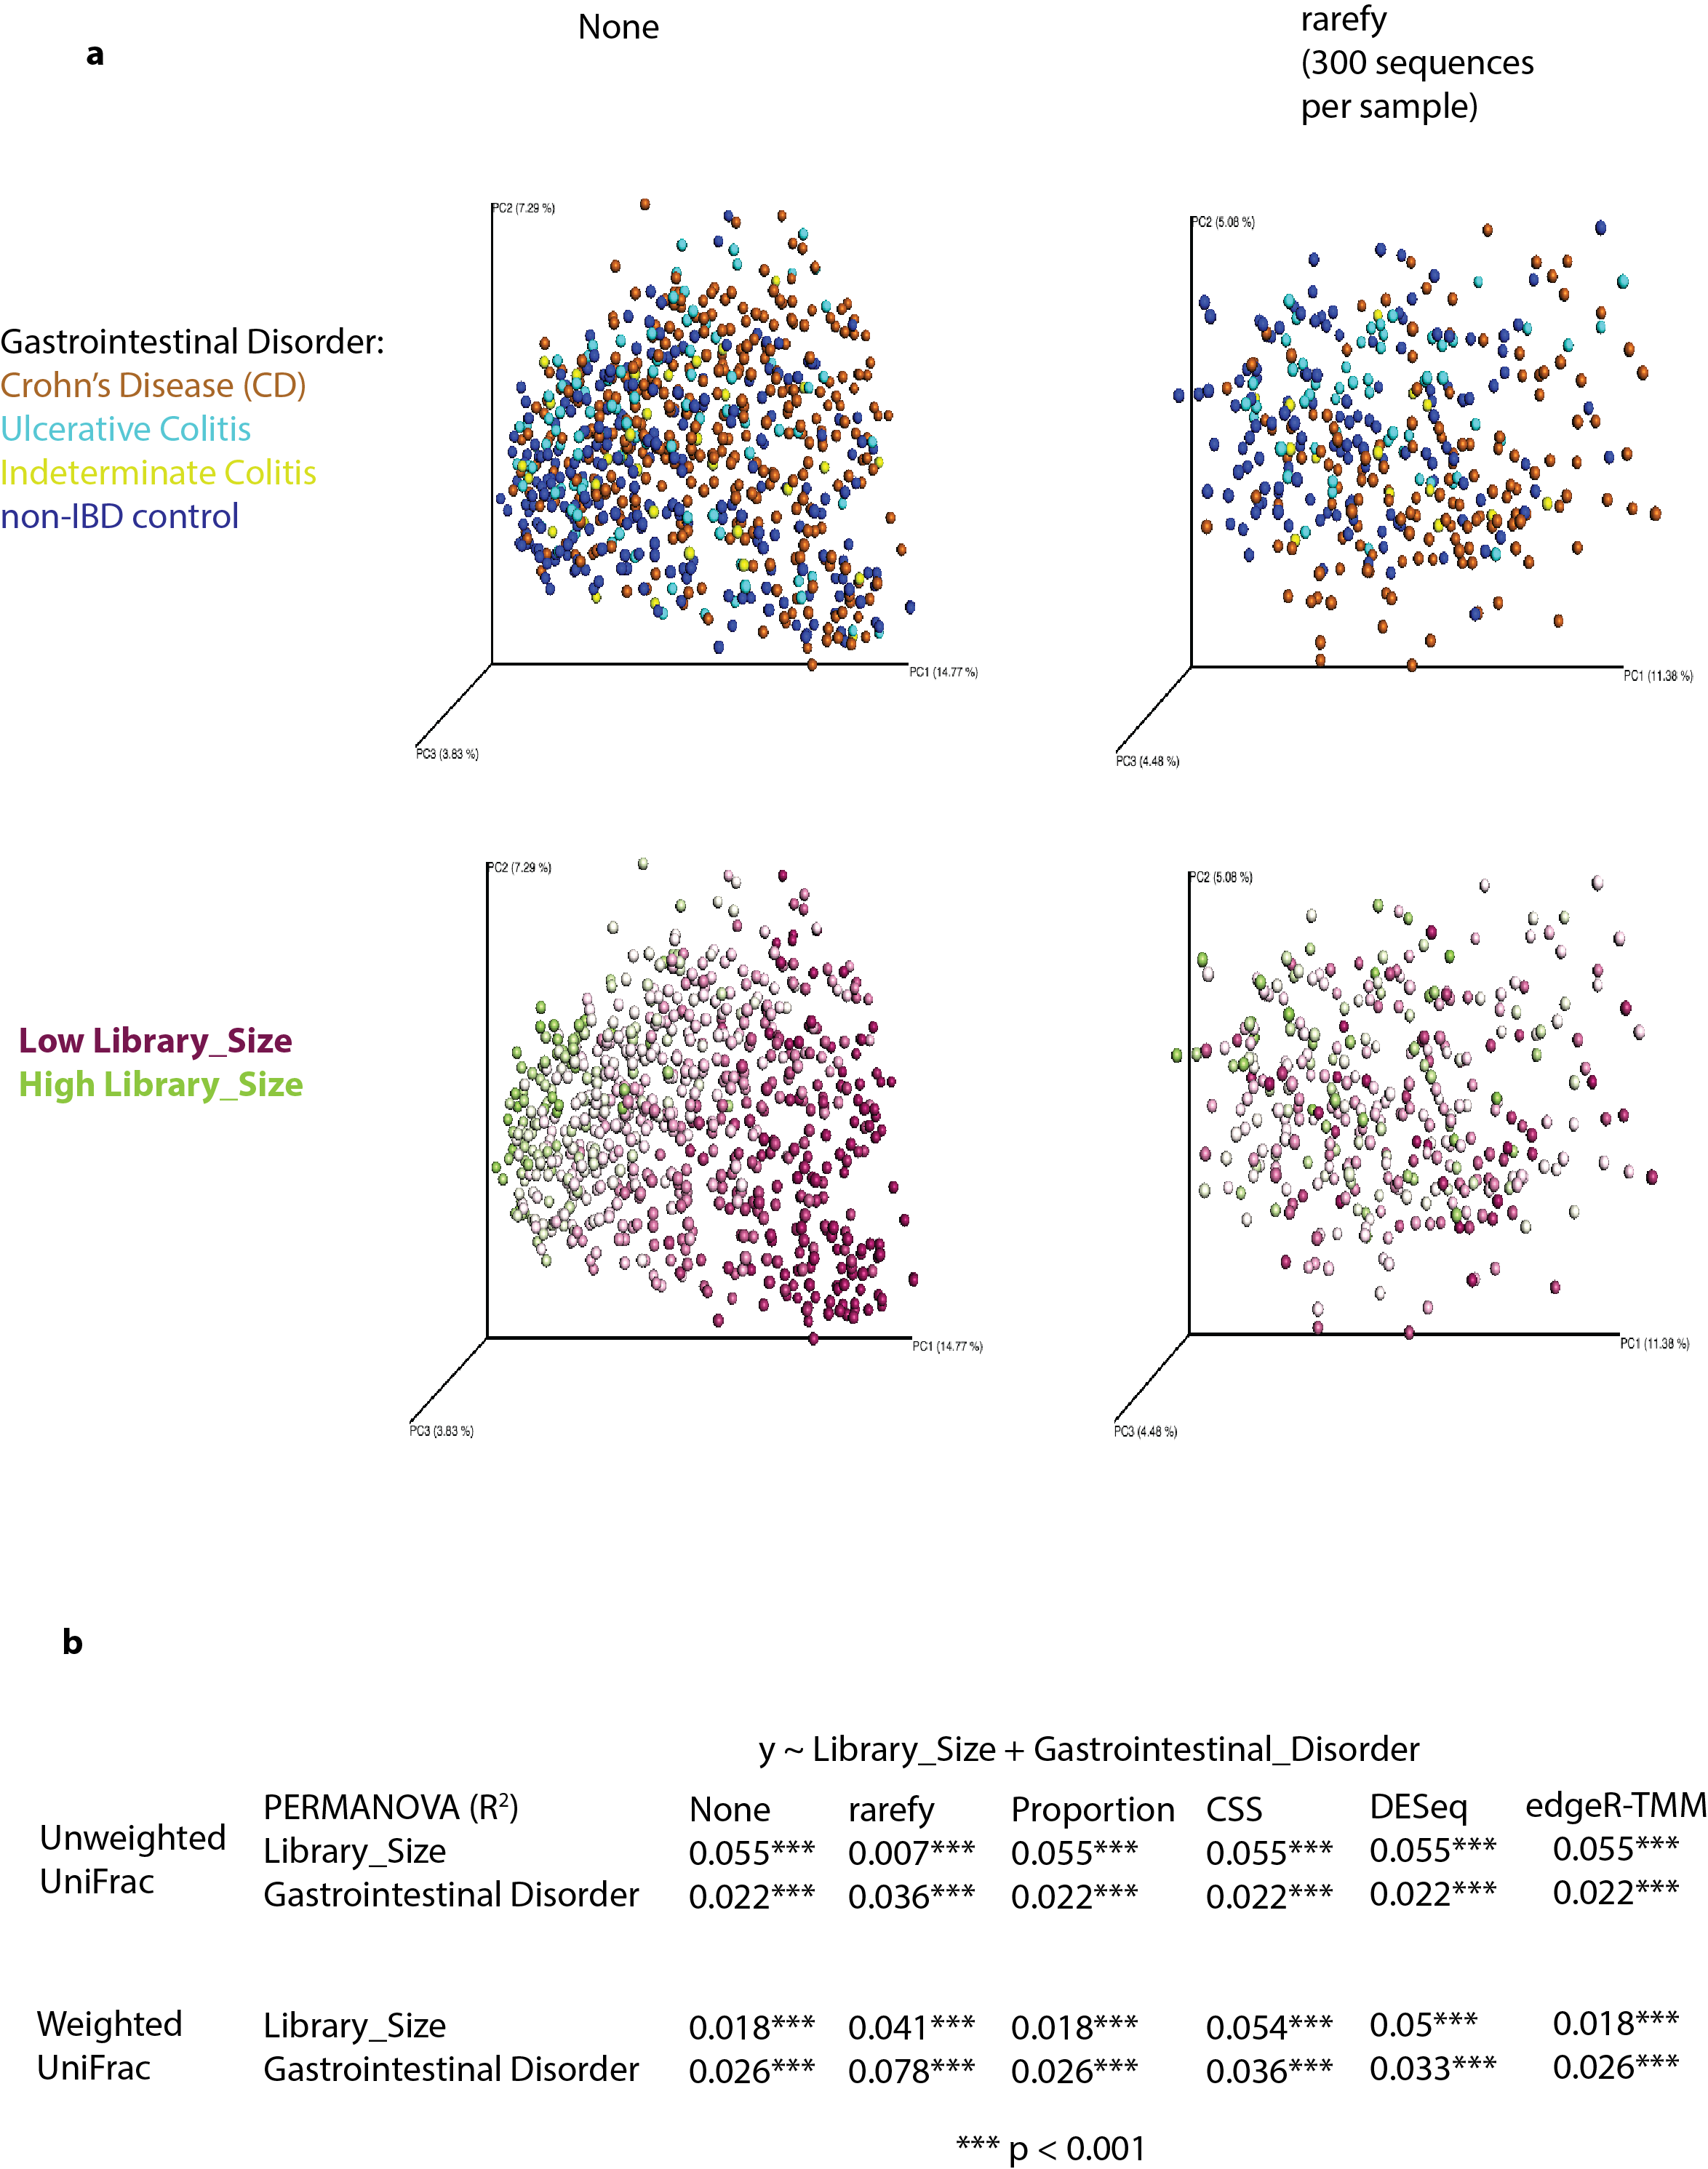
Low library size samples can diminish result quality, regardless of normalization technique
We show the inflammatory bowel disease (IBD) dataset of Gevers et al. ( Gevers et al. 2014 ) , which has an average library size 375 sequences per sample. (a) Extremely low depth samples cluster in lower right hand corner of PCoA plots with no normalization, or rarefying alternatives, unweighted UniFrac. (b) The original library size of samples is a dominant effect, even influencing weighted UniFrac, with low library sizes and subtle biological clustering for rarefying alternatives. This diminishes if low library size samples are removed from analysis.
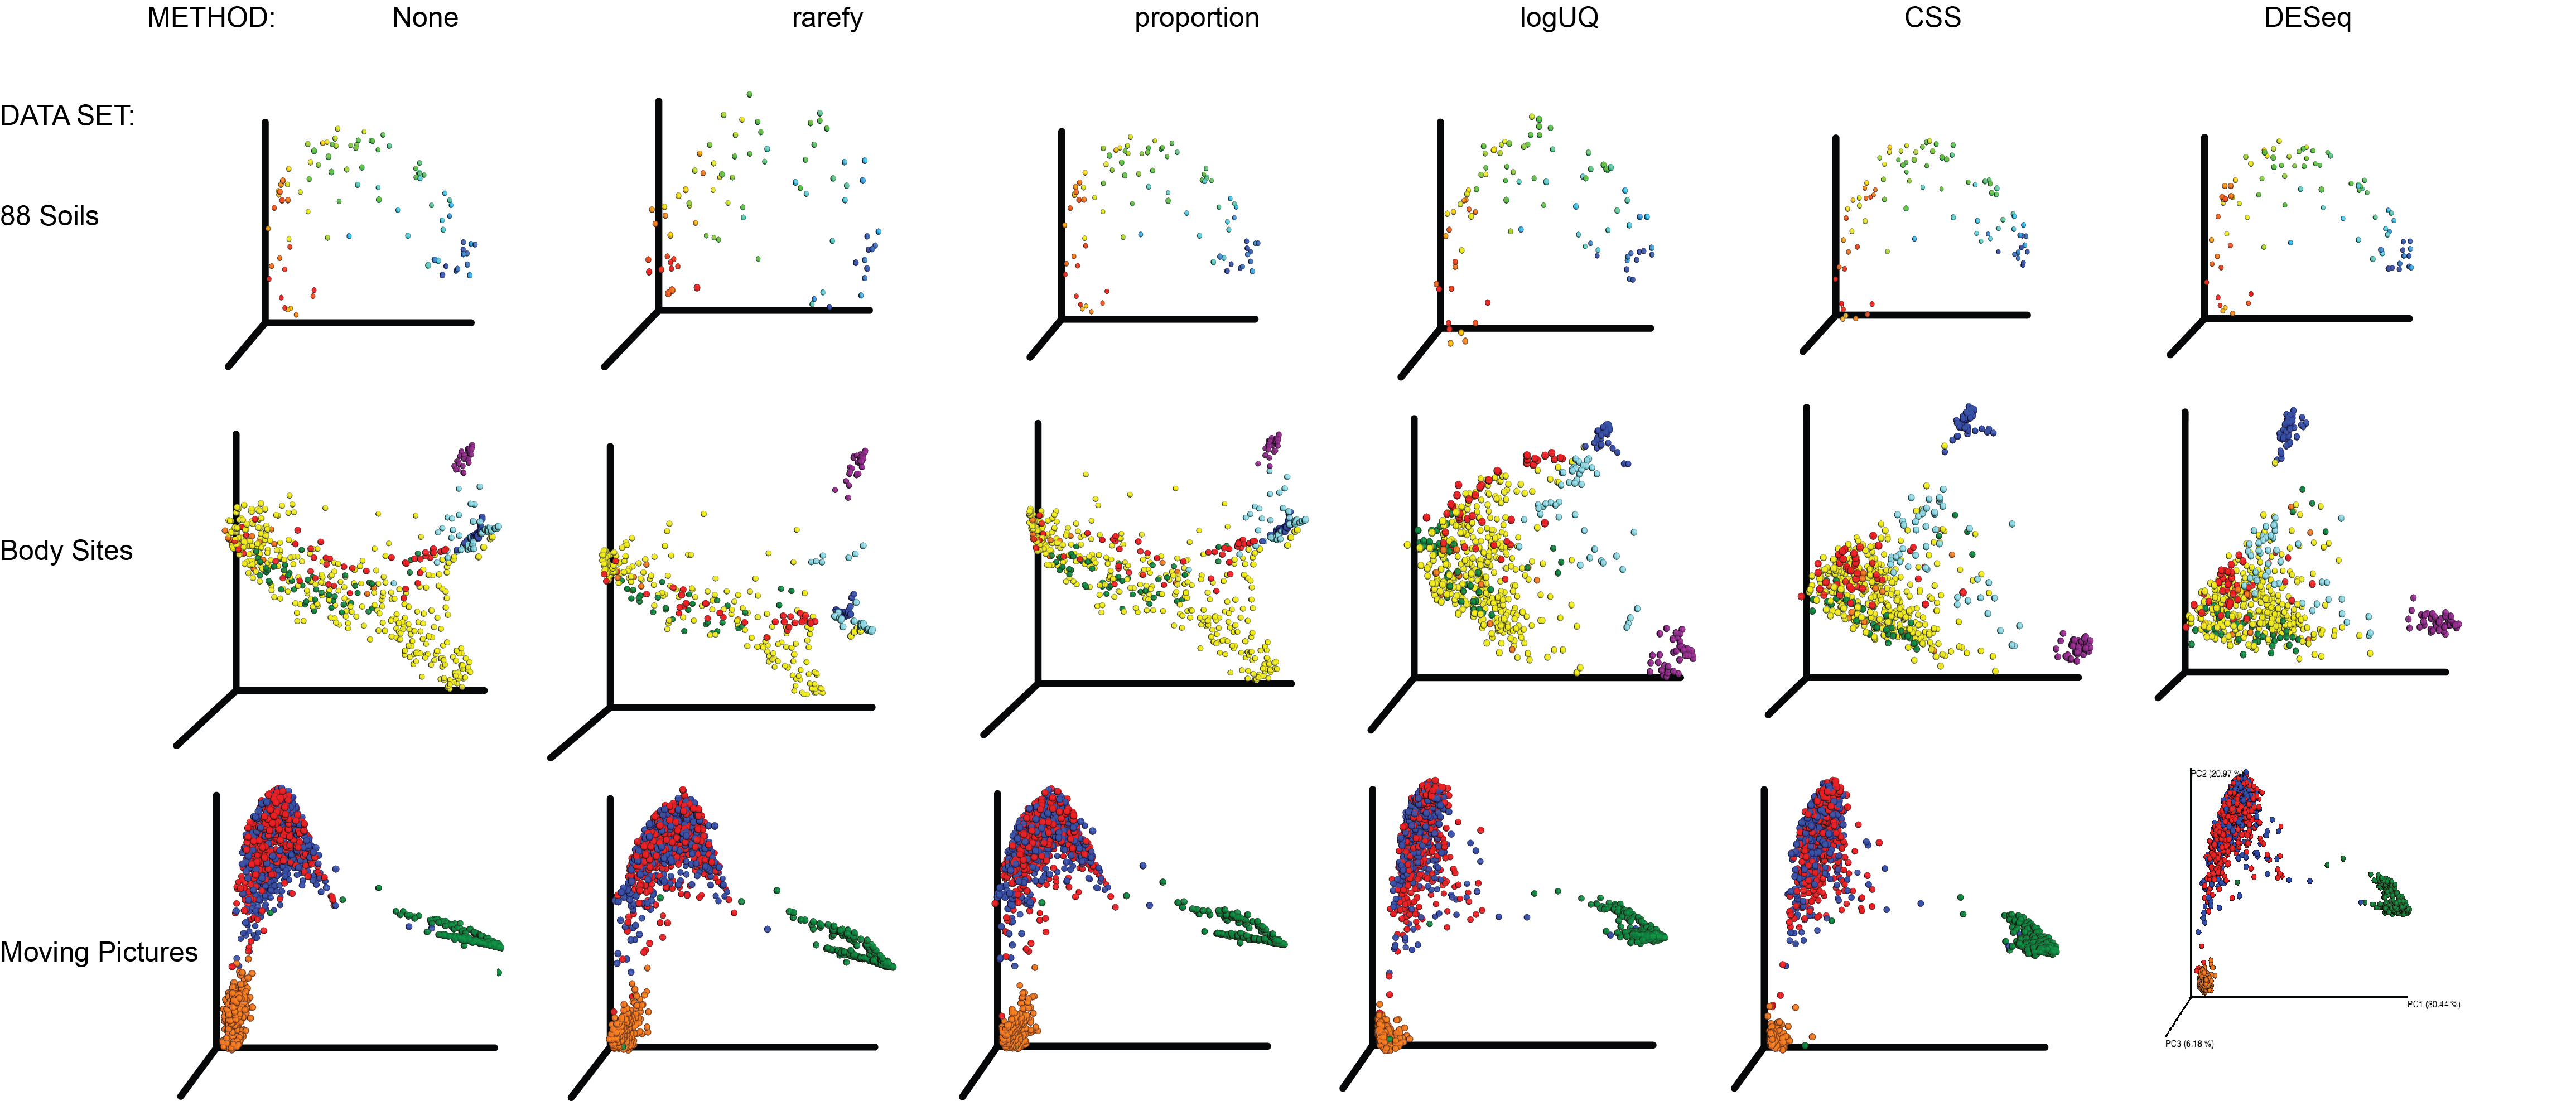
All normalization techniques on key microbiome datasets, Bray Curtis distance
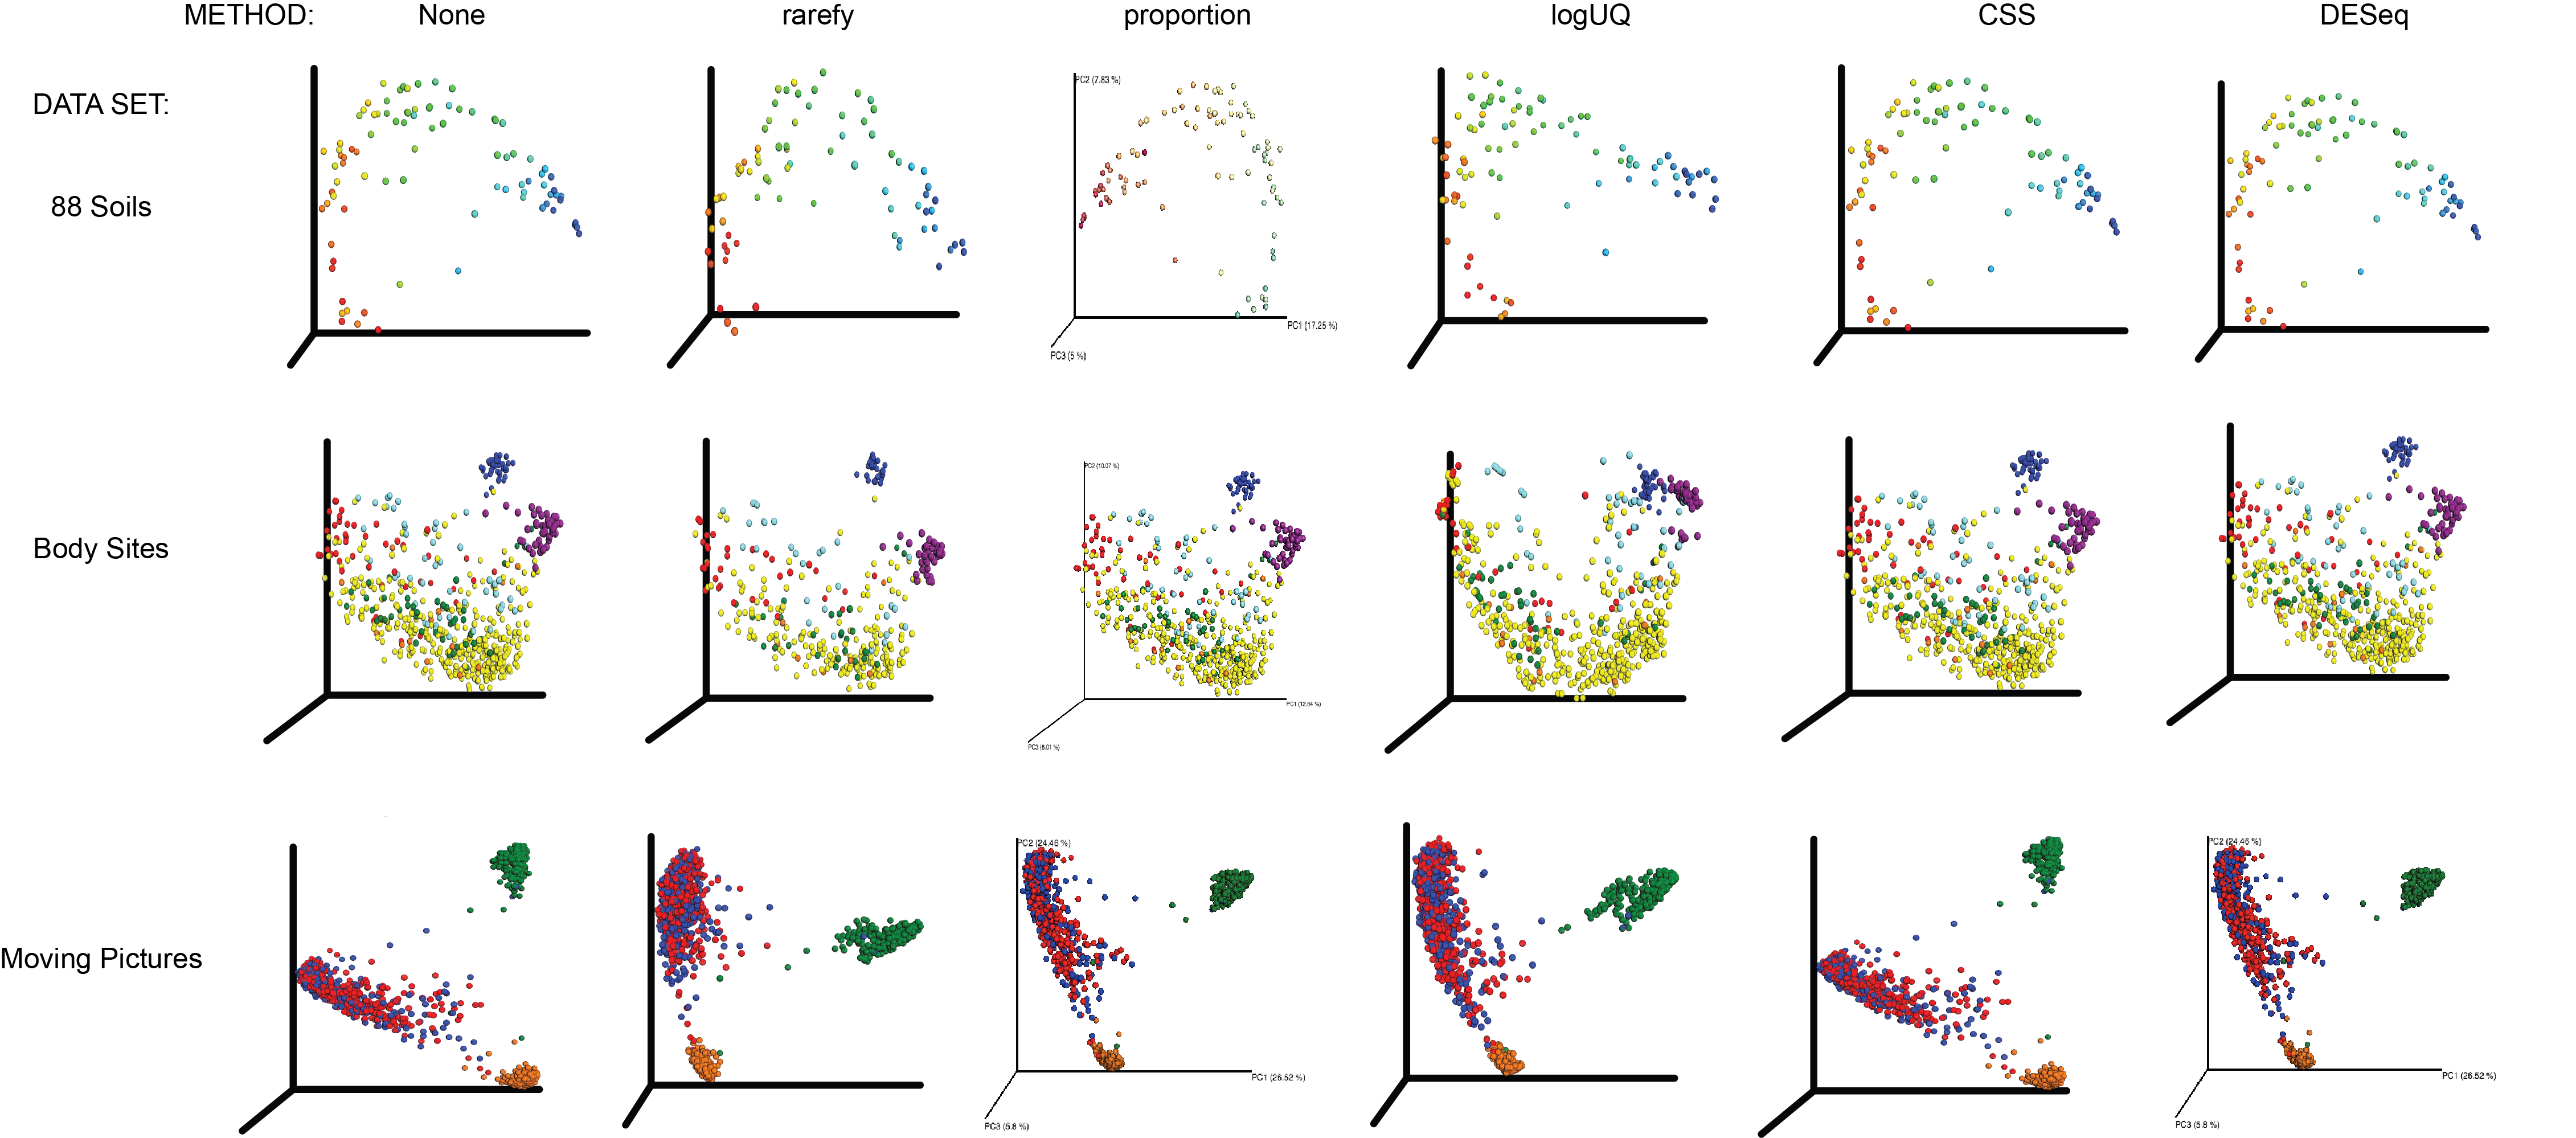
Rows of panels show (from top to bottom) data from 88soils ( Lauber et al. 2009 ) , Body Sites ( Costello et al. 2009 ) , Moving Pictures ( Caporaso et al. 2011a ) . 88 soils is colored according to a color gradient from low to high pH. The Costello et al. body sites dataset is colored according to body site: feces (blue), oral cavity (purple), the rest of the colors are external auditory canal, hair, nostril, skin, and urine. Moving Pictures dataset: Left and Right palm (red/blue), tongue (green), feces (orange). It is important to note that all the samples in these datasets are approximately the same depth, and there are very strong driving gradients.
All normalization techniques on key microbiome datasets, unweighed UniFrac distance
See Figure S3 caption for details.
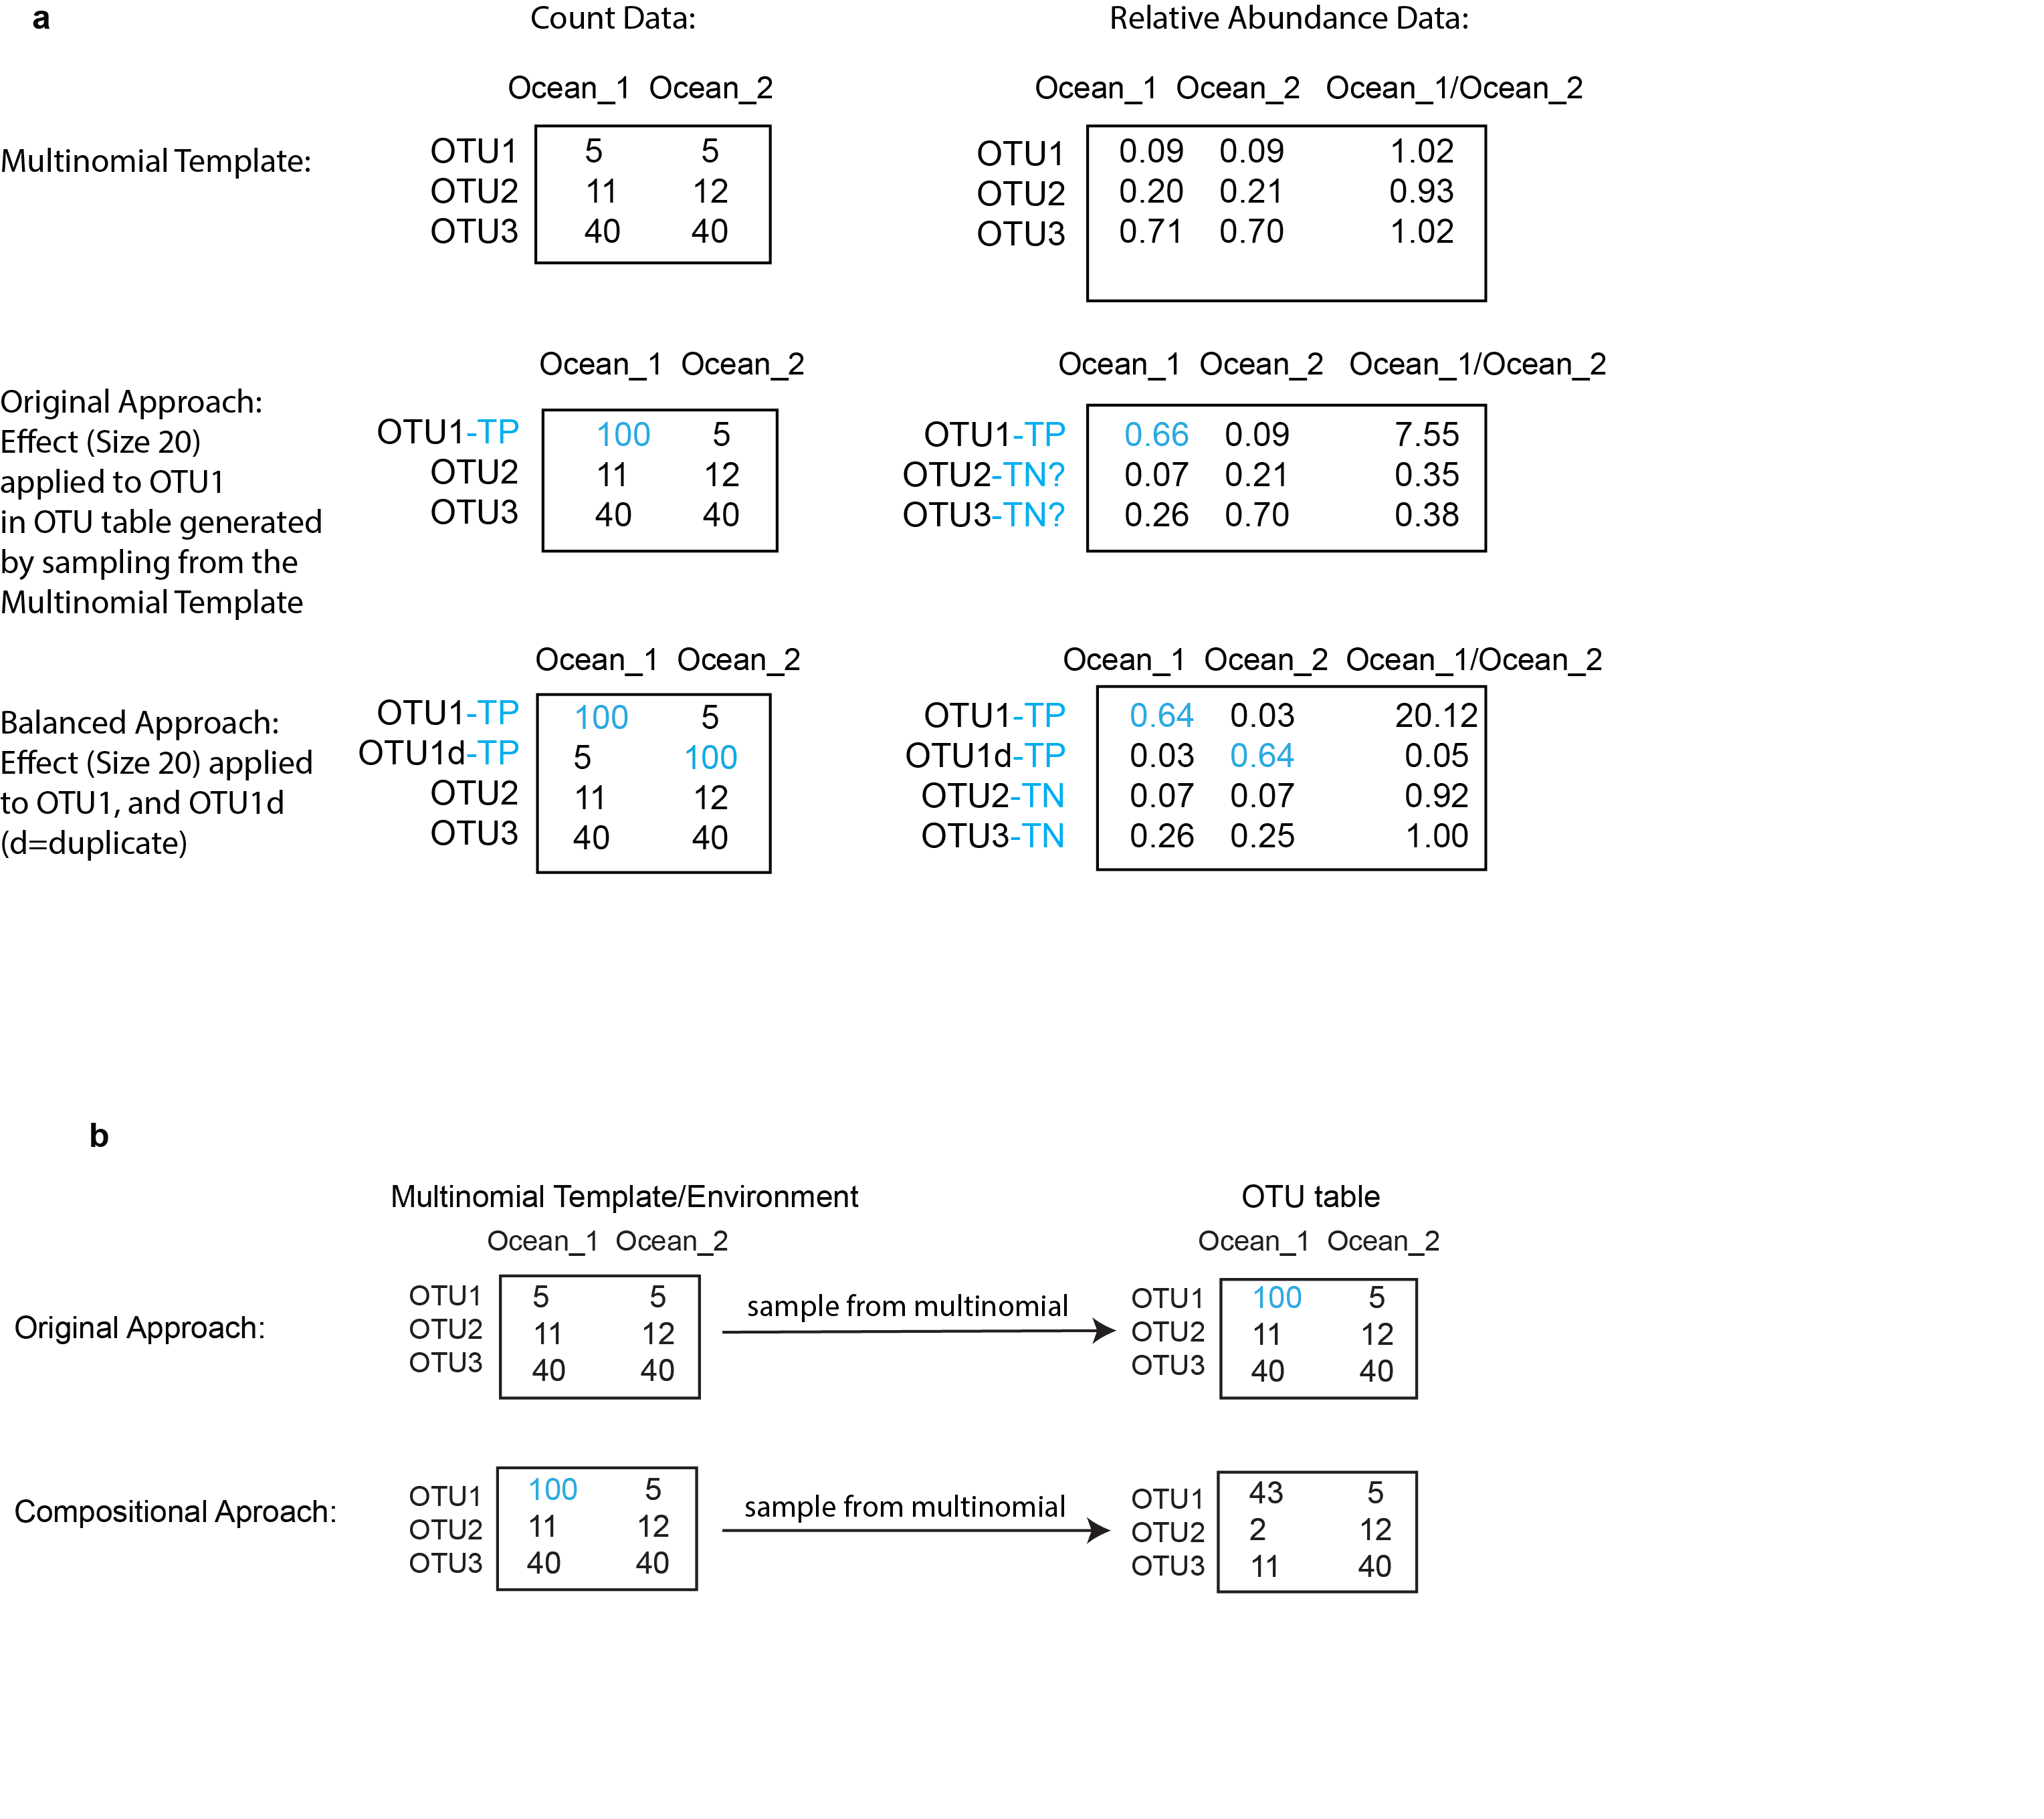
Simple example of the reasoning behind differential abundance simulations
(a) In actual OTU tables generated from sequencing data, the counts (left column) are already compositional and therefore only relative (left column). Application of the ‘effect size’ to the original ‘Multinomial’ template to create fold-change differences disturbs the distinction between true positive (TP) and true negative (TN) OTUs in the ‘Original’ simulation, but not the ‘Balanced’ simulation. (c) Creation of a ‘Compositional’ OTU table from the ‘Multinomial’ template, where the counts/relative abundances are intentionally blurred for the TN OTUs.
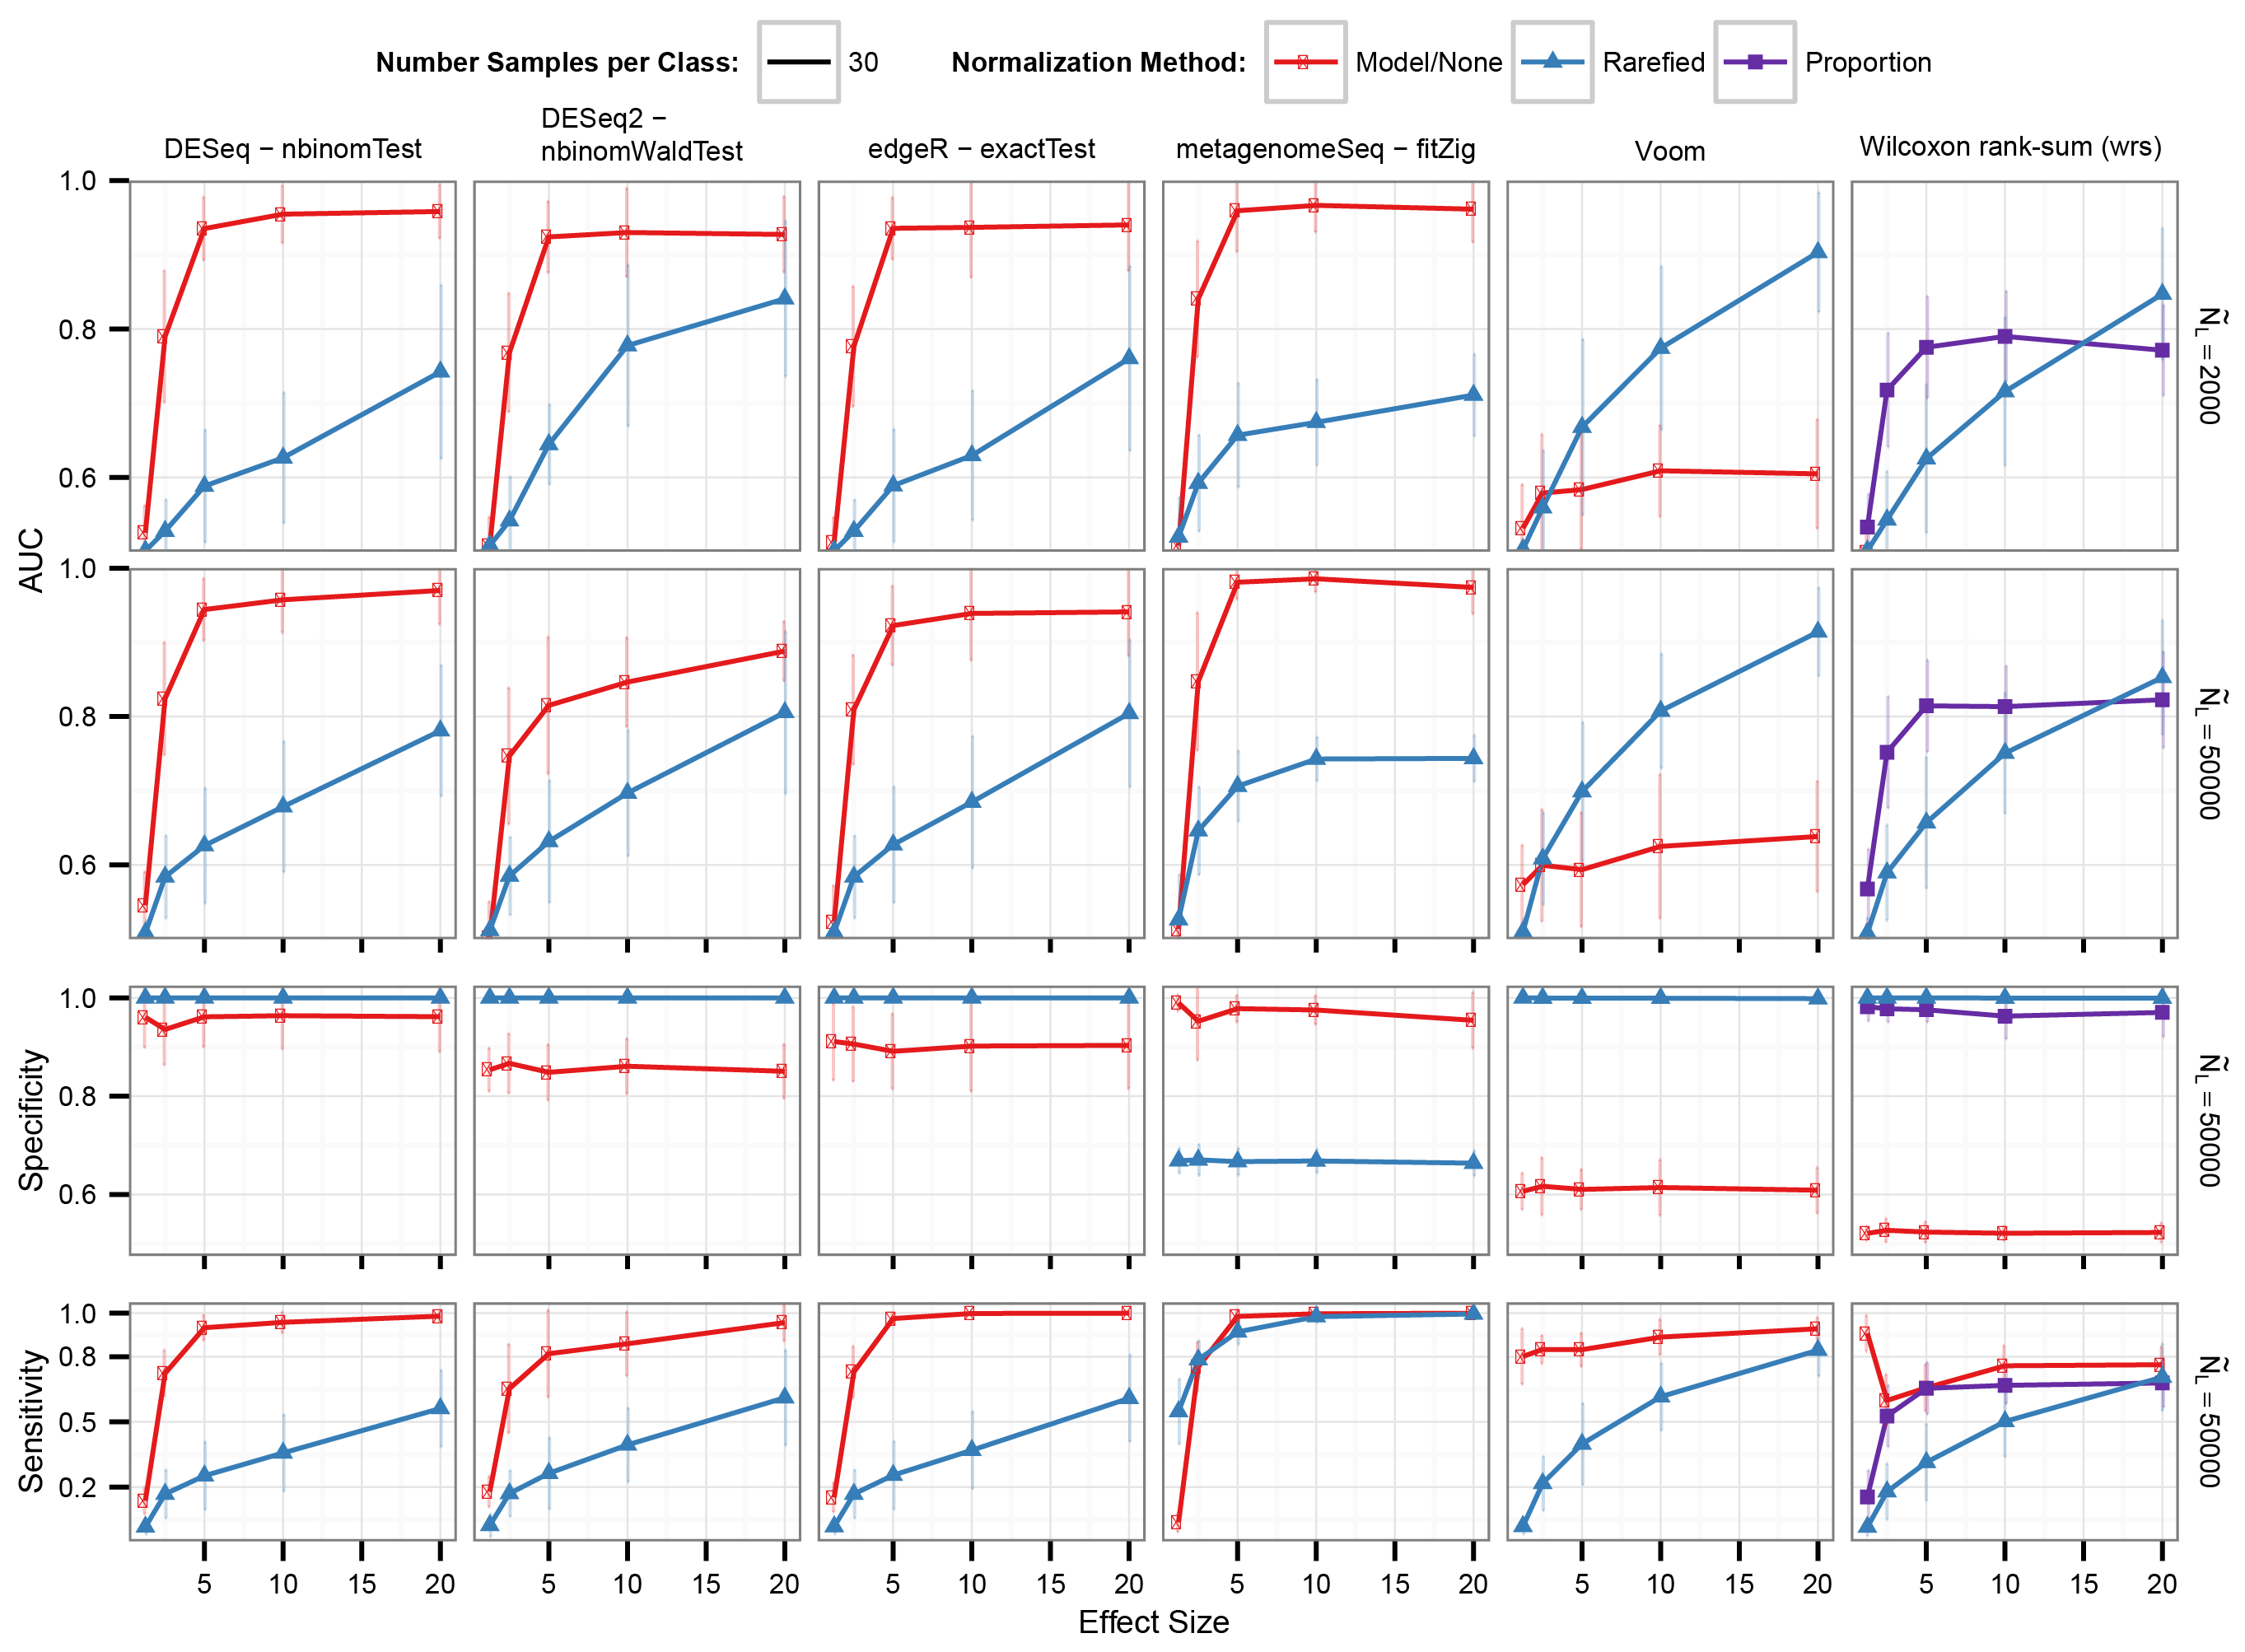
Differential abundance detection performance where one sample group average library size is 3 times the size of the other
Labels are the same as in Fig. 4.
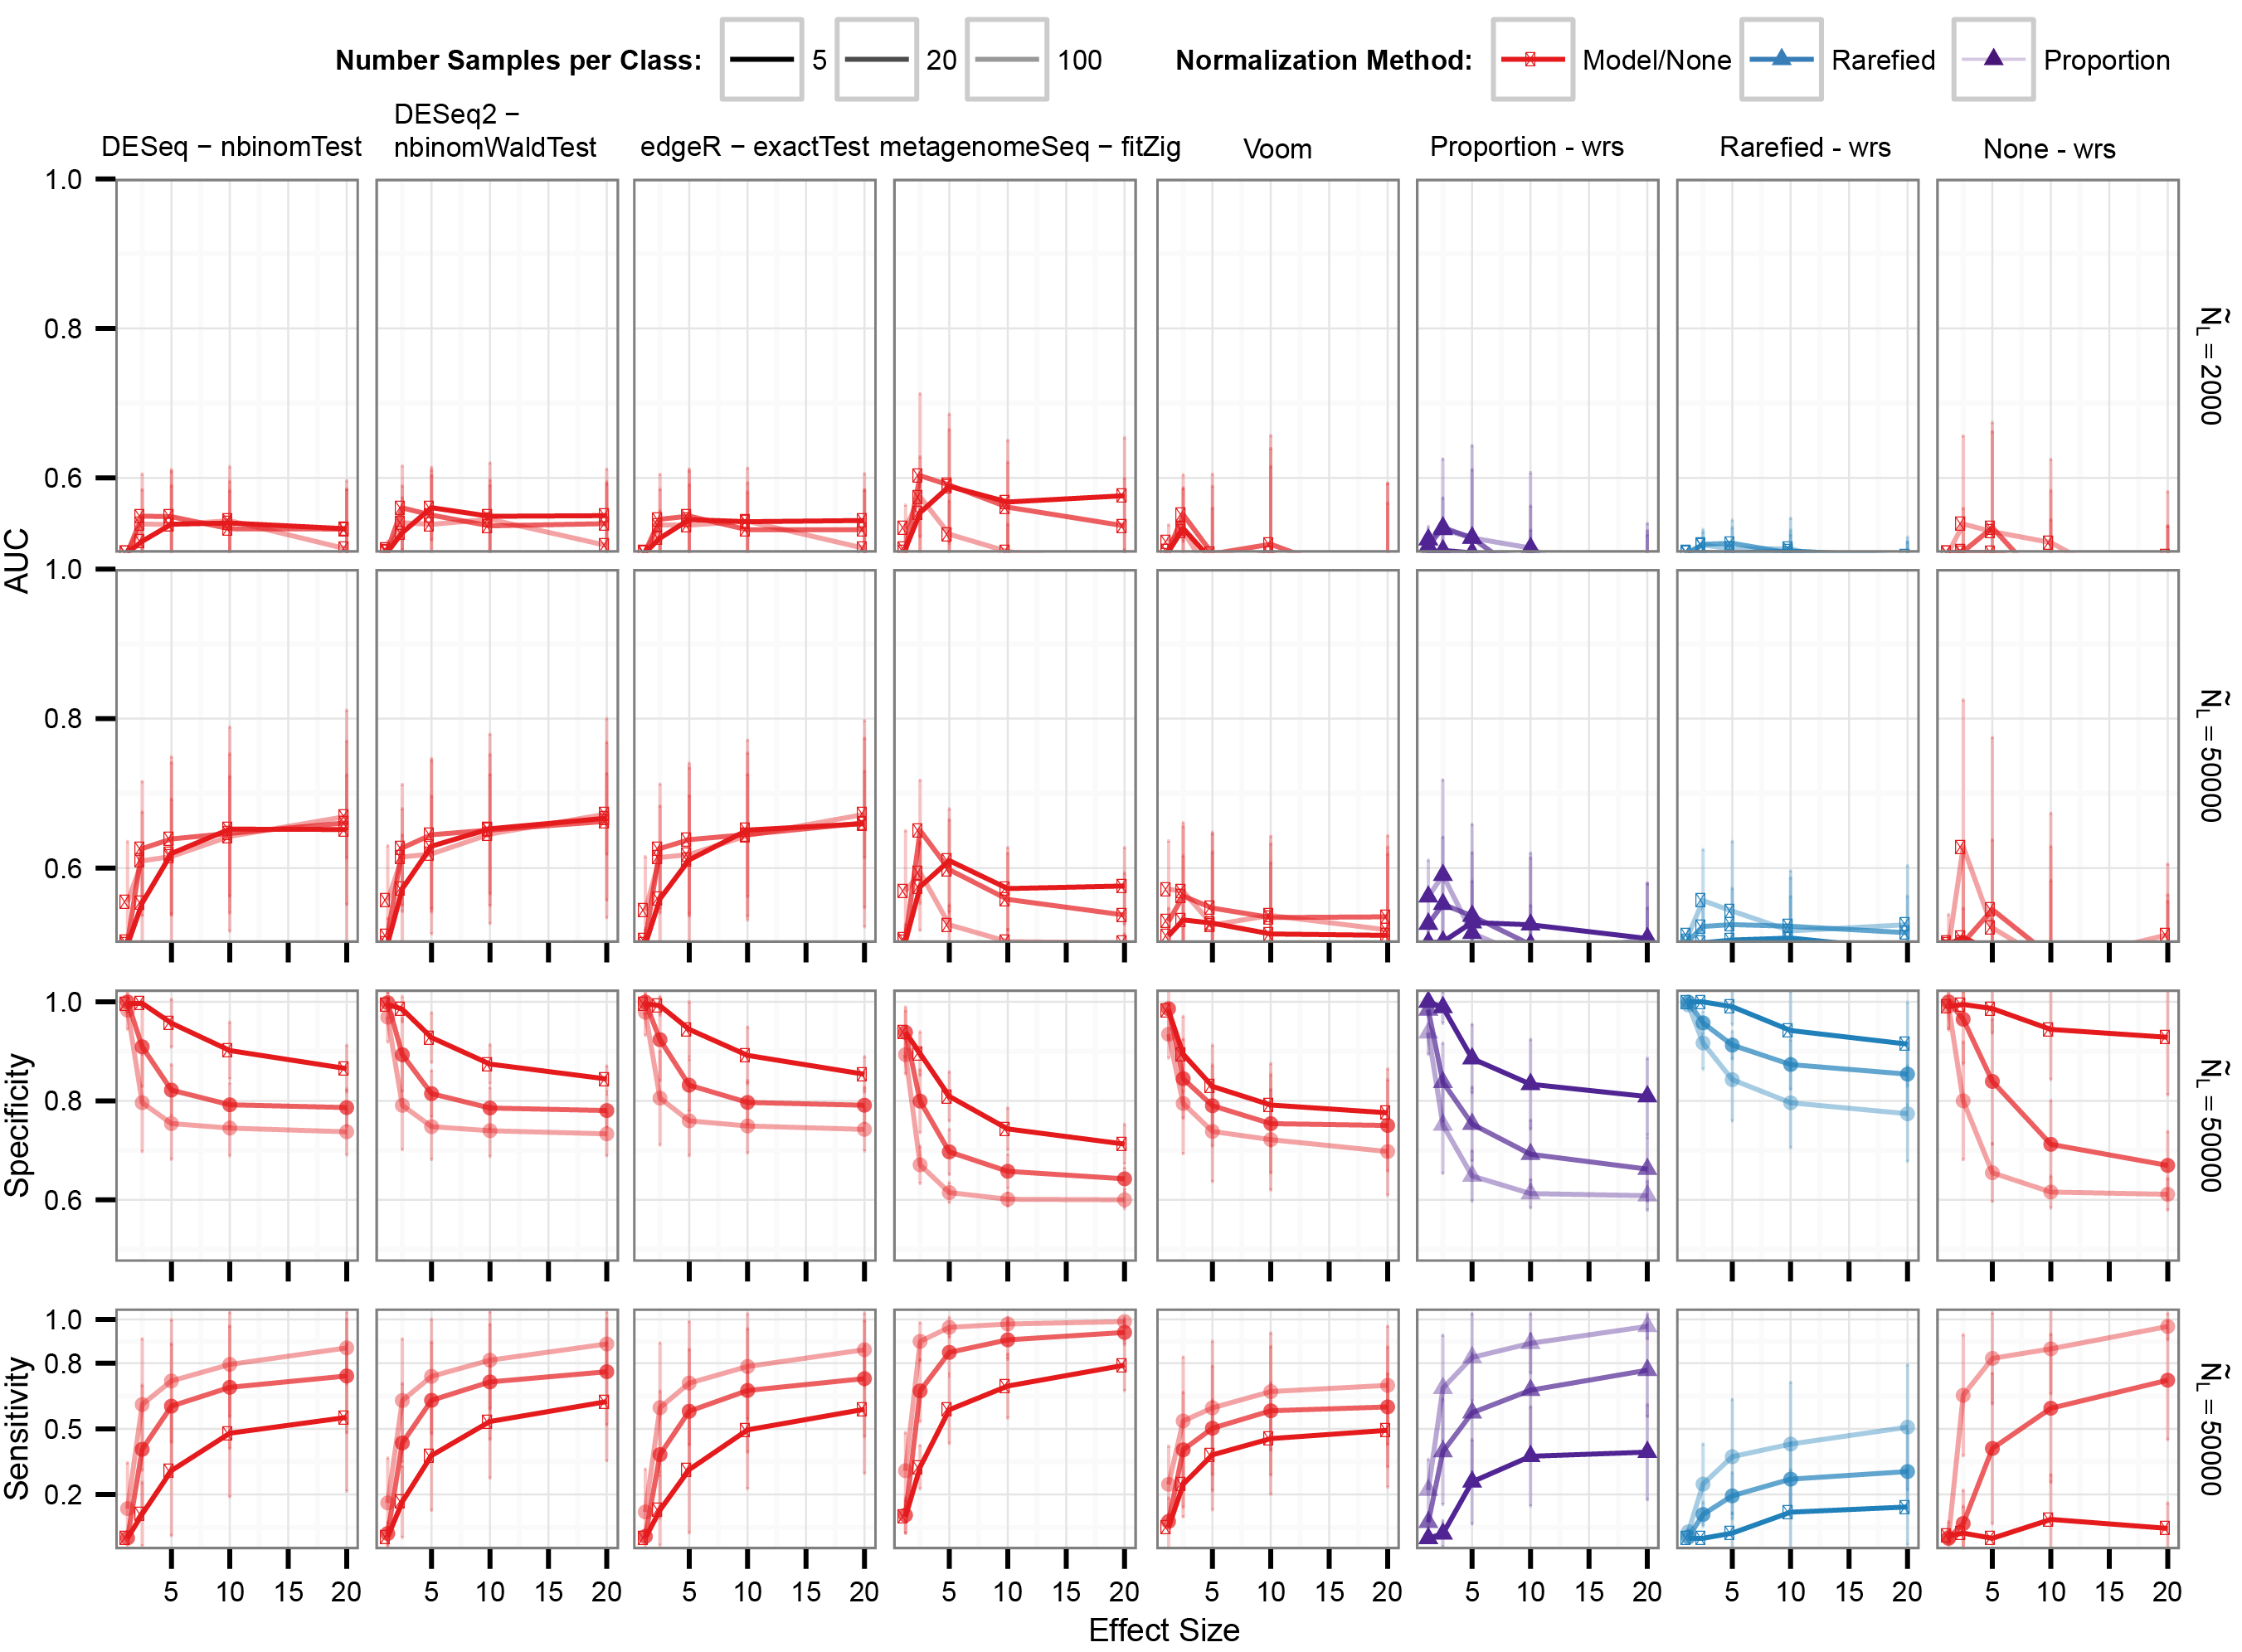
Differential abundance detection performance when the dataset is compositional
25% of OTUs are differentially abundant. Labels the same as in Fig. 4.
Supplemental R files
'Balanced' and 'Compositional' differential abundance simulations, as referenced in the Methods and Fig. S5.