
The complete mitochondrial genome of Pyxicephalus adspersus: high gene rearrangement and phylogenetics of one of the world’s largest frogs
- Published
- Accepted
- Received
- Academic Editor
- Tony Robillard
- Subject Areas
- Evolutionary Studies, Genomics, Zoology
- Keywords
- Pyxicephalidae, Mitogenome, Gene rearrangement, Phylogenetic relationship
- Copyright
- © 2019 Cai et al.
- Licence
- This is an open access article distributed under the terms of the Creative Commons Attribution License, which permits unrestricted use, distribution, reproduction and adaptation in any medium and for any purpose provided that it is properly attributed. For attribution, the original author(s), title, publication source (PeerJ) and either DOI or URL of the article must be cited.
- Cite this article
- 2019. The complete mitochondrial genome of Pyxicephalus adspersus: high gene rearrangement and phylogenetics of one of the world’s largest frogs. PeerJ 7:e7532 https://doi.org/10.7717/peerj.7532
Abstract
The family Pyxicephalidae including two subfamilies (Cacosterninae and Pyxicephalinae) is an ecologically important group of frogs distributed in sub-Saharan Africa. However, its phylogenetic position among the Anura has remained uncertain. The present study determined the complete mitochondrial genome sequence of Pyxicephalus adspersus, the first representative mitochondrial genome from the Pyxicephalinae, and reconstructed the phylogenetic relationships within Ranoidae using 10 mitochondrial protein-coding genes of 59 frog species. The P. adspersus mitochondrial genome showed major gene rearrangement and an exceptionally long length that is not shared with other Ranoidae species. The genome is 24,317 bp in length, and contains 15 protein-coding genes (including extra COX3 and Cyt b genes), four rRNA genes (including extra 12S rRNA and 16S rRNA genes), 29 tRNA genes (including extra tRNALeu (UAG), tRNALeu (UUR), tRNAThr, tRNAPro, tRNAPhe, tRNAVal, tRNAGln genes) and two control regions (CRs). The Dimer-Mitogenome and Tandem duplication and random loss models were used to explain these gene arrangements. Finally, both Bayesian inference and maximum likelihood analyses supported the conclusion that Pyxicephalidae was monophyletic and that Pyxicephalidae was the sister clade of (Petropedetidae + Ptychadenidae).
Background
Anuran mitochondrial (mt) genomes are closed double-stranded DNA molecules with the lengths varying from 15 to 23 kb (Kakehashi et al., 2013; Zhang et al., 2018a) and typically encode 37 genes: two ribosomal RNAs (12S and 16S rRNAs), 22 transfer RNAs (tRNAs), 13 protein-coding genes (PCGs), and the control region (CR) or D-loop region (Boore, 1999, 2000). The mt genome has several valuable characteristics that have led to its wide use as a research tool including limited recombination, maternal inheritance, rapid evolutionary rate, small size, and relatively conserved gene arrangement (Avise, 1994). Complete or partial mt genomes have been extensively used to test evolutionary hypotheses, to study population biogeography and phylogenetic relationships, and to distinguish cryptic species (Boore, 1999; Yu et al., 2015; Zhang et al., 2008).
To date, there are 7,977 known species of Anura (Frost, 2019) on Earth, the vast majority of which have not had their mt genomes sequenced and studied. According to Jacob Machado et al. (2018) and Zhang et al. (2018a), there are partial mt genomes for over one hundred species representing 35 families (72 genera) and complete mt genomes for over two hundred species representing 27 families (76 genera) listed in GenBank. Although non-neobatrachian frogs show conservation of the typical mt gene organization, ranoid frogs belonging to the neobatrachia show a variety of gene rearrangements in their mt genomes (Kurabayashi & Sumida, 2013; Zhang et al., 2013). Hence, by increasing the number of sequenced frog mt genomes, we can gain valuable information about mt genome arrangements and improve our understanding of mt genomic phylogenetics and evolution, population genetics (Cai et al., 2018; Cheng et al., 2018; Lin et al., 2014; Ni et al., 2015; Ye et al., 2016) and mt genome expression (Zhang et al., 2019).
Some gene rearrangements in the mt genome have been reported in neobatrachians. For example, some species show a rearrangement of the ND5 gene (Alam et al., 2010; Anoop et al., 2017; Kumar et al., 2017; Li et al., 2014a, 2016a; Sano et al., 2004, 2005). A gene rearrangement of ND6 gene has also been reported in several species (Zhang et al., 2018a; Irisarri et al., 2010; Carr et al., 2015; Kakehashi et al., 2013). Two tRNAMet genes have also been found in many species of Ceratobatrachidae, Dicroglossidae, Mantoidae, and Megophryidae (Jiang et al., 2018; Kiran et al., 2017; Kurabayashi et al., 2008; Li et al., 2018a, 2018b; Liang et al., 2016). Mantella madagascariensis (Kurabayashi et al., 2006), Rana kunyuensis (Li et al., 2016a), and Rhacophorus schlegelii (Sano et al., 2005) possess duplicated CRs. By contrast, the tRNAThr gene was lost in Nanorana taihangnica (Chen et al., 2015) and the ATP8 and ND5 genes were lost in Polypedates megacephalus (Zhang et al., 2005).
The phylogenetic relationship of Pyxicephalidae was hotly disputed. Pyxicephalidae contains two subfamilies (Cacosterninae and Pyxicephalinae) with a total of 12 genera and 84 recognized species according to molecular and morphological data (Frost et al., 2006). Using mtDNA and morphological data, Van Der Meijden suggested that Pyxicephalinae, which is composed solely of Aubria and Pyxicephalus (Frost et al., 2006), was imbedded within the Discroglossine (Van Der Meijden et al., 2005). By contrast, Wiens et al. (2009) considered Pyxicephalinae as one subfamily of Ranidae. Frost et al. (2006) and Roelants et al. (2007) recovered the monophyly of Pyxicephalidae and Van Der Meijden et al. (2011) and Pyron & Wiens (2011) treated Pyxicephalidae as a valid family. Zhang et al. (2013) supported Pyxicephalidae as a sister clade to Petropedetidae. Bittencourt-Silva et al. (2016) discussed the phylogenetic relationship of the genera in Pyxicephalidae and concluded that Aubria and Pyxicephalus, belonging to Pyxicephalinae, were the basal clade of Pyxicephalidae. Hence, research on the phylogenetic relationships of Pyxicephalus could reveal the monophyly of Pyxicephalidae.
The African giant bullfrog (Pyxicephalus adspersus) belongs to the subfamily Pyxicephalinae of the family Pyxicephalidae. It is an explosive-breeding anuran that inhabits arid to subtropical grasslands and savanna across most of southern Africa (Channing, 2001; Minter et al., 2004). It is one of the world’s largest amphibians, with males (unusually larger than females) reaching a length of 225 mm (Wager, 1965) and weights of 1.4–2.0 kg (Channing, DU Preez & Passmore, 1994; Loveridge, 1950). Liu et al. (2013) found Scapharca broughtonii (Mollusca: Bivalvia), which is an enlarged species compared to other species of Scapharca, had largest mitochondrial genomes among the genus Scapharca (Liu et al., 2013). A species with a giant size within an animal group may be associated with a larger mitogenome (Alam et al., 2010; Yu et al., 2012b, 2015; Zhang et al., 2018a). However, no studies in Pyxicephalus adspersus has examined the potential involvement of mt genome evolution. So we wondered whether this giant bullfrog had novel features of its mt genome. In the present study, we sequenced the mt genome of Pyxicephalus adspersus, the first representative mt genome of the Pyxicephalinae, to determine if mitochondrial gene rearrangement occurred and to study the phylogenetic relationships of Pyxicephalidae.
Materials and Methods
Animal treatments
Pyxicephalus adspersus are not protected by provisions in the laws of the People’s Republic of China on the protection of wildlife. Two samples of Pyxicephalus adspersus were purchased from a pet market and bred in the laboratory of JY Zhang at the College of Life Science, Zhejiang Normal University. Sample acquisition was reviewed, approved and carried out in accordance with the relevant guidelines of the Committee of Animal Research Ethics of Zhejiang Normal University.
DNA extraction, PCR and sequencing
Total DNA was extracted from the clipped toe of one specimen using a DNeasy Tissue Kit (Qiagen, Hilden, Germany). We amplified 13 overlapping gene fragments by normal polymerase chain reaction (PCR) and long-and-accurate (LA) PCR methods slightly modified from Yu et al. (2015) and Zhang et al. (2013). However, these methods failed to find some mitochondrial genes including ND3, ND5, and tRNAIle, tRNACys, tRNALys, and tRNAArg. We subsequently designed one pair of primers to sequence the ND5 gene (ND5-J: ATRGARGGNCCNACACCWGT; ND5-N: CCCATNTTWCGRATRTCCTGGTC) based to the known mitochondrial gene sequences of 53 Ranidae species from GenBank. After we obtained the ND5 gene fragment, we then designed two pairs of specific primers for ND6 (ND65-J: ACAAGAGCAGAACAATAAGC, ND65-N: TAGAGTGGAGTAAGGCAGAA and ND56-J: ATACAACCGAATTGGAGACA, ND56-N: GGTAAATCAGTGGGTAGGTAT) to sequence the fragment ranging from ND6 to ND5 genes and the fragment ranging from ND5 to ND6 genes, respectively. Surprisingly, when the two fragments from ND6 to ND5 and ND5 to ND6 were amplified their sizes proved to be nearly 8,000 and 15,000 bp, respectively. All PCR was performed using a programable Thermal Cycler (Veriti PCR Thermal Cycler; Applied Biosystems, Foster City, CA, USA) or a MyCycler Thermal Cycler (Bio-Rad, Hercules, CA, USA). TaKaRa LA-Taq kits and TaKaRa Ex-Taq (Takara Biomedical, Dalian, China) were used for LA-PCR and normal PCR reactions, respectively. PCR products were electrophoresed on 1% or 2% agarose gels and sequences were obtained using an ABI 3730 automated DNA sequencer (Applied Biosystems, Foster City, CA, USA) using the primers walking method for both strands.
Sequence assembly, annotation and analysis
Sequences were checked and assembled using SeqMan (Lasergene version 5.0) (Burland, 2000). All mt genes were determined by Mitos WebServer (Bernt et al., 2013). The locations of the 15 protein coding genes and four rRNA genes were further identified by comparison with the homologous sequences of closely related anurans downloaded from GenBank. All tRNA genes were further determined using tRNA-scan SE 2.0 (Chan & Lowe, 2016) or determined by comparison with the homologous sequences of other anurans. The mt genome was deposited in GenBank with accession number MK460224. The mt genome map of Pyxicephalus adspersus was formed using GenomeVx (Conant & Wolfe, 2008) (http://wolfe.ucd.ie/GenomeVx/). The A+T content, codon usage and relative synonymous codon usage (RSCU) of PCGs were calculated by Mega 7.0 (Kumar, Stecher & Tamura, 2016). Composition skewness was calculated according to the following formulae: AT-skew = (A−T)/(A+T); GC-skew = (G−C)/(G+C) (Perna & Kocher, 1995).
Molecular phylogenetic analysis
The phylogenetic analyses was performed using the combined nucleotide datasets by the Bayesian inference (BI) and maximum likelihood (ML) methods. BI and ML analyses were performed with 59 anuran mt genomes including Pyxicephalus adspersus. In total this included 55 species as the ingroup from Ranidae, Dicroglossidae, Rhacophoridae, Mantellidae, Pyxicephalidae, Petropedetidae, Ptychadenidae, Ceratobatrachidae, and Phrynobatrachidae (Alam et al., 2010; Chen et al., 2011; Hofman et al., 2012; Huang et al., 2016a, 2016b; Jiang et al., 2017; Kakehashi et al., 2013; Kurabayashi et al., 2006, 2010; Li et al., 2014b, 2016b; Lin et al., 2014; Liu, Wang & Zhao, 2017a; Liu et al., 2017b; Liu, Wang & Su, 2005; Ni et al., 2015; Ren et al., 2009; Sano et al., 2004, 2005; Xia et al., 2014; Yan et al., 2016; Yang et al., 2018; Yu, Zhang & Zheng, 2012a; Yu et al., 2012b, 2015; Zhang, Xia & Zeng, 2016; Zhang et al., 2005, 2009, 2013, 2018a; Zhao, Meng & Su, 2018; Zhou et al., 2009) and four species as outgroups from Microhylidae (Chen et al., 2016; Wang et al., 2018; Zhao, Meng & Su, 2018). We used the nucleotide data to assess BI and ML topology to discuss the phylogenetic position of Pyxicephalus. Although extra COX3 and Cyt b genes were found in Pyxicephalus adspersus (see the result in the following context), the extra copies of COX3 and Cyt b genes were identical to the other COX3 and Cyt b genes (100% similarity). Therefore, in phylogenetic analyses, only one set genes of COX3 and Cytb was used. In addition, due to some mitochondrial PCGs missing in some species (ND5), lacking good information (ATP8) and the heterogeneous base composition and poor phylogenetic performance (ND6) (Zhang et al., 2018a), 10 PCGs genes were used in this study and separately aligned in Mega 7.0 (Kumar, Stecher & Tamura, 2016). All genes were split jointed, clustered, Gblocked and concatenated using PhyloSuite v1.1.13 (Zhang et al., 2018b). An alignment of the 10 mt PCGs dataset consisting of 7,244 nucleotides sites was concatenated. To obtain the substitution model of the 10 mt PCGs dataset, data partitioning schemes were compared according to the Bayesian information criterion using the program PartitionFinder v1.0 (Lanfear et al., 2012). We set the 10 PCGs as 30 partitions in the 10 mt PCGs dataset according to the codon positions (the first, second, and third position) and gene numbers (10 PCGs). The best substitution model of the 30 partitions of the 10 mt PCGs dataset is shown in Table 1. Next, a GTRGAMMAI model in the RaxML program (Stamatakis, 2006) for the 10 mt PCGs dataset with 30 partitions was used for ML analysis and the GTR+I+G model in the MrBayes3.1.2 (Huelsenbeck & Ronquist, 2001) was used for Bayesian analysis. During BI analysis, the following settings were applied: number of Markov chain Monte Carlo generations = 10 million; sampling frequency = 1,000; burn-in = 1,000. The burn–in size was determined by checking convergences of -log likelihood. Bayesian runs achieved sufficient convergence when the average standard deviation of split frequencies was below 0.01.
| Subset | Subset partitions | Best model |
|---|---|---|
| Partition 1 | atp6_pos1, cox3_pos3, nd1_pos1, nd2_pos1, nd3_pos1, nd4_pos1 | GTR+I+G |
| Partition 2 | atp6_pos2, cox2_pos2, nd2_pos2, nd3_pos2, nd4_pos2, nd4l_pos2 | TVM+I+G |
| Partition 3 | atp6_pos3, nd1_pos3, nd2_pos3, nd3_pos3, nd4_pos3, nd4l_pos3 | TrN+G |
| Partition 4 | cox1_pos1, cox3_pos1 | SYM+I+G |
| Partition 5 | cox1_pos2, cytb_pos2, nd1_pos2 | TIM+I+G |
| Partition 6 | cox1_pos3 | TrN+G |
| Partition 7 | cox2_pos1, cytb_pos1, nd4l_pos1 | SYM+I+G |
| Partition 8 | cox2_pos3 | TrN+G |
| Partition 9 | cox3_pos2 | JC |
| Partition 10 | cytb_pos3 | TrN+I+G |
Results and discussion
Mitogenome characteristics of Pyxicephalus adspersus
The length of the Pyxicephalus adspersus mt genome was 24,317 bp and the mt genome encoded 15 PCGs (including extra COX3 and Cyt b genes), four rRNA genes (two each of 12S rRNA and 16S rRNA genes), 29 tRNA genes (including extra tRNALeu (UAG), tRNAThr, tRNAPro, tRNAPhe, tRNALeu (UUR), tRNAVal, and tRNAGln genes) and two CRs (including one extra CR) (Fig. 1; Table 2). All PCGs excluding the ND6 gene and four rRNA genes as well as all tRNA genes excluding tRNAAla, tRNAAsn, tRNACys, tRNAGln, tRNAGlu, tRNAPro, tRNASer, tRNATyr genes were encoded on the major strand. The length of the Pyxicephalus adspersus mitogenome was the largest size among all known anuran mitogenomes.
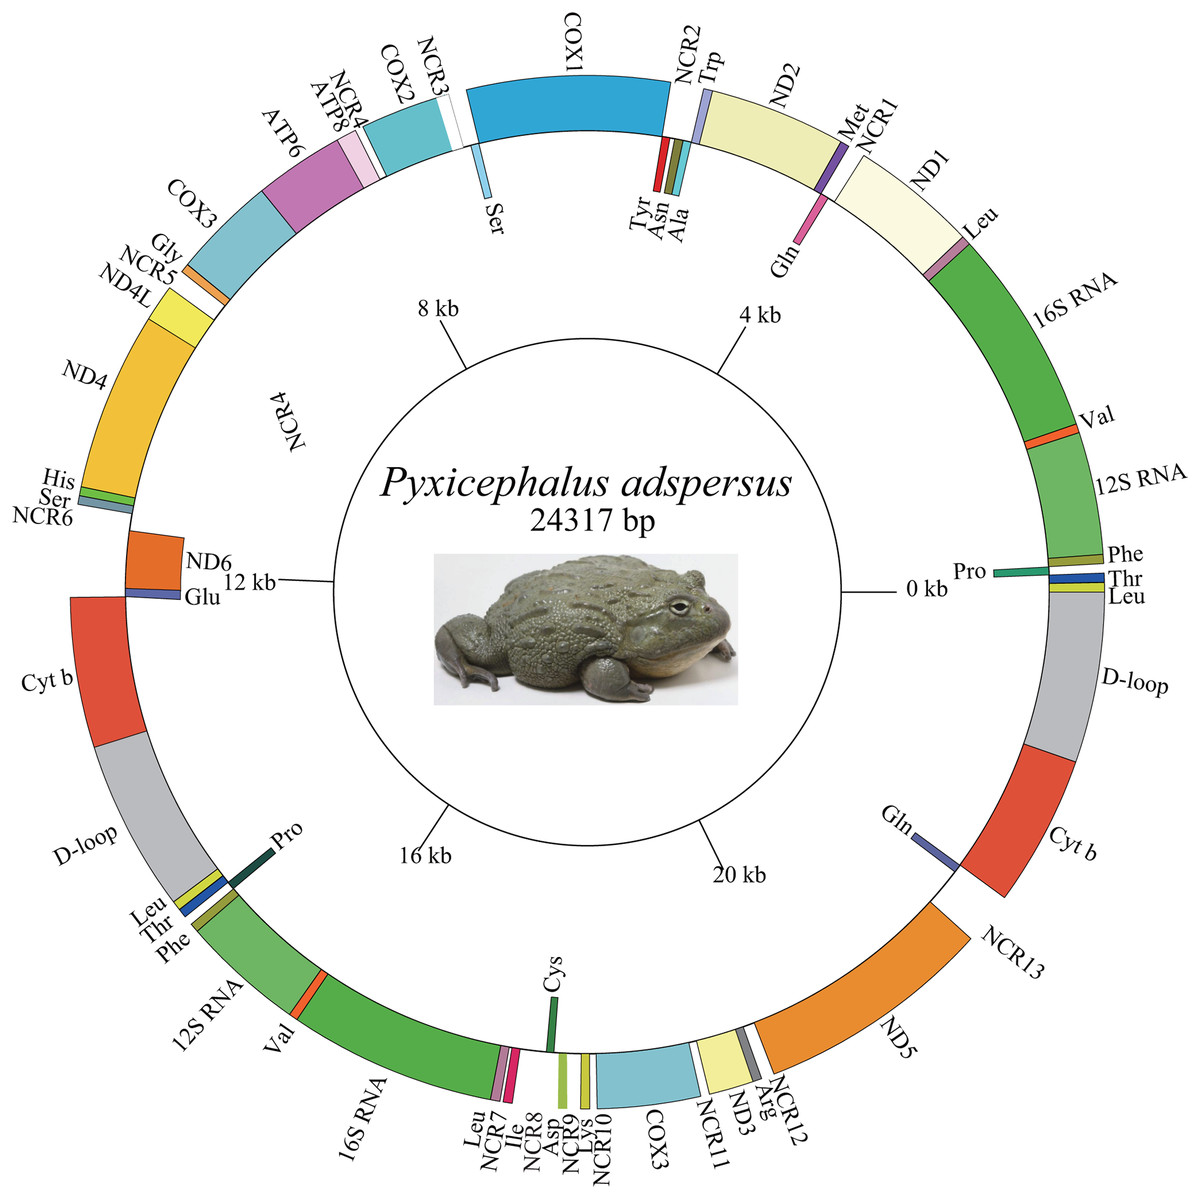
Figure 1: Graphical map of the mitogenome of P. adspersus.
The tRNAs are labeled according to the three-letter amino acid codes. A gene name outside the circle indicates that the direction of transcription is anti-clockwise, whereas a gene name inside the circle indicates that the direction of transcription is clockwise.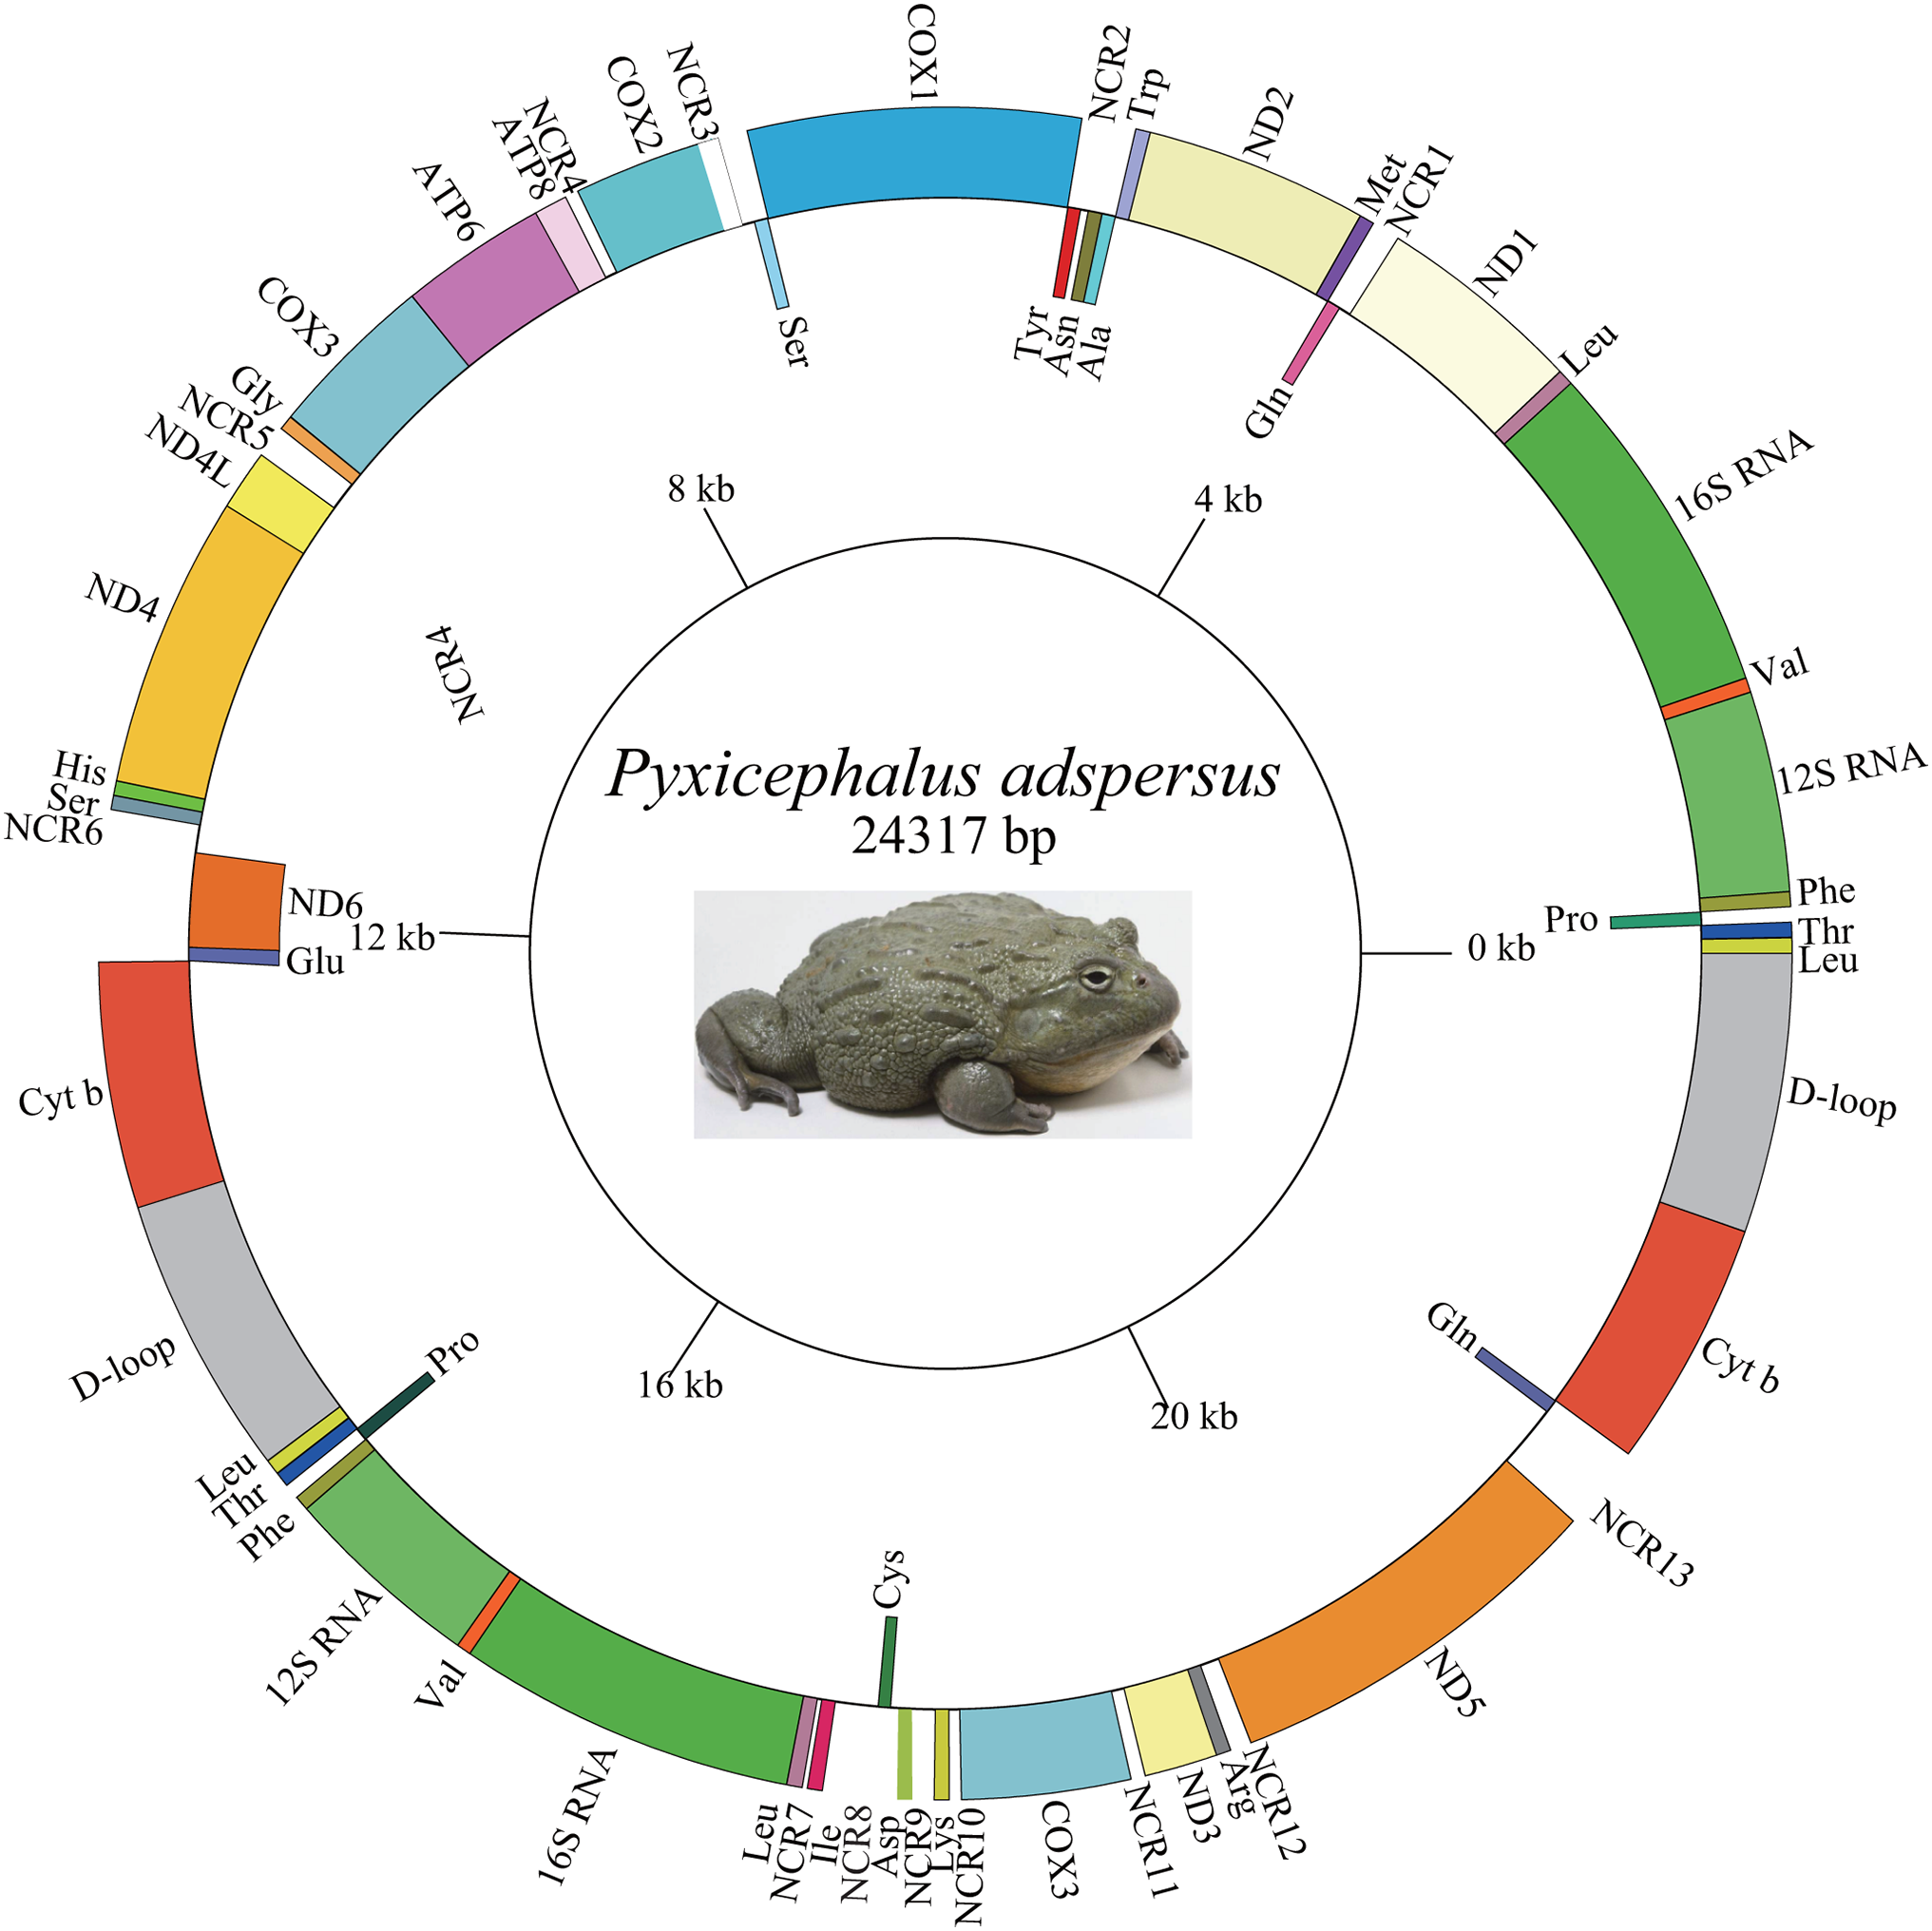
| Gene/region | Start position |
Spacer (+) overlap (−) |
Length (bp) | Start codon |
Stop codon |
Strand |
|---|---|---|---|---|---|---|
| tRNALeu | 1–72 | +1 | 72 | H | ||
| tRNAThr | 74–143 | 0 | 70 | H | ||
| tRNAPro | 144–212 | +1 | 69 | L | ||
| tRNAPhe | 214–283 | 0 | 70 | H | ||
| 12S rRNA | 284–1,215 | 0 | 932 | H | ||
| tRNAVal | 1,216–1,283 | 0 | 68 | H | ||
| 16S rRNA | 1,284–2,861 | 0 | 1,578 | H | ||
| tRNALeu (UUR) | 2,862–2,934 | 0 | 73 | H | ||
| ND1 | 2,935–3,897 | +60 | 963 | ATG | TAG | H |
| NCR1 | 3,898–3,957 | 60 | ||||
| tRNAGln | 3,958–4,028 | −1 | 71 | L | ||
| tRNAMet | 4,028–4,096 | 0 | 69 | H | ||
| ND2 | 4,097–5,134 | −2 | 1,038 | ATT | TAG | H |
| tRNATrp | 5,133–5,201 | 0 | 69 | H | ||
| tRNAAla | 5,202–5,271 | 0 | 70 | L | ||
| tRNAAsn | 5,272–5,344 | +39 | 73 | L | ||
| NCR2 | 5,345–5,383 | 39 | ||||
| tRNATyr | 5,384–5,450 | +1 | 67 | L | ||
| COX1 | 5,452–6,994 | +2 | 1,543 | GTG | T | H |
| tRNASer (UCN) | 6,997–7,067 | +69 | 71 | L | ||
| NCR3 | 7,067–7,130 | 59 | ||||
| COX2 | 7,131–7,818 | +61 | 688 | ATG | T | H |
| NCR4 | 7,817–7,879 | 61 | ||||
| ATP8 | 7,880–8,044 | −10 | 165 | ATG | TAA | H |
| ATP6 | 8,035–8,716 | 0 | 682 | ATG | T | H |
| COX3 | 8,717–9,500 | +1 | 784 | ATG | T | H |
| tRNAGly | 9,501–9,569 | +150 | 69 | H | ||
| NCR5 | 9,570–9,719 | 150 | ||||
| ND4L | 9,720–10,007 | −7 | 288 | ATG | TAA | H |
| ND4 | 10,001–11,363 | 0 | 1,363 | ATG | T | H |
| tRNAHis | 11,364–11,430 | 0 | 67 | H | ||
| tRNASer (AGY) | 11,431–11,497 | +143 | 67 | H | ||
| NCR6 | 11,496–11,640 | 143 | ||||
| ND6 | 11,641–12,126 | 0 | 486 | ATG | AGG | L |
| tRNAGlu | 12,127–12,196 | +1 | 70 | L | ||
| Cyt b | 12,198–13,349 | 0 | 1,152 | ATG | TAA | H |
| CR1 | 13,350–14,646 | 0 | 1,297 | H | ||
| tRNALeu | 14,647–14,718 | +1 | 72 | H | ||
| tRNAThr | 14,720–14,789 | 0 | 70 | H | ||
| tRNAPro | 14,790–14,858 | +1 | 69 | L | ||
| tRNAPhe | 14,860–14,929 | 0 | 70 | H | ||
| 12S rRNA | 14,930–15,861 | 0 | 932 | H | ||
| tRNAVal | 15,862–15,929 | 0 | 68 | H | ||
| 16S rRNA | 15,930–17,507 | 0 | 1,578 | H | ||
| tRNALeu (UUR) | 17,508–17,580 | +22 | 73 | H | ||
| NCR7 | 17,579–17,602 | 22 | ||||
| tRNAIle | 17,603–17,673 | +219 | 71 | H | ||
| NCR8 | 17,672–17,866 | 219 | ||||
| OL | 17,867–17,895 | 29 | L | |||
| tRNACys | 17,893–17,957 | +9 | 65 | L | ||
| tRNAAsp | 17,967–18,035 | +151 | 69 | H | ||
| NCR9 | 18,034–18,186 | 151 | ||||
| tRNALys | 18,187–18,256 | +54 | 70 | H | ||
| NCR10 | 18,255–18,310 | 54 | ||||
| COX3 | 18,311–19,094 | +65 | 784 | ATG | T | H |
| NCR11 | 19,093–19,159 | 65 | ||||
| ND3 | 19,160–19,501 | −2 | 342 | ATG | TAA | H |
| tRNAArg | 19,500–19,568 | +98 | 69 | H | ||
| NCR12 | 19,569–19,666 | 98 | ||||
| ND5 | 19,667–21,472 | +324 | 1,806 | ATG | AGG | H |
| NCR13 | 21,471–21,796 | 324 | ||||
| tRNAGlu | 21,797–21,867 | +1 | 71 | L | ||
| CYTB | 21,869–23,020 | 0 | 1,152 | ATG | TAA | H |
| CR2 | 23,021–24,317 | 1,297 | H |
A total 22 bp intergenic overlap inferring to 10 genes was found in the mt genome of Pyxicephalus adspersus. The total non-coding regions (NCRs) in the mitogenome was 1,376 bp, composed of 13 larger NCRs ranging from 22 to 324 bp and many smaller regions (1–10 bp) (Fig. 1; Table 2). NCR13 between ND5 and Glu was 324 bp and showed 92.6% similarity with the ND6 gene. NCR11 between COX3 and ND3 genes showed 73.9% similarity with the tRNAGly gene and NCR7 between tRNALeu and tRNAIle genes was 100% similar to the 5′ segment of the ND1 gene. The other spacer regions showed 48.7–67.3% similarity with corresponding gene clusters (Table 3).
| Non-coding region | Corresponding genes | Comparability (%) |
|---|---|---|
| NCR1 | Ile | 50 |
| NCR2 | OL-tRNACys | 48.7 |
| NCR3 | Asp | 59.4 |
| NCR4 | Lys | 50.7 |
| NCR5 | ND3-tRNAArg | 67.3 |
| NCR6 | ND5 | 60.1 |
| NCR7 | ND1 | 100 |
| NCR8 | Gln-Met-ND2-tRNATrp-tRNAAla-tRNAAsn | 53.0 |
| NCR9 | COX2 | 50.3 |
| NCR10 | ATP8-ATP6 | 57.4 |
| NCR11 | Gly | 73.9 |
| NCR12 | ND4-ND4L-tRNAHis-tRNASer | 48.4 |
| NCR13 | ND6 | 92.6 |
A total of 13 NCRs also had high homology compared to corresponding deleted genes (Table 3). The tRNAIle gene moved from the typical IQM tRNA cluster to a position between the 22 bp NCR7 and a 219 bp NCR8 and the corresponding location of the tRNAIle gene between the ND1 and tRNAGln genes was replaced by a 60 bp NCR1 (50% similarity with Ile). The OL-tRNACys genes also moved from the WANOLCY tRNA cluster to a position between a 219 bp NCR8 and the tRNAAsp gene, whereas a 39 bp NCR2 was formed in the position between tRNAAsn and tRNATyr genes. The tRNAAsp gene moved from the typical position between tRNASer and COX2 genes to a location between the tRNACys gene and a 151 bp NCR9 and the former position was replaced by a 59 bp NCR3. The tRNALys gene moved from the typical position between COX2 and ATP8 genes to a location between a 151 bp NCR9 and a 54 bp NCR10 and the former position was replaced by a 61 bp NCR3. The ND3-tRNAArg genes moved from the typical position between tRNAGly and ND4L genes to a location between a 65 NCR11 and ND5 and the former position was replaced by a 150 bp NCR5. The ND5 gene moved from the typical position between tRNASer and ND6 genes to a location between the 98 bp NCR12 and the 324 bp NCR13 and the former position was replaced by a 143 bp NCR6.
There were 15 PCGs in the mt genome of Pyxicephalus adspersus, including two COX1 and two Cyt b genes; in both cases the two copies of each gene were identical. PCGs started with ATN codons except for COX1, which used GTG. Most PCGs ended with a complete TAN codon or with an incomplete T or TA except for ND5 and ND6 that showed AGG as the termination codon. RSCU and codon counts for the mt genome of Pyxicephalus adspersus are shown in Fig. 2. It was evident that the most frequently used codon was CGA, followed by GCC, CAA, and CCC. Leu (UUR), Ile, and Phe as the most frequently used amino acids were also found.
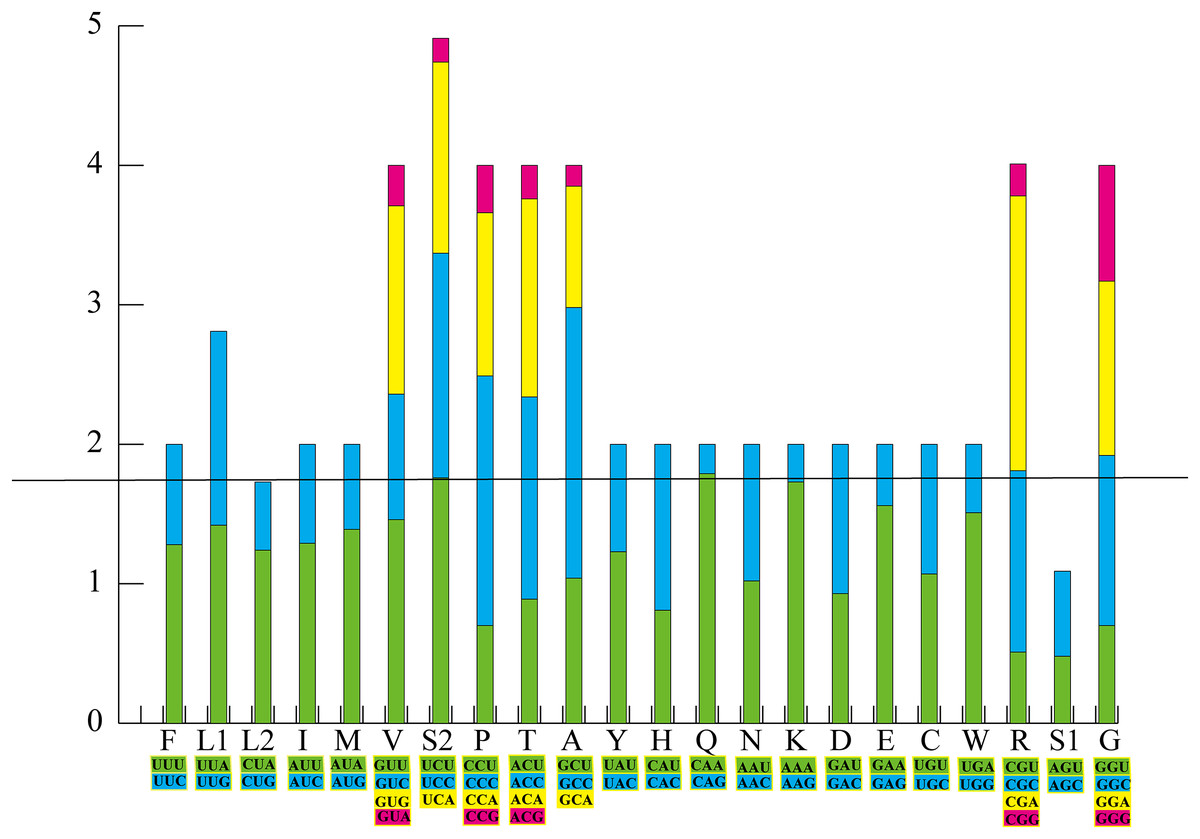
Figure 2: The relative synonymous codon usage (RSCU) in the P. adspersus mitogenome.
Codon families are provided on the x-axis along with the different combinations of synonymous codons that code for the same amino acid. RSCU are provided on the y-axis.
The genome composition (A: 29.5%, C: 27.8%, G: 14.5%, T: 28.2%) showed an A+T bias, which accounted for 57.7% of the bases, and exhibited a negative GC-skew (−0.31) and a positive AT-skew (0.02) (Table 4). The highest A+T content (65.5%) was found in the CR, whereas the lowest A+T content (56.5%) was found in the PCGs region.
| A% | T% | G% | C% | AT% | GC% | AT skewness | GC skewness | |
|---|---|---|---|---|---|---|---|---|
| Whole genome | 29.5 | 28.2 | 14.5 | 27.8 | 57.7 | 42.3 | 0.022 | −0.314 |
| Protein-coding genes | 26.1 | 30.0 | 14.3 | 29.6 | 56.1 | 43.9 | −0.071 | −0.348 |
| 1st codon positions | 26.9 | 28.1 | 18 | 27.1 | 55 | 45.1 | −0.022 | −0.202 |
| 2nd codon positions | 23.5 | 33.5 | 13.1 | 29.9 | 57 | 43 | −0.175 | −0.392 |
| 3rd codon positions | 27.9 | 28.5 | 11.9 | 31.7 | 56.4 | 43.6 | −0.012 | −0.455 |
| tRNA genes | 28.8 | 27.8 | 22.1 | 21.2 | 56.6 | 43.3 | 0.018 | 0.021 |
| rRNA genes | 33.3 | 24.5 | 18.2 | 24.0 | 57.8 | 42.2 | 0.151 | −0.139 |
| Control region | 31.9 | 33.6 | 12.5 | 22.0 | 65.5 | 34.5 | −0.026 | −0.275 |
Two copies of the gene cluster (tRNAGlu-Cyt b-CR-tRNALeu-tRNAThr-tRNAPro-tRNAPhe-12S RNA-tRNAVal-16S RNA-tRNALeu) occurred, one between ND6 and tRNAIle genes and the other between ND5 and ND1 genes. Remarkably, the nearly identical nucleotide sequences (99.99% similarity with only one G base extra inserted into tRNAGlu of the 5,454 alignment sites) were found in the two copies of these gene clusters The extra COX3 gene was located between tRNALys and ND3 genes. The tRNAIle gene moved from the typical neobatrachian IQM tRNA cluster to a location between the tRNALeu and tRNACys genes whereas the tRNACys gene moved from the typical neobatrachian WANCY tRNA cluster to a location between the tRNAIle and tRNALys genes. The tRNALys gene moved from the typical neobatrachian position between COX2 and ATP8 genes to a location between tRNACys and the extra COX3 gene. The ND3-tRNAArg genes moved from the position between tRNAGly and ND4L genes to a location between the COX3 and ND5 genes. The ND5 gene moved from the typical neobatrachian position between tRNASer and ND6 genes to a location between the tRNAArg and tRNAGlu genes.
The mt genome of Pyxicephalus adspersus contained two copies of the 16S rRNA and 12S rRNA genes and each copy was identical to its original. The two copies of the 16S rRNA gene with a length of 1,578 bp were located between two copies of tRNALeu and tRNAVal genes, respectively, whereas the two copies of the 12S rRNA gene with a length of 932 bp were located between two copies of tRNAPhe and tRNAVal genes, respectively (Fig. 1). We found that the AT-skew was slightly positive whereas the GC-skew was strongly negative in the skew of the rRNA genes (Table 4), which showed that the contents of A and C were higher than those of T and G, respectively.
The mt genome of Pyxicephalus adspersus contained 29 tRNA genes: two copies of LTPF gene clusters, two copies of tRNALeu, two copies of tRNAVal, two copies of tRNAGln; the tRNA sequences of each copy were identical. However, tRNAIle, tRNACys, and tRNALys genes were transferred from the original regions. The existence of two copies of a tRNA gene is uncommon. The size of the tRNAs was 2,021 bp with an average A+T content of 56.6%. Among the 29 tRNAs, most tRNA genes excluding tRNASer (AGN) have the common cloverleaf secondary structure. The mt genome of Pyxicephalus adspersus also contained two copies of the CR and each CR copy had an identical length of 1,306 bp and was located between two copies of the Cyt b and tRNALeu genes.
Possible gene rearrangement mechanisms of Pyxicephalus adspersus mtDNA
In Pyxicephalus adspersus, two copies of the tRNAGlu-Cyt b-CR-tRNALeu-tRNAThr-tRNAPro-tRNAPhe-12S RNA-tRNAVal-16S RNA-tRNALeu gene cluster, two copies of the COX3 gene, and the translocation of tRNAIle, tRNACys, tRNAAsp, tRNALys, tRNAArg, ND3 and ND5 genes from their typical positions were found. Comparing the mt gene rearrangements in all sequenced mitochondrial genomes of frogs, we did not find any other species where similar gene rearrangements existed. The Tandem duplication and random loss model (TDRL) (Arndt & Smith, 1998) can be used to explain the gene rearrangement in Pyxicephalus adspersus. The rearrangement mechanism of hypothesized intermediate steps is as follows (Fig. 3). Firstly, the two mitochondrial genomes were linked by the head-to-tail method and the inferred “dimer-mitogenome” intermediate of the Pyxicephalus adspersus mtDNA could be formed from two entire mitogenomes. Secondly, some copies of duplicated genes were randomly deleted completely or partially from the two mt monomers. Thirdly, some duplicated genes lost their functions or became noncoding regions. This then formed the gene arrangement of Pyxicephalus adspersus. Hence, the Dimer-Mitogenome and the TDRL model (Arndt & Smith, 1998) may be the most appropriate to explain the gene arrangements in Pyxicephalus adspersus.
Figure 3: Proposed mechanism of gene rearrangements in the P. adspersus mitogenome under the Dimer-Mitogenome and a model of tandem duplication of gene regions.
(A) Typical Dicroglossidae gene order. (B) The dimeric molecule with two monomers linked head-to-tail and subsequent first deletions of partial genes or complete genes resulting in the derived gene order. (C) State in P. adspersus after the final duplication and deletion.
Phylogenetic analysis
We illustrated nodal supports from ML and BI analyses together using Bayesian topology (Fig. 4) because the combined data set consisting of 10 protein coding sequences resulted in identical topology for phylogenetic relationships. Both ML and BI analyses showed high branch support values. Dicroglossidae is a sister clade of Ranidae. The clade of Mantellidae and Rhacophoridae is a sister clade of Dicroglossidae and Ranidae. Petropedetidae is a sister clade of Ptychadenidae and then Pyxicephalidae is a sister clade of (Petropedetidae + Ptychadenidae). The clade of (Pyxicephalidae + (Petropedetidae + Ptychadenidae)) is a sister clade of (Dicroglossidae + Ranidae) + (Mantellidae + Rhacophoridae). Ceratobatrachidae is a sister clade of Phrynobatrachidae. The clade of Ceratobatrachidae and Phrynobatrachidae is a sister clade of ((Pyxicephalidae + (Petropedetidae + Ptychadenidae)) + (Dicroglossidae + Ranidae) + (Mantellidae + Rhacophoridae). Pyxicephalus adspersus is a sister clade of Tomopterna cryptotis. The monophyly of Dicroglossidae, Ranidae, Mantellidae, Rhacophoridae, Pyxicephalidae, and Ceratobatrachidae was well supported.
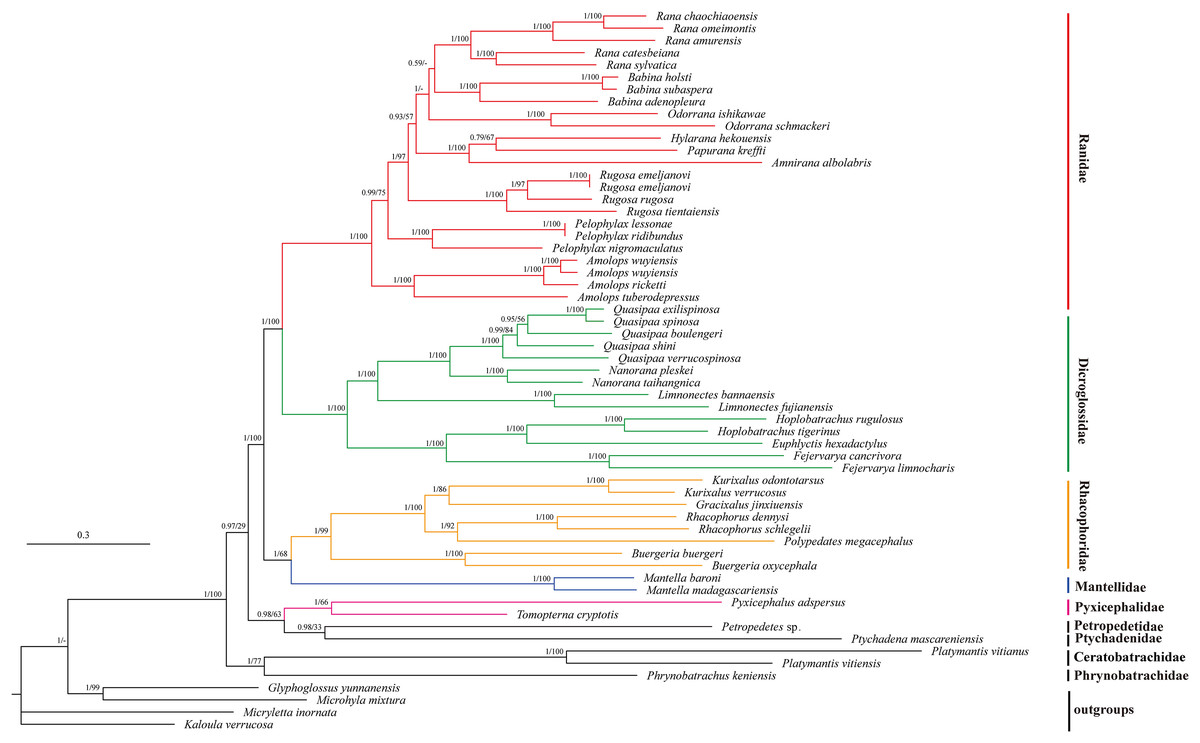
Figure 4: Phylogenetic relationships of Ceratobatrachidae, Dicroglossidae, Mantellidae, Petropedetidae, Phrynobatrachidae, Pyxicephalidae, Ptychadenidae, Ranidae, and Rhacophoridae based on 10 protein-coding genes using nucleotide datasets.
Phylogenetic analyses using nucleotide datasets were carried out for 59 frog species based on all 10 protein-coding genes from their respective mt genomes. Branch lengths and topology are from BI analysis. The tree was rooted with four out-groups (Micryletta inornata, M. mixtura, Glyphoglossus yunnanensis, and Kaloula verrucosa). Numbers above the nodes are the posterior probabilities of BI on the left and the bootstrap values of ML on the right.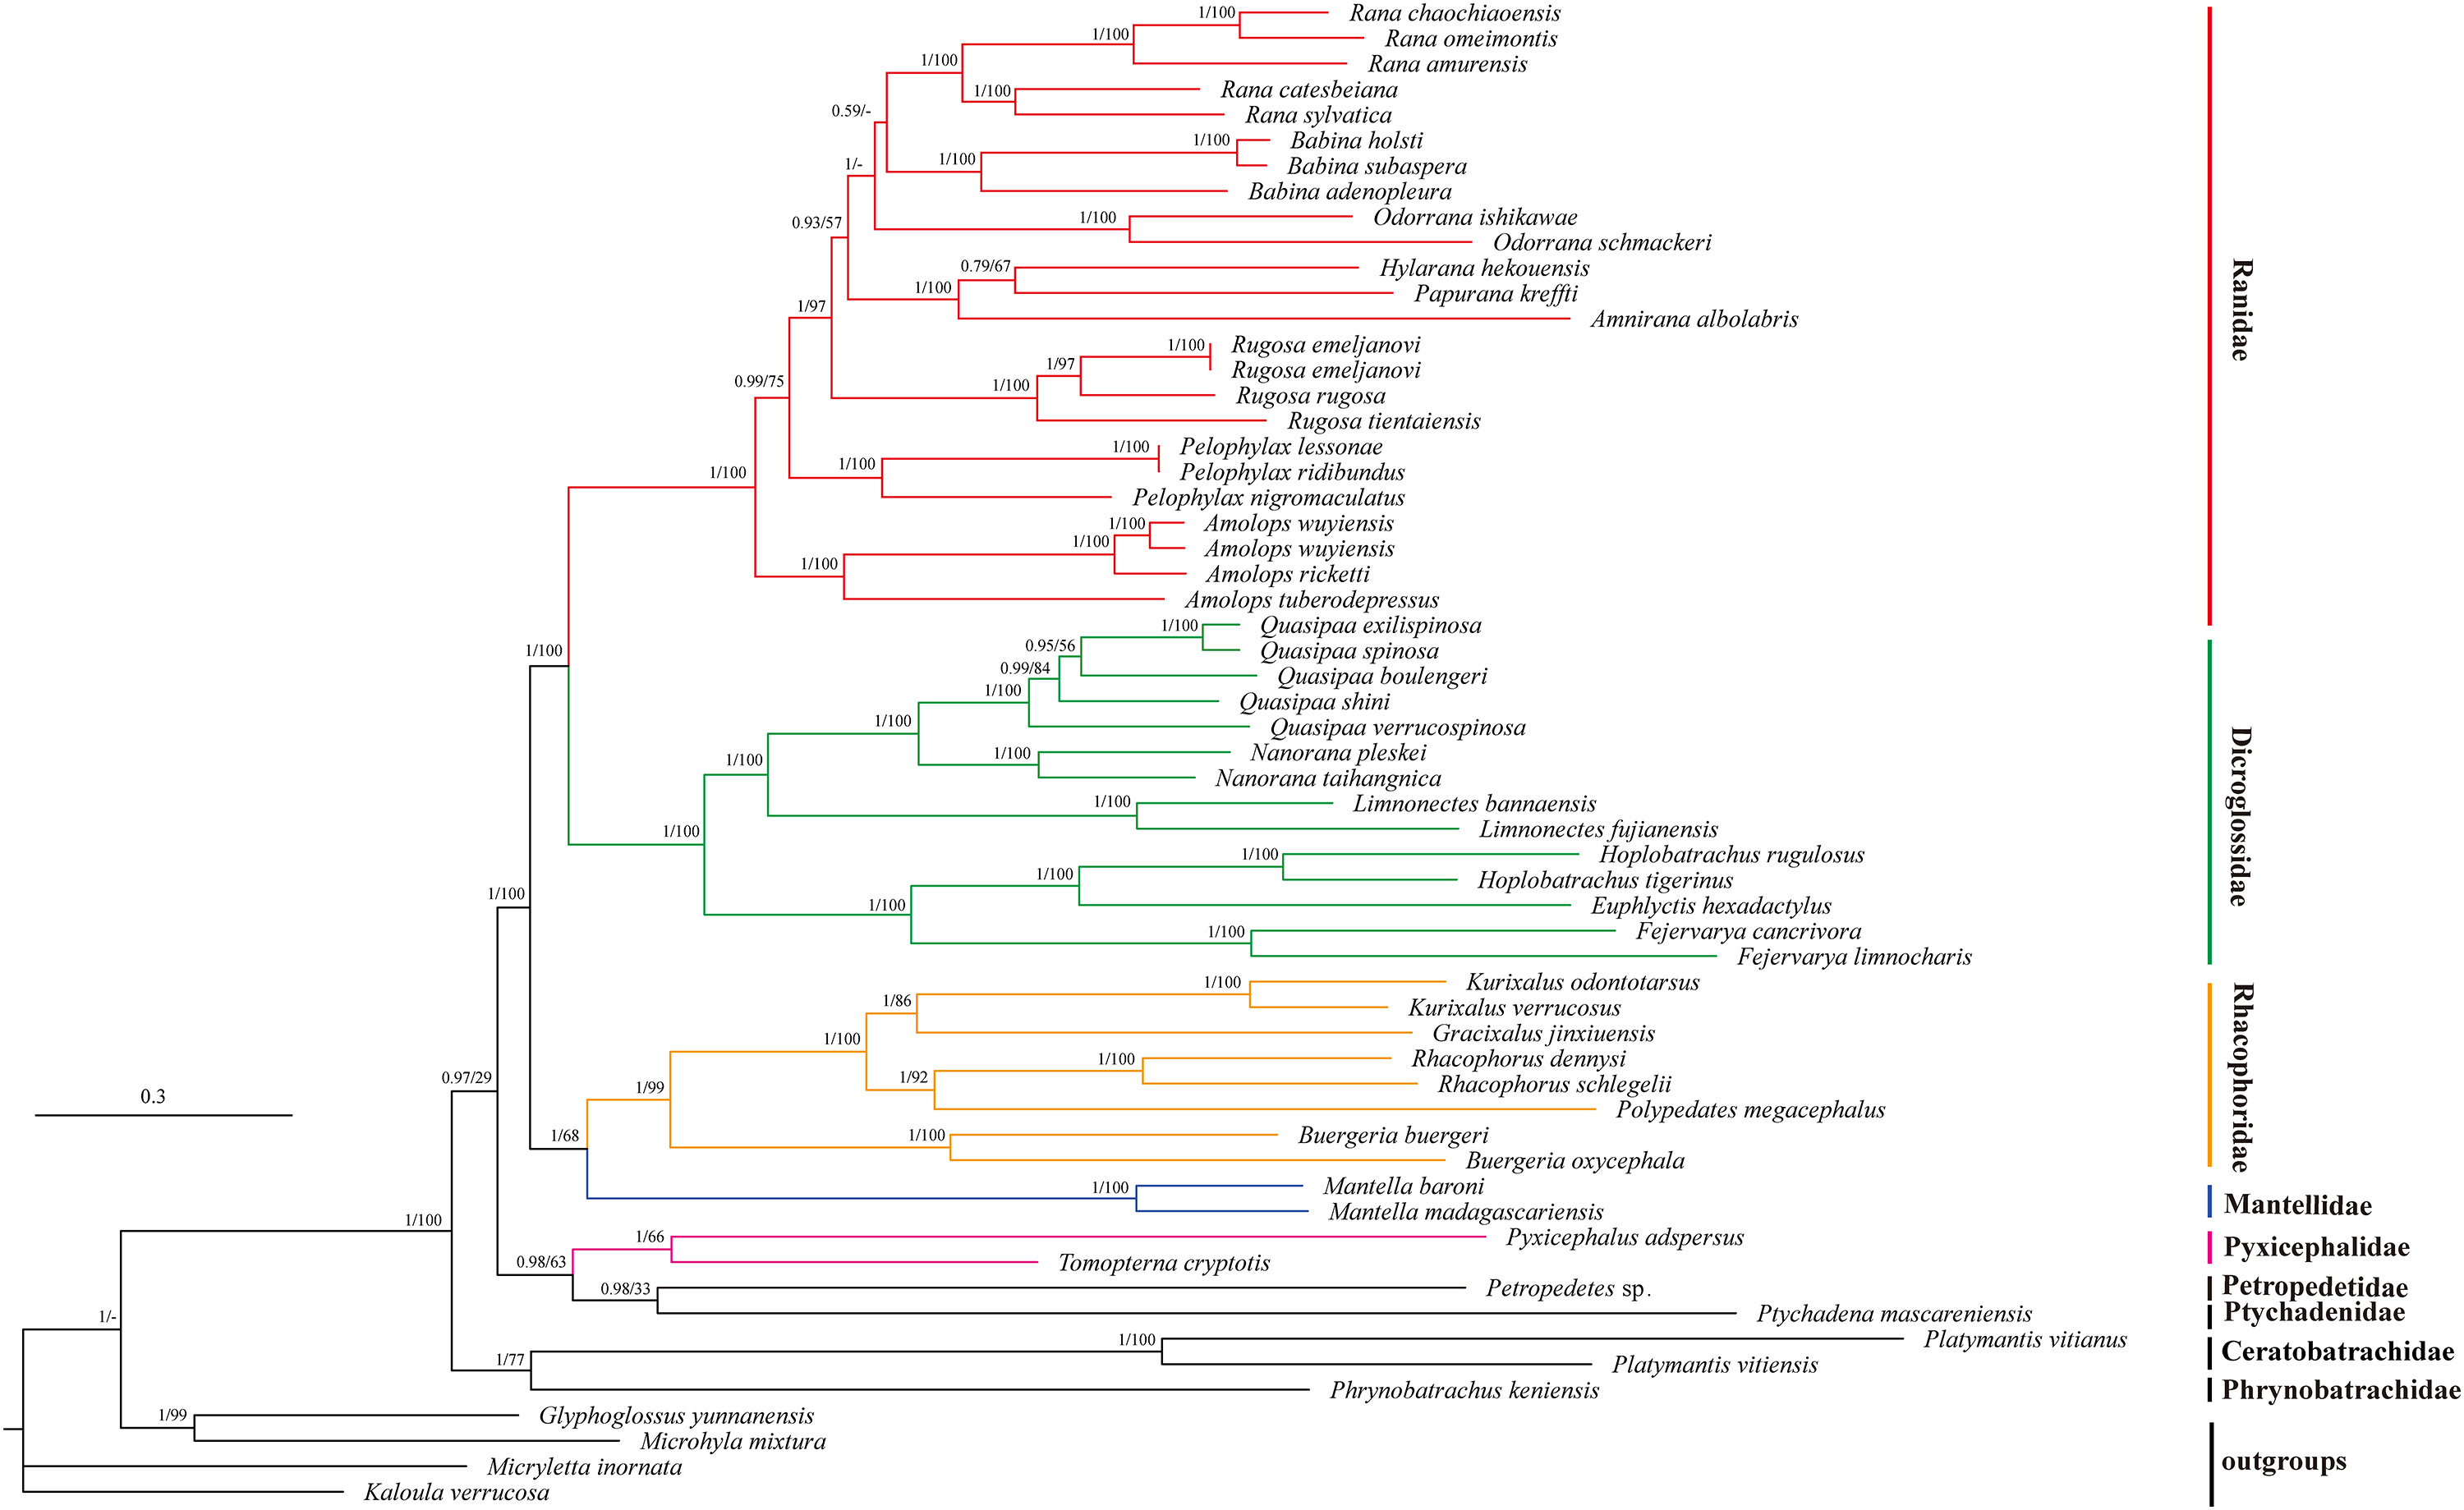
The monophyly of Pyxicephalidae is supported for Pyxicephalus adspersus (Pyxicephalinae) as a sister clade of T. cryptotis (Cacosterninae). Pyxicephalidae is a valid family in this study as was also supported by the results of Frost et al. (2006), Roelants et al. (2007), and Pyron & Wiens (2011). Although Scott and Van Der Meijden supported Pyxicephalinae as imbedded within the Discroglossine (Scott, 2005; Van Der Meijden et al., 2005), Pyxicephalus adspersus (Pyxicephalidae) is not clustered into Dicroglossidae or Ranidae, whereas Dicroglossidae is a sister clade of Ranidae, which is supported by Zhang et al. (2018a). Zhang et al. (2013) supported Pyxicephalidae as a sister clade to Petropedetidae, our results supported Pyxicephalidae as monophyletic and Pyxicephalidae was a sister clade of Petropedetidae and Ptychadenidae.
Conclusions
We successfully determined the complete mitogenome of Pyxicephalus adspersus. The length of the Pyxicephalus adspersus mitogenome (24,317 bp) was the largest size among all known anurans mitogenomes. We found two copies of the tRNAGlu-Cyt b-CR-tRNALeu-tRNAThr-tRNAPro-tRNAPhe-12S RNA-tRNAVal-16S RNA-tRNALeu gene clusters, two copies of COX3 genes, and the translocation of tRNAIle, tRNACys, tRNAAsp, tRNALys, tRNAArg, ND3, and ND5 genes from their typical positions. The Dimer-Mitogenome and TDRL models may be the most appropriate to explain the gene arrangements in Pyxicephalus adspersus. In this study, both BI and ML analyses supported the conclusion that Pyxicephalidae was monophyletic and Pyxicephalidae was the sister clade of (Petropedetidae + Ptychadenidae).