
Experimental study on the impact of Speed-Agility-Quickness Training method on the agility performance of collegiate sanda specialty students
- Published
- Accepted
- Received
- Academic Editor
- Yumeng Li
- Subject Areas
- Kinesiology, Sports Injury
- Keywords
- SAQ training method, Agility, Sanda (specialty students)
- Copyright
- © 2025 Si et al.
- Licence
- This is an open access article distributed under the terms of the Creative Commons Attribution License, which permits using, remixing, and building upon the work non-commercially, as long as it is properly attributed. For attribution, the original author(s), title, publication source (PeerJ) and either DOI or URL of the article must be cited.
- Cite this article
- 2025. Experimental study on the impact of Speed-Agility-Quickness Training method on the agility performance of collegiate sanda specialty students. PeerJ 13:e19406 https://doi.org/10.7717/peerj.19406
Abstract
Research objective
This study investigates the effects of Speed, Agility, and Quickness (SAQ) training on the agility of collegiate sanda athletes at Henan Normal University.
Research methods
The experimental group (EG) (n = 12, Age: 19.58 ± 1.165, height: 176.592 ± 3.181 cm, weight: 71.38 ± 15.84 kg, training years: 2.92 ± 0.793) was trained by the SAQ training method, and the control group (CG) (n = 12, Age: 19.92 ± 1.084, 177.308 ± 2.171 cm, 71.63 ± 16.80 kg, training years: 2.75 ± 0.754) was trained by traditional agility. The data of the CG group and the EG group were compared by repeated measures of analysis of variance (ANOVA) in different periods of the test indexes (pro agility run, Illinois agility run, compass pointer run, cross quadrant jump, 15s repeated ring jump, and punch-kick combination test) in the CG group and EG group.
Research results
Post-experiment, the EG group showed significant differences in all six agility test indicators after adopting SAQ training. There were no significant differences in the Pro Agility Test, the Compass Pointer Test, and the 15s Repeated Ring Jump after the CG group used traditional agility performance training (P > 0.05). There were significant differences in the Illinois agility test (effect size D = 0.626), the cross quadrant jump test (effect size D = 0.558), and the punch-kick combination test (effect size D = 0.519) in the CG group after the experiment (P < 0.001). Similarly, the EG group showed significant differences in the Illinois agility test (effect size D = 0.894), the cross quadrant jump test (effect size D = 0.852), and the punch-kick combination test (effect size D = 0.896).
Research conclusion
SAQ training significantly enhances the agility performance of collegiate sanda specialty students. The effects of improving agility performance through SAQ training are superior to those achieved with traditional agility training methods.
Introduction
Sanda originated in the 80s of the 20th century and is a local Chinese combat sport (Huang & Pan, 2008). Sanda is a kind of fighting in which two people use flexible and clever offensive and defensive methods such as wrestling, kicking, and striking in the ring, with the aim of defeating and subduing each other. Sanda’s moves are divided into five categories: actual combat posture, footwork, punching, leg fighting, wrestling, and defense (Jiang et al., 2022). Moreover, every category of techniques in sanda is closely related to the agility performance of the athletes themselves. Through research and analysis of sanda competitions, it has been observed that an athlete’s agility performance determines the flexibility of their techniques, the speed of evasion, and the swiftness of attacks, all of which play a decisive role in the outcome of a match. Agility, as a physical quality, refers to the ability to quickly, accurately, and coordinately change spatial position and movement direction in response to sudden changes in the surrounding environment, enabling athletes to adapt effectively during competition (Mai, 2000). This study aims to determine the impact of Speed, Agility, and Quickness (SAQ) training on the agility performance of sanda-specialized students. As mentioned by Alan Pearson in his book ≪ Physical Fitness Training for Soccer Players≫, the origins of SAQ training can be traced back to the 1980s, when it was first proposed by American the sports scientist and conditioning coach, Vern Gambetta. This training method was developed to enhance athletes’ speed, agility, and quickness, and has since been widely applied across various sports disciplines (Alan, 2004). Currently, SAQ training is a well-established method aimed at enhancing the agility of athletes in specific sports. Numerous scholars (Milanović et al., 2014a; Chandrakumar & Ramesh, 2015; Popayak & Prasertsung, 2024) have investigated the application of SAQ training across various sports disciplines, demonstrating its significant effectiveness in improving athletes’ reaction speed, agility, rapid force output, and explosive power. Research indicates that SAQ training can effectively enhance the phosphagen metabolic capacity of male athletes, develop their rapid strength, and improve glycolytic metabolic capacity, thereby boosting speed endurance (Zhao & Xu, 2009). However, there is a lack of research on the application of SAQ training to agility development in martial arts, particularly in sanda.
The SAQ training method, derived from the acronym of Speed, Agility, and Quickness, focuses on integrated training targeting these three attributes. By systematically developing these qualities, athletes can significantly enhance their agility. This approach represents a novel training philosophy in sports performance (Walankar & Shetty, 2020). The core elements of SAQ training include speed, agility and quick reflexes, which are closely aligned with the fast movement, agility and explosiveness that sanda athletes need in competition. For example, sanda players need to kick, hit, and fall in a short period of time, and quickly adjust their body posture to respond to their opponent’s attacks (Gao, 2010a). SAQ training can effectively improve athletes’ neuromuscular coordination and movement efficiency through systematic multi-directional movement, rapid change of direction and reaction training (Brown & Ferrigno, 2014). Although SAQ training has been widely used in ball games such as soccer and basketball (Trecroci et al., 2022; Moselhy, 2020), but its application in martial arts is also gradually being verified. For example, studies have shown that SAQ training can significantly improve the agility and reaction speed of taekwondo athletes (Akhmad, Nugraha & Sembiring, 2021). There are also scholars who have proved that it can improve the agility of youth martial arts (Fang & Xue, 2024). This is highly similar to the needs of sanda specialty. Sanda is a combat sport that demands quick reactions, agile movements, and explosive power, all of which align closely with the core principles of SAQ training. The agility of sanda athletes serves as a critical indicator of competitive performance. In most Chinese universities, traditional training methods are commonly employed to develop agility among sanda students. Based on the aforementioned research, the influence of SAQ training on various agility performance indicators was analyzed and determined, and all agility performance indicators in the study were repeatedly screened by experts and professors in combination with the special characteristics of sanda. Through two rounds of screening, six agility test indicators that meet the technical characteristics of sanda were selected: pro agility test, Illinois test run, compass pointer test, cross quadrant jump test, 15s repeated challenge arena jump, and fist leg combination cohesion test, aiming to explore the potential of SAQ training in enhancing agility. Therefore, this research holds significant practical application value.
Research hypothesis
SAQ training significantly improves the agility and agility performance of sanda specialty students, leading to better performance in agility-related tests compared to traditional training methods. Specifically, it is expected that SAQ training will enhance direction-changing ability, movement coordination, and the execution of technical skills in sanda athletes.
Materials and Methods
Participants
Because the experimental subjects were sanda special students, the sample size of the participants was limited, and in order to facilitate the sampling of the experimenters and avoid the influence of gender differences on the experimental results, all the participants were male. Participants were 18–22 years of age with more than two years of training experience and no injuries or physical aches.
Ethical statement
The study was approved by the Academic Committee of Henan Normal University and the Academic Committee of Henan Normal University Institute of Physical Educationon March 2, 2024 (HNSD-2024BS-0703).
Human participation research statement
Participants were recruited between March 5, 2024, and written and verbal consent was obtained from all participants, witnessed by the academic committee and the faculty supervisor.
Design and procedures
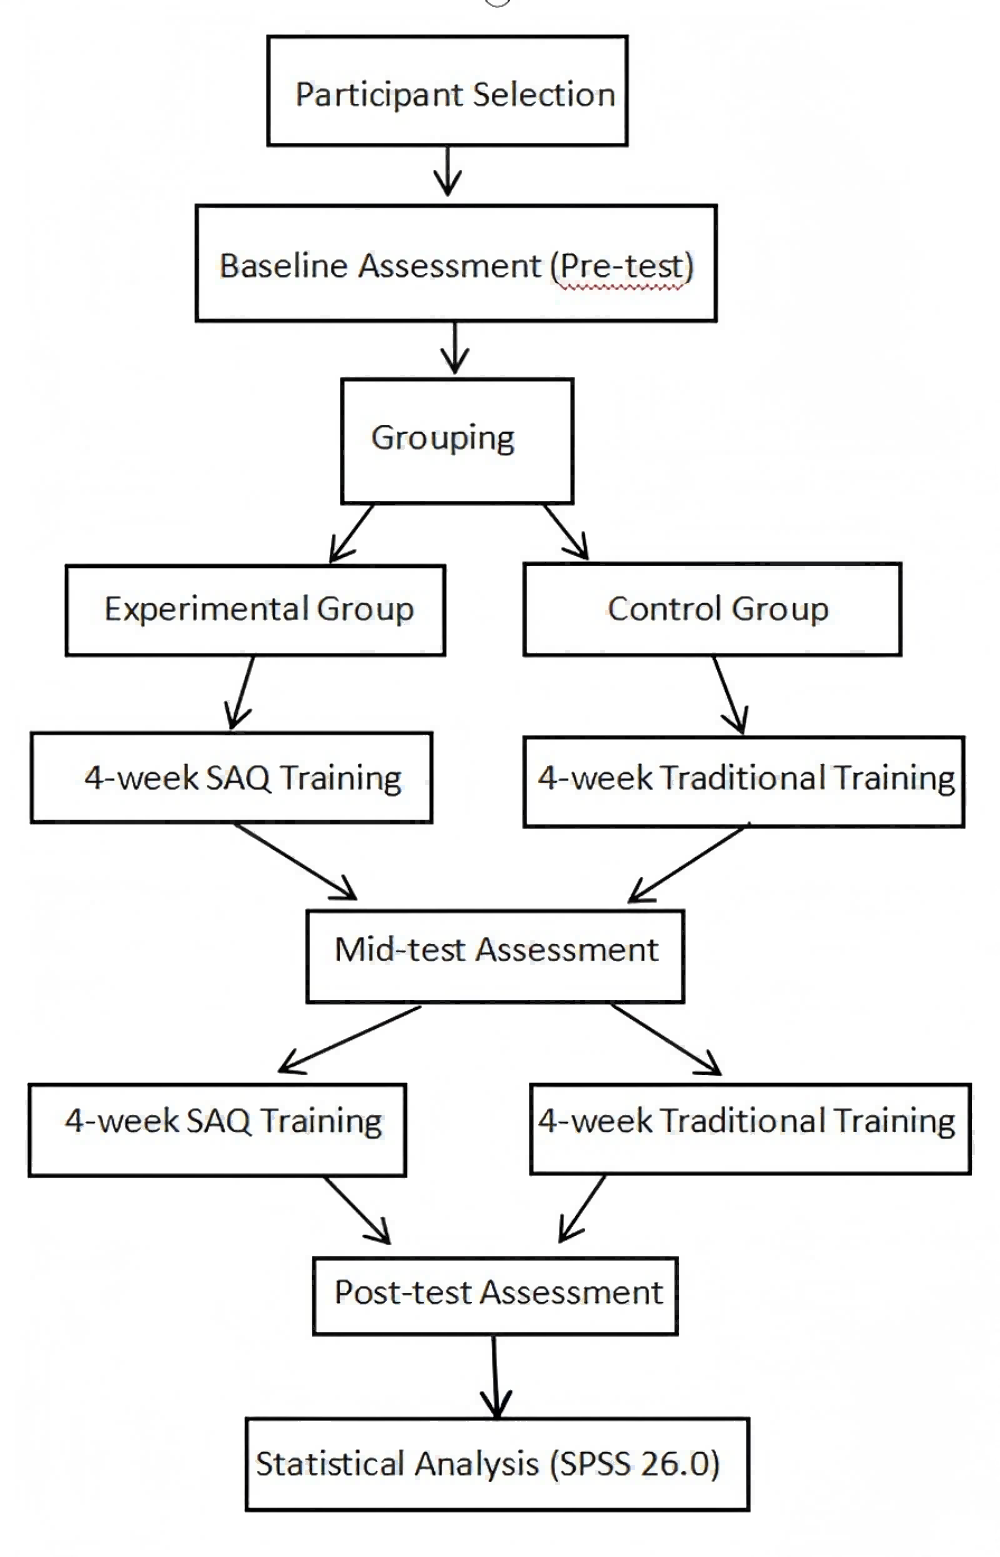
Students from Class 1 and Class 2 of the sanda specialization in the physical education program at Henan Normal University were selected as experimental subjects, with 12 students from each class chosen based on their physical conditions. Class 1 underwent SAQ training as the experimental group, while Class 2 continued with traditional training methods as the control group. The intervention period lasted 8 weeks. Both groups had the same weekly training frequency, load, duration, and coaching staff.
In the design of this study, the effects of various agility performance test indexes between the experimental group and the control group after 8 weeks were compared. The experimental test is divided into three different phases: pre-test, mid-test and post-test. The initial physical condition and key quality indicators of the control group and the experimental group were evaluated before the intervention. After four weeks of intervention, the interim test assessed these indicators again, and then the test measured the same indicators at the end of the experiment.
Experimental statement
The study was in accordance with the Declaration of Helsinki and the national guidelines and regulations. By reviewing the discussion on the process of standardizing experiments in similar research experiments (Jovanovic et al., 2011; Rogge et al., 2018), this paper illustrates the advantages of the experimental method used in this study for reproducible validation in the field, as well as standardized implementation guidelines for SAQ training in other literatures (Milanović et al., 2014b). The training cycle (8 weeks), frequency (3 times/week), and intensity control (heart rate 120–155 bpm) used in this study were in line with the regional consensus.
Experimental control
To uphold the scientific rigor and accuracy of the experiment, three key variables will be meticulously controlled: the amount of training load, the intensity of the training load, and the training schedule. Furthermore, consistency will be ensured by having the same executive coach oversee the entire experiment.
(1) Control of experimental subjects: a single-blind design was utilized to enhance the validity of the experiment. Participants were not informed about the specific objectives of the training and research beforehand. This strategy allowed the experimental group to participate in regular training sessions without any preconceived notions, thereby minimizing potential biases and maintaining the integrity of the experimental outcomes.
(2) Training load: training sessions were held three times weekly, with each sanda elective class lasting 90 min. The SAQ training intervention took place during the initial 30 min of each class, spanning a total of 8 weeks.
(3)Training load intensity: the SAQ training was structured to progressively increase in complexity and intensity. Each session comprised two sets of exercises, with two repetitions per set and a 60-second rest interval between sets. Heart rates were monitored via exercise bracelets to maintain them within the target range of 120 to 155 beats per minute. To ensure comparable load intensity, both experimental and control groups were assessed using a 10-second pulse count. Participants were advised to refrain from additional training outside the program and to maintain consistency in their basic training courses.
(4) Training schedule cycle: the experimental period was set from March to April 2024. Training occurred three times per week, with each 30-minute session conducted prior to the sanda elective classes over an 8-week period.
(5) Training content: the experimental group underwent SAQ agility training for 30 min before each class, whereas the control group participated in traditional agility training of the same duration. This approach ensured that both groups adhered to an identical overall training schedule but differed only in the type of agility training received.
Experimental scheme
After reviewing the literature and referring to the opinions and suggestions of professors, experts and coaches, the training programs of the control group and the experimental group were scientifically and comprehensively designed, and the SAQ training plan in line with the principles of sanda agility performance training was designed by combining the special characteristics of sanda. To ensure that the intensity of the training load is the same between the two groups during the training program, we consistently monitored the participants’ heart rate (HR). However, we did not document these records as they were not within the scope of the study. The following is a summary of the training plans of the two groups.
Control group training plan
The control group was divided into three phases: the first stage (1–3 weeks) included small strides, high leg raise reverse runs, sideways cross runs, sideways sprint steps, hip turn sprints, switchback runs, single-leg lunge jumps, small broken step sprints, dodge movements and burpee jump sprints. The second stage (4–6 weeks) continues and adds movements such as fast start-up runs, hip jumps, abdominal tuck jumps, push-up sprints, and fast irregular punches, which strengthen explosiveness and reaction speed. In the third phase (7–8 weeks), compound movements such as rope ladder training, elastic band lateral sliding step, squat wheel running, etc., combined with stand-up sprint and switchback running, comprehensively improved agility, coordination and endurance. The whole program is progressively trained, gradually increasing the intensity and complexity to ensure the training effect.
Training plan of experimental group
The SAQ training agility program in the experimental group was also divided into three stages, combining agility ladders, hurdle obstacles, agility circles and low pedals and other tools to comprehensively improve agility, coordination and reaction ability. The first stage (1–3 weeks) is based on basic movements, including opening and stepping jumps, side in and out, one-foot back hook jumps, step-in and out combined with dodge movements, prone translation, positive and side step jumps, etc., and gradually introducing agility circles and low-pedal training, such as single-lap single-leg front and back, low-pedal scissor jumps, etc., to enhance foot flexibility and body control. The second stage (4–6 weeks) strengthens dynamic movement and resistance training, such as rapid sliding steps, elastic band resistance exercises, “L-shaped running”, “S-shaped running”, etc., combined with rope ladder training and weight-bearing squats, to further improve explosive power and multi-directional movement ability. The third stage (7–8 weeks) focuses on comprehensive direction change and reaction training, including left and right rear forward jumps, turn jumps, cross comprehensive direction change runs, multi-directional jumps, etc., combined with hand and foot targets and agile reaction light exercises, simulating actual combat scenarios, and comprehensively improving agility and adaptability. The whole program is designed progressively, gradually increasing the difficulty and complexity to ensure the systematization and effectiveness of the training.
Test index selection and test method
By consulting all kinds of literature, most scholars have their own opinions on the agility performance test index. In terms of agility performance test index, there is almost no unified standard, this study is based on the combination of sanda special and expert professors to screen the following six sanda agility performance test indicators: pro agility test, Illinois test run, compass pointer test, cross quadrant jump test, 15s repeated challenge arena jump, fist leg combination cohesion test. These six test indicators correspond to the speed, agility and rapid response agility qualities in the sanda specialty, which better expresses whether the agility qualities of the students selected in the sanda class are significant.
Pro agility test
As shown in Fig. 1, at the beginning, the subjects were in a half-squat posture with their feet open at point A, and the fingertips on one side were required to touch the A-point line. After the ‘start’ password was issued, the subjects quickly started from point A to touch the side of the A-point line. If the right hand touched point A, it quickly ran to point C, and touched the C-point marker line, then quickly ran to point B and touched the B-point marker line, and then quickly rushed through point A; for example, when the left hand touches point A, it quickly runs to point B and touches the mark line of point B, then quickly runs to point C and touches the mark line of point C, and then quickly rushes through point A. Subjects are required to touch the marker line before they can continue to run down a point. Record results in stopwatch as a unit, take two decimals, a total of two rounds of testing, take the shortest time as the final result (Vescovi & Mcguigan, 2008) (Fig. 1).
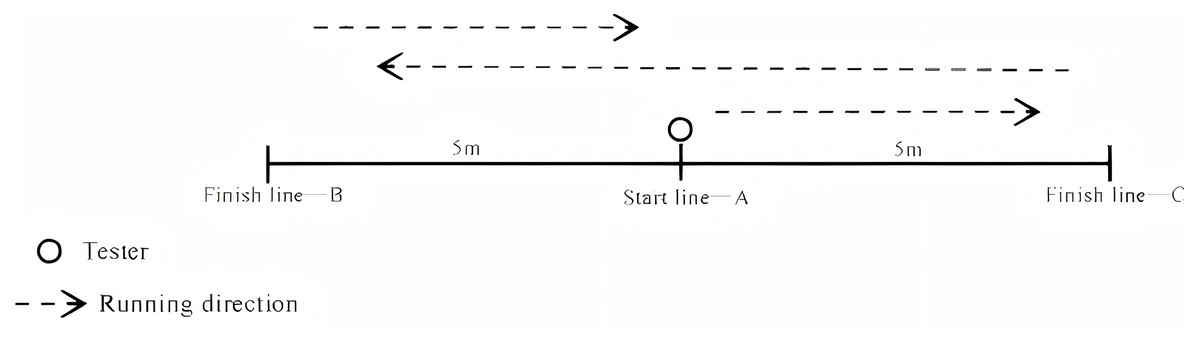
Figure 1: Pro agility test.
As shown in the figure, at the beginning, the subjects were in a half-squat posture with their feet open at point A, and the fingertips on one side were required to touch the A-point line. After the ‘start’ password was issued, the subjects quickly started from point A to touch the side of the A-point line. If the right hand touched point A, it quickly ran to point C, ran to point C and touched the C-point marker line, then quickly ran to point B and touched the B-point marker line, and then quickly rushed through point A; for example, when the left hand touches point A, it quickly runs to point B and touches the mark line of point B, then quickly runs to point C and touches the mark line of point C, and then quickly rushes through point A. Subjects are required to touch the marker line before they can continue to run down a point. Record results in stopwatch as a unit, take two decimals, a total of two rounds of testing, take the shortest time as the final result.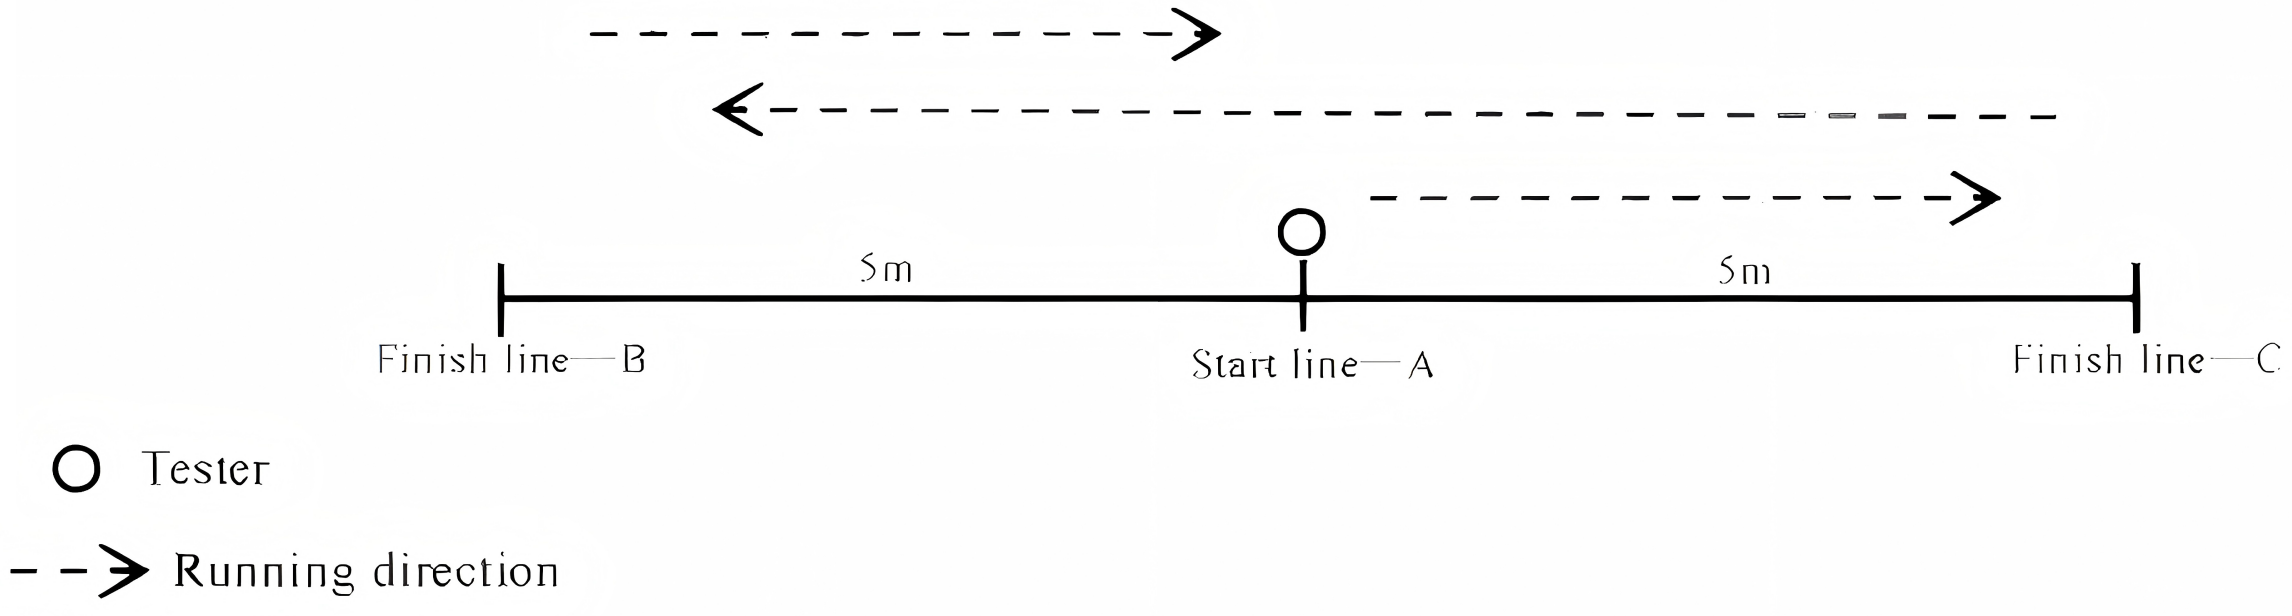
Illinois test run
As shown in Fig. 2, the following markers are displayed in the site of 10 m long and 5 m wide. Before the start, the subjects were at point A, preparing for the standing starting position. After the subjects heard the testers shouting the ‘start’ password, they were asked to start from point A, quickly run out of 10 m and reach point B. From the outside of point B, they quickly rushed to point C after circling the markers. Then, from the outside of point C, they quickly ran ‘8’ -shaped to point D and circled ‘8’ -shaped again to point C, and then quickly sprinted to point E. From the outside of point E to point F, it was the end. It is required that the markers should not be touched during running, and the markers should be bypassed from the outside and not crossed. Record results in stopwatch as a unit, take two decimals, a total of two rounds of testing, take the shortest time as the final result (Jarvis et al., 2009) (Fig. 2).
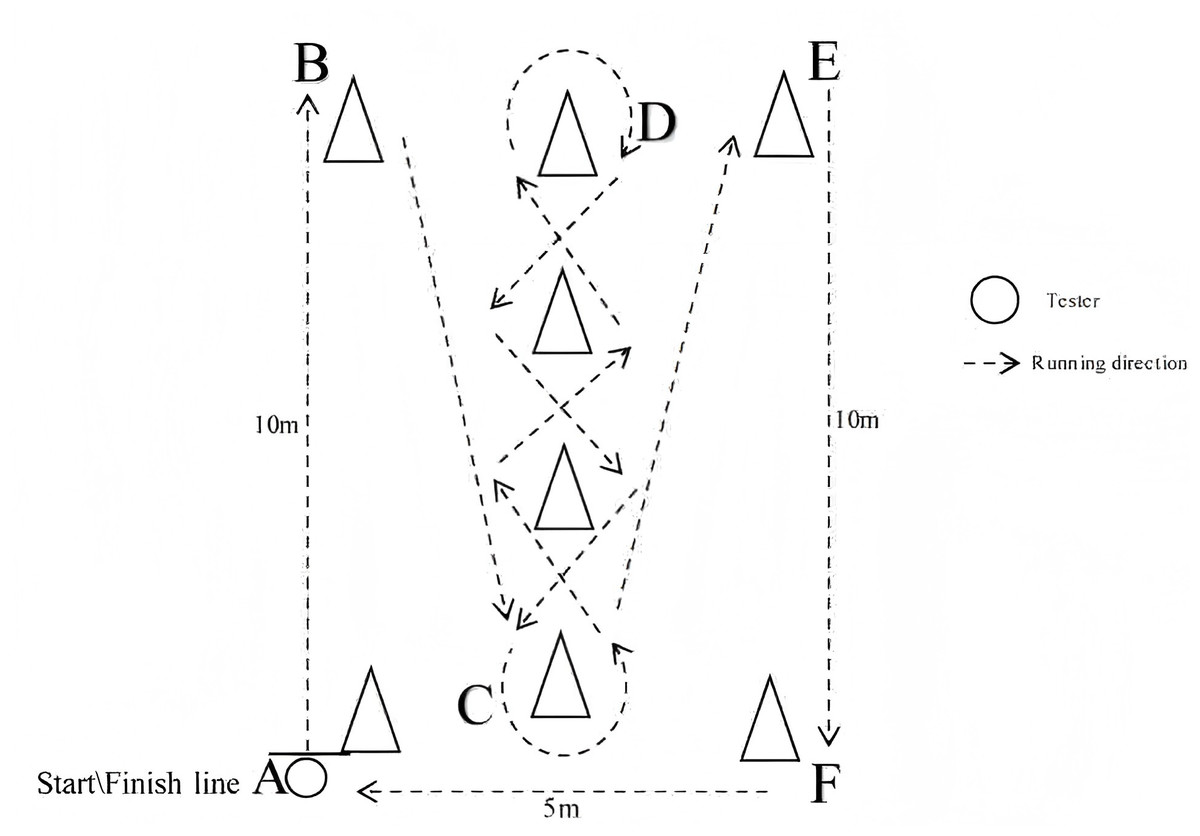
Figure 2: Illinois test run.
As shown in the figure, the following markers are displayed in the site of 10 meters long and 5 meters wide. Before the start, the subjects were at point A, preparing for the standing starting position. After the subjects heard the testers shouting the ‘start’ password, they were asked to start from point A, quickly run out of 10 meters and reach point B. From the outside of point B, they quickly rushed to point C after circling the markers. Then, from the outside of point C, they quickly ran ‘8’ -shaped to point D and circled ‘8’ -shaped again to point C, and then quickly sprinted to point E. From the outside of point E to point F, it was the end. It is required that the markers should not be touched during running, and the markers should be bypassed from the outside and not crossed. Record results in stopwatch as a unit, take two decimals, a total of two rounds of testing, take the shortest time as the final result.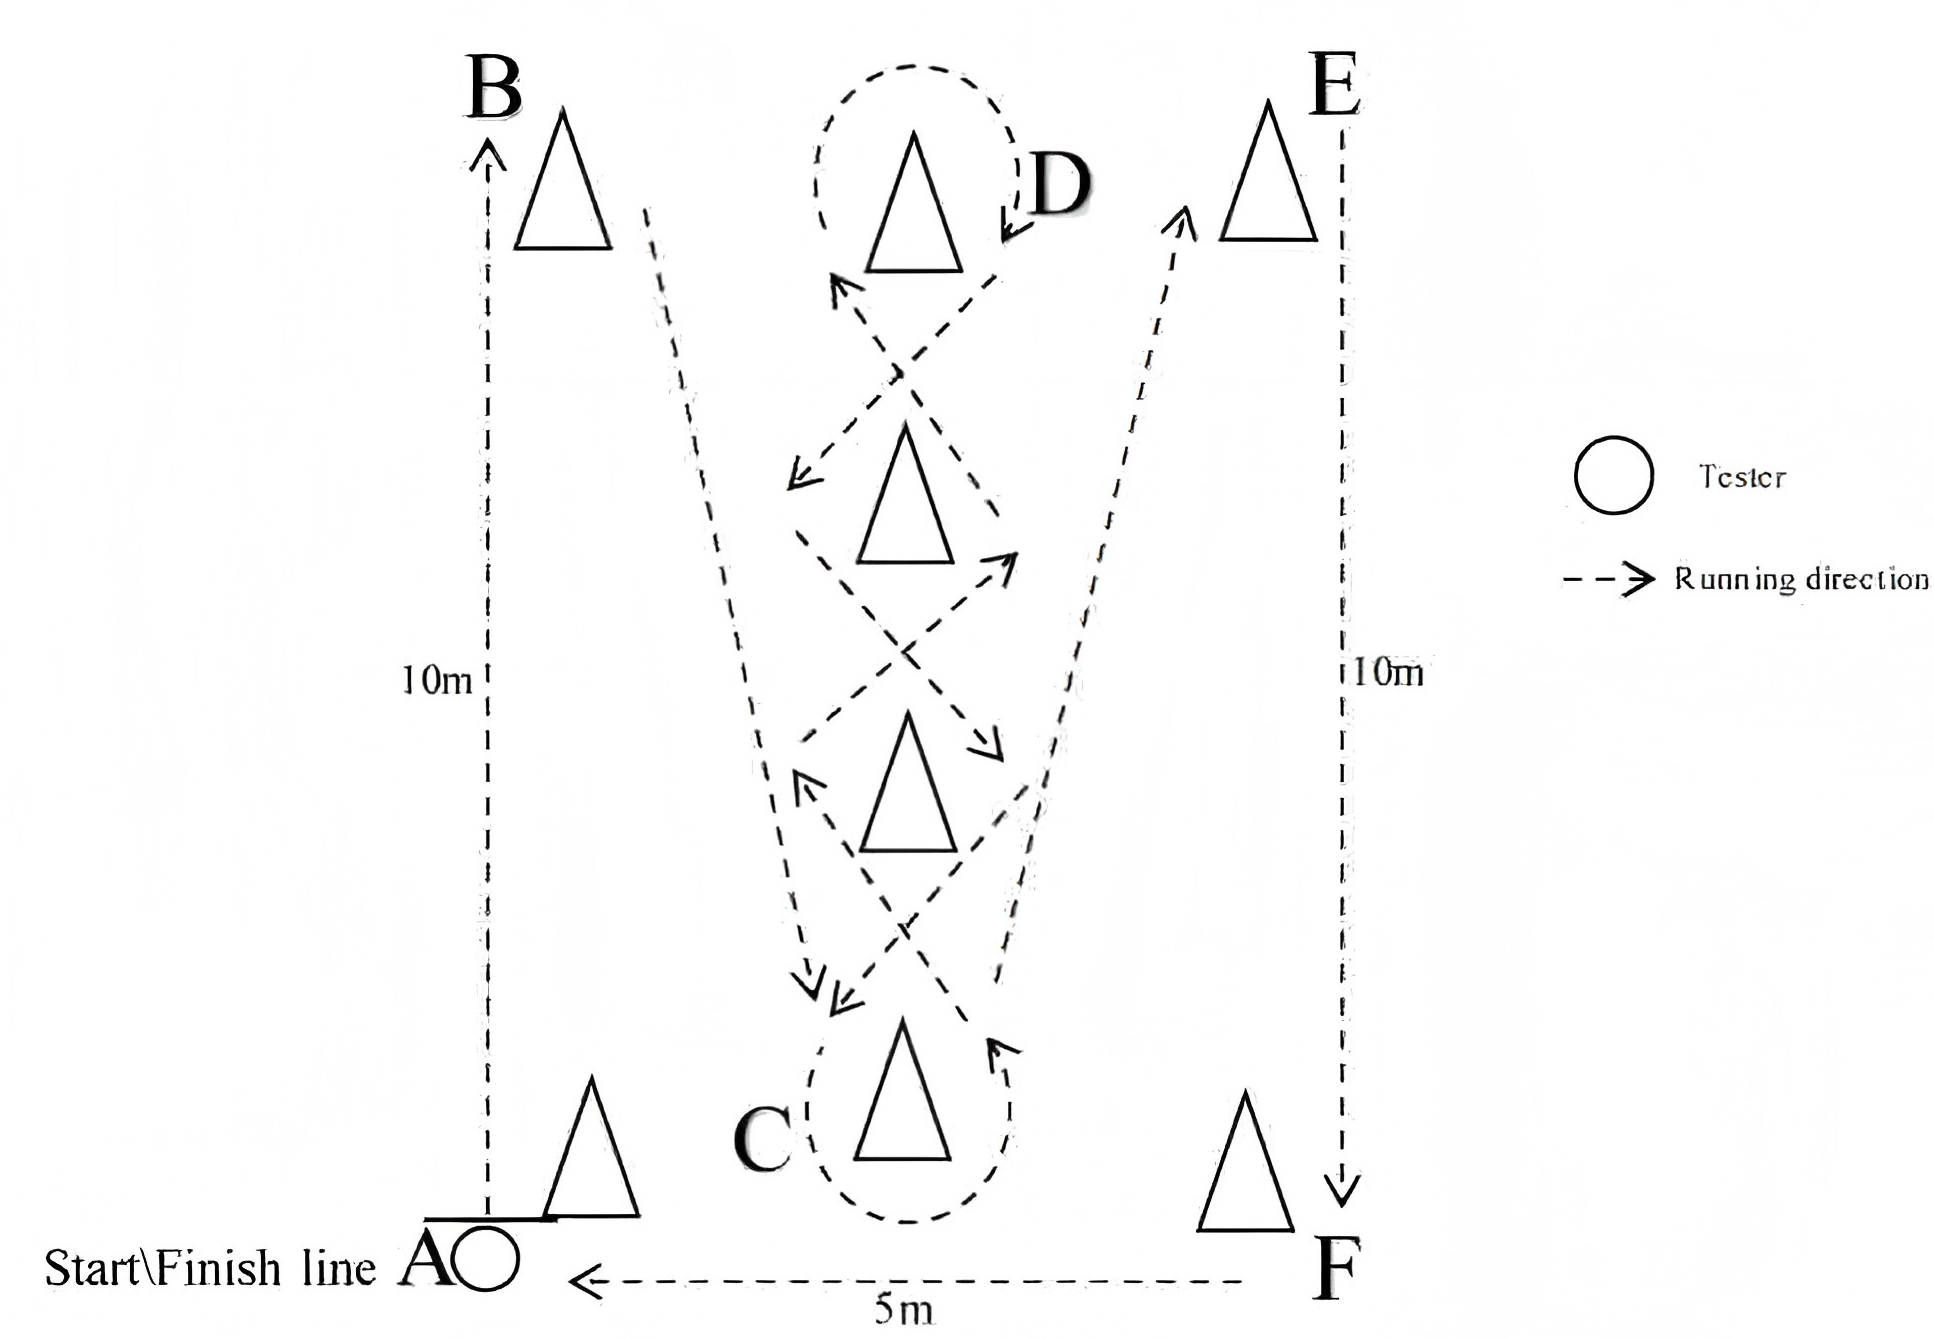
Compass pointer test
As shown in Fig. 3, the tester stands with both feet to ‘o’ (starting point). When hearing the monitor’s ‘start’ password, the tester needs to run to point A and touch the ground with all his strength, then return to the starting point and touch the ground, then quickly run to point B and touch the ground, then return to the starting point to touch the ground and quickly run to point C to touch the ground, and then return to the starting point to touch the ground and quickly rush to point D, and the timing ends. Record results in stopwatch as a unit, take two decimals, a total of two rounds of testing, take the shortest time as the final result (Xu, 2013) (Fig. 3).
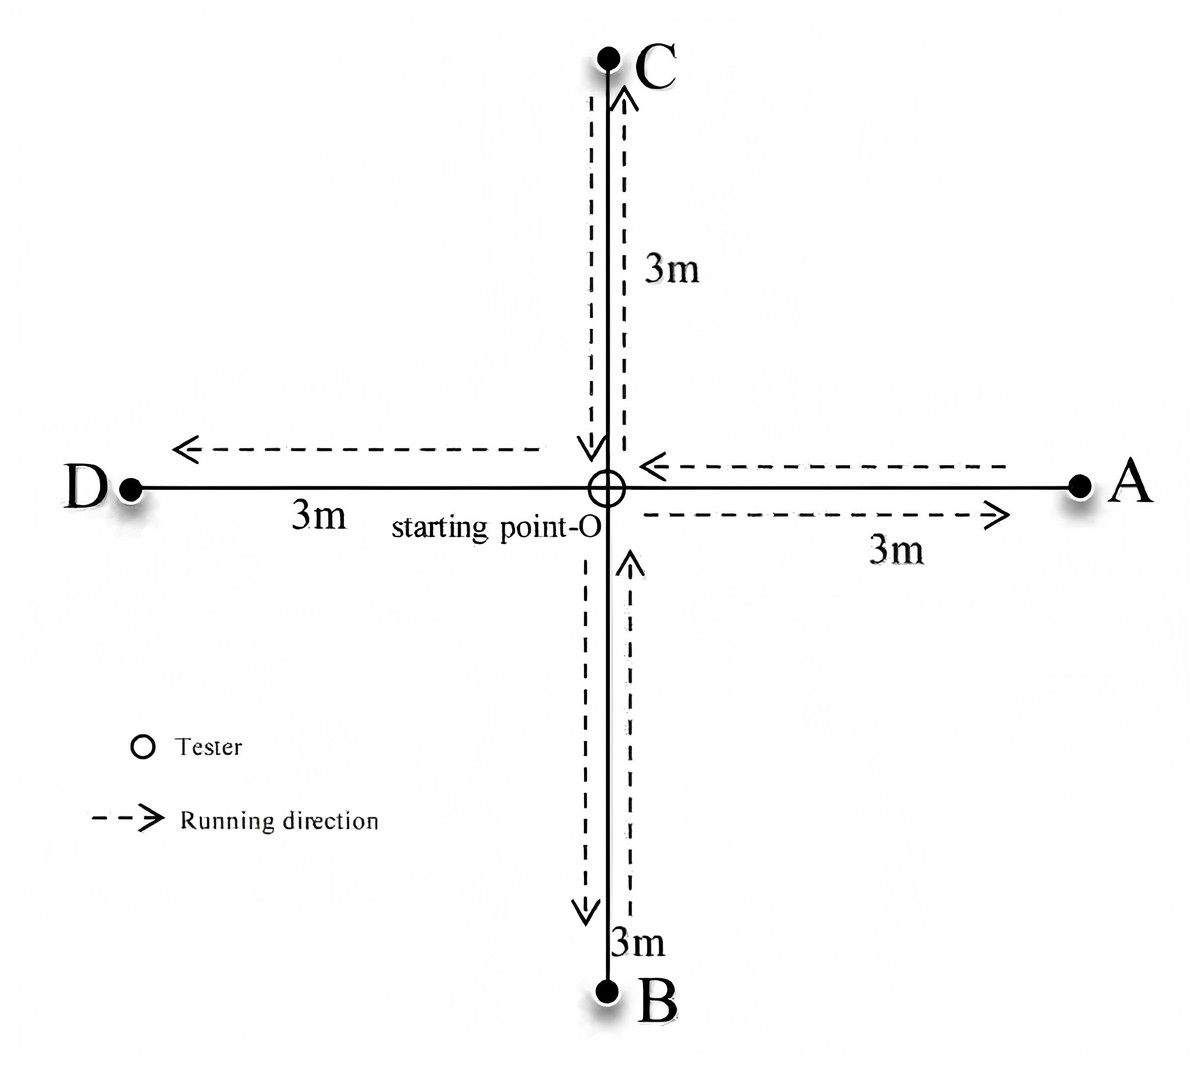
Figure 3: Compass pointer test.
As shown in the figure, the tester stands with both feet to ‘o’ (starting point). When hearing the monitor ‘s’ ‘start’ password, the tester needs to run to point A and touch the ground with all his strength, then return to the starting point and touch the ground, then quickly run to point B and touch the ground, then return to the starting point to touch the ground and quickly run to point C to touch the ground, and then return to the starting point to touch the ground and quickly rush to point D, and the timing ends. Record results in stopwatch as a unit, take two decimals, a total of two rounds of testing, take the shortest time as the final result.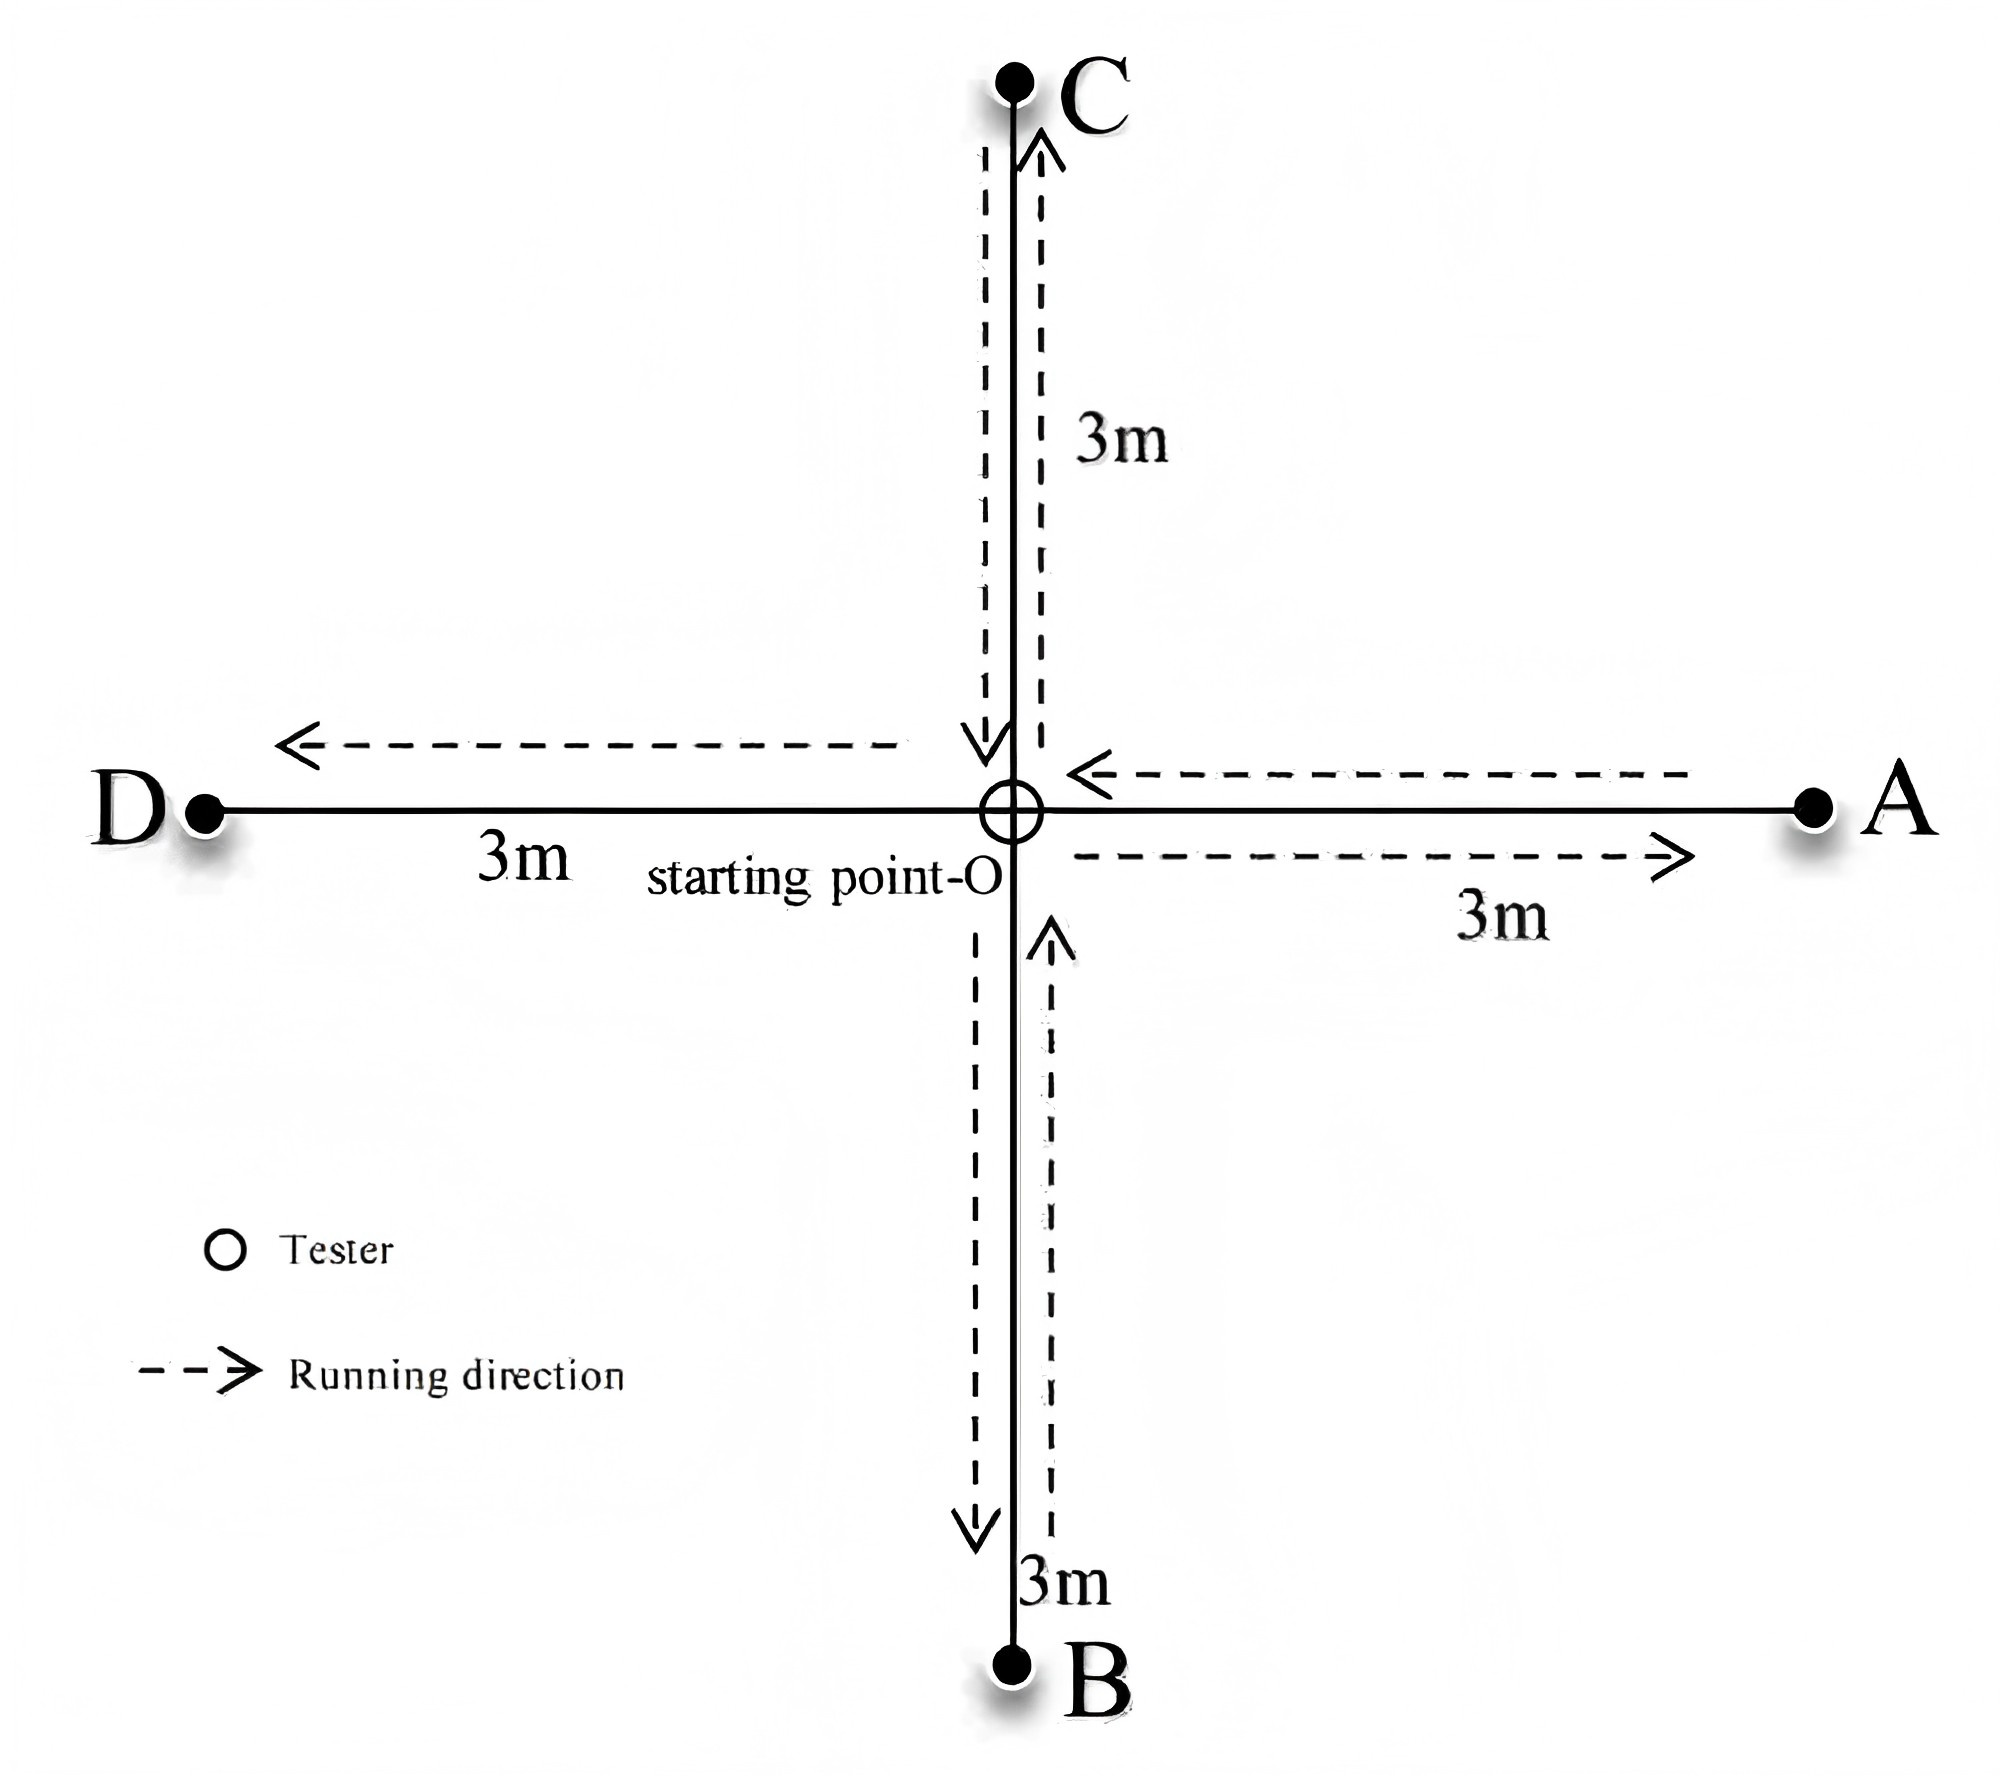
Cross quadrant jump test
As shown in Fig. 4, the square field with a length and width of one meter is divided into four quadrants on average. At the beginning, the subjects should be required to stand at A. After hearing the ‘start’ password, A-D-C-B-A is completed in the order of Fig. 4. This is the completion group. During the test, the subjects need to pay attention to the simultaneous take-off and landing of both feet. In the process, do not step on the line and stop the table for 15 times. The result record is in seconds. Take two decimal places, test twice, and take the best result (Liu, 2023) (Fig. 4).
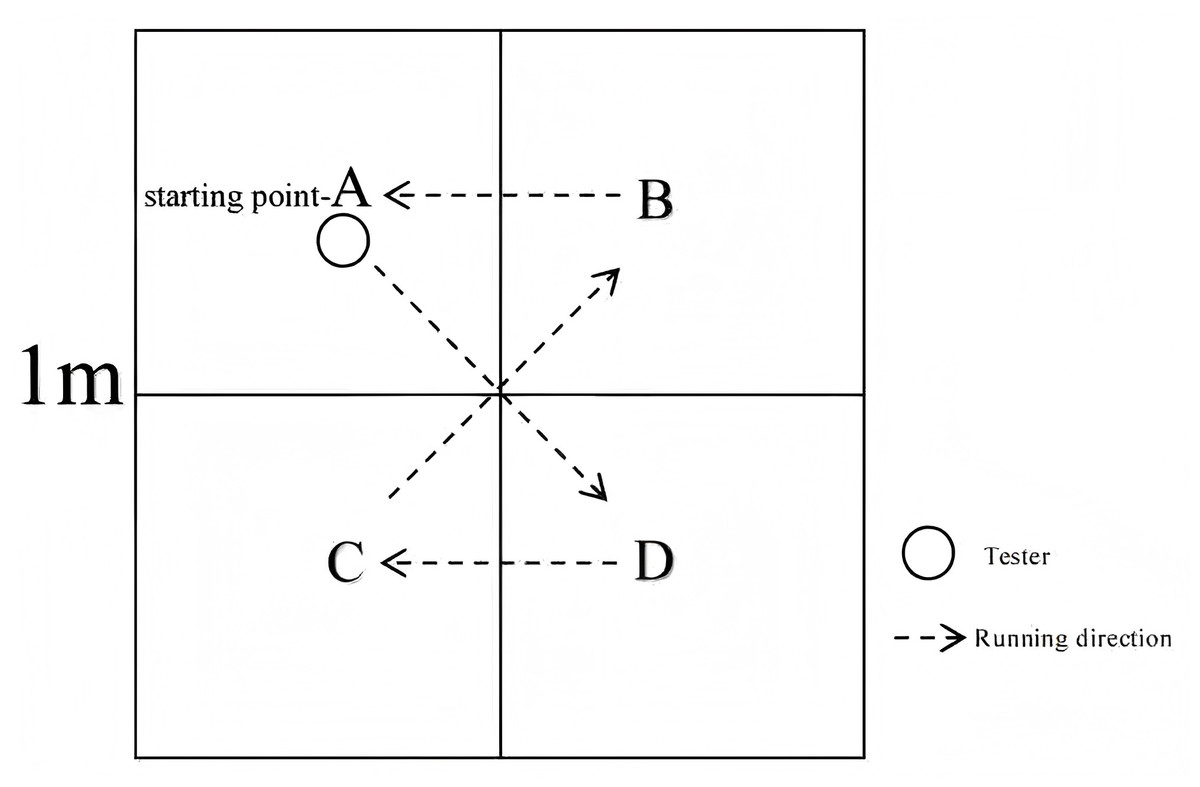
Figure 4: Cross quadrant jump test.
As shown in the figure, the square field with a length and width of one meter is divided into four quadrants on average. At the beginning, the subjects should be required to stand at A. After hearing the ‘start’ password, A-D-C-B-A is completed in the order of the figure. This is the completion group. During the test, the subjects need to pay attention to the simultaneous take-off and landing of both feet. In the process, do not step on the line and stop the table for 15 times. The result record is in seconds. Take two decimal places, test twice, and take the best result.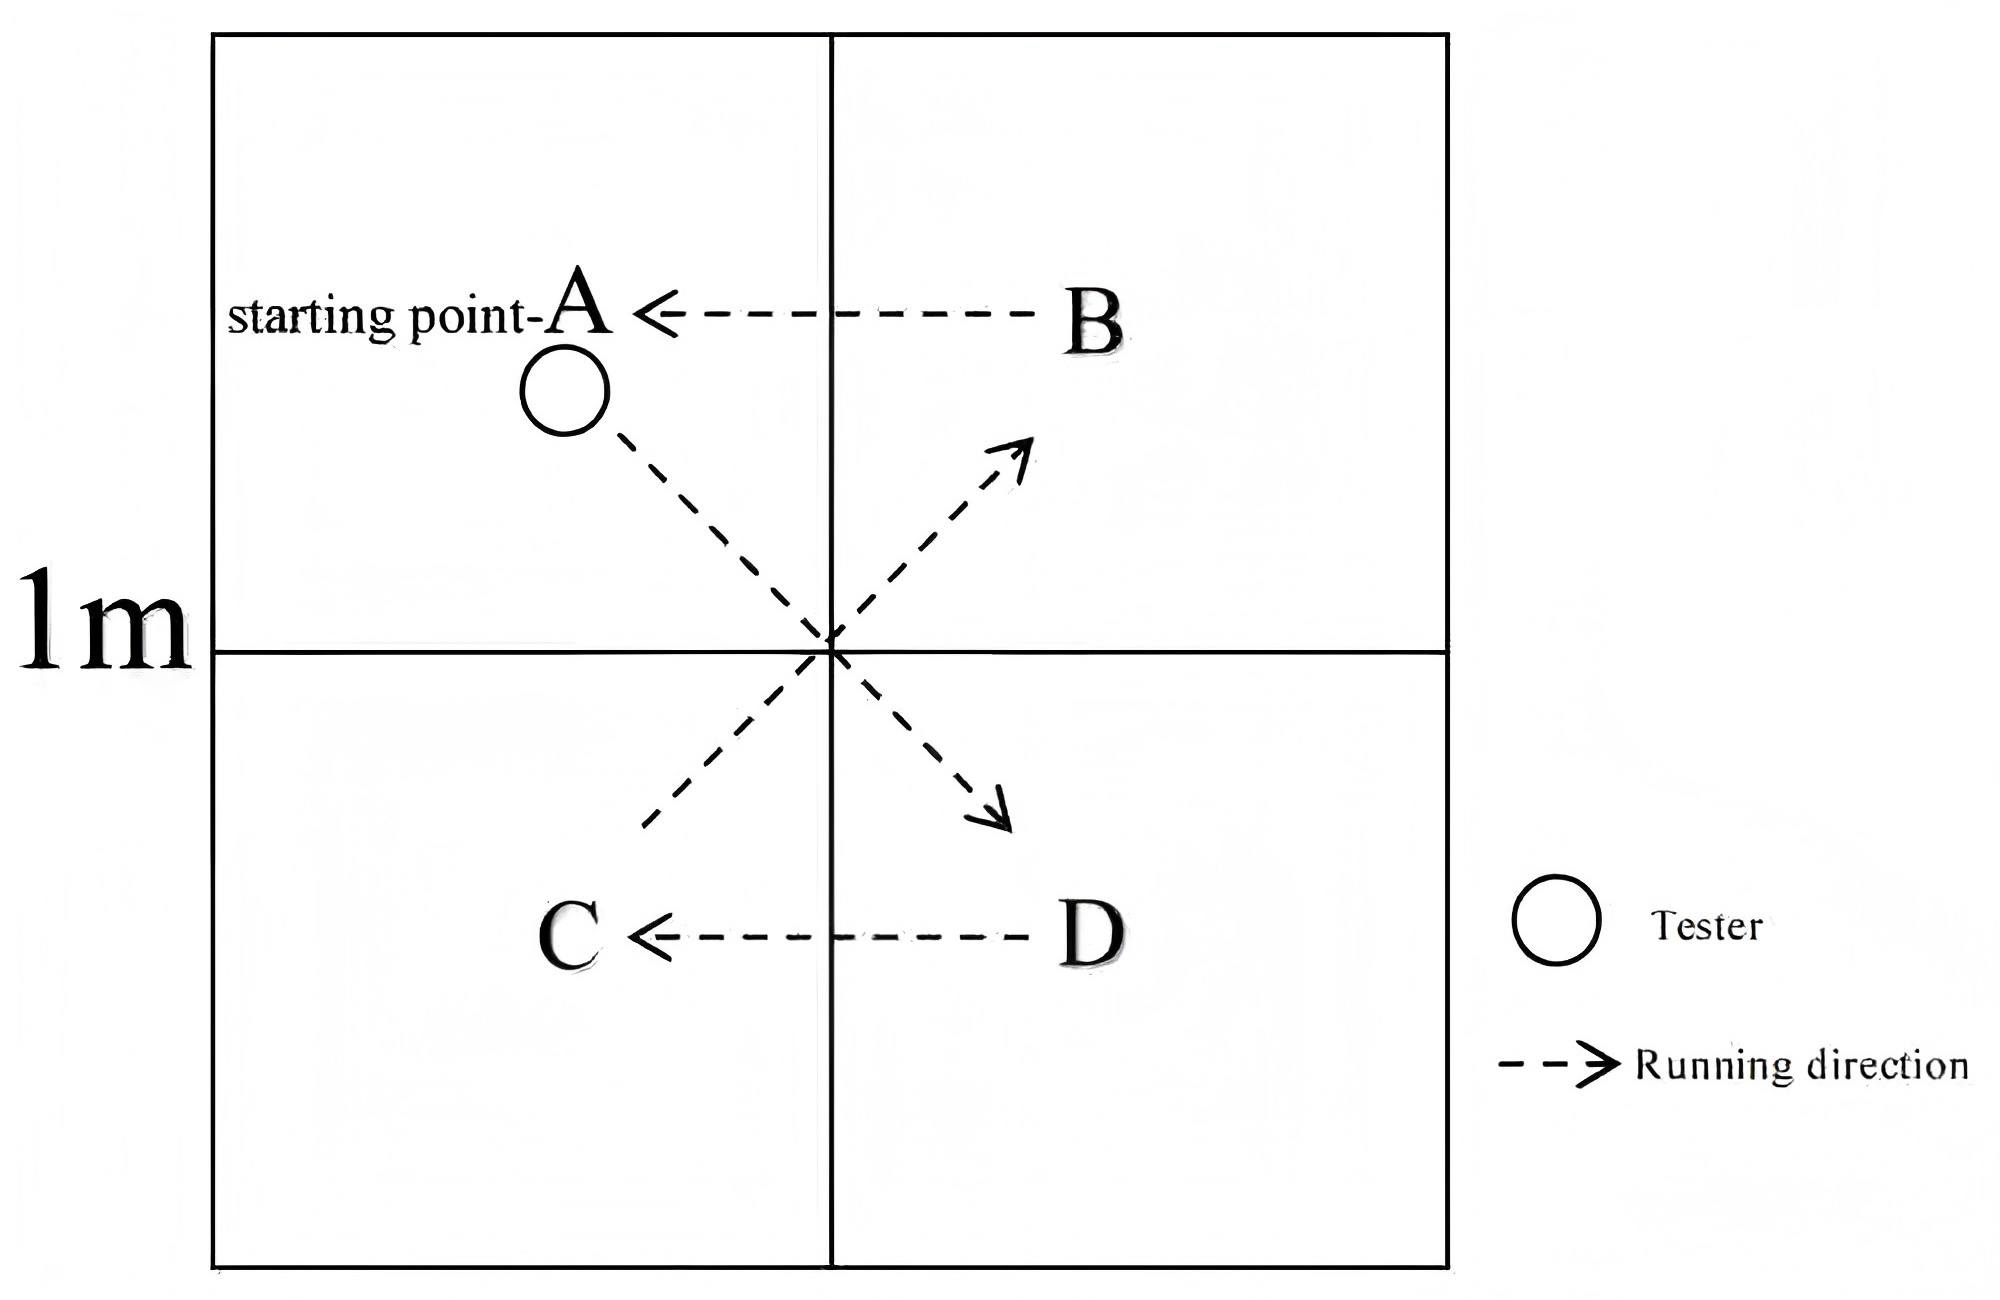
15s repeated challenge arena jump
First of all, the tester is required to stand on both feet to the front of the arena. When the tester hears the ‘start’ password, the monitor begins to count. The tester needs to jump to the arena quickly and then land quickly, and then repeat the action in turn. When the test time reaches 15s, the monitor stops counting. The effective number is the number of jumps to the arena in 15s (Gao, 2010b) .
Fist leg combination cohesion test
First of all, the testers are required to prepare for the combat posture, and the testers are required to do their best in the test process, so that no unnecessary actions can occur. The test action requires the testers to hit the standard suspended sandbags with the fastest speed within 8 s, and can not stop in the middle. The hitting action is in the order of front whip leg-back hand straight fist-front hand straight fist-back whip leg-front hand straight fist-back hand straight fist-front whip leg, and the hitting position of the whip leg is required to be above the waist and circulate in turn. The number of times of contact with sandbags in 8 s was recorded by the monitor as the effective number (Du, 2023).
Statistical analysis
In this study, SPSS 27.0 was used to analyze the basic information data of the control group and the experimental group (Table 1). Additionally, an independent t-test was used for pre-test comparisons between groups. A paired t-test was used for pre-post test comparisons within each group and the overall situation of the data obtained by the agility performance test indexes of the experimental subjects was descriptively statistically analyzed, and the results of various agility performance test indicators for the experimental group and the control group before and after the experiment were analyzed using multivariate repeated measures analysis of variance (ANOVA), and the interaction was analyzed by simple effect analysis, and the significance level of the test was set to α = 0.05 and was reported as an indicator of effect size, and use small (0.01), moderate (0.06), and large (0.14) as reference values for effect sizes.
Results
Baseline assessment of agility performance of the experimental group and the control group before the experiment
By analyzing the data of general agility and special agility of the control group and the experimental group, the independent sample t-test was used to analyze the data after confirming that the data belonged to normal distribution. The P values of each agility test index score were >0.05. Therefore, the agility test indexes of the experimental group and the control group passed the baseline evaluation and had no significant difference. The experimental group and the control group can be compared in Tables 2 and 3.
| Basic information options | Control group (n = 12) | Experimental group (n = 12) | T value | P value |
|---|---|---|---|---|
| Age | 19.92 ± 1.084 | 19.58 ± 1.165 | −0.726 | 0.627 |
| height (cm) | 177.308 ± 2.171 | 176.592 ± 3.181 | 0.645 | 0.526 |
| weight (kg) | 71.630 ± 16.800 | 71.380 ± 15.840 | −1.532 | 0.140 |
| Training experience (years) | 2.75 ± 0.754 | 2.92 ± 0.793 | 0.528 | 0.937 |
| Test indicators | Control group (n = 12) | Experimental group (n = 12) | T value | P value |
|---|---|---|---|---|
| Pro agility test(s) | 7.354 ± 0.328 | 7.264 ± 0.282 | 0.720 | 0.479 |
| Illinois sensitivity test(s) | 22.463 ± 1.093 | 22.291 ± 1.780 | 0.389 | 0.701 |
| Compass pointer test(s) | 8.162 ± 0.270 | 7.914 ± 0.570 | 1.360 | 0.188 |
| Cross quadrant jump test(s) | 18.484 ± 0.613 | 18.551 ± 0.790 | −0.231 | 0.819 |
| 15s repeated challenge arena jump(pcs) | 10.000 ± 1.044 | 9.750 ± 0.965 | 0.609 | 0.549 |
| Test indicators | Control group (n = 12) | Experimental group (n = 12) | T value | P value |
|---|---|---|---|---|
| Fist leg combination cohesion test(pcs) | 10.050 ± 1.314 | 10.42 ± 1.176 | 0.340 | 0.737 |
Analysis of the results of agility test before, during and after the test in the experimental group and the control group
The agility test data of the experimental group and the control group in the pre-test, the mid-test (the fourth week) and the post test (the eighth week) were statistically analyzed by repeated measurement analysis of variance. The results showed that SAQ training and traditional agility training had significant effects on improving the agility of sanda students in colleges and universities, but the effects were also different. This paper divides the research results and analysis into three categories: (1) analysis of the influence of SAQ training on the ability to change direction; (2) analysis of the influence of SAQ training on the ability of changing movement; (3) analysis of the influence of SAQ training on technical ability.
Analysis of the influence of saq training on the direction changing ability of college sanda students
(1) Experimental group and control group pro agility performance test results repeated measurement variance statistical analysis.
Through the pro agility performance test, the agility performance test was carried out on the college sanda students at the baseline, the fourth week and the eighth week. It was found that the main effect of the experimental group and the control group was significant F(1,22) = 87.928, p < 0.001, . The main effect of the group was significant F(1,22) = 22.114, p < 0.001 . The interaction between time and group was significant F(1,22)=34.488, p < 0.01 . Further simple effect analysis showed that the baseline, the fourth week, and the eighth week of the pro agility test group in the experimental group and the control group also decreased in turn, but the effect size in the experimental group was greater than that in the control group. In addition, there was no significant difference between the experimental group and the control group in the baseline test (P > 0.05). In the fourth week, the experimental group showed a significant improvement compared to the control group (P < 0.05), and in the eighth week test, the experimental group showed an extremely significant improvement compared to the control group (P < 0.001) (Table 4).
| Group | Test time | Intra Group F value | Intra Group P value | |||
|---|---|---|---|---|---|---|
| Baseline | The fourth week | The eighth week | ||||
| Control group | 7.354 ± 0.328s | 7.179 ± 2.253s | 7.065 ± 0.213s | 7.024 | 0.063 | 0.401*** |
| Experimental group | 7.264 ± 0.282s | 6.960 ± 0.166s | 6.006 ± 0.478s | 57.077 | 0.000 | 0.845*** |
| Intergroup F value | 0.519 | 6.311 | 49.187 | |||
| Intergroup P value | 0.479 | 0.020 | 0.000 | |||
| 0.023* | 0.223*** | 0.691*** | ||||
(2) Statistical analysis of repeated measurement variance of Illinois test results in the experimental group and the control group.
Through the agility performance test of Illinois to test the agility performance of college sanda students at the baseline, the fourth and the eighth weeks, it was found that the main effect of time between the experimental group and the control group was significant F(1,22) = 158.210, p < 0.001, ; the main effect of the group was significant F(1,22) = 24.108, p < 0.001, ; the interaction between time and group was significant F(1,22) = 16.859, p < 0.001, . Further simple effect analysis showed that the experimental group and the control group also decreased at the baseline, at week 4 and at week 8, but the effect size in the experimental group was greater than that in the control group. In addition, there was no significant difference between the experimental group and the control group in the baseline test (P > 0.05), in the fourth week test, the experimental group showed an extremely significant improvement compared to the control group (P < 0.001), and in the eighth week test, the experimental group still showed an extremely significant improvement compared to the control group (P < 0.001) (Table 5).
| Group | Test time | Intra group F value | Intra Group P value | |||
|---|---|---|---|---|---|---|
| Baseline | The fourth week | the eighth week | ||||
| Control group | 22.463 ± 1.093s | 21.508 ± 1.182s | 20.075 ± 0.975s | 17.573 | 0.000 | 0.626*** |
| Experimental group | 22.291 ± 1.780s | 19.201 ± 1.138s | 17.587 ± 1.020s | 88.961 | 0.000 | 0.894*** |
| Intergroup F value | 0.151 | 23.719 | 37.265 | |||
| IntergroupP value | 0.701 | 0.000 | 0.000 | |||
| 0.007 | 0.519*** | 0.629*** | ||||
Notes:
intra-group = within the same group, and inter-group = between different groups.
(3) The experimental group and the control group compass pointer test results repeated measurement variance statistical analysis.
Through the compass pointer test, the agility performance test was carried out on the college sanda students at the baseline, the fourth and the eighth weeks. It was found that the main effect of the experimental group and the control group was significant F(1,22) = 128.278, p < 0.001, ; the main effect of the group was significant F(1,22) = 36.271, p < 0.001, ; the interaction between time and group was significant F(1,22) = 72.604, p < 0.001, . Further simple effect analysis showed that the compass pointer test group in the experimental group and the control group also decreased at baseline, week 4 and week 8, but there was an extremely significant difference in the experimental group (P < 0.001), and there was no significant difference in the control group (P > 0.05). There was no significant difference between the experimental group and the control group in the baseline test (P > 0.05), in the fourth week test the experimental group showed an extremely significant improvement compared to the control group (P < 0.001), and in the eighth week test, the experimental group still showed an extremely significant improvement compared to the control group (P < 0.001) (Table 6).
| Group | Test time | Intra group F value | Intra group P value | |||
|---|---|---|---|---|---|---|
| Baseline | The fourth week | The eighth week | ||||
| Control group | 8.162 ± 0.270s | 8.042 ± 0.570s | 7.962 ± 0.284s | 1.882 | 0.177 | 0.152*** |
| Experimental group | 7.914 ± 0.570s | 7.163 ± 0.535s | 6.499 ± 0.336s | 94.151 | 0.000 | 0.900*** |
| Intergroup F value | 1.850 | 24.943 | 132.499 | |||
| Intergroup P value | 0.188 | 0.000 | 0.000 | |||
| 0.078** | 0.531*** | 0.858*** | ||||
Analysis of the influence of saq training on the ability of changing movements of sanda students in colleges and universities
(1) Experimental group and control group cross quadrant jump agility performance test results repeated measurement variance statistical analysis.
Through the agility performance test of cross quadrant jump, the agility performance test of college sanda students was carried out at the baseline, the fourth week and the eighth week. It was found that the main effect of time between the experimental group and the control group was significant F(1,22) = 115.014, p < 0.001, ; the main effect of the group was significant F(1,22) = 8.307, p < 0.01, ; the interaction between time and group was significant F(1,22) = 12.543, p < 0.01, . Further simple effect analysis showed that the results of the experimental group and the control group were also reduced at the baseline, at week 4 and at week 8, but the effect size in the experimental group was greater than that in the control group. There was no significant difference between the experimental group and the control group in the baseline test (P > 0.05), in the fourth week test, the experimental group showed a significant improvement compared to the control group (P < 0.05), and in the eighth week test, the experimental group showed an extremely significant improvement compared to the control group (P < 0.001) (Table 7).
| group | Test time | Intra Group F value | Intra Group P value | |||
|---|---|---|---|---|---|---|
| Baseline | The fourth week | The eighth week | ||||
| Control group | 18.484 ± 0.613pcs | 17.993 ± 0.609pcs | 17.280 ± 0.507pcs | 13.282 | 0.000 | 0.558*** |
| Experimental group | 18.551 ± 0.790pcs | 17.331 ± 0.601pcs | 16.159 ± 0.597pcs | 60.328 | 0.000 | 0.852*** |
| Intergroup F value | 0.053 | 7.172 | 24.517 | |||
| Intergroup P value | 0.819 | 0.014 | 0.000 | |||
| 0.002 | 0.246*** | 0.527*** | ||||
Notes:
intra-group = within the same group, and inter-group = between different groups.
Analysis of the influence of saq training on the ability of college sanda students to complete the action
(1) The experimental group and the control group 15s repeated challenge arena jump test results repeated measurement variance statistical analysis.
Through the 15s Repeated Challenge Arena Jump test, the agility performance test of college sanda students at baseline, fourth week and eighth week was carried out. It was found that the main effect of time between the experimental group and the control group was significant F(1,22) = 69.486, p < 0.001, ; the main effect of the group was significant F(1,22) = 19.209, p < 0.001, ; the interaction between time and group was significant F(1,22) = 31.438, p < 0.001, . Further simple effect analysis showed that the number of completions at baseline, week 4 and week 8 in the experimental group and the control group for 15s Repeated Challenge Arena Jump also increased sequentially, but there was a significant difference in the experimental group (P < 0.001), and there was no significant difference in the control group (P > 0.05). There was no significant difference between the experimental group and the control group in the baseline test (P > 0.05), in the fourth week test, the experimental group showed a significant improvement compared to the control group (P > 0.05), and in the eighth week test,the experimental group showed an extremely significant improvement compared to the control group (P < 0.001) (Table 8).
| Group | Test time | Intra Group F value | Intra Group P value | |||
|---|---|---|---|---|---|---|
| Baseline | The fourth week | The eighth week | ||||
| Control group | 10.00 ± 1.044pcs | 10.420 ± 0.900pcs | 10.750 ± 0.622pcs | 1.922 | 0.171 | 0.155*** |
| Experimental group | 9.750 ± 0.965pcs | 11.080 ± 0.793pcs | 13.580 ± 0.084pcs | 46.462 | 0.000 | 0.816*** |
| Intergroup F value | 0.371 | 3.705 | 61.728 | |||
| Intergroup P value | 0.549 | 0.067 | 0.000 | |||
| 0.017* | 0.144*** | 0.737*** | ||||
(2) The experimental group and the control group fist leg combination cohesion test results repeated measurement variance statistical analysis.
Through the fist leg combination cohesion test, the agility performance test was carried out on the college sanda students at the baseline, the fourth week and the eighth week. It was found that the main effect of the experimental group and the control group was significant F (1,22) = 69.486, p < 0.001, ; the main effect of the group was significant F(1,22) = 19.209, p < 0.001, ; the interaction between time and group was significant F(1,22) = 31.438, p < 0.001, . Further simple effect analysis showed that the number of hits in the baseline, the fourth week and the eighth week of boxing leg combination cohesion test group in the experimental group and the control group also increased in turn, and there were extremely significant differences between the experimental group and the control group, but the effect size of the experimental group was greater than that of the control group. There was no significant difference between the experimental group and the control group in the baseline test (P > 0.05), there was no significant difference between the experimental group and the control group in the fourth week test (P > 0.05), and there was an extremely significant difference between the experimental group and the control group in the eighth week test (P < 0.001) (Table 9).
| Group | Test time | Intra Group F value | Intra Group P value | |||
|---|---|---|---|---|---|---|
| Baseline | The fourth week | The eighth week | ||||
| Control group | 10.050 ± 1.314pcs | 11.500 ± 0.905pcs | 11.830 ± 0.718pcs | 11.309 | 0.000 | 0.519*** |
| Experimental group | 10.420 ± 1.176pcs | 12.170 ± 0.835pcs | 14.750 ± 0.965pcs | 90.193 | 0.000 | 0.896*** |
| Intergroup F value | 0.116 | 3.520 | 70.550 | |||
| Intergroup P value | 0.737 | 0.074 | 0.000 | |||
| 0.005 | 0.138** | 0.762*** | ||||
In summary, SAQ training significantly enhances overall agility performance
The experimental group showed significant improvements in all six agility test indicators (pro agility test, Illinois agility test, compass pointer test, cross quadrant jump test, 15s repeated challenge arena jump, and fist leg combination cohesion test) (P < 0.001). Notably, the Illinois agility test (ηp2 = 0.894), cross quadrant jump (ηp2 = 0.852), and punch-kick combination test (ηp2 = 0.896) exhibited particularly remarkable improvements. The experimental group outperformed the control group in direction-changing ability (e.g., pro agility test) and movement coordination (e.g., cross quadrant jump test) (P < 0.001), with significant improvements in the center of gravity control, starting speed, and lower limb explosive power.
The control group showed significant improvements in only three tests (Illinois agility test, cross quadrant jump test, and fist leg combination cohesion test) (P < 0.05), with smaller effect sizes (ηp2 = 0.519–0.626) compared to the experimental group, indicating that SAQ training offers a more systematic advantage in improving agility performance.
Discussion
In this study, the effect of SAQ training on the agility quality of college sanda students was systematically evaluated through an 8-week SAQ training intervention experiment. The main findings are as follows: SAQ training showed significant advantages in improving the agility of sanda students. The experimental group showed significant improvement in six agility test indicators (pro agility test, Illinois agility test, compass pointer test, cross quadrant jump test, 15-second repetitive ring jump test, and fist-kick combination articulation test) (P < 0.001), especially in the ability to change direction, motor coordination and technical execution, and the improvement rate in the experimental group was significantly higher than that in the control group. In contrast, the control group showed significant improvement only on the Illinois agility test, cross quadrant jump test, and the fist and leg combination articulation test (P < 0.05) with a small effect size (ηp2 = 0.519–0.626). This shows that SAQ training has a systemic advantage in improving the agility of sanda students, especially in terms of fast movement, reaction speed and hip flexibility.
SAQ training can significantly improve the neuromuscular adaptability of athletes through high-intensity multi-directional movement, rapid reaction and explosive training (Polman, Bloomfield & Edwards, 2009). Specifically, the agility ladder, obstacle jump, and low-pedal training used in SAQ training in this study can effectively activate the athletes’ fast-twitch fibers and enhance the explosive power and reaction speed of the lower limbs. Studies have shown that SAQ training can enhance athletes’ ability to control rapid changes of direction and complex movements by improving neuromuscular coordination (Jang et al., 2023; Tong, Liang & Tongdecharoen, 2024). In addition, the multi-directional movement and rapid reaction training in SAQ training can improve the cognitive ability of athletes, especially in the face of unexpected situations, decision-making speed and action execution efficiency (Milanović et al., 2014a). SAQ training not only enhances agility through physiological mechanisms, but also enhances athletes’ performance through improvements in psychological factors such as reaction speed and concentration. The rapid reaction training in SAQ training and the practice of simulating actual combat scenarios can effectively improve the athlete’s prediction ability and reaction speed (Park, 2010; Milanović et al., 2013). Studies have shown that SAQ training can significantly improve the cognitive flexibility of athletes, especially in the decision-making speed and action execution efficiency when faced with complex motor tasks (Lee, Lee & Ahn, 2024; Selvan & Mariappan, 2019; Gill & Deol, 2017). This elevation of psychological mechanisms is especially important in confrontational sports such as sanda (Teng et al., 2024; Lei & Lv, 2022). This is because sanda players need to react and perform technical movements in a very short time.
Although SAQ training has been widely used in ball games such as football and basketball, there are some differences in its application effect in sanda. SAQ training for soccer and basketball players is often combined with ball technique training, emphasizing agility and reaction speed in dribbling situations (Gao, 2010b). The agility training of sanda players focuses more on fast movement, change of direction (Elsebaay, Saied & Abdellatef , 2023) and explosiveness (Li et al., 2023; Zeng, 2022) without the ball, especially in simulated combat scenarios, reaction speed and action cohesion (Liu et al., 2023). Therefore, the SAQ training of sanda athletes needs to be adjusted according to their technical characteristics and actual combat needs, such as adding reaction training for punch and kick combinations and explosive training for multi-directional movement.
Traditional agility training usually includes basic movements such as small strides, high leg raises, reverse running, and lateral cross running, although it can improve the agility of athletes to a certain extent, but its training content is relatively simple, lacking systematization and pertinence (Ansharudin et al., 2022; Lockie et al., 2014). Traditional training has limited effectiveness in improving the ability of athletes to change direction quickly and coordinate movements, especially when faced with complex motor tasks, where athletes often perform unsatisfactorily (Parimalam & Pushparajan, 2014; Yildiz, Pinar & Gelen, 2019). In addition, traditional training also lacks in improving athletes’ cognitive ability and reaction speed (Zhang, 2022). It is difficult to meet the high-intensity demands of confrontational sports such as sanda. In contrast, SAQ training is able to improve the agility of athletes across the board through systematic multi-directional movement, rapid reaction and explosive training. SAQ training not only enhances the athlete’s lower limb explosiveness (Abdulhussein & Faraj Al Abdullha, 2021; Dedthonglang & Keawklay, 2023) and movement coordination (Abdel Rahman Shaheen, 2017), it can also improve the cognitive ability and reaction speed of athletes through exercises that simulate actual combat scenarios (Emeish, 2015). In addition, the training content and intensity of SAQ training can be adjusted according to the specific needs of athletes, with high flexibility and adaptability.
In addition, the study conducted multiple rounds of screening by a number of experts and professors to develop two agility performance test indicators on the technical characteristics of sanda, and the 15s repeated challenge arena jump mainly evaluated the endurance and explosiveness of the lower limbs of the sanda specialists, which is closely related to the continuous attack and fast movement ability of sanda athletes in actual combat. By enhancing the explosiveness and endurance of the lower limbs, SAQ training can significantly improve the continuous attack ability and movement speed of sanda athletes in actual combat. The performance of the experimental group in the 15s repeated challenge arena jump was significantly better than that of the control group, indicating that SAQ training had a significant effect on improving the endurance and explosiveness of the lower limbs of sanda athletes. In addition, fist leg combination cohesion test mainly evaluates the athlete’s technical execution speed and movement fluency, which is closely related to the technical articulation ability of sanda athletes in actual combat. SAQ training can significantly improve the speed and fluency of sanda athletes’ technical execution through fist and leg combination reaction training that simulates actual combat scenarios. The performance of the experimental group in the fist-leg combination articulation test was significantly better than that of the control group, indicating that SAQ training had a significant effect in improving the technical execution ability of sanda athletes.
SAQ training is suitable for sanda athletes of all levels, especially young athletes who need to improve their agility and reaction speed. It is suggested that when designing the SAQ training program, coaches should combine the technical characteristics and actual combat needs of sanda, and add multi-directional movement, rapid reaction and punch and leg combination reaction training. The training intensity should be adjusted according to the specific situation of the athlete to ensure the safety and effectiveness of the training, and SAQ training can be combined with sanda technical training, such as 30 min of SAQ training before technical training, to improve athletes’ agility and reaction speed. In addition, coaches can introduce SAQ training content into actual combat simulation training to enhance athletes’ performance in actual combat.
The promotion of SAQ training in China’s physical education should focus on systematization and standardization. It is suggested that SAQ training content should be introduced into college sanda courses, and related training and seminars should be organized to improve the understanding and application ability of coaches and athletes on SAQ training. In addition, the effect of SAQ training in sanda training can be further verified through scientific research cooperation and experimental research, so as to provide a scientific basis for its promotion in a wider range.
Limitations and future directions
This study, while providing valuable insights into the impact of SAQ training on the agility performance of collegiate sanda students, has several limitations that should be acknowledged.
Firstly, the sample size of the experiment was relatively small, consisting only of male collegiate sanda students from Henan Normal University. This limited sample size may restrict the generalizability of the findings to a broader population, including female sanda athletes, younger or older age groups, or students from different regions or training backgrounds. Future research should aim to include a more diverse and larger sample size, encompassing both male and female sanda students, as well as athletes from various levels of expertise and training institutions.
Secondly, the study relied on manual timing, using stopwatches for several of the agility tests, such as the pro agility test, Illinois agility test, and compass pointer test. While efforts were made to ensure consistency in timing, the use of stopwatches introduces the potential for human error, with an estimated margin of error of approximately ±0.2 s. This limitation could affect the precision of the results, particularly in tests where milliseconds can significantly impact performance outcomes. Future studies should consider employing more advanced and automated timing systems, such as electronic timing gates or motion capture technology, to enhance the accuracy and reliability of the measurements.
Additionally, the study focused on a limited number of agility test indicators, which were selected based on the specific characteristics of sanda. While these tests were carefully chosen and validated by experts, the relatively narrow scope of agility performance metrics may not fully capture the multifaceted nature of agility in sanda. Future research could explore the development of more comprehensive and sport-specific agility test indicators that better reflect the complex movement patterns and demands of sanda.
Conclusions
This study demonstrates that SAQ training significantly enhances the agility performance of collegiate sanda students, outperforming traditional training methods. The experimental group exhibited marked improvements across all tested agility indicators, particularly in direction-changing ability, movement coordination, and technical execution. These findings underscore the systemic advantages of SAQ training, which integrates multi-directional movements, rapid reactions, and explosive exercises tailored to the demands of sanda.
Theoretically, this research bridges a gap in the literature by validating the application of SAQ training in martial arts, specifically sanda, highlighting its potential to improve neuromuscular adaptability and cognitive-motor performance. Practically, the results suggest that incorporating SAQ training into sanda programs can optimize athletes’ agility, reaction speed, and combat readiness. Coaches are encouraged to adopt SAQ protocols, combining them with sport-specific drills to maximize training efficacy.
Despite limitations such as sample size and manual timing, the study provides a foundation for future research to explore SAQ training’s broader applicability across diverse populations and advanced measurement techniques. Overall, SAQ training emerges as a scientifically grounded and practical approach to elevating agility in sanda athletes, with promising implications for sports training methodologies.