
Association of Chinese visceral adiposity index with asymptomatic hyperuricemia incidence in type 2 diabetes: a cross-sectional study
- Published
- Accepted
- Received
- Academic Editor
- Juan Alpuche
- Subject Areas
- Diabetes and Endocrinology, Epidemiology, Internal Medicine, Metabolic Sciences, Obesity
- Keywords
- Cross-sectional study, CVAI, Type 2 diabetes, Hyperuricemia
- Copyright
- © 2025 Wang et al.
- Licence
- This is an open access article distributed under the terms of the Creative Commons Attribution License, which permits using, remixing, and building upon the work non-commercially, as long as it is properly attributed. For attribution, the original author(s), title, publication source (PeerJ) and either DOI or URL of the article must be cited.
- Cite this article
- 2025. Association of Chinese visceral adiposity index with asymptomatic hyperuricemia incidence in type 2 diabetes: a cross-sectional study. PeerJ 13:e19045 https://doi.org/10.7717/peerj.19045
Abstract
Background
Previous research has shown a correlation between high visceral fat levels and hyperuricemia incidence. The Chinese Visceral Adiposity Index (CVAI) assessed visceral fat status in the Chinese population. Our study investigates the correlation between CVAI and asymptomatic hyperuricemia in type 2 diabetes patients.
Methods
This cross-sectional study analyzed 1,588 hospitalized type 2 diabetes patients to investigate the association between CVAI and hyperuricemia. CVAI was included in the logistic regression analysis as both a continuous and categorical variable, and restricted cubic splines were used to assess the dose-response relationship. Additionally, subgroup analyses were performed to investigate potential interactions among variables. The predictive capability of CVAI was assessed using the receiver operating characteristic (ROC) curve based on the basic model.
Results
The CVAI quartile group analysis revealed a higher prevalence of hyperuricemia with increasing CVAI levels. CVAI is significantly associated with hyperuricemia, as identified through multifactorial logistic regression analysis. After adjusting for all covariates, the odds ratios for CVAI in the second, third, and fourth quartiles were significantly higher than in the lowest quartile, with values of 2.688 (95% CI [1.301–5.554], p = 0.008), 2.752 (95% CI [1.320–5.739], p = 0.007), and 4.990 (95% CI [2.392–10.409], p < 0.001), respectively. No significant interactions were observed in the subgroup analysis. Incorporating CVAI into the basic model increased the ROC curve’s area under the curve to 0.714.
Conclusion
This study found a positive correlation between CVAI and hyperuricemia incidence in type 2 diabetes patients. Consequently, CVAI may reliably indicate hyperuricemia in this patient population.
Introduction
Diabetes mellitus (DM) has become more prevalent worldwide in recent years. The global diabetes prevalence in 20–79-year old in 2021 was estimated to be 10.5% (536.6 million people), rising to 12.2% (783.2 million) in 2045 (Sun et al., 2022). China’s economic development and lifestyle changes have led to the highest incidence of diabetes mellitus globally. In 2018, the estimated prevalence of diabetes was 12.4%, and the prevalence of prediabetes was 38.1% in China (Wang et al., 2021b).
Hyperuricemia arises from either aberrant purine metabolism or reduced uric acid excretion. The majority of individuals with hyperuricemia remain asymptomatic, with fewer than 10% progressing to develop gout (Liu et al., 2015). Hyperuricemia can lead to various diseases such as diabetes, hypertension, atherosclerosis, chronic kidney disease, atrial fibrillation, and cardiovascular disease (Johnson et al., 2018; Mortada, 2017; Wang et al., 2021a). Furthermore, there is evidence indicating that hyperuricemia can predict the onset and progression of diabetes, fatty liver, hypertension, and obesity (Zhao et al., 2022; Joosten et al., 2020). Research suggests that reducing serum uric acid levels in patients with type 2 diabetes may mitigate both microvascular and macrovascular complications (Xu et al., 2013; Soltani et al., 2013). Therefore, the early detection and intervention of hyperuricemia in type 2 diabetic patients may contribute to delaying the progression of diabetes and the onset of its associated complications.
Previous study identified a significant independent association between elevated uric acid levels and an increased risk of developing metabolic syndrome (Sumiyoshi et al., 2019), as well as a higher prevalence of its components, including central obesity and hypertriglyceridemia (Huang et al., 2017). Furthermore, existing research indicates that individuals with metabolic syndrome and its components exhibit a heightened likelihood of developing hyperuricemia, with the risk escalating in correlation with the number of metabolic syndrome components present (Tu et al., 2023). In the context of metabolic syndrome, particularly central obesity, hyperuricemia elevates the risk of urate stone formation as a result of insulin resistance, thereby exacerbating the negative outcomes associated with hyperuricemia (Spatola et al., 2017). These findings underscore the interrelationship between uric acid, metabolic syndrome, and hyperuricemia. Central obesity is a critical component of metabolic syndrome. In previous studies, uric acid production increased with the accumulation of visceral fat deposits (Yamada et al., 2016). While body mass index (BMI), waist circumference (WC), and waist-to-height ratio (WHtR) are commonly used to measure obesity, they do not provide information about visceral fat levels. In clinical practice, assessing visceral fat content using CT or MRI is impractical. Chinese Visceral Adiposity Index (CVAI) is proposed as a superior indicator of visceral fat levels in Chinese adults, incorporating WC, BMI, triglycerides (TG), and high-density lipoprotein cholesterol (HDL-C), while also accounting for sex and age (Xia et al., 2016).
There is evidence that the CVAI can be used independently to predict diabetes, cardiovascular conditions, strokes, and other diseases (Ren et al., 2024; Zhang et al., 2024; Ye et al., 2024; Zhang et al., 2023). No definitive evidence supports CVAI as a risk factor or predictor of asymptomatic hyperuricemia in individuals with type 2 diabetes. The objective of this study is to examine the relationship between CVAI and hyperuricemia in patients with type 2 diabetes, as well as to evaluate the predictive capacity of CVAI for hyperuricemia.
Materials and methods
Study design and participants
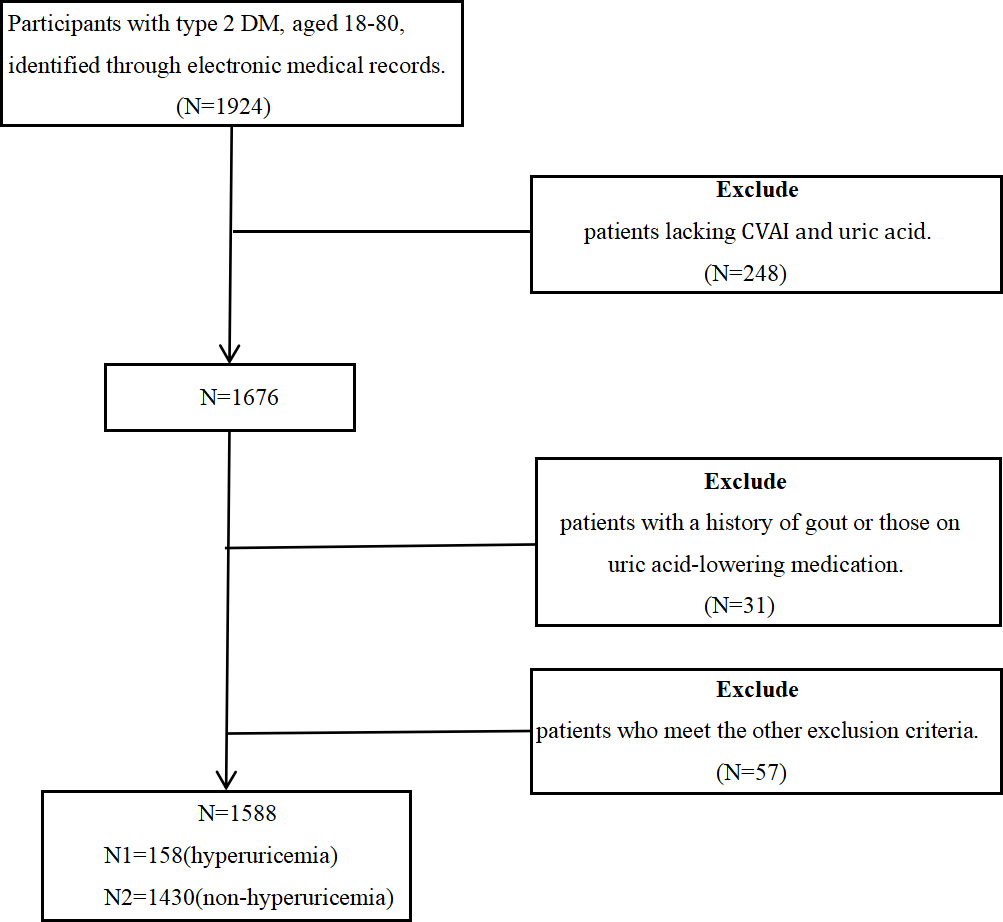
This retrospective observational cross-sectional study used real-world data and was conducted at the Affiliated Hospital of Qingdao University from 2017 to 2019. The study comprised 1,588 hospitalized patients, aged 18 to 80, diagnosed with type 2 diabetes (T2D) based on the 2023 American Diabetes Association (ADA) criteria. All participants signed informed consent forms. The exclusion criteria included: (1) a history of physician-diagnosed gout or an ongoing gout flare, (2) use of urate-lowering medications, (3) recent acute diabetes complications such as hypoglycemic coma, diabetic ketoacidosis, hyperglycemic hyperosmolar coma, or lactic acidosis, (4) concurrent acute or chronic infections, (5) presence of malignant tumors or autoimmune diseases, and (6) any organ dysfunction or failure. Figure 1 depicts selection process of study participants. During or after data collection, information that identifies individual participants such as name, registration number, etc. is not available. The study was approved by the Ethics Committee of the Affiliated Hospital of Medicine College, Qingdao University (Ethics Batch Number QYFY WZLL 29107). The clinical trial registration number is ChiCTR2400090471.
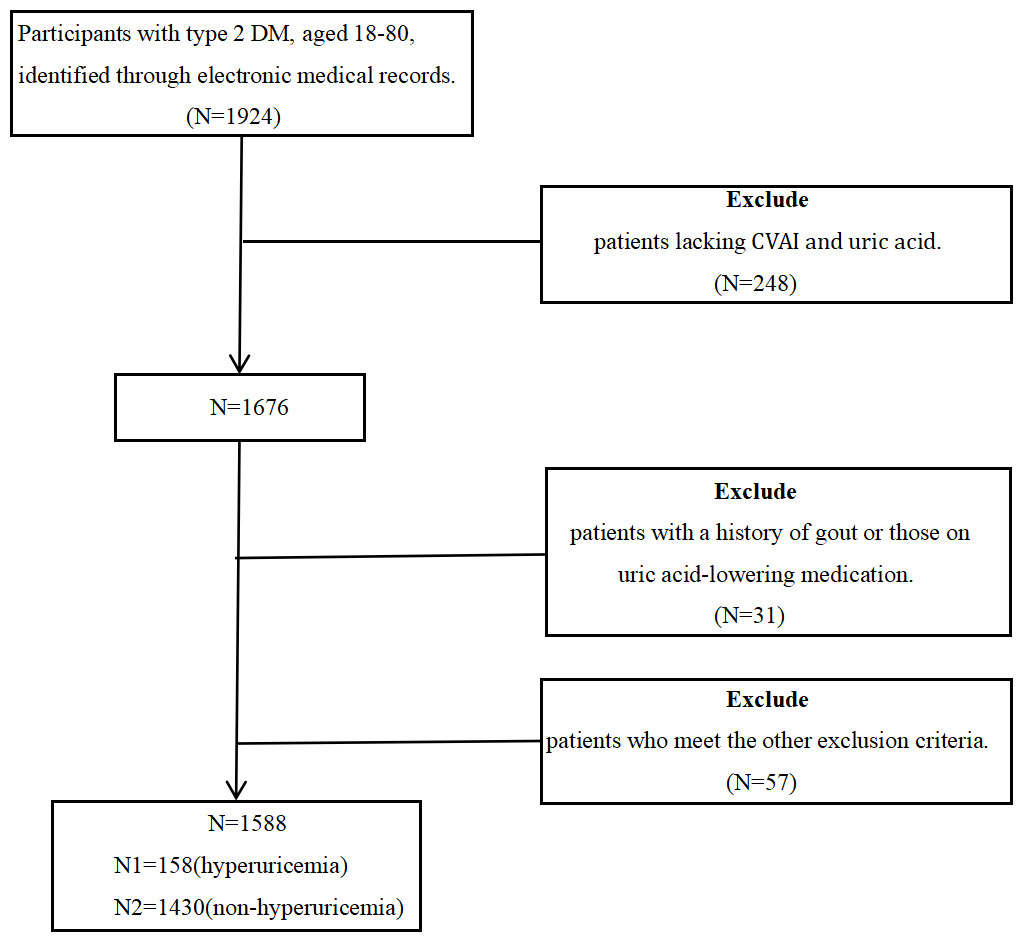
Figure 1: The procedure for selecting study participants.
Data collection
Baseline data collected included sex, age, diabetes duration, weight, height, WC, hip circumference (HC), systolic blood pressure (SBP), diastolic blood pressure (DBP), smoking history, alcohol consumption, and medication use upon admission. Participants were positioned in an upright stance and maintained a fasting state. A WC measurement was performed at the umbilicus, while a HC measurement was taken at hip protrusion. BMI is calculated by dividing weight in kilograms by height in meters squared.
Venous blood was collected the following morning after an 8-hour overnight fast to measure fasting plasma glucose (FPG), glycated hemoglobin (HbA1c), fasting C-peptide (Cp), total cholesterol (TC), TG, low-density lipoprotein cholesterol (LDL-C), HDL-C, free fatty acids (FFA), alanine aminotransferase (ALT), aspartate aminotransferase (AST), γ-glutamyl transferase (GGT), alkaline phosphatase (ALP), creatinine (Cr), urea nitrogen (BUN), urine microalbumin/creatinine (UACR), and uric acid (UA). The estimated glomerular filtration rate (eGFR) was calculated using the Chronic Kidney Disease Epidemiology Collaboration (CKD-EPI) equation (Levey & Stevens, 2010).
CVAI was calculated using the following formulas: for males, CVAI = −267.93 + 0.68 × age (years) + 0.03 × BMI (kg/m2) + 4.00 × WC (cm) + 22.00 × Log10 TG (mmol/L) − 16.32 × HDL-C (mmol/L), for females, CVAI = − 187.32 + 1.71 × age (years) + 4.23 × BMI (kg/m2) + 1.12 × WC (cm) + 39.76 × Log10 TG (mmol/L) − 11.66 × HDL-C (mmol/L). The CVAI values were divided into four quartiles: Quartile 1 (<108.09), Quartile 2 (108.09–134.87), Quartile 3 (134.88–163.64), and Quartile 4 (>163.64). Hyperuricemia was defined as serum uric acid levels exceeding 420 µmol/L (Zhang et al., 2021; Guo et al., 2022). Hypertension is characterized by a SBP of ≥ 140 mmHg, a DBP of ≥ 90 mmHg, or a documented history of high blood pressure (Fryar et al., 2017). The presence of fatty liver was evaluated using ultrasonographic techniques. TG, TC, LDL-C, and HDL-C were categorized based on the Guidelines for the Treatment and Prevention of Blood Lipid Abnormalities in Chinese Adults (Li et al., 2023). HbA1c levels were categorized based on whether they were under 7%. Cp levels were stratified into two categories based on the lower threshold of the normal range as determined by our hospital’s standards.
Statistical methods
Statistical analyses were conducted utilizing SPSS 27.0 and R 4.3.1. Continuous variables for each group, categorized according to the quartiles of CVAI, were assessed for normality. Data following a normal distribution were expressed as mean ± standard deviation, and group comparisons were conducted using the ANOVA test. Skewed data were presented as median (25th–75th percentile), and group comparisons were performed using the Kruskal-Wallis H test. Categorical variables were presented as percentages, and Pearson chi-square tests compared the groups. Results were deemed statistically significant for p values ≤ 0.05.
To mitigate the influence of confounding factors, potential confounders were systematically screened. Missing data were handled through the application of multiple imputation. The association between CVAI and hyperuricemia was analyzed using multifactorial logistic regression. Three weighted multivariable logistic regression models were developed to further elucidate these associations. Covariates were not adjusted for in Model 1. Model 2 adjusted for covariates including sex, age, duration of diabetes, smoking, drinking, SBP, and DBP. Model 3 was additionally adjusted for HbA1c, FPG, Cp, UACR, eGFR, ALT, and AST. The median values of the CVAI quartiles was integrated into the model as quasi-continuous variable, and the p-trend was subsequently calculated. A logistic regression-based restricted cubic spline (RCS) analysis was performed to examine the dose–response relationship between CVAI and hyperuricemia. We performed a subgroup analysis to evaluate the robustness of the results across different stratifications, including sex, age, hypertension status, presence of fatty liver, BMI, HbA1c levels, Cp levels, TC, TG, HDL-C, LDL-C, and eGFR. We also calculated the interaction between these stratified variables and CVAI. Furthermore, receiver operating characteristic (ROC) curves were employed to evaluate the predictive performance of the basic model and the model augmented with CVAI for hyperuricemia.
Results
General characteristics of participants
A total of 1,588 participants were involved in the study, 842 of whom were males and 746 females, with a mean age of 62 years old. Among these participants, 158 were diagnosed with hyperuricemia, while 1,430 did not have hyperuricemia. Table 1 demonstrates the general characteristics of the patients grouped by CVAI quartiles. Hyperuricemia prevalence across the four quartiles was 5.1%, 8.6%, 8.8%, and 17.4%, with significant differences between groups (p < 0.05). Significant differences were observed among various groups in terms of gender, age, diabetes duration, height, weight, BMI, WC, HC, SBP, DBP, smoking status, alcohol consumption, fatty liver incidence, medication usage (metformin, thiazolidinediones, GLP-1 receptor agonists, insulin, statins, fibrates), FPG, Cp, TC, TG, HDL-C, FFA, ALT, AST, GGT, Cr, BUN, eGFR, UACR, and UA, all with statistical significance (p < 0.05). No statistically significant differences were observed in the incidence of hypertension, use of alpha-glucosidase inhibitors, sulfonamides, DPP-4 inhibitors, HbA1c, LDL-C, and ALP.
| Variables | CVAI | p value | |||
|---|---|---|---|---|---|
| Q1 (n = 397) | Q2 (n = 397) | Q3 (n = 397) | Q4 (n = 397) | ||
| CVAI | <108.09 | 108.09–134.87 | 134.88–163.64 | >163.64 | |
| Sex: Male (%) | 48.0% (189) | 43.6% (173) | 52.8% (210) | 67.9% (269) | <0.001 |
| Age (year) | 59 (52–64) | 62 (56–69) | 65 (59–72) | 67 (56–74) | <0.001 |
| Duration of diabetes (year) | 10.00 (4.50–15.00) | 10.00 (6.00–17.00) | 11.00 (6.00–20.00) | 11.50 (5.75–20.00) | <0.001 |
| Height (cm) | 165 (160–172) | 165 (160–172) | 168 (160–173) | 170 (163–176) | <0.001 |
| Weight (kg) | 63 (58–70) | 69 (63–75) | 74 (68–80) | 84 (77–92) | <0.001 |
| BMI (kg/m2) | 23.05 (21.48–24.75) | 24.82 (23.51–26.17) | 26.30 (24.66–28.16) | 29.17 (27.44–31.46) | <0.001 |
| WC (cm) | 83 (80–87) | 91 (89–95) | 97 (95–100) | 107 (102–111) | <0.001 |
| HC (cm) | 95 (90–97) | 98 (95–102) | 101 (98–106) | 107 (103–112) | <0.001 |
| SBP (mmHg) | 136 (122–149) | 139 (127–152) | 143 (130–153) | 146.5 (131–158) | <0.001 |
| DBP (mmHg) | 78 (71–86) | 78 (70–85) | 79 (71–86) | 80 (72–88) | 0.013 |
| Smoking (%) | 22.8% (90) | 23.3% (92) | 27.9% (111) | 36% (142) | <0.001 |
| Drinking (%) | 24.7% (96) | 22.9% (89) | 29.7% (115) | 34.4% (132) | 0.001 |
| Hypertension (%) | 46.3% (183) | 51.0% (203) | 58.5% (233) | 65.4% (259) | <0.001 |
| Hyperuricemia (%) | 5.1% (20) | 8.6% (34) | 8.8% (35) | 17.4% (69) | <0.001 |
| Fatty liver (%) | 15.3% (60) | 23.4% (91) | 30.1% (117) | 39.9% (155) | <0.001 |
| Metformin (%) | 60.6% (237) | 68.6% (267) | 71.5% (278) | 80.2% (311) | <0.001 |
| Alpha glycosidase inhibitor (%) | 64.5% (252) | 72.0% (280) | 70.4% (274) | 66.8% (259) | 0.095 |
| Sulfonamides (%) | 11.5% (45) | 13.6% (53) | 11.6% (45) | 10.3% (40) | 0.546 |
| Thiazolidinediones (%) | 14.8% (58) | 19.8% (77) | 19.3% (75) | 32.7% (127) | <0.001 |
| DPP-4i (%) | 55.2% (216) | 55.3% (215) | 59.4% (231) | 53.4% (207) | 0.382 |
| GLP-1RA (%) | 2.0% (8) | 2.8% (11) | 5.9% (23) | 19.8% (77) | <0.001 |
| Insulin (%) | 67.3% (263) | 70.7% (275) | 68.4% (266) | 60.8% (236) | 0.025 |
| Statin (%) | 69.1% (270) | 76.9% (299) | 82.5% (321) | 78.4% (304) | <0.001 |
| Fibrates (%) | 1.0% (4) | 2.3% (9) | 2.8% (11) | 5.7% (22) | 0.001 |
| HbA1c (%) | 7.90 (6.70–9.65) | 8.00 (6.90–9.40) | 8.10 (7.20–9.43) | 8.05 (6.98–9.20) | 0.115 |
| Fasting plasma glucose (mmol/L) | 6.68 (4.98–8.34) | 6.58 (5.42–8.42) | 6.41 (5.34–8.11) | 7.03 (5.72–8.59) | <0.001 |
| C-peptide (ng/mL) | 1.41 (0.95–2.00) | 1.66 (1.10–2.35) | 1.82 (1.21–2.57) | 2.61 (1.69–3.24) | <0.001 |
| TC (mmol/L) | 4.44 (3.86–5.21) | 4.61 (3.76–5.26) | 4.42 (3.66–5.11) | 4.17 (3.52–5.13) | 0.020 |
| TG (mmol/L) | 1.01 (0.72–1.39) | 1.30 (0.94–1.81) | 1.44 (1.05–2.36) | 1.72 (1.26–2.76) | <0.001 |
| LDL-C (mmol/L) | 2.57 (2.00–3.19) | 2.71 (1.98–3.27) | 2.67 (2.03–3.20) | 2.44 (1.93–3.16) | 0.083 |
| HDL-C (mmol/L) | 1.36 (1.16–1.61) | 1.26 (1.09–1.51) | 1.16 (1.01–1.34) | 1.07 (0.90–1.24) | <0.001 |
| FFA (mmol/L) | 0.41 (0.29–0.54) | 0.39 (0.27–0.54) | 0.43 (0.31–0.54) | 0.46 (0.33–0.58) | <0.001 |
| ALT (U/L) | 17.00 (12.00–22.50) | 17.00 (13.00–24.00) | 18.00 (13.00–24.00) | 20.00 (13.00–29.25) | <0.001 |
| AST (U/L) | 17.00 (14.00–21.00) | 16.00 (14.00–20.00) | 17.00 (14.00–20.00) | 18.00 (15.00–23.25) | <0.001 |
| GGT (U/L) | 17.00 (13.00–25.00) | 18.00 (14.00–27.00) | 20.00 (15.00–29.00) | 21.50 (16.00–34.00) | <0.001 |
| ALP (U/L) | 66.00 (53.00–81.00) | 64.00 (52.00–78.00) | 64.00 (51.00–77.25) | 61.50 (51.00–74.00) | 0.114 |
| Creatinine (umol/L) | 52.00 (43.00–60.00) | 52.00 (44.00–61.00) | 57.00 (48.00–67.00) | 60.00 (51.00–68.25) | <0.001 |
| BUN (mmol/L) | 5.76 (4.91–6.88) | 5.72 (4.68–6.65) | 5.85 (4.84–7.20) | 6.01 (5.09–7.29) | <0.001 |
| eGFR (mL/min/1.73 m2) | 123.22 (105.59–142.99) | 117.66 (100.40–138.52) | 112.10 (91.99–131.84) | 110.25 (88.98–132.79) | <0.001 |
| UACR (mg/L) | 6.91 (4.98–16.83) | 7.80 (5.28–18.50) | 11.17 (5.97–43.45) | 12.52 (5.91–42.56) | <0.001 |
| UA (umol/L) | 278.00 (232.00–330.50) | 307.00 (260.00–370.00) | 321.00 (273.00–372.25) | 358.00 (298.75–417.00) | <0.001 |
Risk factors for hyperuricemia in type 2 diabetes
Multivariate logistic regression was used to examine hyperuricemia risk factors in type 2 diabetes participants. The potential risk factors are summarized in Table 2. Our analysis identified a positive correlation between UACR and CVAI with hyperuricemia, with OR (95% CI) values of 1.001 [1.000–1.002] and 1.011 [1.002–1.020], respectively. Age and eGFR had a significant negative correlation with hyperuricemia, with OR (95% CI) values of 0.965 [0.942–0.989] and 0.991 [0.984–0.997], respectively. After model adjustment, sex, smoking, alcohol consumption, hypertension, fatty liver, diabetes duration, BMI, HbA1c, Cp, TG, and HDL-C were not significant risk factors for hyperuricemia in type 2 diabetes.
| Variables | B | SE | Wald χ2 | OR (95% CI) | p value |
|---|---|---|---|---|---|
| Sex | |||||
| female | 1 | ||||
| male | 0.185 | 0.281 | 0.433 | 1.204 [0.693–2.090] | 0.510 |
| Smoking | |||||
| no | 1 | ||||
| yes | 0.245 | 0.303 | 0.651 | 1.277 [0.705–2.314] | 0.420 |
| Drinking | |||||
| no | 1 | ||||
| yes | 0.219 | 0.299 | 0.537 | 1.245 [0.693–2.235] | 0.464 |
| Hypertension | |||||
| no | 1 | ||||
| yes | 0.109 | 0.210 | 0.268 | 1.115 [0.738–1.684] | 0.605 |
| Fatty liver | |||||
| no | 1 | ||||
| yes | −0.031 | 0.227 | 0.019 | 0.969 [0.621–1.513] | 0.891 |
| Age | −0.036 | 0.012 | 8.425 | 0.965 [0.942–0.989] | 0.004 |
| Duration of diabetes | −0.018 | 0.015 | 1.295 | 0.983 [0.953–1.013] | 0.255 |
| BMI | −0.032 | 0.048 | 0.437 | 0.969 [0.882–1.064] | 0.509 |
| HbA1c | −0.102 | 0.061 | 2.770 | 0.903 [0.800–1.018] | 0.096 |
| C-peptide | 0.123 | 0.086 | 2.015 | 1.130 [0.954–1.339] | 0.156 |
| UACR | 0.001 | 0.000 | 9.154 | 1.001 [1.000–1.002] | 0.002 |
| eGFR | −0.009 | 0.003 | 7.328 | 0.991 [0.984–0.997] | 0.007 |
| TG | 0.029 | 0.047 | 0.389 | 1.030 [0.939–1.130] | 0.533 |
| HDL-C | −0.433 | 0.406 | 1.134 | 0.649 [0.293–1.439] | 0.287 |
| CVAI | 0.011 | 0.005 | 6.176 | 1.011 [1.002–1.020] | 0.013 |
The association between CVAI and hyperuricemia in type 2 diabetes
The association between CVAI and hyperuricemia was examined using three logistic regression models, with the results detailed in Table 3. In the unadjusted model (Model 1), CVAI was identified as a significant risk factor for hyperuricemia, with an OR (95% CI) of 1.011 (1.007–1.015, p < 0.001). The partially adjusted model (Model 2) showed a positive correlation between CVAI and hyperuricemia, with an OR (95% CI) of 1.012 (1.007–1.016, p < 0.001). Even after adjusting for all covariates in Model 3, the positive correlation remained significant, with an OR (95% CI) value of 1.10 (1.005–1.016, p < 0.001). The model suggests that for each unit increment in CVAI, there is a corresponding 10% increase in the likelihood of hyperuricemia prevalence. The CVAI variable was converted from continuous to categorical by dividing it into quartiles. In the three models using CVAI as a categorical variable, hyperuricemia prevalence significantly increased with higher CVAI levels (p for trend < 0.001). In Model 1, the OR (95% CI) for hyperuricemia prevalence in the second, third, and fourth CVAI quartiles compared to the first quartile were 1.747 (0.987–3.091, p = 0.056), 1.808 (1.024–3.190, p = 0.041), and 3.956 (2.354–6.651, p < 0.001), respectively. In Model 2, the OR (95% CI) for hyperuricemia prevalence in the second, third, and fourth CVAI quartiles were 1.979 (1.079–3.627, p = 0.027), 2.147 (1.159–3.979, p = 0.015), and 4.697 (2.628–8.393, p < 0.001), respectively. In Model 3, the OR (95% CI) for hyperuricemia prevalence were 2.688 (1.301–5.554, p = 0.008) for the second CVAI quartile, 2.752 (1.320−5.739, p = 0.007) for the third quartile, and 4.990 (2.392–10.409, p < 0.001) for the fourth quartile.
| Model 1 | Model 2 | Model 3 | ||||
|---|---|---|---|---|---|---|
| OR (95% CI) | p value | OR (95% CI) | p value | OR (95% CI) | p value | |
| CVAI | 1.011 [1.007–1.015] | <0.001 | 1.012 [1.007–1.016] | <0.001 | 1.010 [1.005–1.016] | <0.001 |
| CVAI group (median [range]) | ||||||
| Q1 88.44 [<108.07] | Ref. | Ref. | Ref. | |||
| Q2 122.60 [108.07–134.87] | 1.747 [0.987–3.091] | 0.056 | 1.979 [1.079–3.627] | 0.027 | 2.688 [1.301–5.554] | 0.008 |
| Q3 148.95 [134.88–163.68] | 1.808 [1.024–3.190] | 0.041 | 2.147 [1.159–3.979] | 0.015 | 2.752 [1.320–5.739] | 0.007 |
| Q4 184.24 [>163.68] | 3.956 [2.354–6.651] | <0.001 | 4.697 [2.628–8.393] | <0.001 | 4.990 [2.392–10.409] | <0.001 |
| p trend | <0.001 | <0.001 | <0.001 | |||
Additionally, an investigation of the CVAI and hyperuricemia dose–response relationship was carried out using RCS. A linear dose–response relationship between CVAI and hyperuricemia was observed across all models (unadjusted, partially adjusted, and fully adjusted), with nonlinearity p values exceeding 0.05. Our analysis revealed a correlation between increased CVAI and a heightened risk of hyperuricemia when CVAI values exceeded 134.874, 134.622, and 135.915 in the three respective models (Fig. 2).
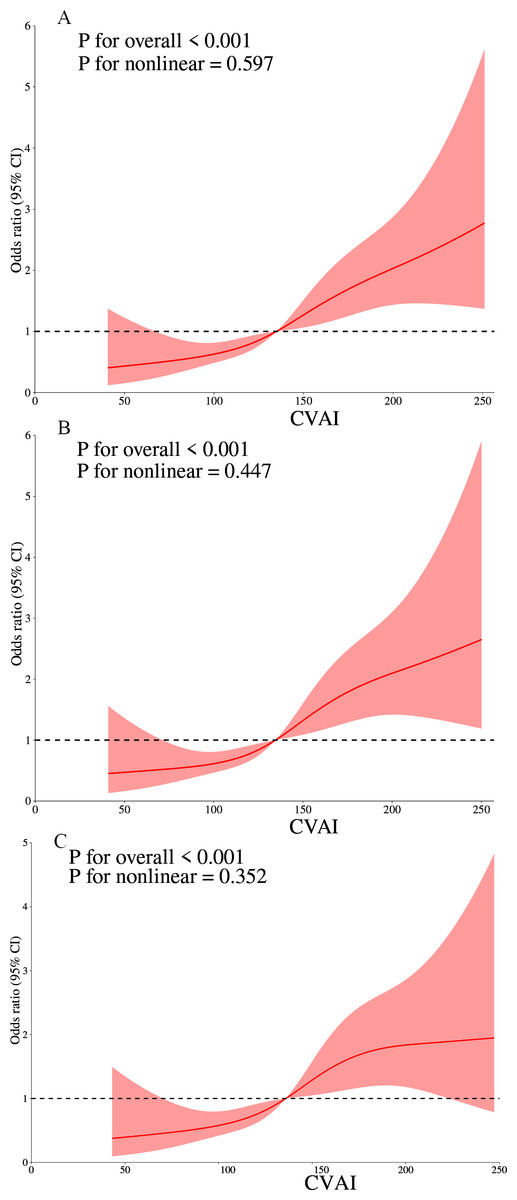
Figure 2: The dose–response relationship of CVAI and hyperuricemia.
(A) Model 1 were not adjusted. (B) Model 2 were adjusted for sex, age, duration of diabetes, smoking, drinking, systolic blood pressure (SBP), and diastolic blood pressure (DBP). (C) Model 3 was further adjusted for HbA1c, fasting plasma glucose (FPG), C-peptide (Cp), urine microalbumin/creatinine (UACR), estimated glomerular filtration rate (eGFR), alanine aminotransferase (ALT), and aspartate aminotransferase (AST).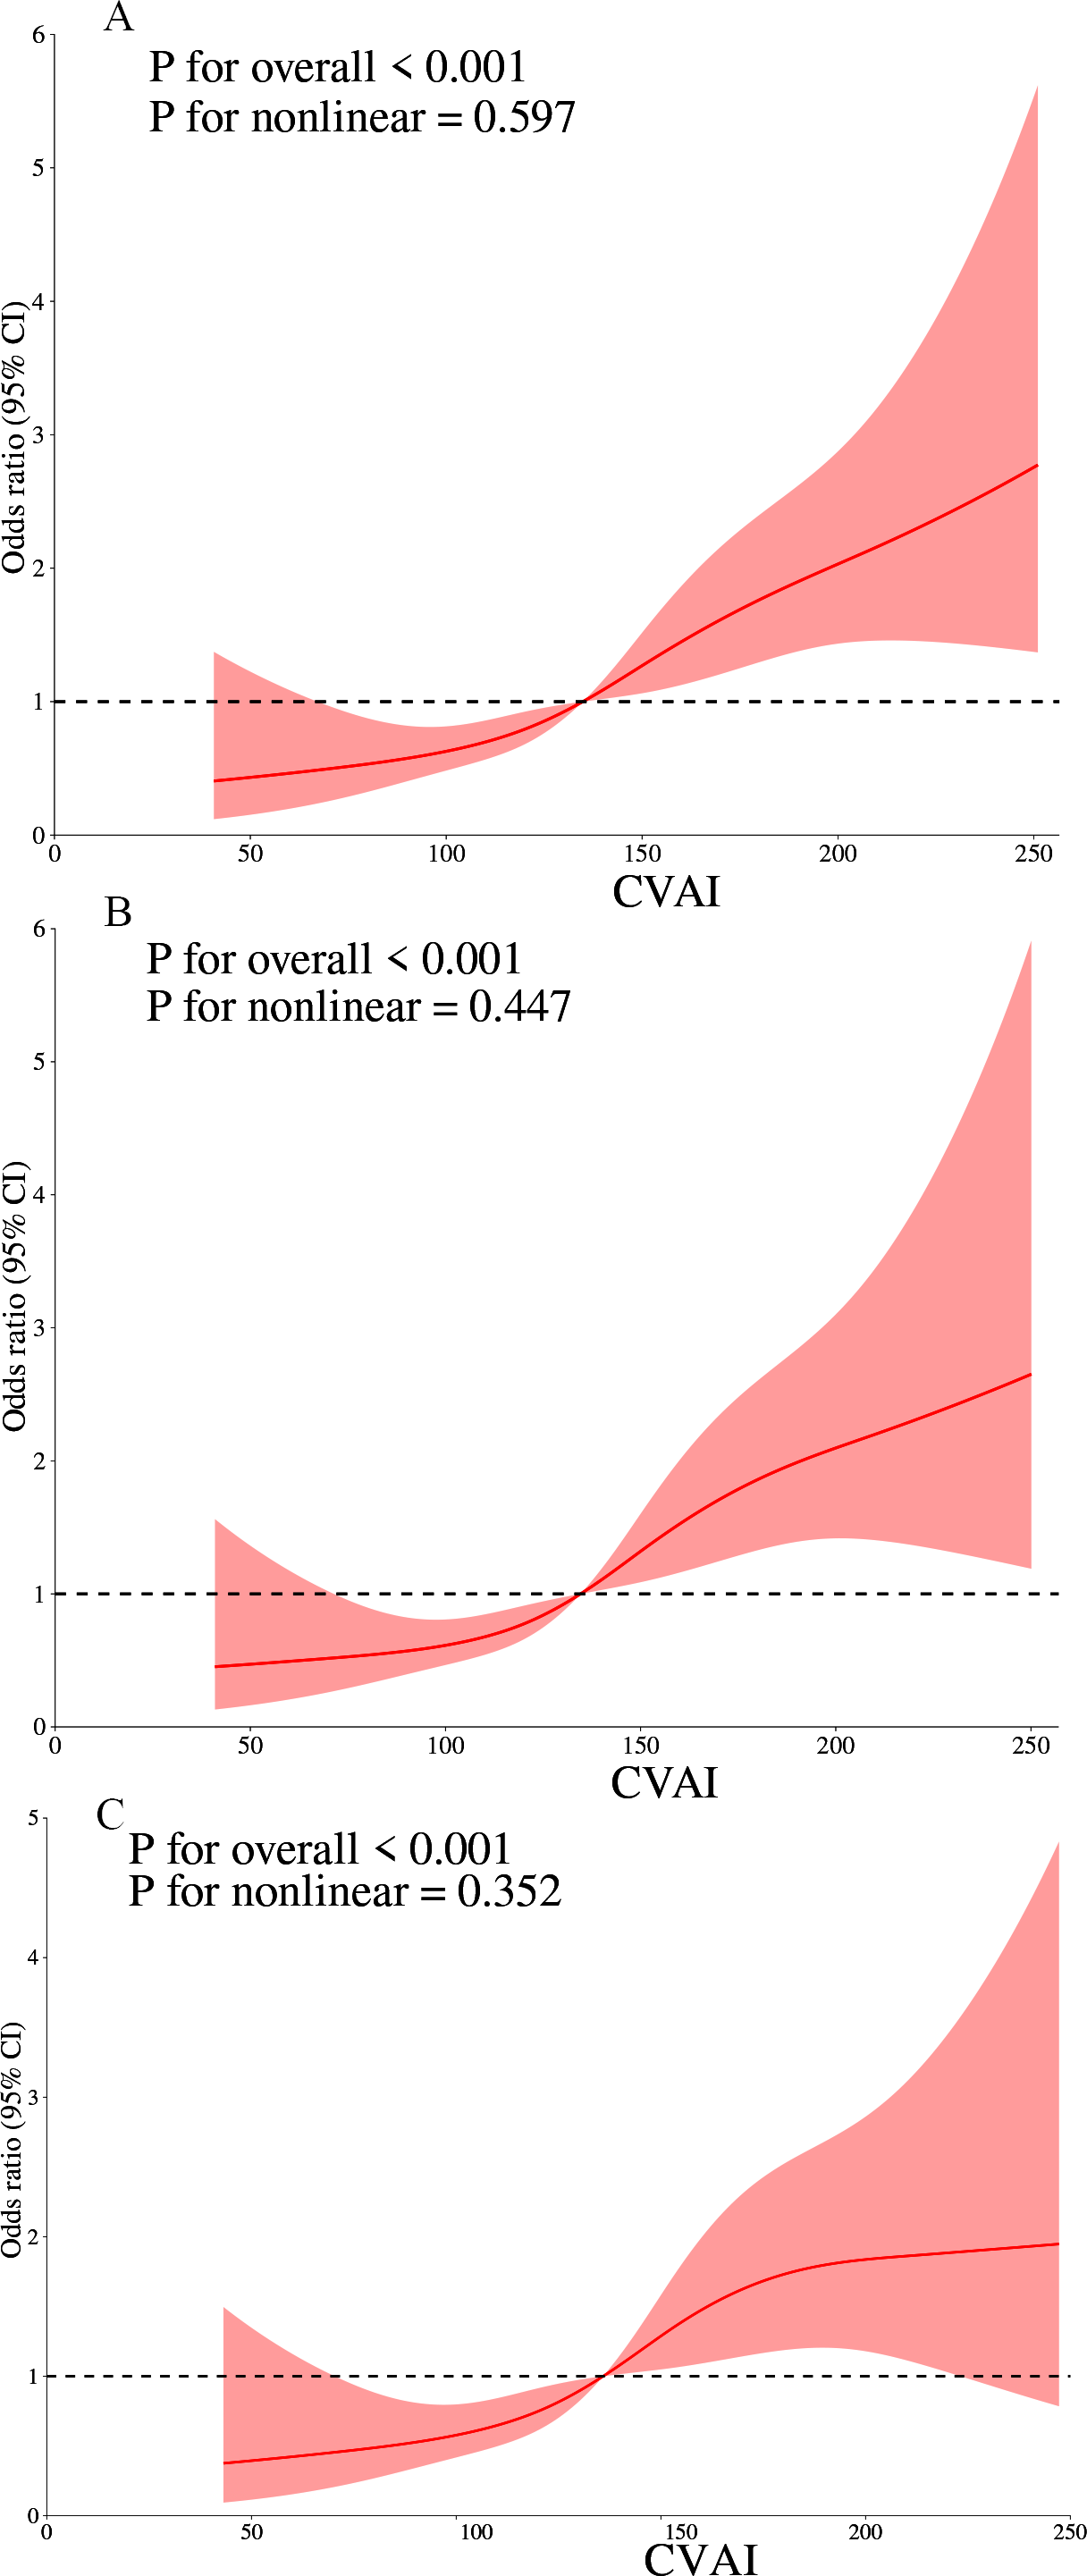
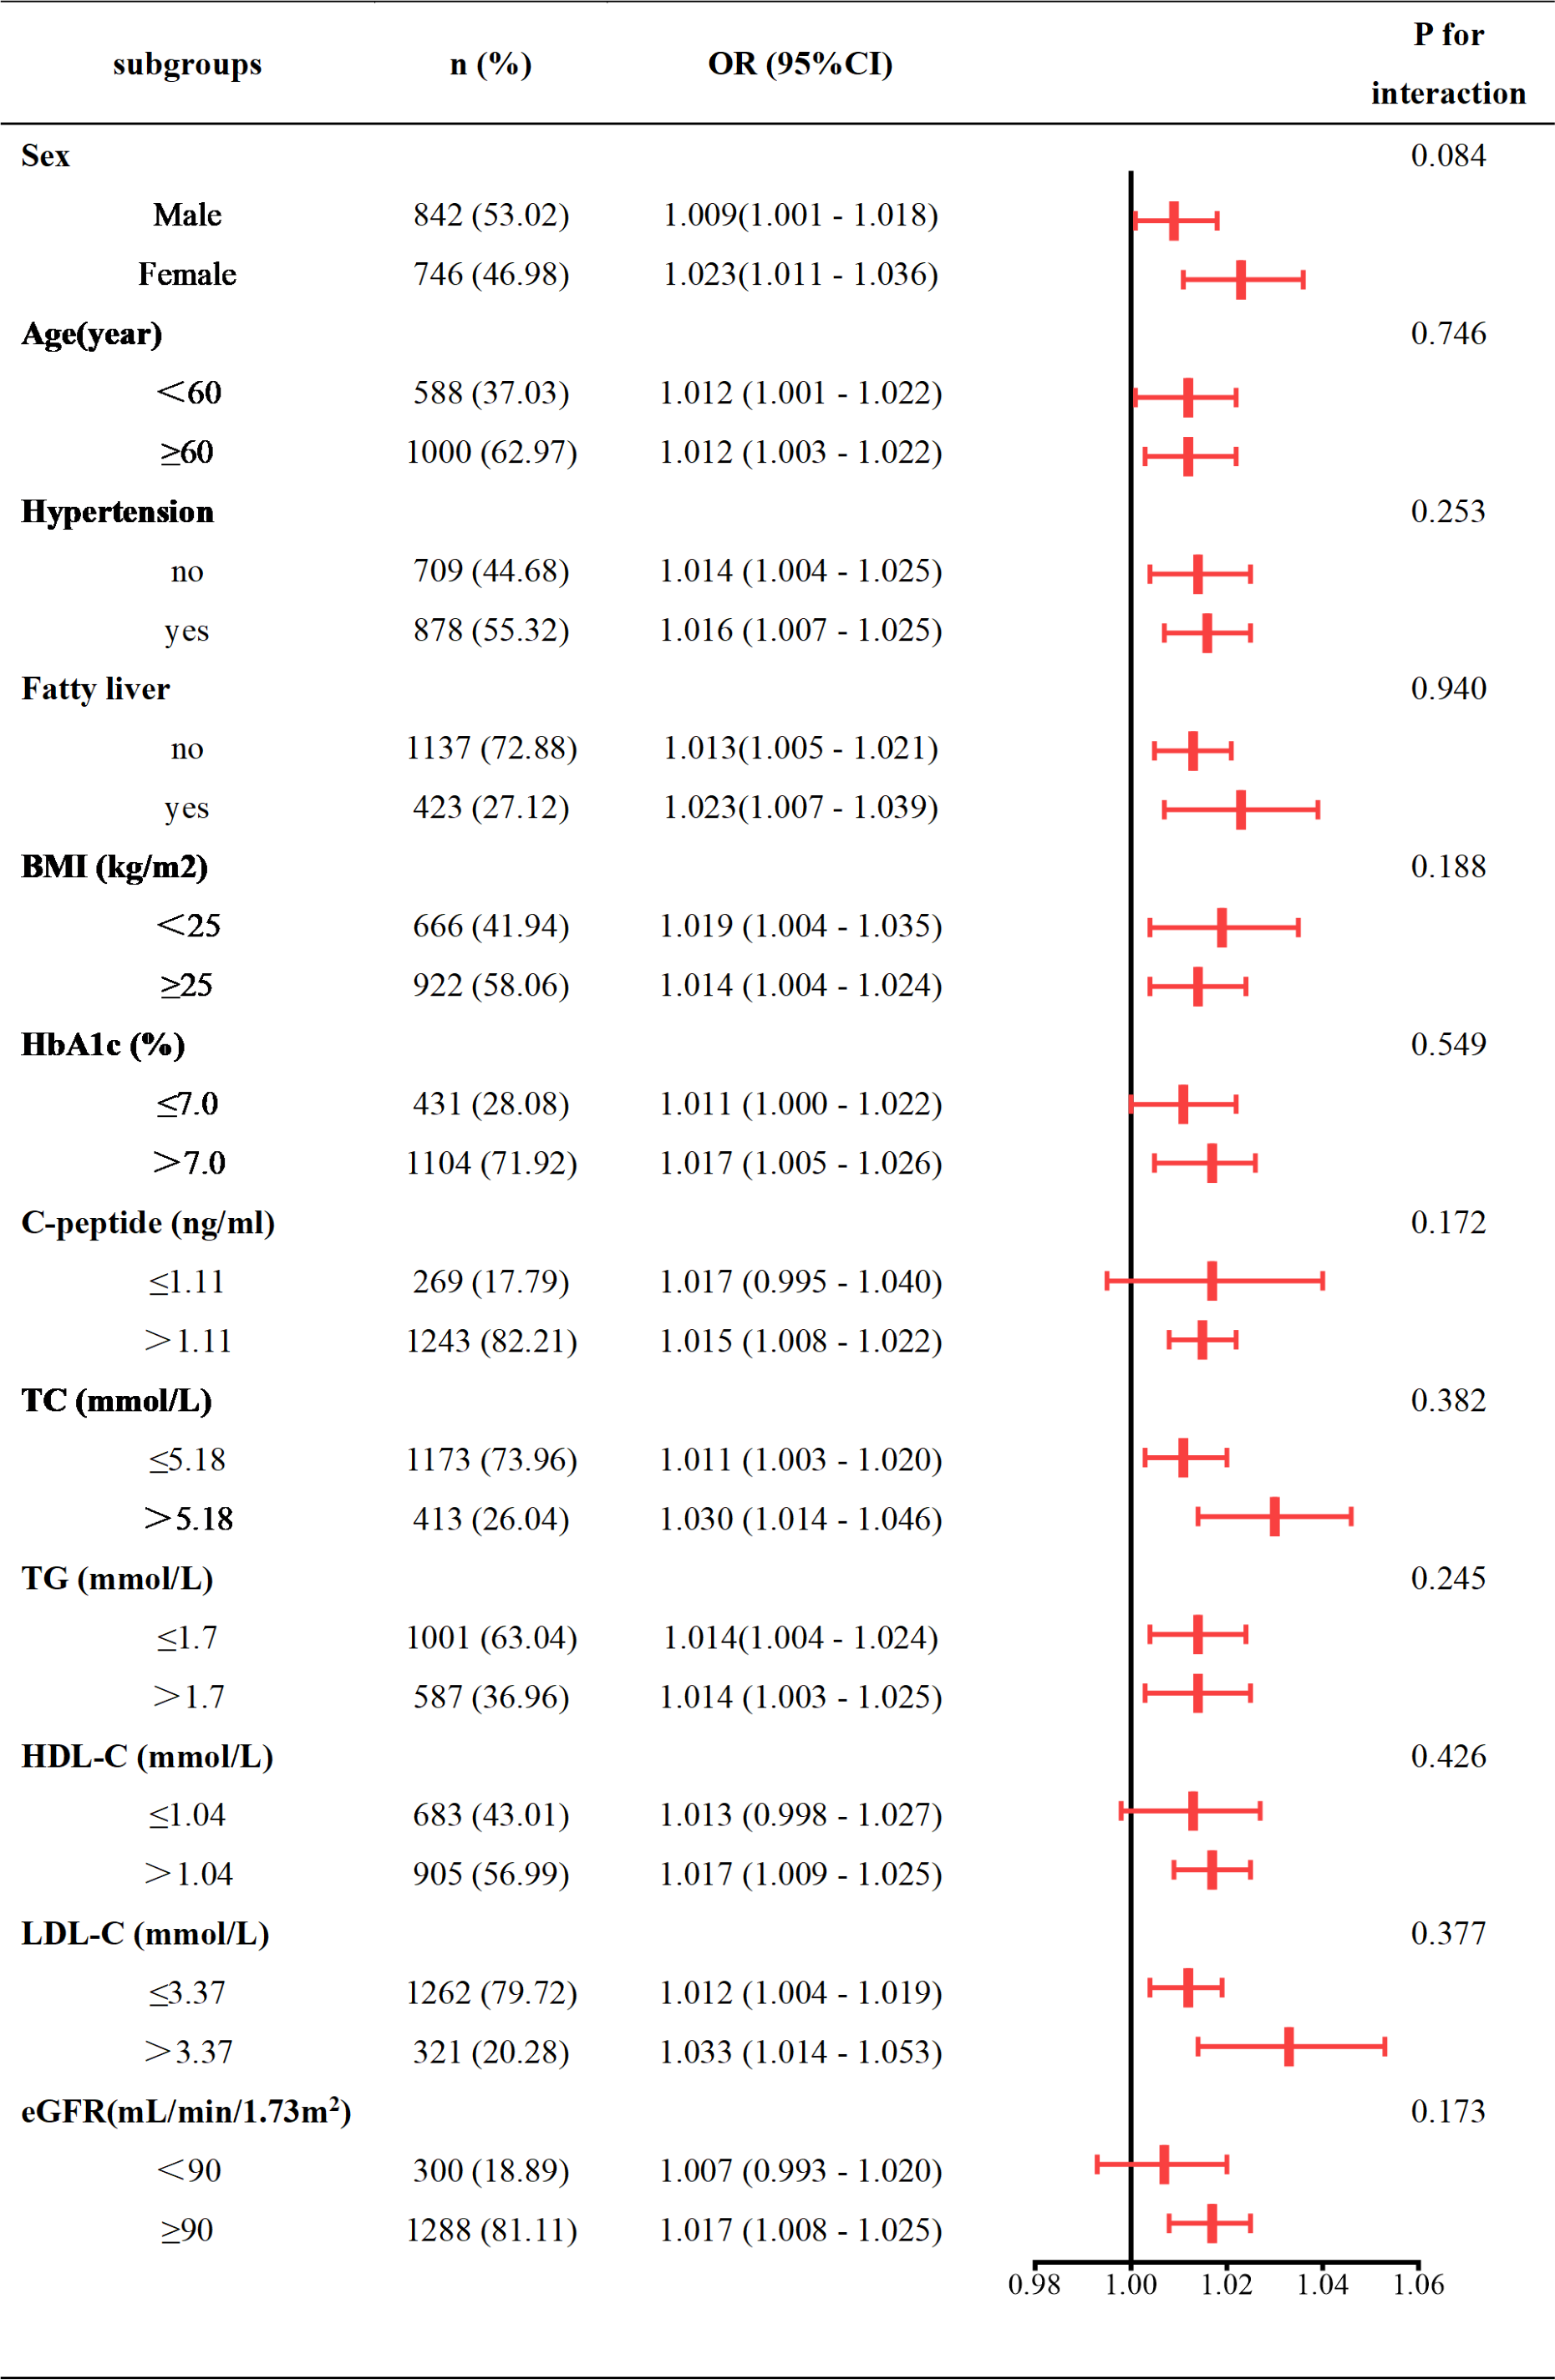
Subgroup analysis
Our subgroup analysis utilized stratification variables such as sex (male vs. female), age (<60 vs. ≥60 years), hypertension (Yes vs. No), fatty liver (Yes vs. No), BMI (<25 vs. ≥25 kg/m2), HbA1c (≤7% vs. >7%), Cp (≤1.11 vs. >1.11 ng/mL), TC (≤5.18 vs. >5.18 mmol/L), TG (≤1.7 vs. >1.7 mmol/L), HDL-C (≤1.04 vs. >1.04 mmol/L), LDL-C (≤3.37 vs. >3.37 mmol/L), and eGFR (<90 vs. ≥90 mL/min/1.73 m2). The results were subsequently illustrated using a forest plot (Fig. 3). Our analysis indicated a positive association between CVAI and hyperuricemia prevalence in type 2 diabetes patients across all subgroups. Interaction tests showed no significant interaction between CVAI and hyperuricemia with variables including sex, age, hypertension, fatty liver, BMI, HbA1c, Cp, TC, TG, LDL-C, HDL-C, and eGFR (Fig. 3).
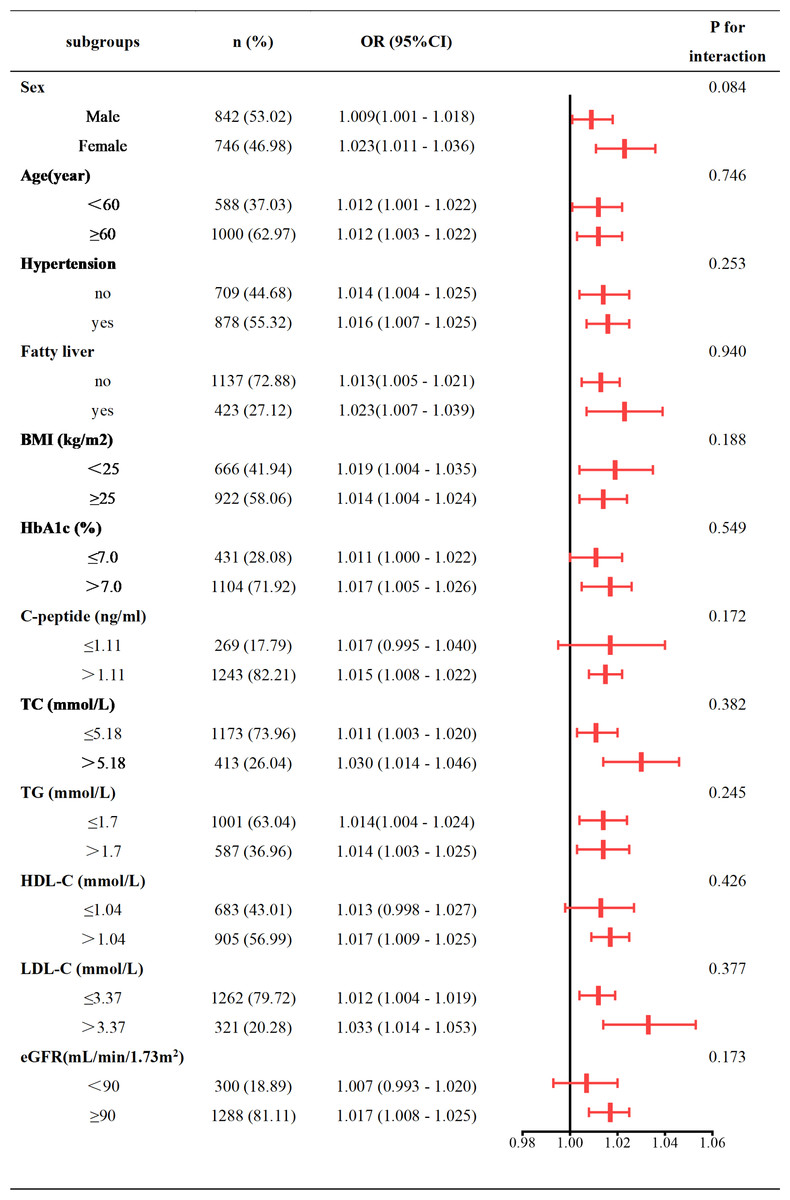
Figure 3: Subgroup analysis of CVAI and hyperuricemia.
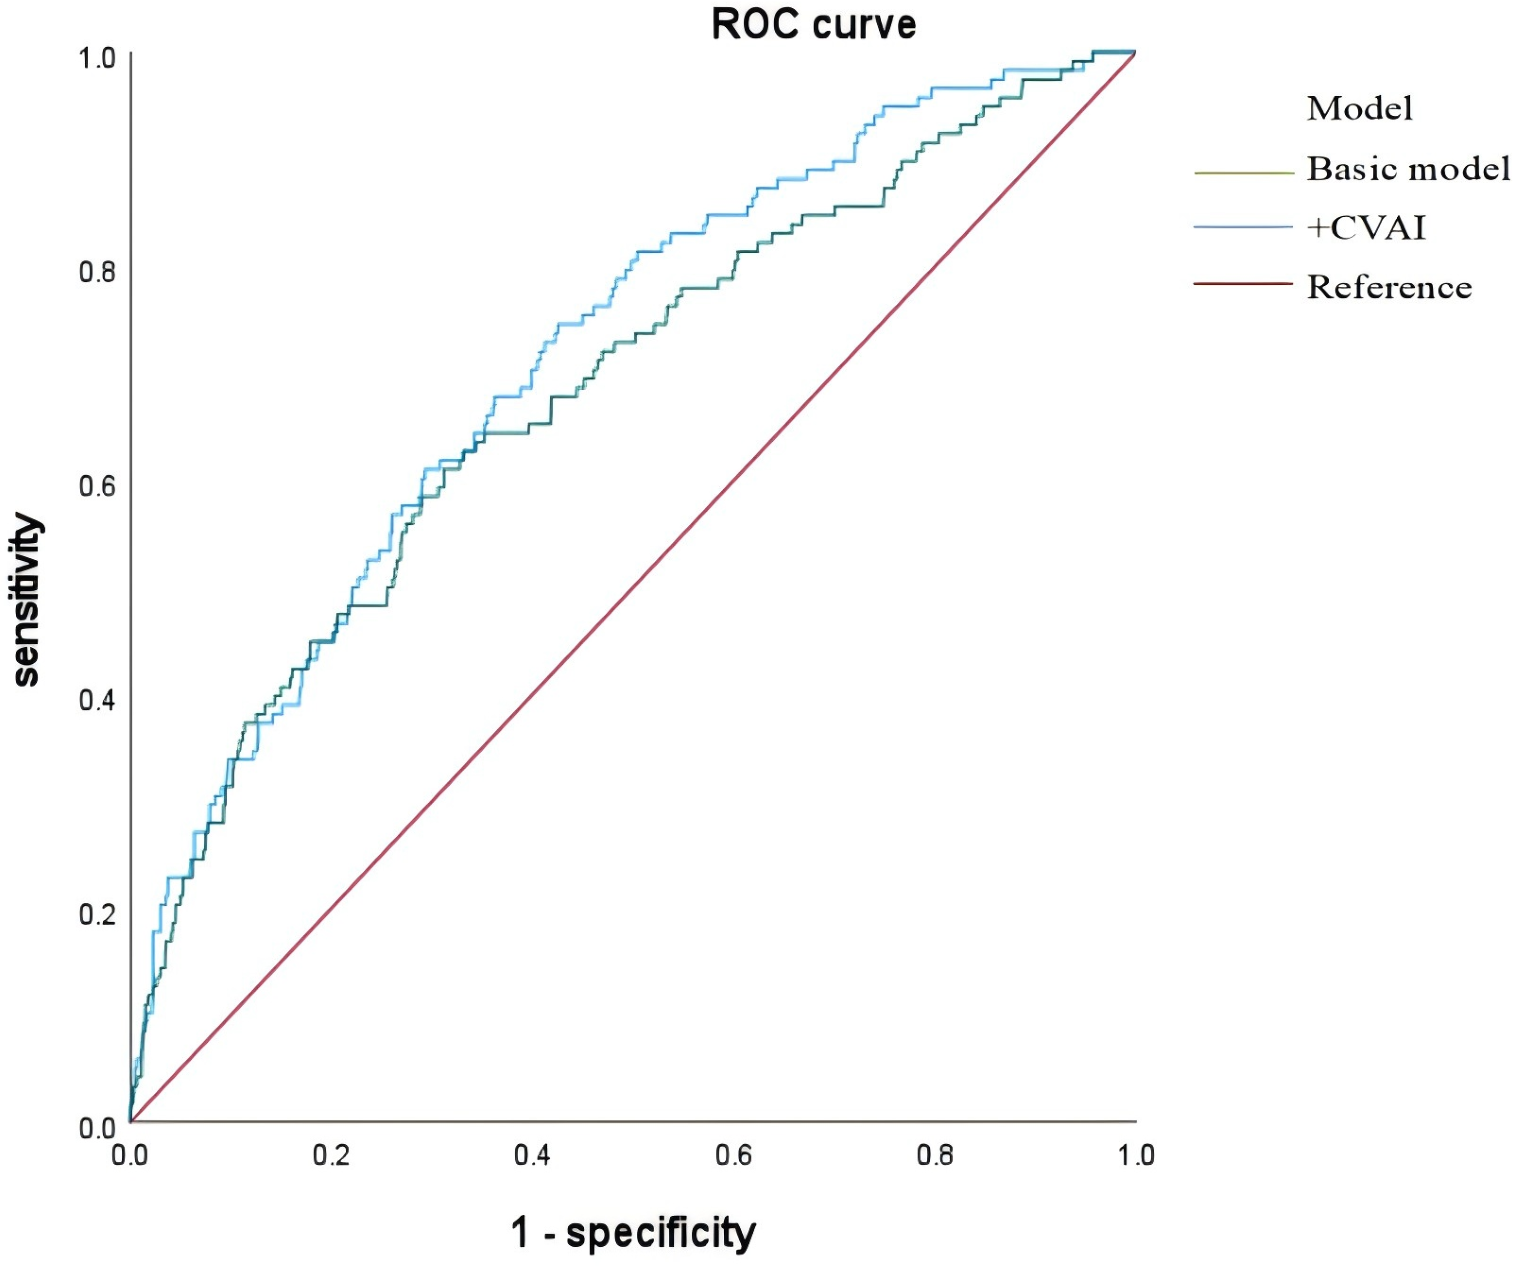
Predictive value of CVAI for hyperuricemia risk in type 2 diabetes
The basic model included variables such as sex, age, diabetes duration, smoking, drinking, SBP, DBP, HbA1c, FPG, Cp, UACR, eGFR, ALT, and AST. CVAI was integrated into the basic model, and both models’ diagnostic efficacy was evaluated using ROC curves. The area under the curve (AUC) initially measured 0.683 (95% CI [0.630–0.736]) and increased to 0.714 (95% CI [0.666–0.762]) after incorporating the CVAI (Fig. 4 and Table 4).
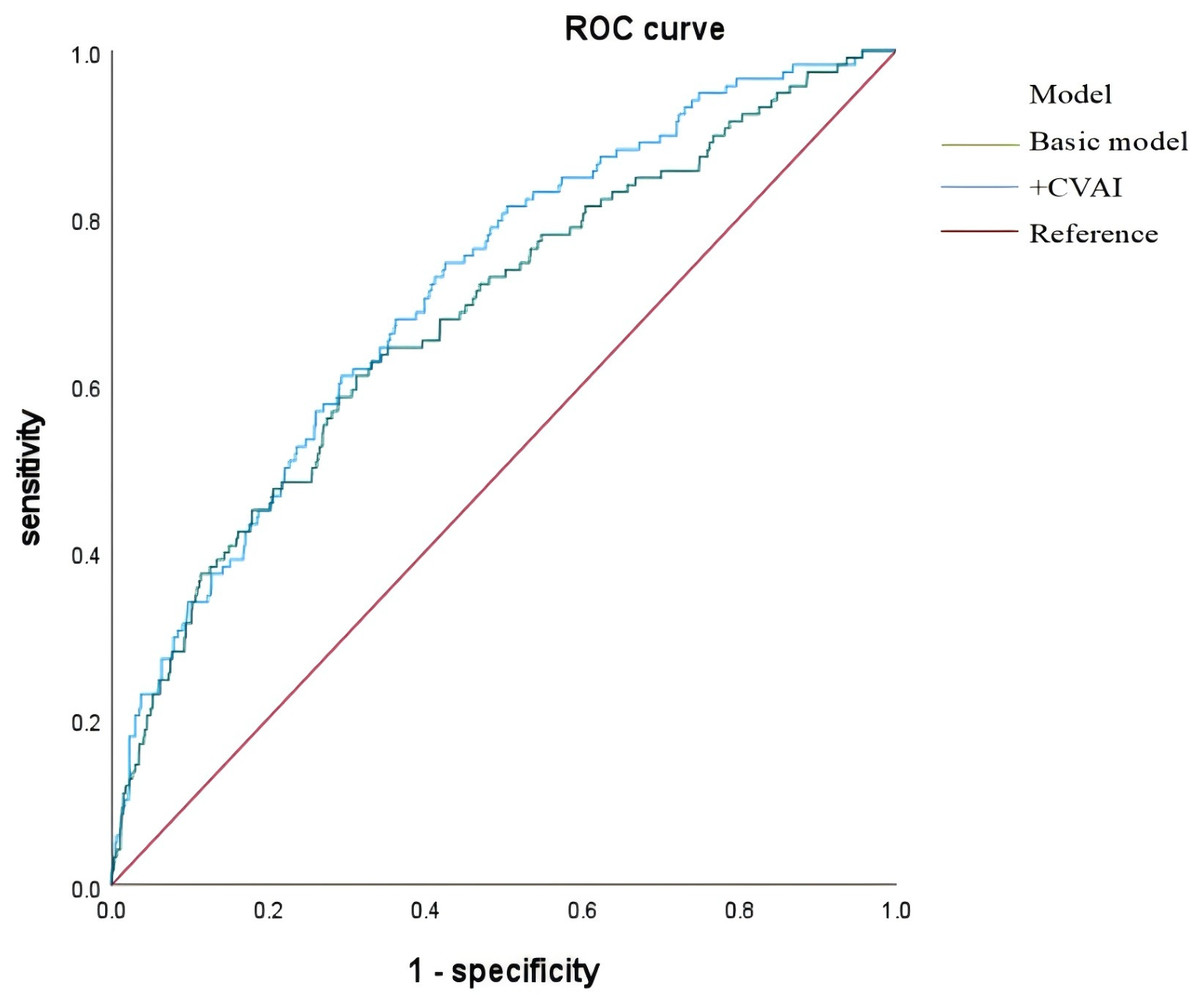
Figure 4: ROC curves of basic model and CVAI incremental model in predicting hyperuricemia risk in type 2 diabetes patients.
Discussion
Using data from hospitalized type 2 diabetes patients aged 18 to 80 at the Affiliated Hospital of Qingdao University, we identified a positive association between CVAI and asymptomatic hyperuricemia, even after adjusting for various covariates. A linear dose–response relationship was also observed. The associations between CVAI and hyperuricemia across different subgroups were consistent with those identified in the overall study population. Our findings indicate that the CVAI serves as a reliable predictor of hyperuricemia in individuals diagnosed with type 2 diabetes.
Prior studies have established a correlation between obesity and hyperuricemia, identifying obesity as the main risk factor. A nationwide Korean study of 17,753 participants from the 2016–2018 Korea National Health and Nutrition Examination Survey (KNHANES) found that BMI and WC were linked to increased hyperuricemia risk. The OR (95% CI) for BMI was 1.98 [1.69–2.32] in men and 3.26 [2.60–4.09] in women. The OR (95% CI) for WC were 2.21 [1.89–2.58] for men and 3.43 [2.69–4.37] for women (Bae et al., 2023). An analysis of NHANES data from 2007 to 2016, involving 22,712 participants aged 20 or older, indicated that diet has a relatively weak direct impact on hyperuricemia. BMI and WC significantly mediate the relationship between diet and hyperuricemia, accounting for 53.34% and 59.69% respectively (Wang et al., 2022). When BMI and WC are utilized as criteria to evaluate obesity, the specific type of obesity is not considered. An increase in BMI and WC may predominantly reflect an increase in subcutaneous adipose tissue (SAT). However, different types of obesity can lead to varying outcomes in hyperuricemia. Prior studies have shown a correlation between visceral adipose tissue (VAT) and serum uric acid levels in the general population, unlike other adipose tissue regions (Rospleszcz et al., 2020; Yamada et al., 2016; Hikita et al., 2007; Takahashi et al., 1997). Min Tao et al. showed that visceral obesity was independently linked to hyperuricemia, with an OR (95% CI) of 1.01 (1.00–1.03, p < 0.05). In contrast, subcutaneous adiposity was not associated with hyperuricemia, with an OR (95% CI) of 1.000 (0.993–1.007, p = 0.991) (Tao et al., 2023). Research indicates that individuals with a normal BMI and central obesity have a higher likelihood of hyperuricemia compared to those with a normal BMI without central obesity (men OR = 1.44, 95% CI [1.36–1.52]; women OR = 1.41, 95% CI [1.27–1.57]) (Shirasawa et al., 2020). Due to the high cost and complexity associated with VAT imaging measurements, various indices have been developed to effectively assess VAT areas. The CVAI serves as a robust indicator of visceral obesity within the Asian population. The calculation of CVAI incorporates variables such as age, WC, BMI, TG, and HDL-C. The procedure is facilitated by straightforward clinical methodologies and the ease of data acquisition.
| Variable | Cut-off | AUC | 95% CI | P value | J-Youden | Sensitivity | Specificity |
|---|---|---|---|---|---|---|---|
| Basic model | 0.100 | 0.683 | 0.630–0.736 | <0.001 | 0.298 | 0.610 | 0.688 |
| +CVAI | 0.083 | 0.714 | 0.666–0.762 | <0.001 | 0.321 | 0.746 | 0.575 |
Numerous studies have established the CVAI as a reliable predictor and risk factor for hyperuricemia. A nationwide prospective cohort study using data from the Chinese Health and Retirement Longitudinal Study (CHARLS) has identified a significant link between the CVAI and increased hyperuricemia rates in elderly Chinese individuals. This association persists even after adjusting for confounding variables such as age, sex, marital status, place of residence, educational, smoking, drinking, diabetes, dyslipidemia, cardiovascular disease, and hypertension, with an OR of 1.19 and a 95% CI ranging from 1.02 to 1.40. Additionally, it was found that 92.77 was an optimal CVAI cutoff value for predicting hyperuricemia, with a statistically significant linear relationship between incremental CVAI and hyperuricemia risk (Han, Li & Bai, 2024). A study conducted in Dalian demonstrated that an increased CVAI (OR:2.661, 95% CI [2.323–3.047]) significantly increase the risk of hyperuricemia among middle-aged and elderly individuals within the community of Dalian. The analysis revealed a J-shaped relationship between CVAI and hyperuricemia, with a cutoff value of 141.22 (Liu, Luo & Gao, 2024). This study aimed to investigate the relationship between CVAI and hyperuricemia in the general population. No research supports an association between CVAI and hyperuricemia in individuals with type 2 diabetes.
Our findings confirm that the CVAI is a risk factor for hyperuricemia in individuals with type 2 diabetes. The study indicates a linear relationship between CVAI and hyperuricemia. Several hypotheses have been suggested about how CVAI affects the development and occurrence of hyperuricemia. A study using genetic tools has shown that elevated serum uric acid levels result from increased adiposity rather than causing it (Lyngdoh et al., 2012). Secondly, an increase in VAT can enhance the release rate of free fatty acids and glycerol, as well as increase the absorption of circulating free fatty acids and triglycerides (Ibrahim, 2010). TG may promote uric acid overproduction by triggering classical free fatty acid metabolism (Matsuura et al., 1998; Seyed-Sadjadi et al., 2017). Liver fatty acid biosynthesis is linked to de novo purine synthesis, contributing to uric acid production (Lubawy et al., 2023; Nanjo et al., 2011). Prior research has demonstrated that dyslipidemia can result in impaired renal function, subsequently elevating uric acid concentrations (Fabregat, Revilla & Machado, 1987; Nakanishi et al., 2001). Thirdly, VAT may release inflammatory factors like tumor necrosis factor-alpha (TNF-α) and interleukin-6 (IL-6), causing systemic insulin resistance and vascular endothelial damage, which can lead to metabolic abnormalities and hyperuricemia (Hossain, Mukheem & Kamarul, 2015). It is important to highlight that an increase in visceral fat is associated with the downregulation of adiponectin and ghrelin, which has been shown to have an independent correlation with hyperuricemia (Luo & Liu, 2022; Van Gaal, Mertens & De Block, 2006). Additionally, excessive VAT can exert pressure on the kidneys, reducing blood flow to the renal medulla and decreasing uric acid excretion. Ectopic fat can worsen kidney injury by producing reactive oxygen species (ROS), causing mitochondrial dysfunction, and increasing endoplasmic reticulum stress (Hall et al., 2019).
This study, conducted in a real-world setting with a substantial sample size, is the first to evaluate the association between the CVAI and hyperuricemia in individuals with type 2 diabetes. Our research adheres to stringent entry criteria and maintains rigorous quality control standards. Nonetheless, the study’s limitations must be acknowledged. Firstly, the study population comprised hospitalized patients, which may limit the generalizability of our findings to other groups. Secondly, our subgroup analyses consistently showed a positive link between CVAI and hyperuricemia in type 2 diabetes patients, regardless of hypertension status. This finding indicates that CVAI did not exhibit interactions with all antihypertensive medications in the evaluation of hyperuricemia effects. Due to many missing values for these medications, they were excluded from the regression models, limiting our ability to assess the effects of individual antihypertensive drugs on hyperuricemia. Future studies require more detailed data for validation. Additionally, our cross-sectional design limits the ability to identify temporal trends in CVAI and hyperuricemia risk.
Conclusions
The study identifies the CVAI as an independent risk factor for hyperuricemia in type 2 diabetes patients. Given the asymptomatic nature of hyperuricemia, CVAI demonstrates potential as a predictive tool for the onset of hyperuricemia, thereby facilitating early intervention and mitigating its adverse health effects.