
Association between BMI and health-related physical fitness in adolescents with hearing impairment in China: a cross-sectional study
- Published
- Accepted
- Received
- Academic Editor
- Selina Khoo
- Subject Areas
- Kinesiology, Public Health
- Keywords
- BMI, Physical fitness, Hearing disorders, Adolescent
- Copyright
- © 2024 Cai et al.
- Licence
- This is an open access article distributed under the terms of the Creative Commons Attribution License, which permits using, remixing, and building upon the work non-commercially, as long as it is properly attributed. For attribution, the original author(s), title, publication source (PeerJ) and either DOI or URL of the article must be cited.
- Cite this article
- 2024. Association between BMI and health-related physical fitness in adolescents with hearing impairment in China: a cross-sectional study. PeerJ 12:e17995 https://doi.org/10.7717/peerj.17995
Abstract
Background
This cross-sectional study aimed to address a critical gap in the understanding of the association between body mass index (BMI) and physical fitness levels in adolescents with hearing impairment (HI) in China. This study investigated how different BMI levels impact the physical fitness index (PFI) of HI adolescents.
Methods
This study employed a physical fitness test for HI adolescents attending special education schools. The test included eight components: height, weight, 50-m sprint, standing long jump, sit and reach, endurance run, bent-knee sit-up (for girls), and pull-up (for boys). Test scores for each student were standardized by age and gender. Individual Z-scores were then calculated, and the sum of these Z-scores constituted the PFI. Logistic regression was used to analyze the relationship between BMI and PFI across different gender and age groups. Statistical significance was set at P < 0.05.
Results
The linear regression model showed an inverted U-shaped relationship between BMI and PFI. At the same BMI level, boys exhibited superior physical fitness compared to girls with the same BMI (P < 0.05). Statistically significant differences in PFI levels were observed between normal-weight and obese males, as well as between underweight and obese boys (P < 0.05). In the 13–15 and 16–18 age groups, the increase in BMI has a greater impact on boys PFI than on girls.
Conclusions
Adolescents with HI generally demonstrated good physical fitness. Compared to individuals with normal weight, those who were underweight, overweight, or obese exhibited lower levels of physical fitness. Future interventions should focus on adolescents with HI with abnormal BMI.
Introduction
Maintaining good physical health is crucial for improving the quality of life. A key indicator of physical health is physical fitness (Diaconașu et al., 2023). Physical fitness is closely related to the healthy growth and development of middle school students (Chen, 2017), which generally includes cardiorespiratory endurance, flexibility, muscle strength and explosive, agility, speed, body composition, among others. Studies have shown that the physical fitness of adolescents is positively correlated with multiple factors, including cognition, mental health status, weight status, academic achievement scores, and bone health (Donnelly et al., 2016; Hay et al., 2012; Chaddock et al., 2012). Physical fitness can bring about a far-reaching influence on students’ achievement of results in terms of physical condition. Studies have shown that physical inactivity could lead to poor physical fitness which was a key factor could account for multiple chronic diseases (Booth, Roberts & Laye, 2012). Therefore, understanding one’s physical fitness level can enable individuals to behave properly and keep fit.
China is facing a significant public health issue with the trend of overweight and obesity among school-aged children on the rise (NCD Risk Factor Collaboration (NCD-RisC), 2017). In recent years, sedentary lifestyles have become increasingly common, prompting scholars to express concern about the lack of physical activity among people. A study conducted by Wang et al. (2017) among Chinese adolescents revealed a high prevalence of insufficient physical activity among students aged 9 to 22, with less than 1 h of physical activity per day. As a global epidemic, obesity had significant implications for people’s health, which not only serious impacted individuals’ overall health, but led to various metabolic and psychological problems, such as cognitive dysfunction, metabolic syndrome and cardiovascular diseases (Piché, Tchernof & Després, 2020; Chooi, Ding & Magkos, 2019). Abnormal or excessive fat accumulation that poses a health threat, which is the WHO definition of obesity and overweight. Body mass index (BMI), calculated by dividing an individual’s weight in kilograms by the square of their height in meters, is a straightforward metric employed to assess overall body fatness (World Health Organization, 2024).
Understanding the impact of obesity on major health outcomes is now more pressing than ever. Research indicates that BMI is a significant factor affecting physical fitness: Hulens et al. (2001) support the idea that higher fat mass in the obese individuals allows their extensor muscle group to bear greater training loads, resulting in higher skeletal muscle tension levels compared to non-obese individuals. However, due to the significantly elevated levels of adipose tissue in the obese population, acting as an endocrine organ, the secretion of large amounts of hormones and inflammatory cytokines can stimulate muscle protein degradation, leading to adverse consequences such as skeletal muscle atrophy and a decrease in muscle protein synthesis (Tomlinson et al., 2016). Research examining the correlation between BMI and physical fitness indicators such as aerobic endurance, explosive power, and speed suggests a significant negative correlation between BMI and each aspect of physical fitness (Tambalis et al., 2013). Additionally, data from the 2003–2009 National Health Interview Survey (NHIS) indicated an association between BMI and adverse outcomes in specific populations. Stratification of disability prevalence by BMI reveals that among obese adults, with a prevalence of 25.4%, 41.7% reported disabilities. In comparison, among adults with a healthy weight, the disease prevalence is 26.7%, while among overweight adults, the prevalence of disease is 28.5%, 26.7% and 28.5% respectively (Armour et al., 2013). A review suggests that the prevalence of overweight and obesity among children and adolescents with disabilities is significantly higher, nearly twice as high as that of their non-disabled peers (Reinehr et al., 2010). Given the recognized adverse effects of obesity, the obesity status of special populations deserves full attention.
Hearing impairment (HI) encompass varying degrees of permanent hearing impairment in both ears due to a range of factors. Such impairments hinders individual’s ability to perceive environmental noises and speech, thus affecting their daily lives and social interactions (Chang et al., 2021). In China, the classification of hearing impairment aligns with the World Health Organization’s 1997 classification criteria. The severity of the impairment is categorized into four levels based on average hearing loss: Grade 1 (≥81 dB HL), Grade 2 (81–90 dB HL), Grade 3 (61–80 dB HL), and Grade 4 (41–60 dB HL). It is noteworthy that Grade 1 refers to profound HI and Grade 2 refers to severe HI (Armour et al., 2012). In society, HI people constitute a minority group with relatively limited access to public health resources. Over the last few decades, research on the physical fitness of people with disabilities hasgradually gained attention.
In China, adolescents with mild to moderate impairments generally attend compulsory education schools, where they can effectively participate in physical education requirements with the assistance of hearing aids. In contrast, those with profound hearing impairments only attend special education schools. Given the challenges in conducting scientifically physical fitness assessments many special education schools have not established systematic physical fitness evaluations. For socially vulnerable groups like adolescents with HI, clarifying the relationship between their BMI and physical fitness could provide healthcare professionals with a convenient means to understand individuals’ overall health status. This, in turn, could assist healthcare providers in offering risk predictions and intervention recommendations during initial health assessments. Furthermore, it aids in better understanding the physiological, metabolic, and behavioral mechanisms underlying the relationship between BMI and levels of physical fitness, which is crucial for comprehending their overall health conditions.
However, the current evidence has notable limitations: many studies rely on self-reported BMI data, which may not accurately reflect true BMI levels (World Health Organization, 2019). Previous studies have discussed the relationship between BMI and several components of physical fitness in children and adolescents (Karppanen et al., 2012; Cho & Kim, 2017). However, physical fitness is influenced by multiple factors (Huang et al., 2023b; Lv et al., 2023), and there are associations between factors across multiple dimensions and changes in physical fitness, particularly significant differences in body composition among individuals of different races at the same BMI level (INTJSSH, 2018). Therefore, it remains unclear whether BMI could comprehensively reflect an individual’s physical fitness and health condition. Moreover, the non-linear correlation between BMI and physical fitness was seldom investigated. In summary, there is a notable lack of research on BMI and PFI among adolescents with HI. This cross-sectional study could effectively address this information gap.
This cross-sectional study aimed to investigate the physical fitness of children and adolescents with profound or severe hearing impairment (Grade 1 or Grade 2 deafness) and analyzed the relationship between their BMI and physical fitness.
Participants and methods
Participants
This cross-sectional study was conducted during the April to June 2023 in China. A three-stage cluster sampling method was used to sample adolescents with grade 1 or grade 2 hearing disability, from 15 special education schools in 12 administrative regions, including Beijing, Shenyang, Chifeng, Xi’an, Qingdao, Baoding, Taiyuan, Kunming, Zhongshan, Xiangyang and Shiyan. A total of 305 secondary school students age 13–18 years (16.24 ± 1.36 years) participated in the physical fitness test. After excluding the data of the incomplete participants, the data of 304 participants (177 boys and 127 girls) were finally included for analysis (16/320; <1% of total sample). The required sample size for the study is calculated using G*Power software. Assuming a medium effect size of 0.25 (Faul et al., 2007), a statistical power of 1−β = 0.92, and a significance level of α = 0.05, the analysis indicates that at least 180 participants are needed. The actual effective sample size of this experiment meets the study’s requirements. Sports Science Experiment Ethics Committee of Beijing Sport University approval to carry out the study, and the approval number is 2023297H.
Measurements
The legal guardians or parents of the students were contacted by teachers from the special education school, and a sign language teacher thoroughly explained the informed consent form to the minor participants. The minors provided their assent, and consent was obtained from their parents or legal guardians. To ensure the safety and accuracy of the measurement, the physical fitness test was carried out by the laboratory staff of the Key Laboratory of the Ministry of Education of Sports and Physical Health by following standard operating procedures. Physical fitness tests was assessed using the Chinese National Student Physical Fitness Standard (CNSPFS) battery, which contains six tests to measure different physical fitness of middle school students. The retest reliability of all assessments employed in this study were ICC > 0.90 (Yi et al., 2019). Furthermore, the test-retest reliability of these six assessments when administered to the HI population ranged from good to excellent (all intraclass correlation coefficients [ICC] >0.75), and they demonstrated high feasibility (completion rate > 90% (Huang et al., 2023a)).
Procedures
All physical tests were performed for boys and girls as follows.
BMI
BMI was selected as a surrogate assessment of obesity level. Participants’ height was measured barefoot (measured to the nearest 0.1 cm), and weight (kg) was measured using a calibrated XindongHuateng scale. Based on the measure results, BMI was calculated by dividing a person’s weight in kilograms by the square of their height in meters. All participants were received the BMI assessment.
50-m sprint
The 50-m sprint test was administered on a flat 50 m straight indicating track, where the participants run at the fastest speed on seeing the starting signal, and recorded the result in seconds (measured to the nearest 0.1 s).
Standing long jump
Participants stood behind the starting line marked on the ground with two feet apart and at a natural distance. They were asked to take off with both feet and jump forward as far as they could. Recorded the distance in meters from the starting line to the heel of foot nearest the starting line. Took the test twice and the better score was retained.
Sit and reach
Participants were instructed to take a sitting position on a cushion with their knees fully extended, heels together, toes apart, and feet resting on vertical supports. Took the test twice and the better score was retained (measured to the nearest 0.1 cm).
Endurance run
Boys were tested in the 1,000-m and girls were tested in the 800-m. Participants were instructed to run the required distance as quickly as possible and were allowed to walk or stop during the test. Recorded the running performance in seconds (measured to the nearest 0.1 s).
Bent-leg sit-up (girls)
Participants were instructed to perform sit-ups as many times as possible within a minute on seeing the starting signal. They were instructed to lay on a mat with their legs bent at 90 degrees and their fingers interlocked behind their heads, raised their upper body until the elbow touched the knee. Then the participant returned to the starting position and repeated the sit-up motion. The final score recorded was the number of successful completions.
Pull-up (boys)
Participants jumped up, grabbed the overhead horizontal bar and then extended their arms straight. They were instructed to use arm strength to pull their bodies up until their chins were above the horizontal bar, then lower their bodies with their arms extended. The final score recorded was the number of successful completions.
After the test score of each indicator was measured, the five test indicators of each student were standardized based on age and sex. The Z score was calculated for each student and the sum of Z scores is the physical fitness index (PFI) (Huang & Malina, 2007). The formula for calculating Z-score is as follows: Z-score = (measured value of each indicator-average value of each indicator)/Standard deviation of each group of indicators. Shorter test times for running events (50-m sprint and 1,000 m/800 m distance run) indicated better performance on the test and higher scores, as opposed to the other four tests. The Z-score of running took the opposite value. Therefore, PFI (girls) = Z sit and reach + Z standing long jump + Z bent-leg sit-up-Z 50-m sprint-Z 800 m distance run, PFI (boys) = Z sit and reach + Z standing long jump + Z Pull-up-Z 50-m sprint-Z 1,000 m distance run. The z-scores were computed based on the specific participant data from this research cohort.
The higher the PFI value, the better the physical fitness. In this study, the PFI score was categorized into four groups with −5, 0 and 5 as the limits (Yang et al., 2022). Besides, teenagers were divided into two age groups, 13 to 15 years old (late puberty for girls and prime puberty for boys) and 16 to 18 years old (late puberty for both girls and boys). Students were categorized into four groups based on their BMI values, following the World Health Organization (WHO) guidelines: underweight (<18.5 kg/m2), average weight (18.5–23.9 kg/m2), overweight (24–27.9 kg/m2), and obese (≥28 kg/m2) (World Health Organization, 2007).
Data analysis
Data were collected and analyzed using Excel and SPSS 27.0 software (SPSS Inc., Chicago, IL, USA), with a statistically significant difference of P < 0.05. All data analysis was stratified by gender and age. To evaluate normality, the Kolmogorov-Smirnov (K-S) test was applied, followed by an independent sample T-test for variables conforming to a normal distribution. For those variables deviating from a normal distribution, nonparametric tests were employed to elucidate their characteristics. Quantitative data were summarized through the use of mean and standard deviation (x ± s). Additionally, Chi-square (χ²) tests were harnessed to gauge the prevalence of overweight and obesity among students. And employed frequency and composition ratios to describe the distribution of students’ PFI and utilized median and interquartile range to describe the PFI of students in different age groups. The relationship between the PFI and BMI among students of different ages was analyzed using the Spearman correlation analysis. For comparing the PFI across students of different genders and ages grouped by BMI, one-way analysis of variance (ANOVA) or the Mann-Whitney U test was utilized. A linear regression model formulated in STATA v15.0 software package (College Station, TX, USA) was employed to ascertain the PFI trends across different groups. Visual depictions of these PFI patterns were crafted using the Python programming language.
Results
This section described the average levels of various physical fitness indicators for boys and girls of different ages. Tables 1 and 2 present the descriptive statistics. From the data, boys demonstrated longer standing long jump distances and faster 50 m sprint times than girls. However, boys had inferior scores in seated body forward flexion compared to their female counterparts. On average, girls completed the distance run in 284.1 s, while boys took 295.1 s. Girls, on average, performed 32 sit-ups, whereas boys averaged four pull-ups.
| Boys (N = 177) | Girls (N = 127) | |||||
|---|---|---|---|---|---|---|
| Age group (yr) | – | 13–15 (n = 47) | 16–18 (n = 130) | – | 13–15 (n = 43) | 16–18 (n = 84) |
| Height (cm) | 172.89 ± 7.77 | 169.90 ± 9.09 | 173.97 ± 6.96 | 162.13 ± 5.84 | 161.81 ± 5.94 | 162.29 ± 5.81 |
| Weight (kg) | 65.03 ± 14.69 | 64.01 ± 16.62 | 65.39 ± 13.98 | 57.92 ± 13.44 | 56.17 ± 13.01 | 58.82 ± 13.50 |
| BMI (kg/m2) | 21.70 ± 4.50 | 22.10 ± 5.32 | 21.56 ± 4.18 | 21.92 ± 4.34 | 21.33 ± 4.33 | 22.23 ± 4.34 |
| 50-m sprint (s) | 8.13 ± 1.36 | 8.41 ± 1.22 | 8.03 ± 1.40 | 9.75 ± 1.41 | 9.47 ± 1.48 | 9.90 ± 1.36 |
| Standing long jump (cm) | 199.30 ± 29.94 | 183.74 ± 31.29 | 204.92 ± 27.46 | 155.63 ± 54.47 | 165.70 ± 88.21 | 150.48 ± 22.06 |
| Sit and reach (cm) | 7.41 ± 9.49 | 5.43 ± 7.73 | 8.03 ± 1.40 | 12.12 ± 8.63 | 11.52 ± 8.99 | 12.43 ± 8.48 |
| Endurance run (s) | 295.13 ± 71.40 | 339.00 ± 94.85 | 279.27 ± 52.85 | 284.12 ± 51.23 | 287.34 ± 59.09 | 282.46 ± 47.01 |
| Bent-leg sit-up (girls) | – | – | – | 32.27 ± 8.82 | 31.67 ± 8.74 | 30.87 ± 8.90 |
| Pull-up (boys) | 3.59 ± 4.11 | 1.89 ± 3.37 | 4.20 ± 4.20 | – | – | – |
| Gender | N | PFI score (%) | |||
|---|---|---|---|---|---|
| <−5 | −5~<0 | 0~<5 | ≥5 | ||
| Boys | 177 | 15 (8.5) | 66 (37.3) | 87 (49.2) | 9 (5.1) |
| Girls | 127 | 5 (3.9) | 58 (45.7) | 54 (42.5) | 10 (7.9) |
| Total sample | 304 | 20 (6.6) | 124 (40.8) | 141 (46.4) | 19 (6.3) |
The following data categorizes the physical fitness of hearing-impaired adolescents into different levels based on the classification of PFI. The results indicate that the majority of hearing-impaired adolescents fall within the PFI range of −5 to 5, with the highest proportion in the 0 to <5 group, totaling 141 individuals (46.4%). Following this group is the −5 to <0 range, comprising 124 individuals (40.8%).
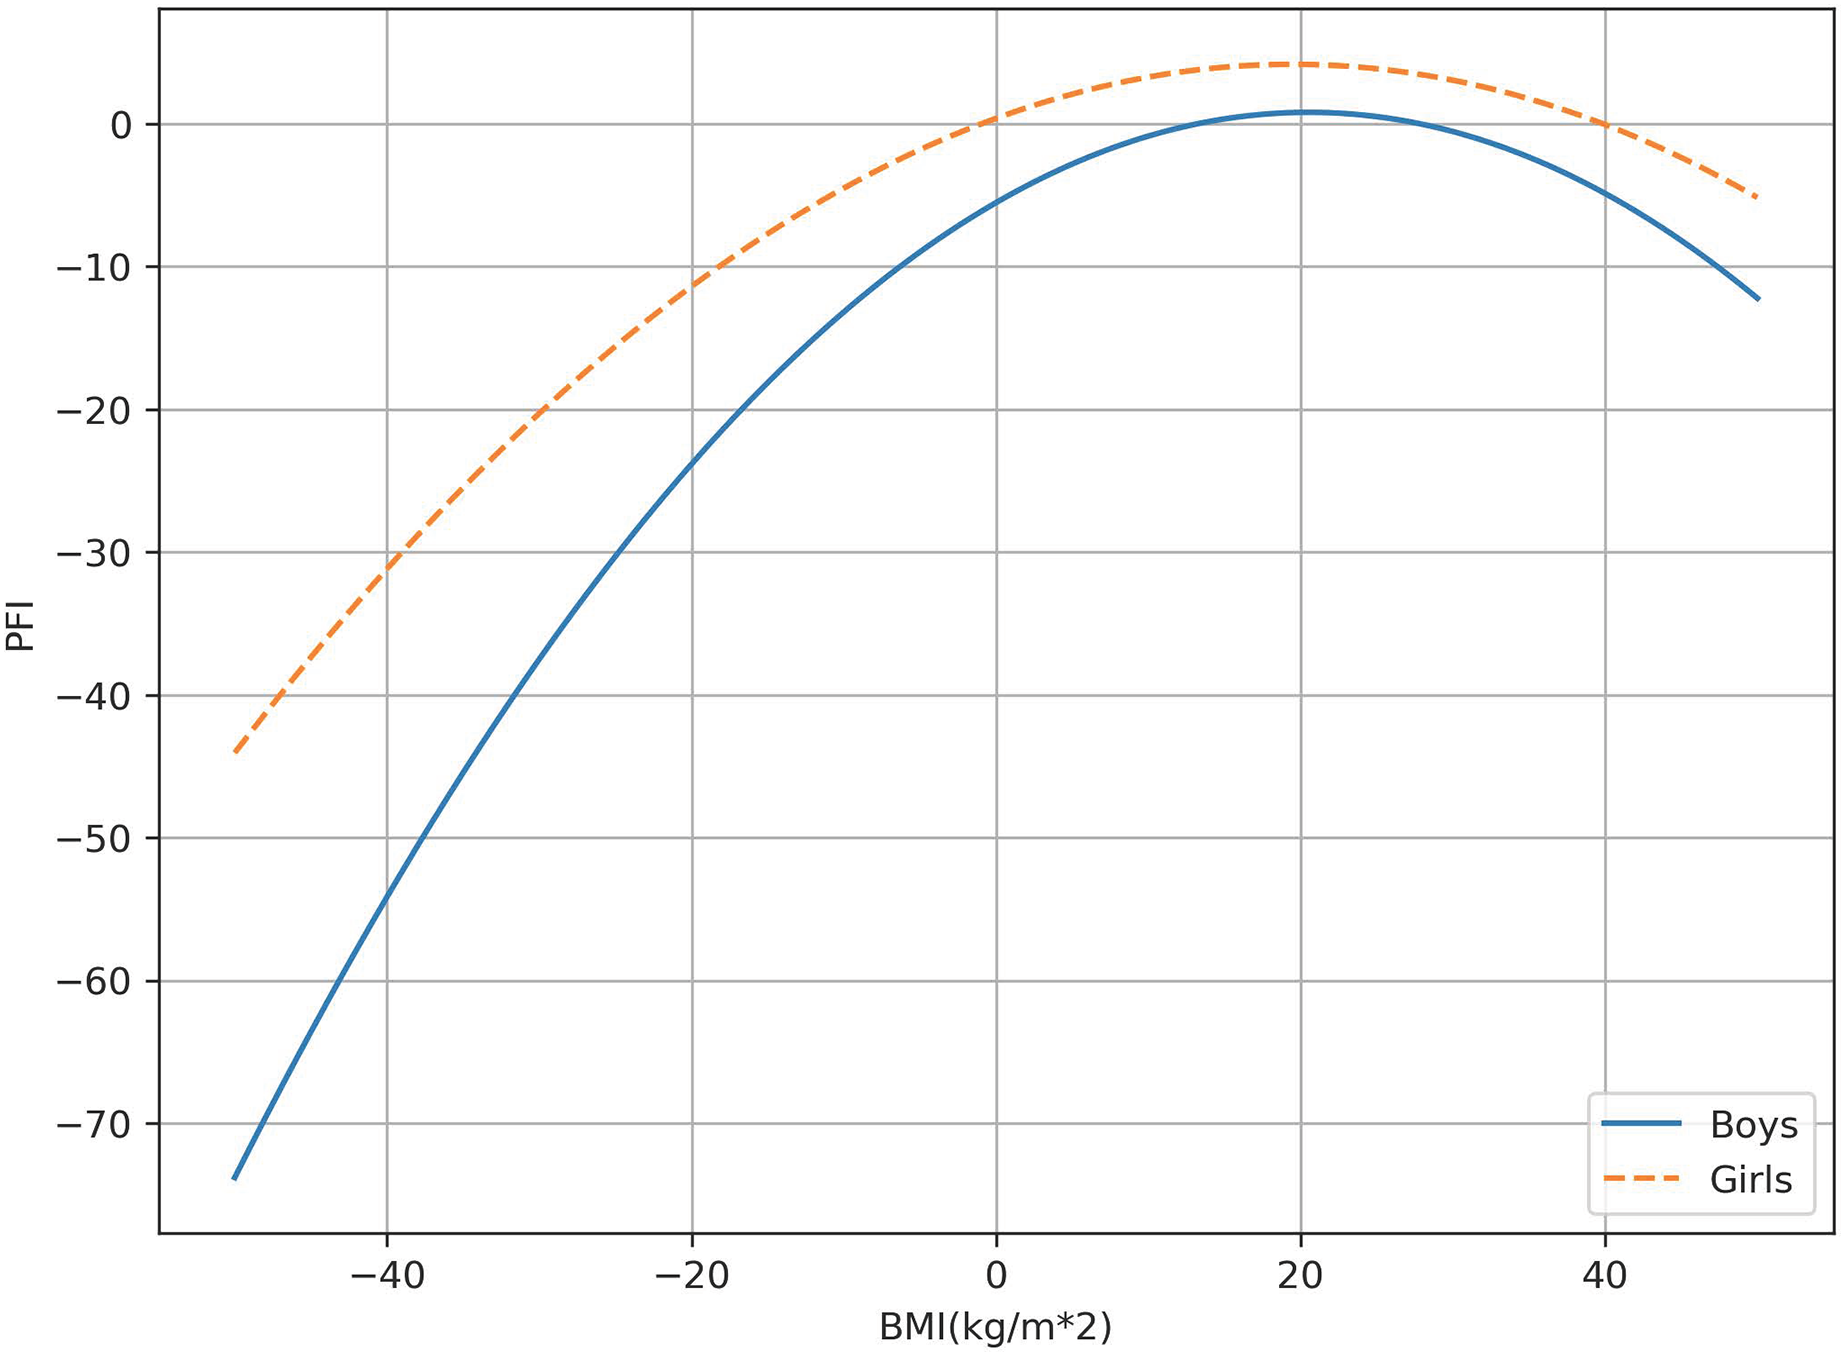
The following section described the relationship between PFI and BMI among different gender groups. The results of the differential analysis show that among boys aged 13–15, the PFI of boys with normal BMI is significantly higher than that of overweight boys (P < 0.05). In boys and girls of all age groups, the average PFI score of those with normal BMI is higher than the other three BMI groups. These differences vary with age and gender, and the effect sizes obtained from the t-tests also vary in magnitude (Fig. 1). Overall, the PFI values for both boys and girls show a trend of increasing and then decreasing with increasing BMI values.
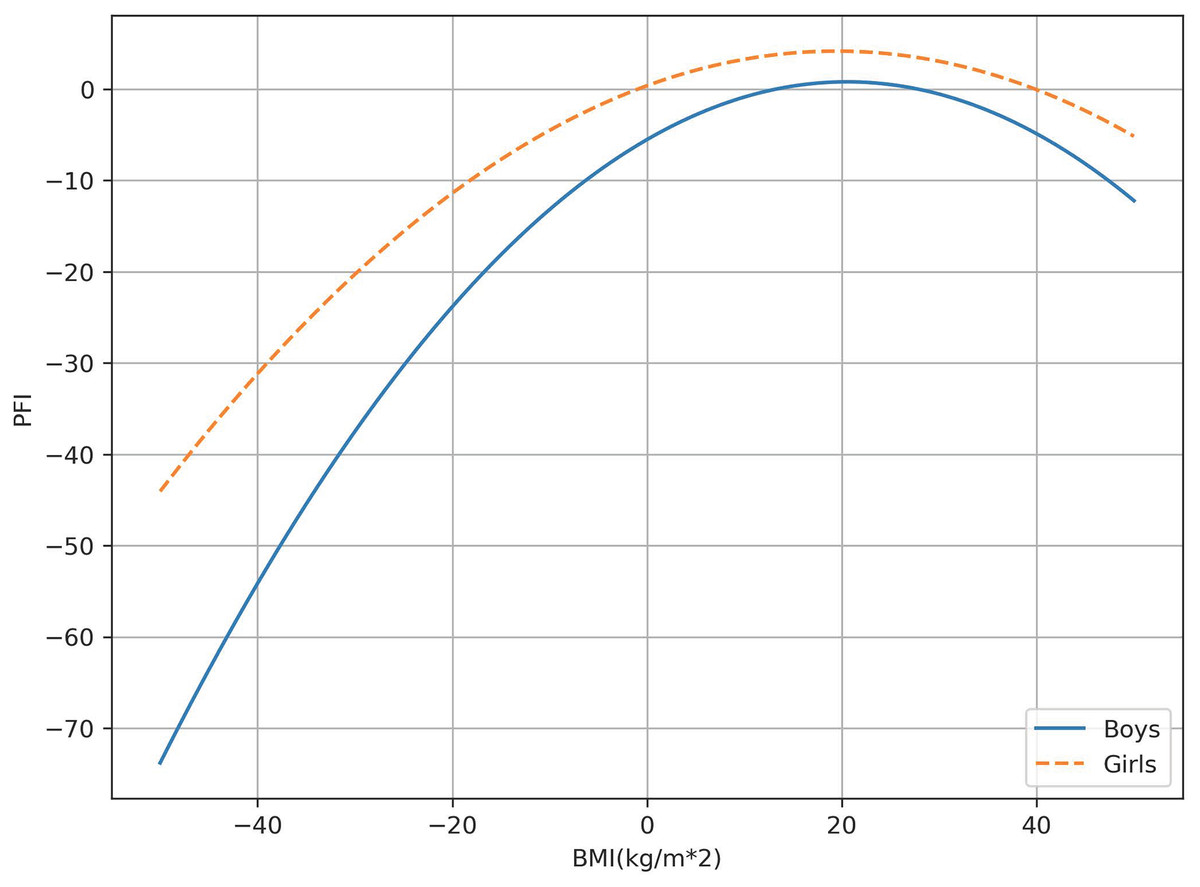
Figure 1: The correlation between PFI and BMI.
This section presents the results of the study investigating the relationship between BMI and PFI in children and adolescents with HI. The one-way ANOVA models revealed a statistically significant elevation in PFI within the normal BMI category, surpassing all other BMI categories in both male and female groups (P < 0.05). Conversely, PFI in the obese category exhibited a significant reduction compared to all other BMI categories in both males and females (P < 0.05).
The logistic regression analysis revealed a significant association between PFI and BMI in both males and females (P < 0.05). The relationship between PFI and BMI is visually depicted in Fig. 1, and detailed numerical information can be found in Table 3. The formulas outlining gender-specific traits are outlined as follows:
| Gender | BMI | Cohen’s d# | ||||||||||||
|---|---|---|---|---|---|---|---|---|---|---|---|---|---|---|
| Underweight (A) | Average weight (B) | Overweight (C) | Obesity (D) | A/B | A/C | B/C | A/D | B/D | C/D | |||||
| N | Mean (SD) | N | Mean (SD) | N | Mean (SD) | N | Mean (SD) | |||||||
| Boys | 40 | 0.634 (0.541) | 92 | 0.500 (0.328) | 26 | −1.029 (0.747) | 19 | −2.341 (0.578) | 0.8 | 0.4 | 0.3 | 0.0a | 0.0a | 0.1 |
| Girls | 24 | −0.025 (0.518) | 66 | 0.633 (0.374) | 24 | −0.989 (0.611) | 13 | −1.366 (0.845) | 0.4 | 0.3 | 0.0a | 0.2 | 0.0a | 0.7 |
PFIBoys = −0.015BMI2 + 0.616BMI − 5.516 (F = 6.75, P < 0.05)
PFIGirls= −0.01BMI2 + 0.389BMI + 0.389 (F = 2.61, P < 0.05).
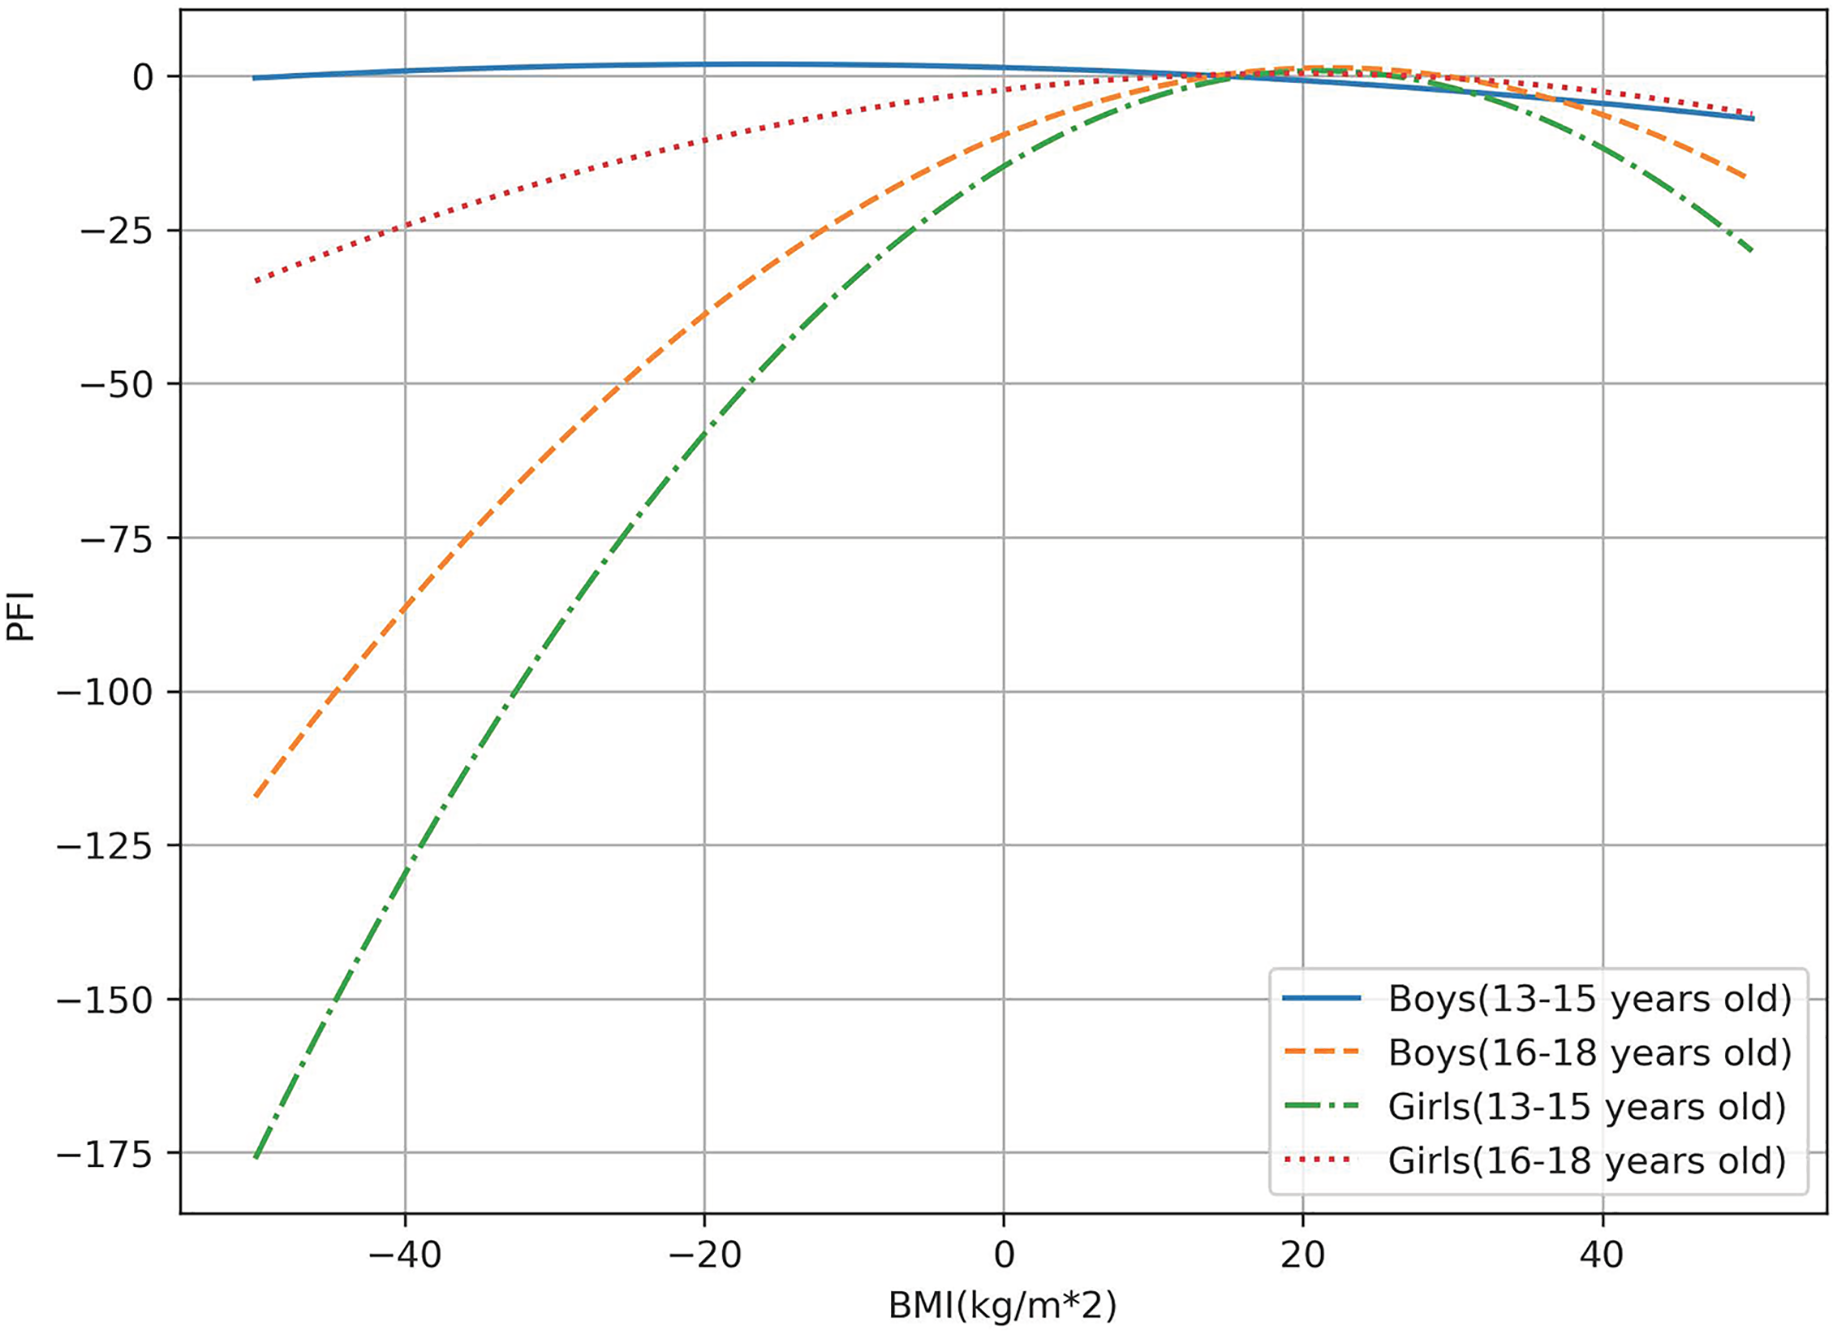
Furthermore, the logistic regression analysis revealed a significant association between PFI and BMI (P < 0.05) in individuals of varying ages, encompassing both males and females. The correlation between PFI and BMI in diverse age groups for both genders is illustrated in Fig. 2 and summarized in Table 3. The equations representing age-specific characteristics are provided below:
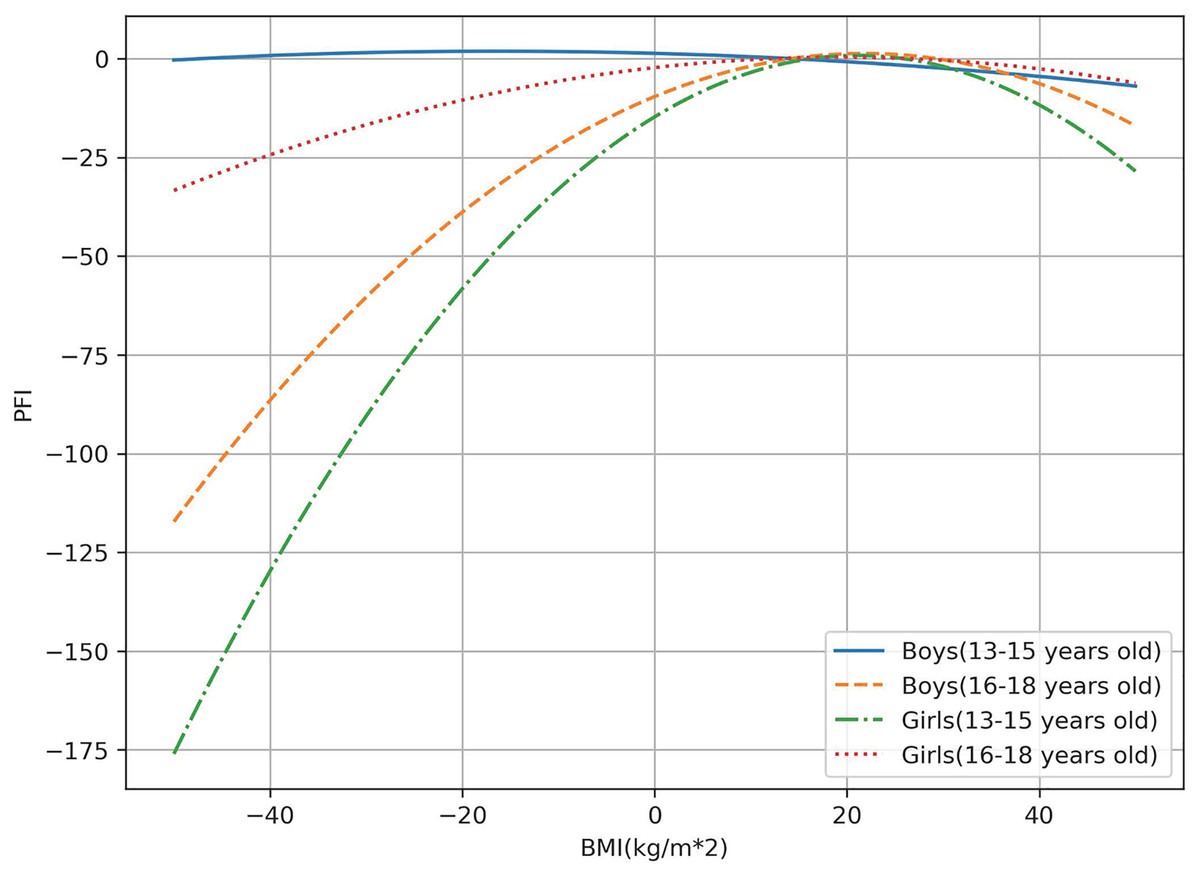
Figure 2: The correlation between PFI and BMI is organized by gender and age.
PFIBoys(13–15) = −0.002BMI2 − 0.066BMI + 1.321 (F = 2.20, P = 0.000)
PFIBoys(16–18) = −0.023BMI2 + 1.002BMI − 9.627 (F = 4.99, P = 0.000)
PFIGirls(13–15) = −0.035BMI2 + 1.475BMI − 14.749 (F = 1.66, P = 0.000)
PFIGirls(16–18) = −0.007BMI2 + 0.272BMI − 2.292 (F = 1.55, P < 0.05).
Discussion
To the best of our knowledge, this is the first cross-sectional study examining the current physical fitness status of profound and severe hearing impairment, while also investigating gender and age differences in BMI and PFI. Our primary findings indicate that the overall BMI characteristics of adolescents with hearing impairment are highly favorable, with a majority falling within the moderate range of PFI. Furthermore, BMI levels have a significant impact on the PFI of adolescents with HI, showing a nonlinear, inverted U-shaped relationship. Overall, adolescents with a normal BMI exhibit higher PFI, indicating better physical health. In contrast, those with BMI levels below or above the normal range demonstrate a decline in physical fitness.
Our results indicate that the average BMI (21.81 kg/m2) of the sample of 304 adolescents with HI are higher than the acceptable level for adolescents (17.3 kg/m2) specified in the National Standards for Students’ Physical Health (Ministry of Education of the People’s Republic of China, 2014). The average BMI for both boys (21.70 kg/m2) and girls (21.92 kg/m2) falls within the normal range. Regarding gender differences, the magnitude of the average BMI difference between males and females is 0.22 kg/m2. Considering that our BMI survey was conducted after the COVID-19 pandemic, many adolescents with HI were still in the post-recovery phase, leading to a more sedentary lifestyle than before (Chang et al., 2021). A recent study in Nature indicates that COVID-19 lockdowns have caused long-term changes in the physical fitness and health status of young people. Compared to historical control groups, the experimental group showed declines in anaerobic fitness, aerobic fitness, explosive power, and upper body strength in females within a year after the pandemic (Ripley-Gonzalez et al., 2023). Additionally, research from the Journal of Public Health compared severe obesity rates in children from 2014/15 to 2018/19 (pre-pandemic) and 2021/22 (post-pandemic), observing increased levels of severe obesity across all health boards with available data (Beynon & Davies, 2024). It could be inferred that individuals with HI face similar challenges to the general population regarding factors influencing BMI. Some researchers believed that the prevalence of disabilities is high among the obese population. For example, an analysis of aggregated data from the 2003–2009 National Health Interview Survey (NHIS) in the United States showed that obese men and women reported significantly higher rates of disability compared to their normal-weight counterparts. Furthermore, the rate of disability among respondents increased with rising BMI (Armour et al., 2012). Exercise is an effective means of maintaining weight at a normal level, but people with disabilities face complex activity limitations, and hearing impairments may limit one’s ability to navigate the environment (Loeb & Chen, 2011). Individuals with hearing impairments report that engaging in physical activities is more challenging, making it difficult to control BMI levels (Campbell et al., 1999). Therefore, the specificity of testing times and the variability in the physical conditions of the disabled population may partially explain the higher average BMI levels observed in adolescents with HI.
Yang et al. (2018) investigated the relationship between BMI and PFI in healthy adolescents aged 13–18. Interestingly, similar to adolescents with HI, BMI and PFI in various age groups of healthy adolescents also exhibited a parabolic relationship. Boys aged 16–18 and girls aged 13–18 reached optimal physical fitness at a BMI of approximately 20 kg/m2. It was inferred that HI and healthy adolescents share fundamental physiological similarities. However, research has shown that hearing impairment may be associated with specific physical and mental health outcomes in older adults. For instance, one study found that middle-aged and older adults with hearing impairment were more likely to have chronic diseases, impaired activities of daily living (ADLs), and depressive symptoms (Ye et al., 2020). Another study indicated that hearing loss might predict a decline in physical functions, particularly balance, followed by walking speed and endurance. Therefore, preventing and treating hearing impairment is crucial for improving health and well-being (Brenowitz & Wallhagen, 2021). Interestingly, Fig. 2 shows that the PFI levels of boys aged 13–15 exhibit minimal variation with changes in BMI, remaining consistently high. In contrast, the PFI levels of girls aged 13–15 are highly sensitive to BMI changes, showing significant variation. Overweight and obesity greatly impact the physical fitness levels of girls in this age group but have a smaller effect on boys. Obesity is a complex condition influenced by genetic, physiological, psychological, and environmental factors (Kansra, Lakkunarajah & Jay, 2021). Overweight or obesity places significant stress on the bones and muscles of adolescents, potentially damaging joints, bones, and muscles. Therefore, this phenomenon can be explained from psychological and environmental perspectives. Researchers have identified weight bias—the stigma and negative stereotypes towards individuals with larger bodies—as the fourth most reported form of discrimination, with its incidence increasing by 66% from 1995 to 2006 (Zebrowska & Zwierzchowska, 2006). It is believed that negative beliefs and judgments about overweight girls and women are more pronounced compared to their male counterparts (Brochu & Morrison, 2007), leading to greater negative consequences such as depression (Fettich & Chen, 2012), anxiety (Durso et al., 2012), and decreased motivation to engage in physical activity (Vartanian & Novak, 2011), inevitably resulting in a more significant adverse impact on physical fitness levels.
The research also found that males and females in various age groups have higher PFI scores when their BMI is within the normal range. According to the parabolic results, when BMI is too high or too low, teenagers are unable to reach the optimal level of physical fitness. BMI is closely associated with individual health outcomes to a large extent. We attempted to understand the impact of elevated BMI on physical fitness from a biochemical perspective. It is well known that urate is the single metabolite most significantly associated with BMI, increasing with higher BMI and accounting for 16% of the variance in BMI (Loeb & Chen, 2011; Cirulli et al., 2019). Metabolic disorders pose health risks, and urate, as one of the crucial early risk indicators for type 2 diabetes, has been confirmed to be associated with low levels of physical fitness. Weight reduction has also been shown to reduce the correlation between physical fitness and the risk of cardiovascular disease by one-third to two-thirds (Chang et al., 2021). Therefore, having a BMI outside the normal range could have adverse effects on individual health, including influencing cardiac metabolism, increasing the risk of various chronic diseases, and impacting the individual’s physical fitness. Adolescence is a period of rapid growth, and a study in the UK found that adolescent thinness is associated with low self-esteem, insufficient physical activity, and a low BMI in mothers. A low BMI prevents individuals from achieving appropriate weight gain, and the longer the duration of being underweight, the greater the risk of adverse health consequences (Ye et al., 2020).
Furthermore, differences between boys and girls in kinanthropometric variables and physical health performance typically begin at puberty due to changes in the hormonal environment associated with age and biological maturation (Albaladejo-Saura et al., 2022). A recent analysis of gender and age differences in adolescent volleyball athletes showed significant differences in somatotype, fat, and muscle percentages after introducing age as a covariate (Handelsman, 2017). These differences were not significant in the early stages of puberty but became more pronounced as puberty progressed (Tønnessen et al., 2015). This indicates that age significantly impacts gender differences in physical fitness levels among adolescents. Future research on the physical fitness of adolescents with HI could consider analyzing different age subgroups.
Previous research on the physical abilities of individuals with hearing impairments has predominantly focused on the elderly population. Most studies have evaluated the association between hearing impairment and poorer physical functioning or declining physical abilities, emphasizing the necessity of treating age-related degenerative hearing impairments (Martinez-Amezcua et al., 2021; Rosenberg, 2021). Some investigations have targeted adolescents with HI, comparing their physical efficiency values with those of healthy adolescents by conducting PWC170 (Physical Working Capacity) tests and VO2max measurements (Wierzbicka-Damska et al., 2005). Other studies have measured spirometric values and aerobic efficiency in adolescents with HI, all indicating that sensory deprivation caused by hearing impairment can affect the functioning of multiple systems in these individuals (Zebrowska & Zwierzchowska, 2006; Fisher et al., 2014). This study aims to assess the overall physical fitness levels of adolescents with HI through seven physical fitness tests and examine the association between BMI and physical fitness levels. The goal is to accurately gauge whether adolescents with HI are experiencing comprehensive development and normal growth by examining their obesity status.
The main advantage of this study lies in exploring the impact of profound and severe hearing impairment on the physical fitness levels of adolescents with different regions in China represented in the sample from special education schools. However, most previous studies have primarily focused on the relationship between BMI and PFI in healthy adolescents. Nevertheless, this study has several limitations worthy of discussion. Firstly our study did not control for confounding factors in participants, such as socio-economic status, lifestyle, and mental health, which may introduce bias and hinder a more in-depth interpretation of the results. Secondly, caution should be exercised in interpreting the results, as this is a cross-sectional study that cannot establish a causal relationship between BMI and PFI; it can only indicate an association between variables. Intervention studies and prospective cohort studies are needed in further research to provide more insights.
Conclusion
In summary, this study conducted tests on seven physical fitness components among 304 Chinese adolescents aged 13–18 with profound and severe hearing impairment. The physical fitness indicators were standardized and converted into Z-scores, which were then summed to calculate the PFI. A higher PFI indicates a higher level of physical fitness. Among adolescents with profound or severe hearing impairment, there exists a parabolic relationship between BMI and PFI. Those who are underweight, overweight, or obese among the adolescents with HI exhibit lower levels of physical fitness compared to those with normal weight. Equipped with this knowledge, forthcoming research could delve into the physical attributes and health concerns specific to adolescents with HI. This endeavor would contribute substantiated insights to bolster the advancement of their overall physical well-being. School sports play a pivotal role as a primary avenue for physical activity among adolescent with hearing impairment. This study illuminated the physical fitness status of students in special education, with the overarching goal of enhancing the overall enjoyment of sports for adolescents with HI.