
Study of LY9 as a potential biomarker for prognosis and prediction of immunotherapy efficacy in lung adenocarcinoma
- Published
- Accepted
- Received
- Academic Editor
- Abhishek Tyagi
- Subject Areas
- Bioinformatics, Immunology, Oncology
- Keywords
- LY9, Lung adenocarcinoma, Prognosis, Immune cell infiltration, Immune checkpoints
- Copyright
- © 2024 Deng et al.
- Licence
- This is an open access article distributed under the terms of the Creative Commons Attribution License, which permits using, remixing, and building upon the work non-commercially, as long as it is properly attributed. For attribution, the original author(s), title, publication source (PeerJ) and either DOI or URL of the article must be cited.
- Cite this article
- 2024. Study of LY9 as a potential biomarker for prognosis and prediction of immunotherapy efficacy in lung adenocarcinoma. PeerJ 12:e17816 https://doi.org/10.7717/peerj.17816
Abstract
Background
Lymphocyte antigen 9 (LY9) participates in the development of several tumors and diseases but has not been reported yet in lung adenocarcinoma (LUAD).
Methods
First, we analyzed the expression and prognostic value of LY9 in pan-cancer, including LUAD. Additionally, we conducted a correlation analysis of LY9 expression in LUAD with immune cell infiltration using the TIMER database and the CIBERSORT algorithm, and with immune checkpoints using the GEPIA database. Also, we constructed a potential ceRNA network for LY9. Furthermore, we explored LY9-related pathways by Gene Set Enrichment Analysis (GSEA). Finally, validation of differential expression at the mRNA level was obtained from the GEO database. We collected LUAD tissues for Quantitative Real-time PCR (qRT-PCR) to verify the expression of LY9, CD8, and CD4 and calculated the correlation between them. We also conducted immunohistochemistry (IHC) to verify the protein expression of LY9.
Results
Results showed that LY9 was highly expressed in various tumors, including LUAD. Besides, patients with high LY9 expression presented longer overall survival (OS) and more multiple lymphocyte infiltrations. The expression of LY9 in LUAD strongly and positively correlates with multiple immune cell infiltration and immune checkpoints. The functional enrichment analysis indicated that LY9 was involved in multiple immune-related pathways and non-small cell lung cancer. Moreover, a ceRNA regulatory network of LINC00943-hsa-miR-141-3p-LY9 might be involved. Finally, GSE68465 dataset confirmed differential expression of LY9 mRNA levels in LUAD and the qRT-PCR results verified LY9 had a strong and positive correlation with CD4 and CD8 T cells. Unfortunately, IHC did not detect the expression of LY9 protein level in tumor tissues and WB experiments validated the protein expression of LY9 in the OCI-AML-2 cell line.
Conclusions
Therefore, we hypothesized that LY9 could serve as a potential, novel prognostic biomarker for LUAD and could predict immunotherapy efficacy at the mRNA level.
Introduction
Lung adenocarcinoma (LUAD) accounts for approximately 40% of non-small cell lung carcinoma and has the highest cancer-related mortality rate worldwide (Park et al., 2020; Menzel & Black, 2020). Currently, surgery is the main treatment modality for LUAD (Hoy, Lynch & Beck, 2019), but the prognosis of advanced patients has not significantly improved. Many studies have explored the molecular mechanisms of lung cancer, and targeted therapies, that can prolong survival in specific patient groups, have been developed (Ruiz-Cordero & Devine, 2020). Evidence suggests that both the genomic and molecular characteristics of tumor cells and their interaction with the tumor microenvironment (TME), especially with the immune system, are important for the development and progression of lung cancer (Hirsch et al., 2017; Sun et al., 2020). Immunotherapeutic methods now concentrate on multiple ligands and receptors that depress or enhance immunological synapses (Marin-Acevedo et al., 2018). Until now, cytotoxic T lymphocyte protein 4 (CTLA4) and programmed cell death protein 1 (PD-1) are the key immunotherapy targets (Van den Bulk, Verdegaal & De Miranda, 2018; Nishimura et al., 2021). Great effectiveness has been achieved through antibody-guided therapies targeting these immune checkpoints in multiple cancers, including lung cancer (Suzuki et al., 2016). Current immune checkpoint inhibitors (ICIs) can enhance the immune response to tumor antigens primarily by eliminating the inhibition of T-cell activation by antigen-presenting cells (APCs) (Suresh et al., 2018; Bagchi, Yuan & Engleman, 2021). Moreover, tumor-infiltrating lymphocytes have been shown to affect the response of cancer patients to chemotherapy and immunotherapy (Pan et al., 2019; Zhang & Zhang, 2020; Paijens et al., 2021). Therefore, exploring new immune checkpoints that affect the infiltration levels of various immune cells within the TME has great potential in the development of precise lung cancer treatment.
Lymphocyte antigen 9 (LY9), also called CD229 or SLAMF3, is a 120 kDa type I transmembrane glycoprotein belonging to the CD2 family and SLAM subgroup (Romero et al., 2005). LY9 is expressed on almost all B- and T-lymphocytes and at very high levels on NKT and MZ B cells (Cuenca et al., 2016; Puñet Ortiz et al., 2018; Sintes et al., 2013). Its N-terminal Ig-like domain mediates affinity binding between LY9 molecules (Cannons, Tangye & Schwartzberg, 2011; Romero, Sintes & Engel, 2014). Previous studies have found that LY9, as a costimulatory factor of CD4+T cells, affects IL-2 response and T helper cell differentiation, becoming a potential therapeutic target for systemic lupus erythematosus (SLE) patients (Comte et al., 2016; Chatterjee et al., 2012). Other studies have confirmed that LY9 expression can inactivate E2F transcription factors, reducing PLK1 production and activation, thereby presenting anti-cancer effects in hepatocellular carcinoma (Bouhlal et al., 2016). Additionally, LY9 is widely expressed on plasma cells from individuals with multiple myeloma (MM) and can promote a high level of malignant potential in tumor cells through ERK signaling, regulated by the junctional proteins SHP2 and GRB2 (Ishibashi et al., 2020). LY9 can also act as a tumor-related antigen in chronic lymphocytic leukemia, and patients with high LY9 expression have a worse prognosis (Saberi Hosnijeh et al., 2020). These findings indicate that LY9 is involved in numerous immune-related functions and pathways, being closely associated with the development of autoimmune diseases and some tumors. Therefore, LY9 has great potential as a therapeutic target for multiple tumors.
In the present study, we examined the expression of LY9 on the pan-cancer UCSC Xena database. We explored its correlation with the prognosis of pan-cancer patients in GEPIA, and Kaplan–Meier plotters databases. Moreover, we explored the lncRNA-miRNA-LY9 ceRNA network from TargetScan 7.2 (Agarwal et al., 2015) and LncBase Experimental v.2 (Paraskevopoulou et al., 2016) databases. We also studied the relationship between the infiltration degree of immune cells and LY9 in different TME using the tumor immunity evaluation database (TIMER 2.0). Finally, we collected tumor tissues from clinical LUAD patients to detect the expression level of LY9, CD4, and CD8 by Real-time Quantitative Polymerase Chain Reaction (qRT-PCR) and immunohistochemistry (IHC), and calculate the correlation between them. Our results shed light on the essential role of LY9 in LUAD and provided potential relationships and underlying mechanisms between LY9 and tumor-immune interaction. Our current study can help further reveal the role of LY9 in LUAD and provide new treatment strategies.
Materials and Methods
Differential expression and prognostic value analysis of LY9 in pan-cancer
First, we retrieved the transcriptome and clinical data of 33 types of cancer from the UCSC Xena database (https://xena.ucsc.edu/) and obtained LY9 expression levels for all tumor samples using the “limma” R package. Considering that too few normal samples might lead to errors in the results, we deleted tumors with less than five normal samples, then used the “ggpubr” R package to draw a box plot of the LY9 expression level in the remaining tumors (n = 18, *p < 0.05, **p < 0.01, ***p < 0.001). Then we conducted Cox analysis through Xenashiny website (https://shiny.zhoulab.ac.cn/UCSCXenaShiny/) to measure the prognostic value (overall survival, OS) of LY9 in 33 cancers from the TCGA database. We used the Kaplan–Meier plotter (https://kmplot.com/analysis/) (Györffy et al., 2010; Győrffy, 2021) and the Gene Expression Profiling Interactive Analysis (GEPIA) (http://gepia.cancer-pku.cn/) (Tang et al., 2017) databases to explore the prognostic value of LY9 in the abovementioned tumors (n = 18). The purpose of using these two databases for prognostic analysis is to serve as a cross-validation of results. Sources of the Kaplan–Meier plotter include GEO, EGA, and TCGA databases. When we performed survival analysis in the GEPIA database, the statistical difference between the curves was measured by the log-rank test. Portions of this text were previously published as part of a preprint (Deng et al., 2022).
Gene Set Enrichment Analysis and correlation of LY9 expression in LUAD with clinical features from TCGA
To explore the functions and pathways that enriched for LY9, we used the Gene Set Enrichment Analysis (GSEA) software (v. 4.1.0) to perform functional enrichment analysis based on the LY9 expression in LUAD. First, we classified patients into high- and low-expression groups based on the median value of the LY9 expression levels in LUAD patients. Then, we explored the Kyoto Encyclopedia of Genes and Genomes (KEGG) pathway in the two LY9 expression groups in LUAD patients. If the conditions of —NES—>1, NOM p-value <0.05, and FDR q-value <0.25 were satisfied, we considered that the gene set under the pathway was meaningful. Before analyzing the LUAD dataset from the TCGA database, we first performed filtering according to fdrFilter <0.05. We also used the “ggpubr” R package to draw boxplots to demonstrate the association of LY9 expression in LUAD patients in the TCGA database with other clinical features, including age, gender, clinical stage, and TMN stage. In this study, we removed the samples with incomplete clinical information, and the clinical information data are summarized in Table 1. In addition, to verify the differential expression of LY9 in LUAD, we downloaded the corresponding dataset from the GEO dataset (GSE68465) for analysis. Moreover, we explored the protein-protein interaction (PPI) network associated with LY9 using the Genecards database (https://www.genecards.org/). Finally, we explored the prognostic value of LY9 expression levels in LUAD patients by univariate and multifactorial independent prognostic analyses. M stage was not included because the sample with an unknown M stage accounted for a large proportion of the total sample (Table 1, 26.6%) and would have introduced a large error in the results.
| ID | N (Total = 486) | Percentage |
|---|---|---|
| Age | ||
| >65 | 227 | 46.7% |
| ≤65 | 240 | 49.4% |
| Unknow | 19 | 3.9% |
| State | ||
| Alive | 304 | 62.6% |
| Dead | 182 | 37.4% |
| Gender | ||
| Male | 222 | 45.7% |
| Famale | 264 | 54.3% |
| Stage | ||
| Stage I | 262 | 53.9% |
| Stage II | 112 | 23.0% |
| Stage III | 79 | 16.3% |
| Stage Iv | 25 | 5.1% |
| Unknow | 8 | 1.7% |
| T | ||
| T1 | 163 | 33.5% |
| T2 | 260 | 53.5% |
| T3 | 41 | 8.5% |
| T4 | 19 | 3.9% |
| Unknow | 3 | 0.6% |
| N | ||
| N0 | 312 | 64.2% |
| N1 | 90 | 18.5% |
| N2 | 70 | 14.4 |
| N3 | 2 | 0.4% |
| Unknow | 12 | 2.5% |
| M | ||
| MO | 333 | 68.5% |
| M1 | 24 | 4.9% |
| Unknow | 129 | 26.6% |
Construction of the lncRNA-miRNA-LY9 ceRNA network
The miRNA expression data was downloaded from TCGA data. Then we retrieved miRNAs predicted to target LY9 from the TargetScan 7.2 database (http://www.targetscan.org/vert_72/) for correlation and differential expression analyses and filtered the predicted upstream miRNAs of LY9 according to correlation >0.2 and p < 0.05. The statistical method was Spearman correlation analysis. Also, we constructed correlation networks for miRNAs with correlations >0.1 and performed correlation, differential, and prognostic survival analyses for hsa-miR-141-3p that met the required conditions and the results were statistically significant. Thereafter, we downloaded lncRNAs predicted to target hsa-miR-141-3p from the DIANA-tools database LncBase Experimental v.2 (http://diana.imis.athena-innovation.gr/DianaTools/index.php?r=lncExperimental/index) and performed correlation and differential expression analyses. We found that RNF216P1 and LINC00943 correlations were >0.2 and p < 0.05. Finally, we constructed the LY9 lncRNA-miRNA network and performed correlation, differential expression, and survival analyses of RNF216P1 and LINC00943 with LY9 expression.
Correlation analyses of LY9 expression in LUAD with immune cells infiltration and immune checkpoints
To explore whether LY9 could be an immunotherapy target for LUAD, we analyzed the correlation between LY9 expression levels and the infiltration of various immune cells in LUAD from the TIMER 2.0 database (http://timer.cistrome.org/), including B cells, CD4+ T cells, CD8+ T cells, neutrophils, macrophages, and dendritic cells. Next, we calculated the expression of immune cells for each LUAD patient in the TCGA dataset using the CIBERSOFT algorithm and calculated the correlation between various immune cells. Results were plotted as histograms and correlation heat maps using the “corrplot” R package. Then, we used differential expression analysis and the Spearman correlation test to explore which immune cell infiltration was associated with LY9 expression in LUAD patients. Finally, we used the intersection of immune cells obtained by both methods to obtain the final results. Moreover, we used these two databases (TIMER 2.0 and GEPIA 2.0) to analyze the correlation between the LY9 expression in LUAD and three main immune checkpoints (CD274, PDCD1, and CTLA4). Further, we calculated the correlation of LY9 with various immune cell marker genes by Spearman analysis.
Validation of GEO dataset, qRT-PCR and IHC experiments
GEO database LUAD RNA-seq dataset GSE68465 for validation of differential expression of LY9. We collected 26 pairs of LUAD tissues and their paraneoplastic normal tissues from the First Affiliated Hospital of Guangxi Medical University from January 2015 to September 2021 to perform qRT-PCR experiments to explore the mRNA expression levels and locations of LY9, CD4, and CD8, and calculated their correlation. Written informed consent was obtained from each subject and our study was approved by the Medical Ethics Committee of the First Affiliated Hospital of Guangxi Medical University (NO. 2022-KY-E-063). All experiments in this study were in accordance with the Declaration of Helsinki. First, we extracted total RNA and synthesized cDNA using random hmers and SuperScript III reverse transcriptase, repeating this step three times, and taking the mean value for subsequent qRT-PCR. The final results were estimated by the 2−ΔΔCt method (Cycle threshold value, Ct). A p < 0.05 was considered statistically significant. The following primers were used: (5′–3′): forward sequence of LY9: TCTCTCCTCTTCCTGCTCATG and reverse sequence of LY9: ACGTTCTCAATCTCTGTGTCTAC; forward sequence of CD8: GGACTTCGCCTGTGATATCTAC and reverse sequence of CD8: TTGTCTCCCGATTTGACCAC; forward sequence of CD4: GCCCTTGAAGCGAAAACAG and reverse sequence of CD4: CTCCTTGTTCTCCAGTTTCAAAC; GAPDH was used as an internal control: forward sequence (5′–3′): ACATCGCTCAGACACCATG and reverse sequence (5′–3′): TGTAGTTGAGGTCAATGAAGGG.
When performing IHC experiments, anti-LY9 was rabbit antibody purchased from Solarbio-Beijing, and the goat anti-rabbit secondary antibody was purchased from Beyotime. All experimental reagents were used in strict accordance with the instructions, and the experimental procedures were not special.
Statistical analyses
The version of R software used in our study was 4.1.1 (R Core Team, 2021). We used the “limma” R package to perform Wilcoxon tests to analyze variances. In the survival analysis using the Kaplan–Meier database, the log-rank test was used. Spearman’s correlations were performed to analyze correlations. A p < 0.05 was considered statistically significant.
Results
Our methodological roadmap for this study is presented in Fig. 1.
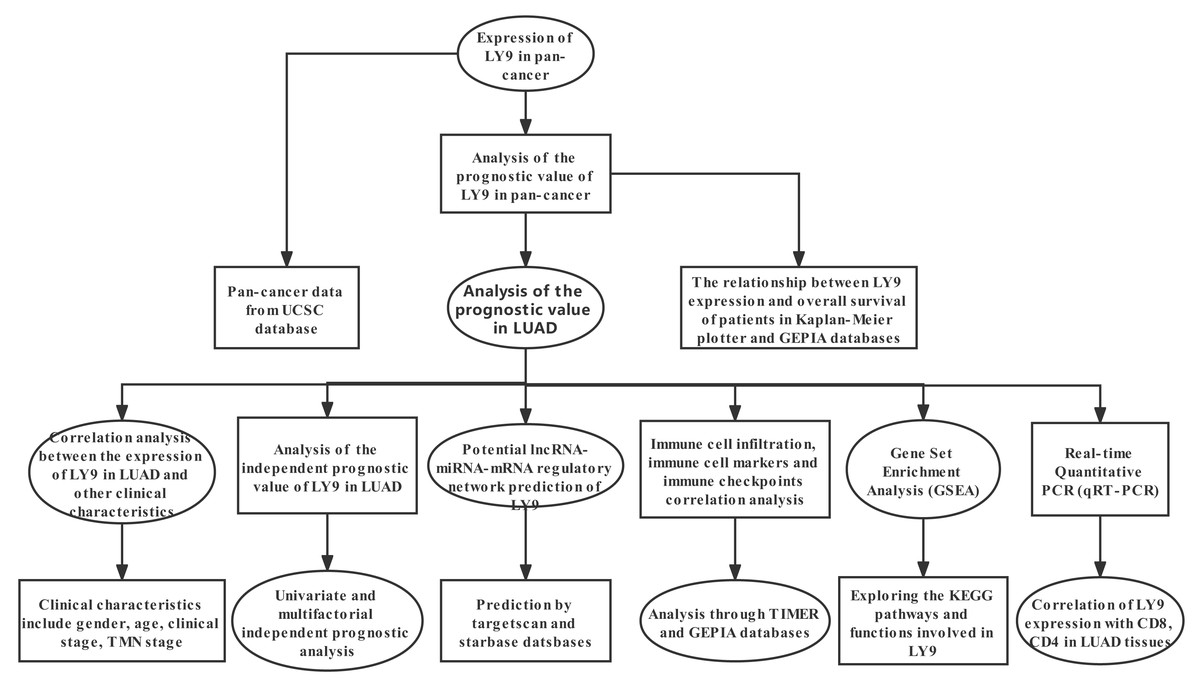
Figure 1: The methodological roadmap for this study.
The mRNA expression levels of LY9 in pan-cancer
The results from the Xenashiny website were presented in a forest plot, from which we learned that LY9 expression could be a risk factor in Uveal Melanoma (UVM). Meanwhile, LY9 may play a protective role in skin cutaneous melanoma (SKCM), sarcoma (SARC), lung adenocarcinoma (LUAD), head and neck squamous cell carcinoma (HNSC), cervical squamous cell carcinoma, and endocervical adenocarcinoma (CESC), breast invasive carcinoma (BRCA), and adrenocortical carcinoma (ACC) (Fig. 2A). To determine whether LY9 expression levels differed between cancerous and paraneoplastic tissues in various tumors, we retrieved transcriptomic and clinical data of 33 tumors from the UCSC database for further analysis. Results showed that tumors with higher LY9 expression in normal tissues than in cancerous tissues were bladder urothelial carcinoma (BLCA, p < 0.05), colon adenocarcinoma (COAD, p < 0.001), lung squamous cell carcinoma (LUSC, p < 0.05), rectum adenocarcinoma (READ, p < 0.001), and thyroid carcinoma (THCA, p < 0.001). However, the tumors with higher LY9 expression, compared to normal tissues, were glioblastoma multiforme (GBM, p < 0.05), kidney renal clear cell carcinoma (KIRC, p < 0.001), kidney renal papillary cell carcinoma (KIRP, p < 0.05), and lung adenocarcinoma (LUAD, p < 0.05) (Fig. 2B). The above results indicated that the mRNA expression level of LY9 was up-regulated in a variety of solid tumors, including LUAD, and acted as a protective factor.
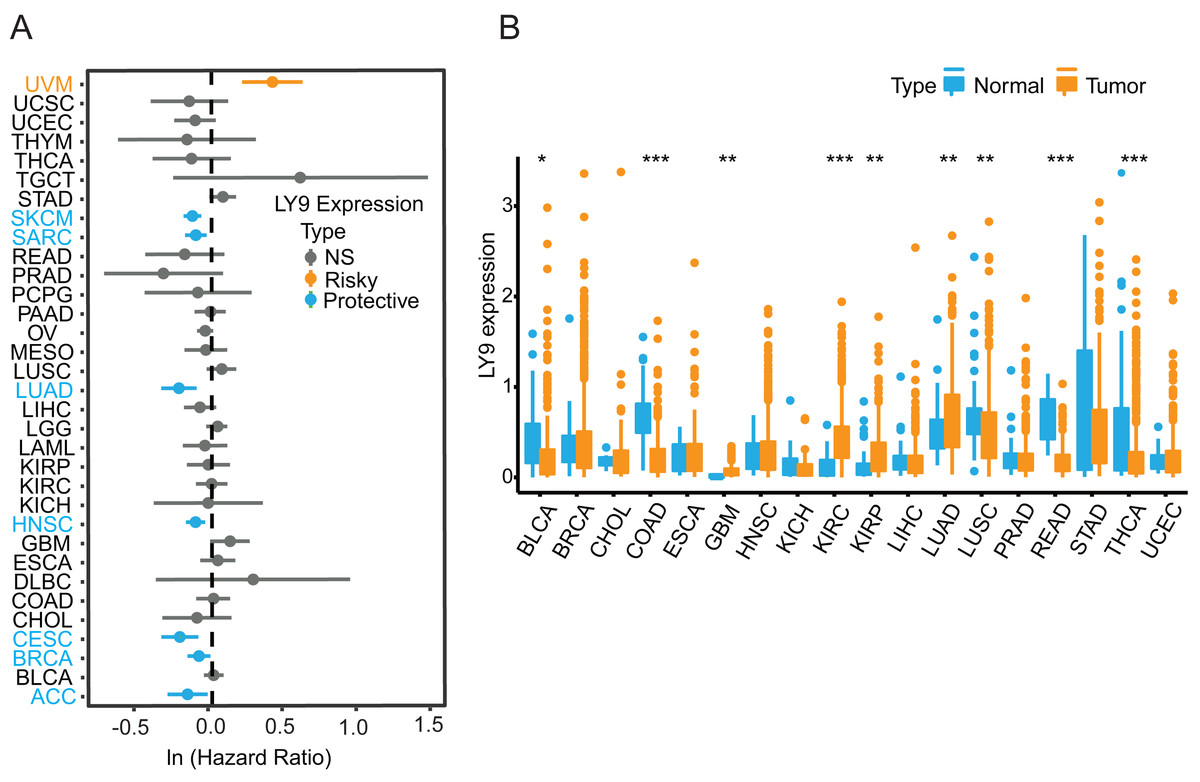
Figure 2: LY9 mRNA expression analysis in pan-cancer.
(A) Prognostic forest plot derived from Xenashiny’s website. The dots represent the Hazard Ratio (HR) values corresponding to each tumor. If HR > 1, it represents a risk factor (yellow), such as uveal melanoma (UVM), and if HR < 1, it represents a protective factor (blue), like skin cutaneous melanoma (SKCM), sarcoma (SARC), lung adenocarcinoma (LUAD), head and neck squamous cell carcinoma (HNSC), cervical squamous cell carcinoma and endocervical adenocarcinoma (CESC), breast invasive carcinoma (BRCA), and adrenocortical carcinoma (ACC). (B) LY9 expression in 18 tumors from the UCSC xena database (after removing the number of normal samples less than 5, ∗p < 0.05, ∗∗p < 0.01, ∗∗∗p < 0.001, blue represents normal tissue, yellow represents tumor tissue). Tumors with higher LY9 expression in normal tissues than in cancerous tissues were bladder urothelial carcinoma (BLCA), colon adenocarcinoma (COAD), lung squamous cell carcinoma (LUSC), rectum adenocarcinoma (READ), and thyroid carcinoma (THCA). Tumors with higher LY9 expression, compared to normal tissues, were glioblastoma multiforme (GBM), kidney renal clear cell carcinoma (KIRC), kidney renal papillary cell carcinoma (KIRP), and lung adenocarcinoma (LUAD).
Prognostic value of LY9 in pan-cancer
We explored the association of LY9 with the overall survival (OS) in patients with various tumors using the Kaplan–Meier plotter (Figs. 3A–3F) and GEPIA (Figs. 3G–3L) databases. Results showed six tumors significantly associated in both databases, including BRCA, HNSC, LUAD, CESC, LIHC, and OV. Among these tumors, patients with high LY9 expression had longer OS. These results suggested that LY9 was a protective factor for these six cancers.
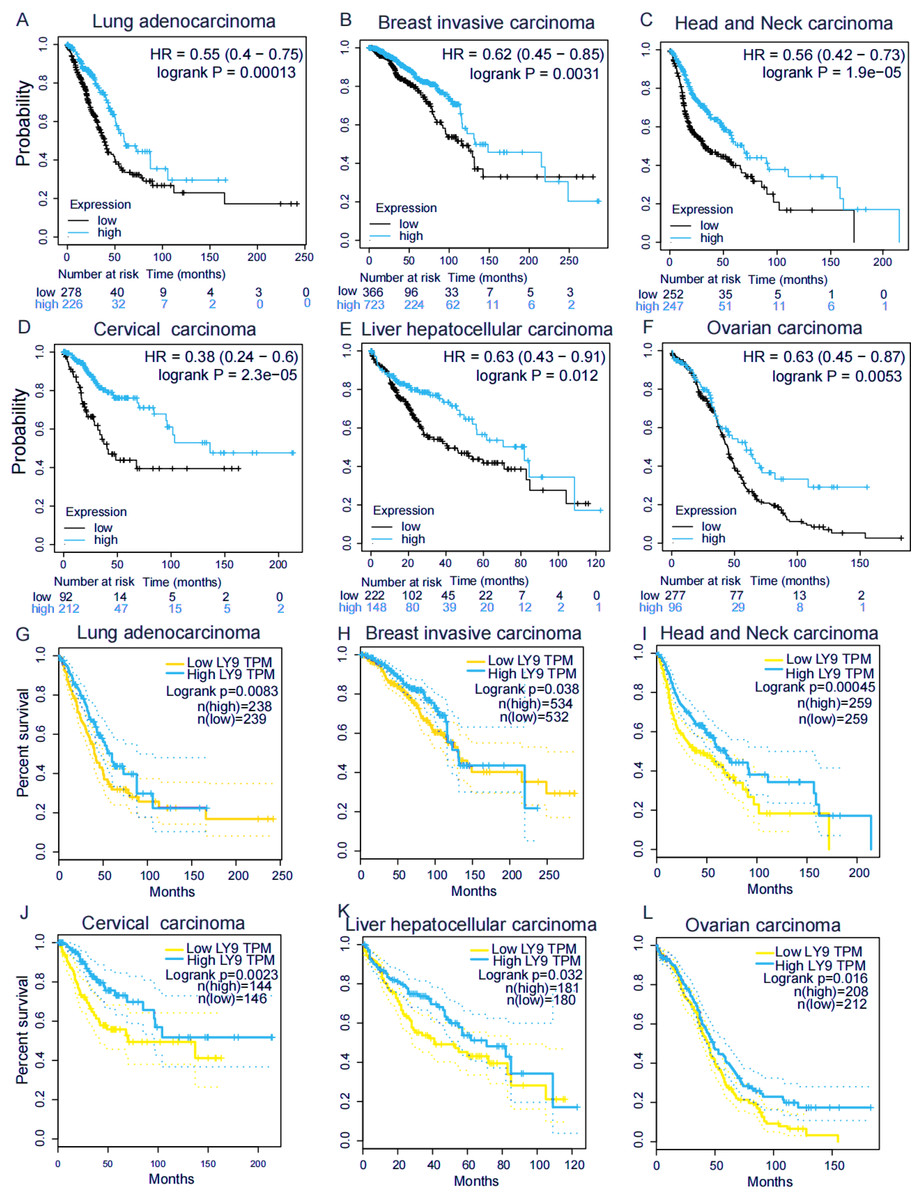
Figure 3: LY9 expression in tumors with prognostic value in both KM and GEPIA databases.
(A–F) Association of LY9 expression in the Kaplan–Meier plotter database with the overall survival in patients with six tumor types in the Kaplan–Meier plotter database. The survival rate of the group with high mRNA level expression (blue curve) of LY9 in LUAD patients was higher than that of the low expression group (black curve). (G–L) Association of LY9 expression with overall survival in patients with six tumors in the GEPIA database. The survival rate of the group with high mRNA level expression (blue curve) of LY9 in LUAD patients was higher than that of the low expression group (yellow curve).
GSEA and correlation analysis of clinical characteristics in LUAD
Further, the Wilcoxon Tests for LY9 expression in samples from the LUAD dataset (TCGA database) indicated that LY9 was indeed expressed at a higher level in cancerous tissues (Fig. 4A, p = 0.013; B, p = 0.0022). Also, the survival analysis confirmed that patients with high LY9 expression had longer OS (Fig. 4C, p = 0.005). The results of correlation analysis with other clinical characteristics showed that, in LUAD patients, the LY9 expression tended to increase with age (Fig. 4D, p = 0.003). Also, the LY9 expression level was higher in females than in males (Fig. 4E, p = 0.02). Additionally, the overall trend of clinical and TMN staging showed a decreasing LY9 expression trend in early to advanced patients (Figs. 4F–4I), consistent with the result that patients with higher LY9 expression in tumors have better prognoses. The univariate independent prognostic analysis results showed that the clinical stage, T-stage, and N-stage were high-risk factors for LUAD patients, while the LY9 expression level was a low-risk factor (Fig. 4J). Similarly, the results of the multifactorial independent prognostic analysis suggested that the expression level of LY9 in LUAD is a protective factor (Fig. 4K). Moreover, we classified the LUAD transcriptome, retrieved from the TCGA database, into high- and low-expression groups, based on the expression of LY9, then performed the GSEA. Results indicated that LY9-related gene sets were involved in many immune-related and non-small cell lung cancer pathways in the high-expression group. We selected the top 11 pathways to draw enrichment maps (Fig. 4L). In the low-expression group, LY9-related gene sets were mainly involved in the biosynthesis of unsaturated fatty acids. Together, these results implied that the prognosis of LUAD patients can be assessed by LY9 expression levels. LY9 was primarily involved in immune-related pathways, which inspired us to further explore the value of LY9 immunotherapy.
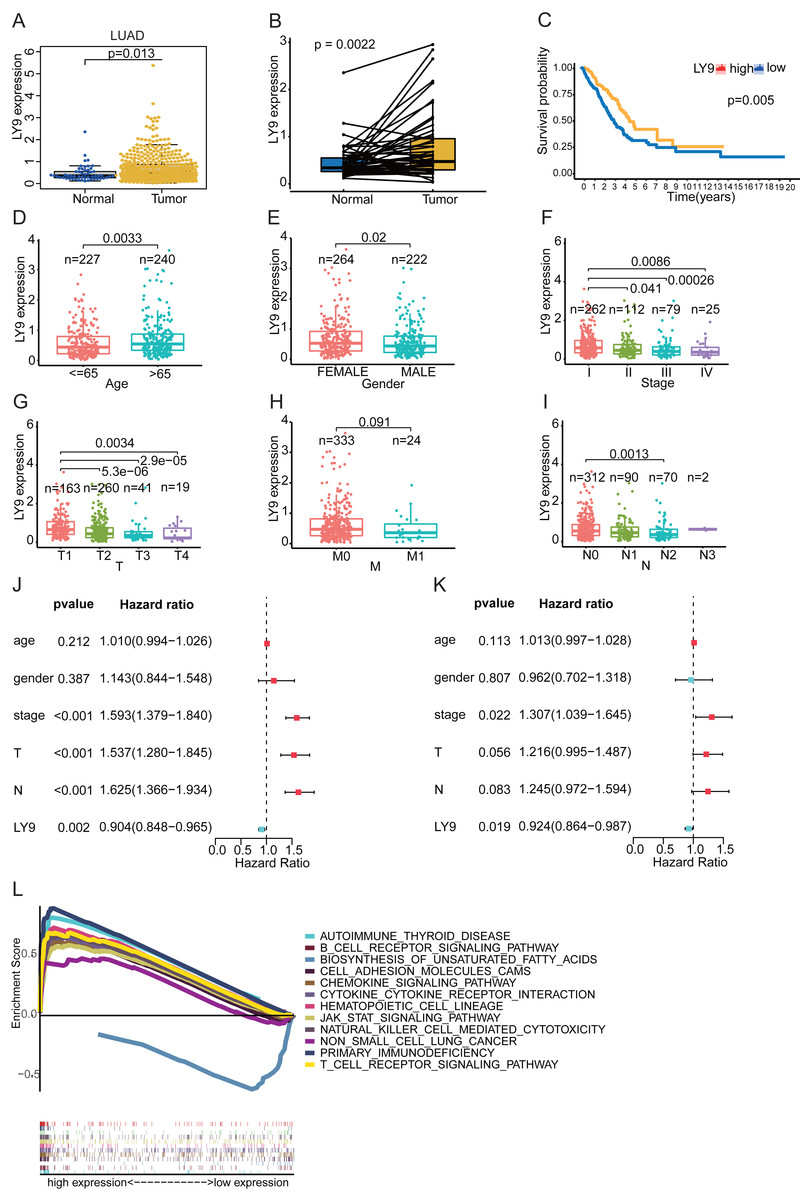
Figure 4: Correlation of LY9 expression with clinical characteristics and GSEA of LUAD -derived differentially expressed genes based on the TCGA dataset.
(A) LY9 expression in LUAD and normal tissues. The mRNA expression of LY9 in LUAD tissues (yellow box) was higher than that in normal tissues (blue box). (B) Paired differential expression analysis of LY9 in LUAD and normal tissues. The mRNA expression of LY9 in LUAD tissues (pale yellow box) was higher than that in normal tissues (blue box). (C) KM survival curves of LUAD patients with high and low expression of LY9. Higher survival rate for the high-expression group (yellow curve) than the low-expression group (blue curve). (D) Correlation of LY9 expression with the age of LUAD patients. The expression level of LY9 was higher in the senior group (azure blue, age >65) of patients than in the junior group (light red, age < =65). (E) Correlation of LY9 expression with the gender of LUAD patients. Female patients (light red) have higher expression levels than male patients (azure blue). (F) Correlation of LY9 expression with clinical staging of LUAD patients. A gradual decrease in expression from stage I to stage IV. (G) Correlation of LY9 expression with T-stage in LUAD patients. Roughly, there was a gradual decrease in expression from T1 to T4. (H) Correlation of LY9 expression with M-stage in LUAD patients. There was no statistical difference in the expression level of M staging (p = 0.091). (I) Correlation between LY9 expression and N stage of LUAD patients. Overall, the expression level gradually decreased from N1-N4. (J) Univariate independent prognostic analysis suggested that LY9 was a protective factor (HR <1, azure blue, p = 0.002), and clinical stage, T and N stage were risk factors (HR >1, red, p < 0.001) for LUAD patients. (K) Multifactorial independent prognostic analysis also showed that LY9 was a protective factor (HR <1, azure blue, p = 0.019) and clinical stage was a risk factor (HR >1, red, p < 0.012) for LUAD patients. (L) Kyoto Encyclopedia of Genes and Genomes (KEGG) pathways enriched for LY9 in LUAD. LY9-related gene sets were involved in non-small cell lung cancer and many immune-related pathways in the high-expression group. In the low-expression group, LY9-related gene sets were mainly involved in the biosynthesis of unsaturated fatty acids.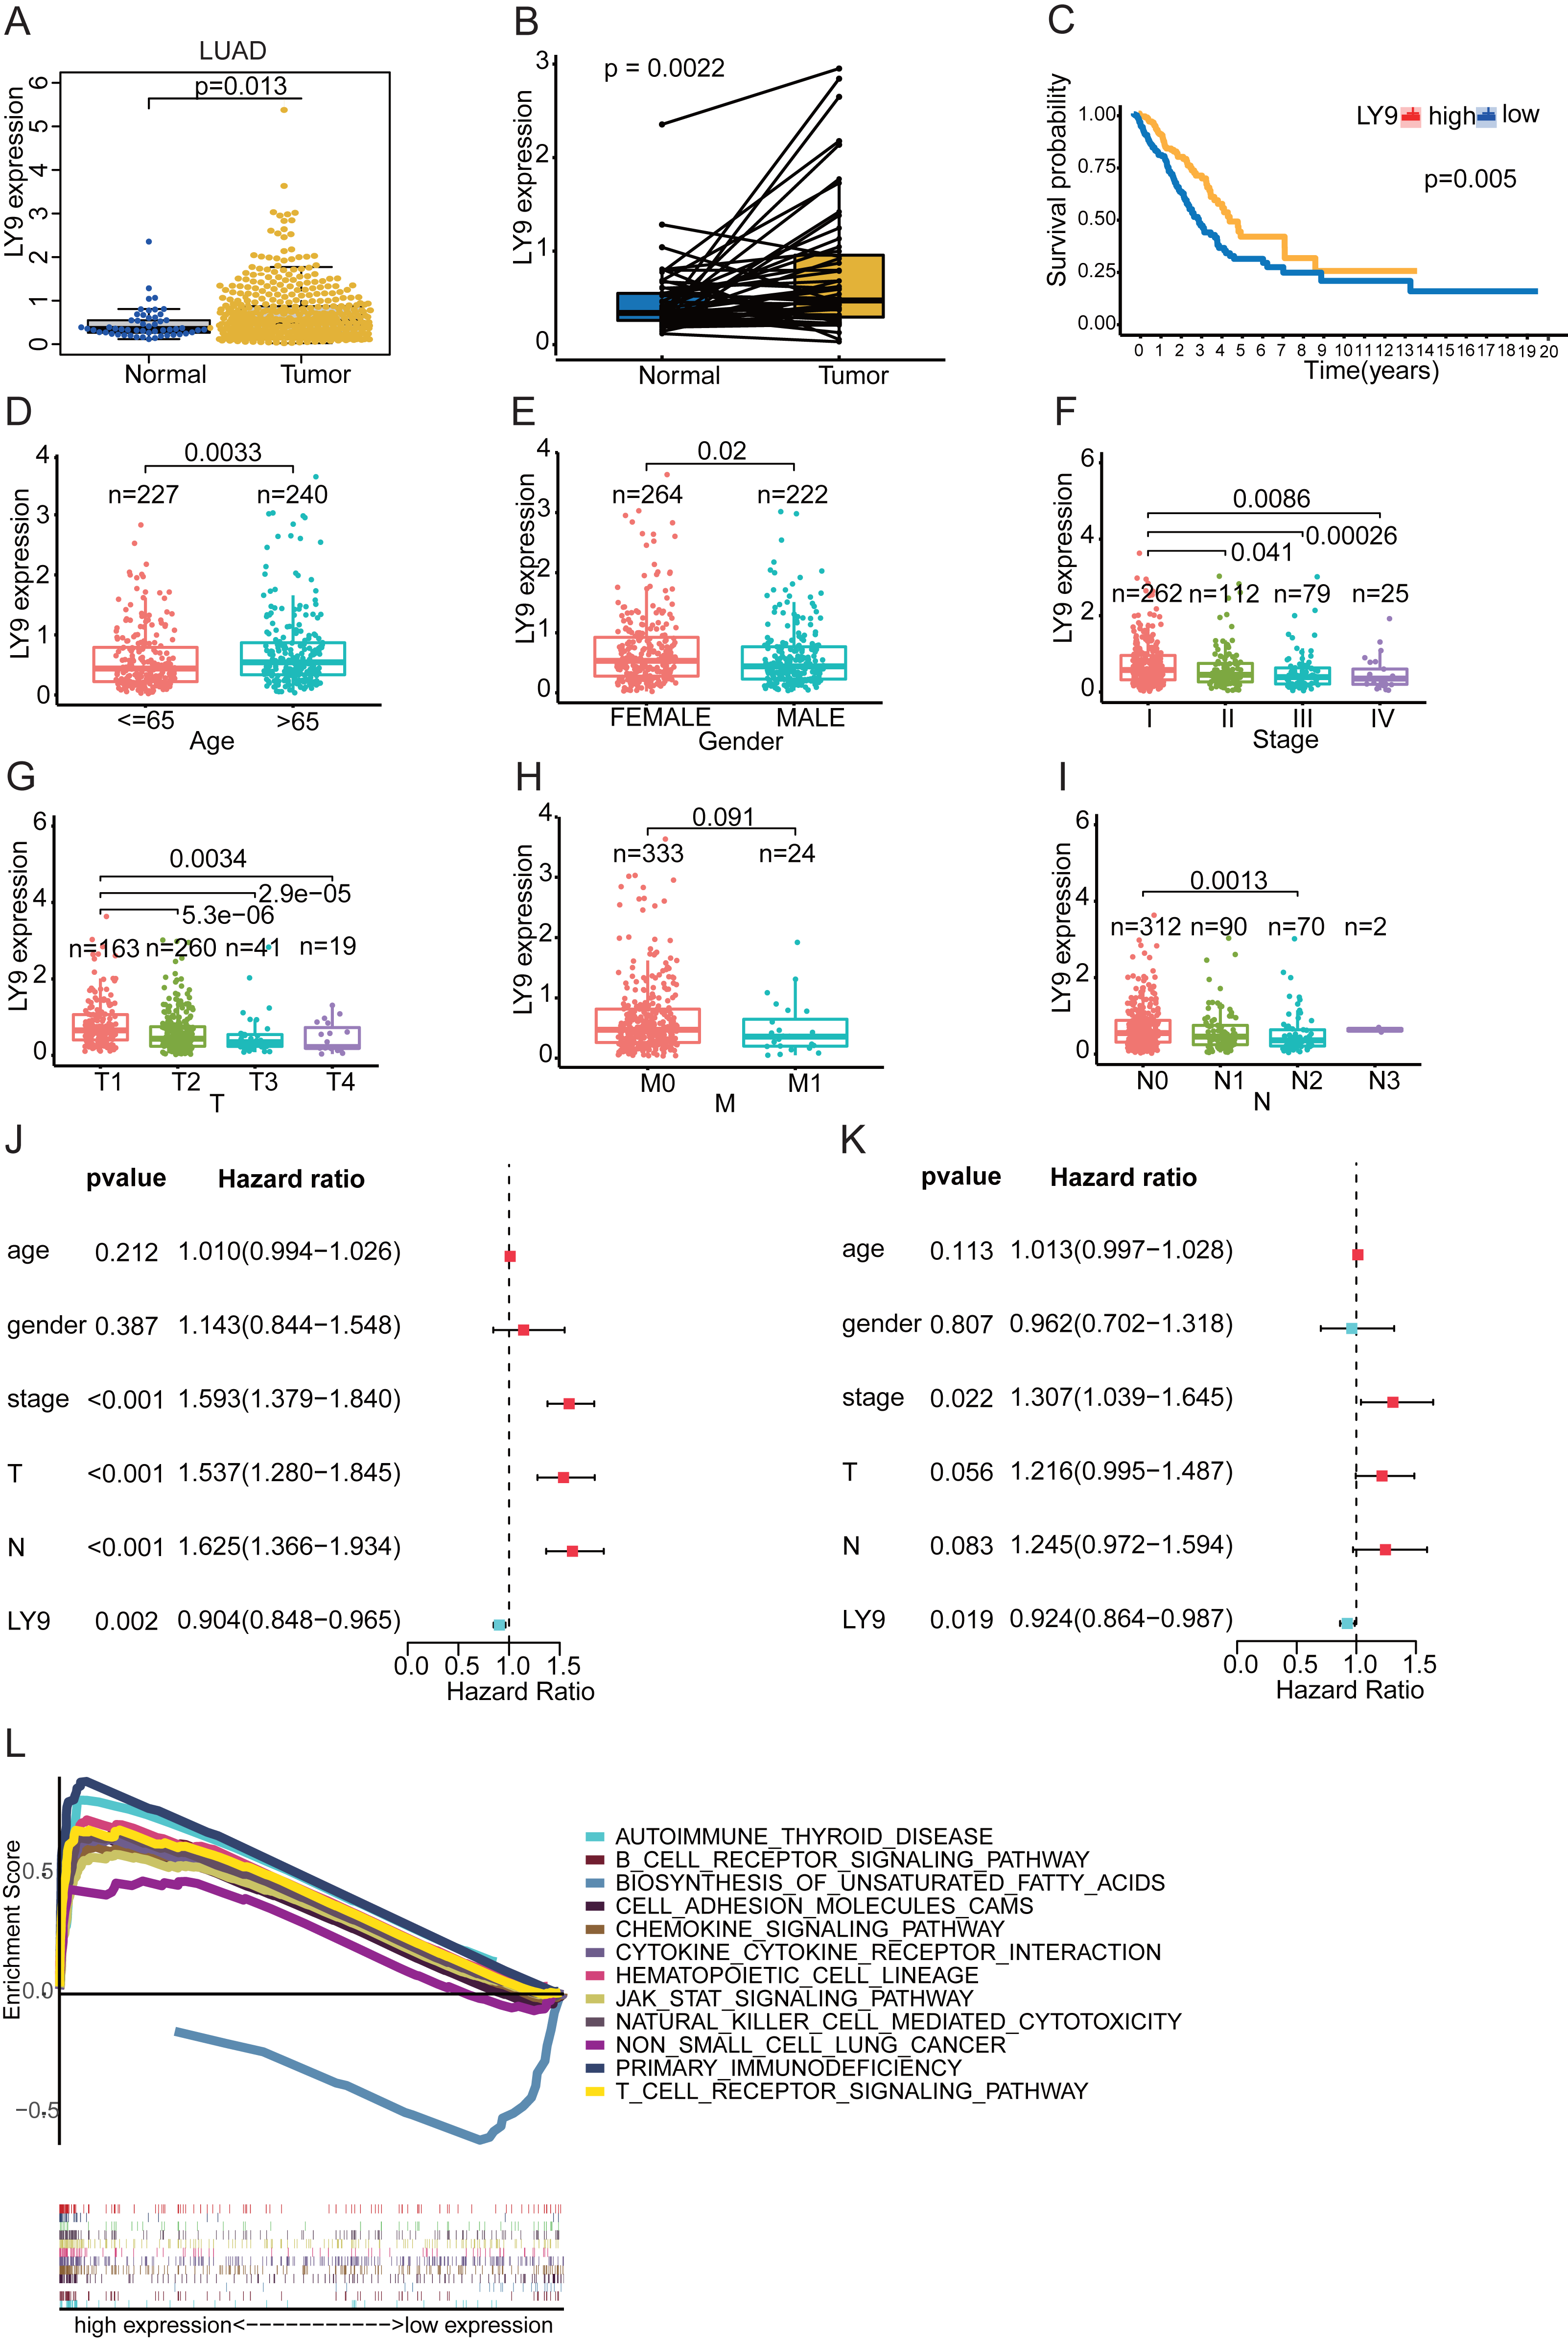
Construction of the lncRNA-miRNA-LY9 ceRNA network
To explore the potential lncRNA-miRNA-mRNA ceRNA action network of LY9, we conducted an analysis using online databases. First, we retrieved miRNAs predicted to target LY9 from the TargetScan 7.2 database for correlation and differential expression analyses and filtered the predicted upstream miRNAs of LY9 according to correlation >0.1 and p < 0.05. Results showed that seven miRNAs, including hsa-miR-141-3p, hsa-miR-4746-5p, hsa-miR-151a-5p, hsa-miR-17-3p, hsa-miR-301b-5p, hsa-miR-4786-3p, and hsa-miR-629-5p were predicted to target LY9 (Table 2). Also, we constructed correlation networks for these seven miRNAs (Fig. 5L). Considering that the miRNA with the strongest correlation with LY9 was hsa-miR-141-3p (R = −0.2, p = 9.8e −06), we further performed differential and prognostic survival analyses for hsa-miR-141-3p. Results showed that the expression of LY9 was expressed at higher levels in LUAD tissues than in normal ones (Fig. 5B, p = 2.22e−16), and patients with high hsa-miR-141-3p expression had longer OS (Fig. 5C, p = 0.012). Thereafter, we downloaded lncRNAs predicted to bind hsa-miR-141-3p from the DIANA-tools database LncBase Experimental v.2 and performed correlation and differential expression analyses. We found that RNF216P1 and LINC00943 had a correlation >0.2 and p < 0.05 (Table 3). Then, we performed differential expression and survival analyses of RNF216P1 and LINC00943 with LY9 expression. Results showed that the correlation between LY9 and RNF216P1 was not strong and not statistically significant (Fig. 5I, r = 0.055, p = 0.23). Meanwhile, a stronger and more significant positive correlation was found between LINC00943 and LY9 (Fig. 5E, r = 0.44, p < 2.2e −16). LINC00943 was also expressed at higher levels in LUAD tissues (Fig. 5F, p = 2.8e−07). This higher expression was associated with better OS (Fig. 5G, p = 0.018). Therefore, we hypothesized the existence of a ceRNA regulatory network of LINC00943 - hsa-miR-141-3p - LY9 (Fig. 5L). Finally, we constructed the PPI network of LY9 using the GeneCards database (Fig. 5M). The results indicated that the proteins with co-expression association with LY9 were INPP5D, LAT, INPPL1, PTPN11, SYK, SH2D1A, ZAP70, and SH2D1B. However, these findings need more experiments to validate.
| Gene | miRNA | cor | pvalue | logFC | diff P val |
|---|---|---|---|---|---|
| LY9 | hsa-miR-141-3p | −0.20178 | 9.76E−06 | 2.385256 | 2.98E−22 |
| LY9 | hsa-miR-4746-5p | −0.13013 | 0.004502 | 0.357495 | 0.000246 |
| LY9 | hsa-miR-151a-5p | −0.12997 | 0.004578 | 1.420317 | 3.17E−22 |
| LY9 | hsa-miR-17-3p | −0.12196 | 0.007821 | 0.569332 | 0.00572 |
| LY9 | hsa-miR-301b-5p | −0.11857 | 0.009696 | 0.708976 | 9.46E−15 |
| LY9 | hsa-miR-4786-3p | −0.11229 | 0.014343 | 0.111628 | 0.01539 |
| LY9 | hsa-miR-629-5p | −0.10571 | 0.021251 | 1.228226 | 2.17E−19 |
Figure 5: LINC00943 - hsa-miR-141-3p - LY9-regulated ceRNA network.
(A) Correlation of hsa-miR-141-3p expression with LY9 expression in LUAD. The blue line is the best-fit curve, black dots represent samples, and gray shading represents 95% confidence intervals, as are B, D, E, H, and I. (B) Differential expression analysis of hsa-miR-141-3p in LUAD. (C) Evaluation of KM curves for the prognostic value of hsa-miR-141-3p in LUAD patients. (D) Correlation between LINC00943 and hsa-miR-141-3p expression in LUAD patients. (E) Correlation between LINC00943 and LY9 expression in LUAD patients. (F) Differential expression analysis of LINC00943 in LUAD. (G) Evaluation of KM curves for LINC00943 prognostic value in LUAD patients. (H) Correlation between RNF236P1 and hsa-miR-141-3p expression in LUAD patients. (I) Correlation between RNF236P1 and LY9 expression in LUAD patients. (J) Differential expression analysis of RNF236P1 in LUAD. (K). Evaluation of KM curves for RNF236P1 prognostic value in LUAD patients. (L) LY9-associated miRNA networks and ceRNA regulatory networks. (M) The most relevant protein-protein interaction (PPI) network for LY9.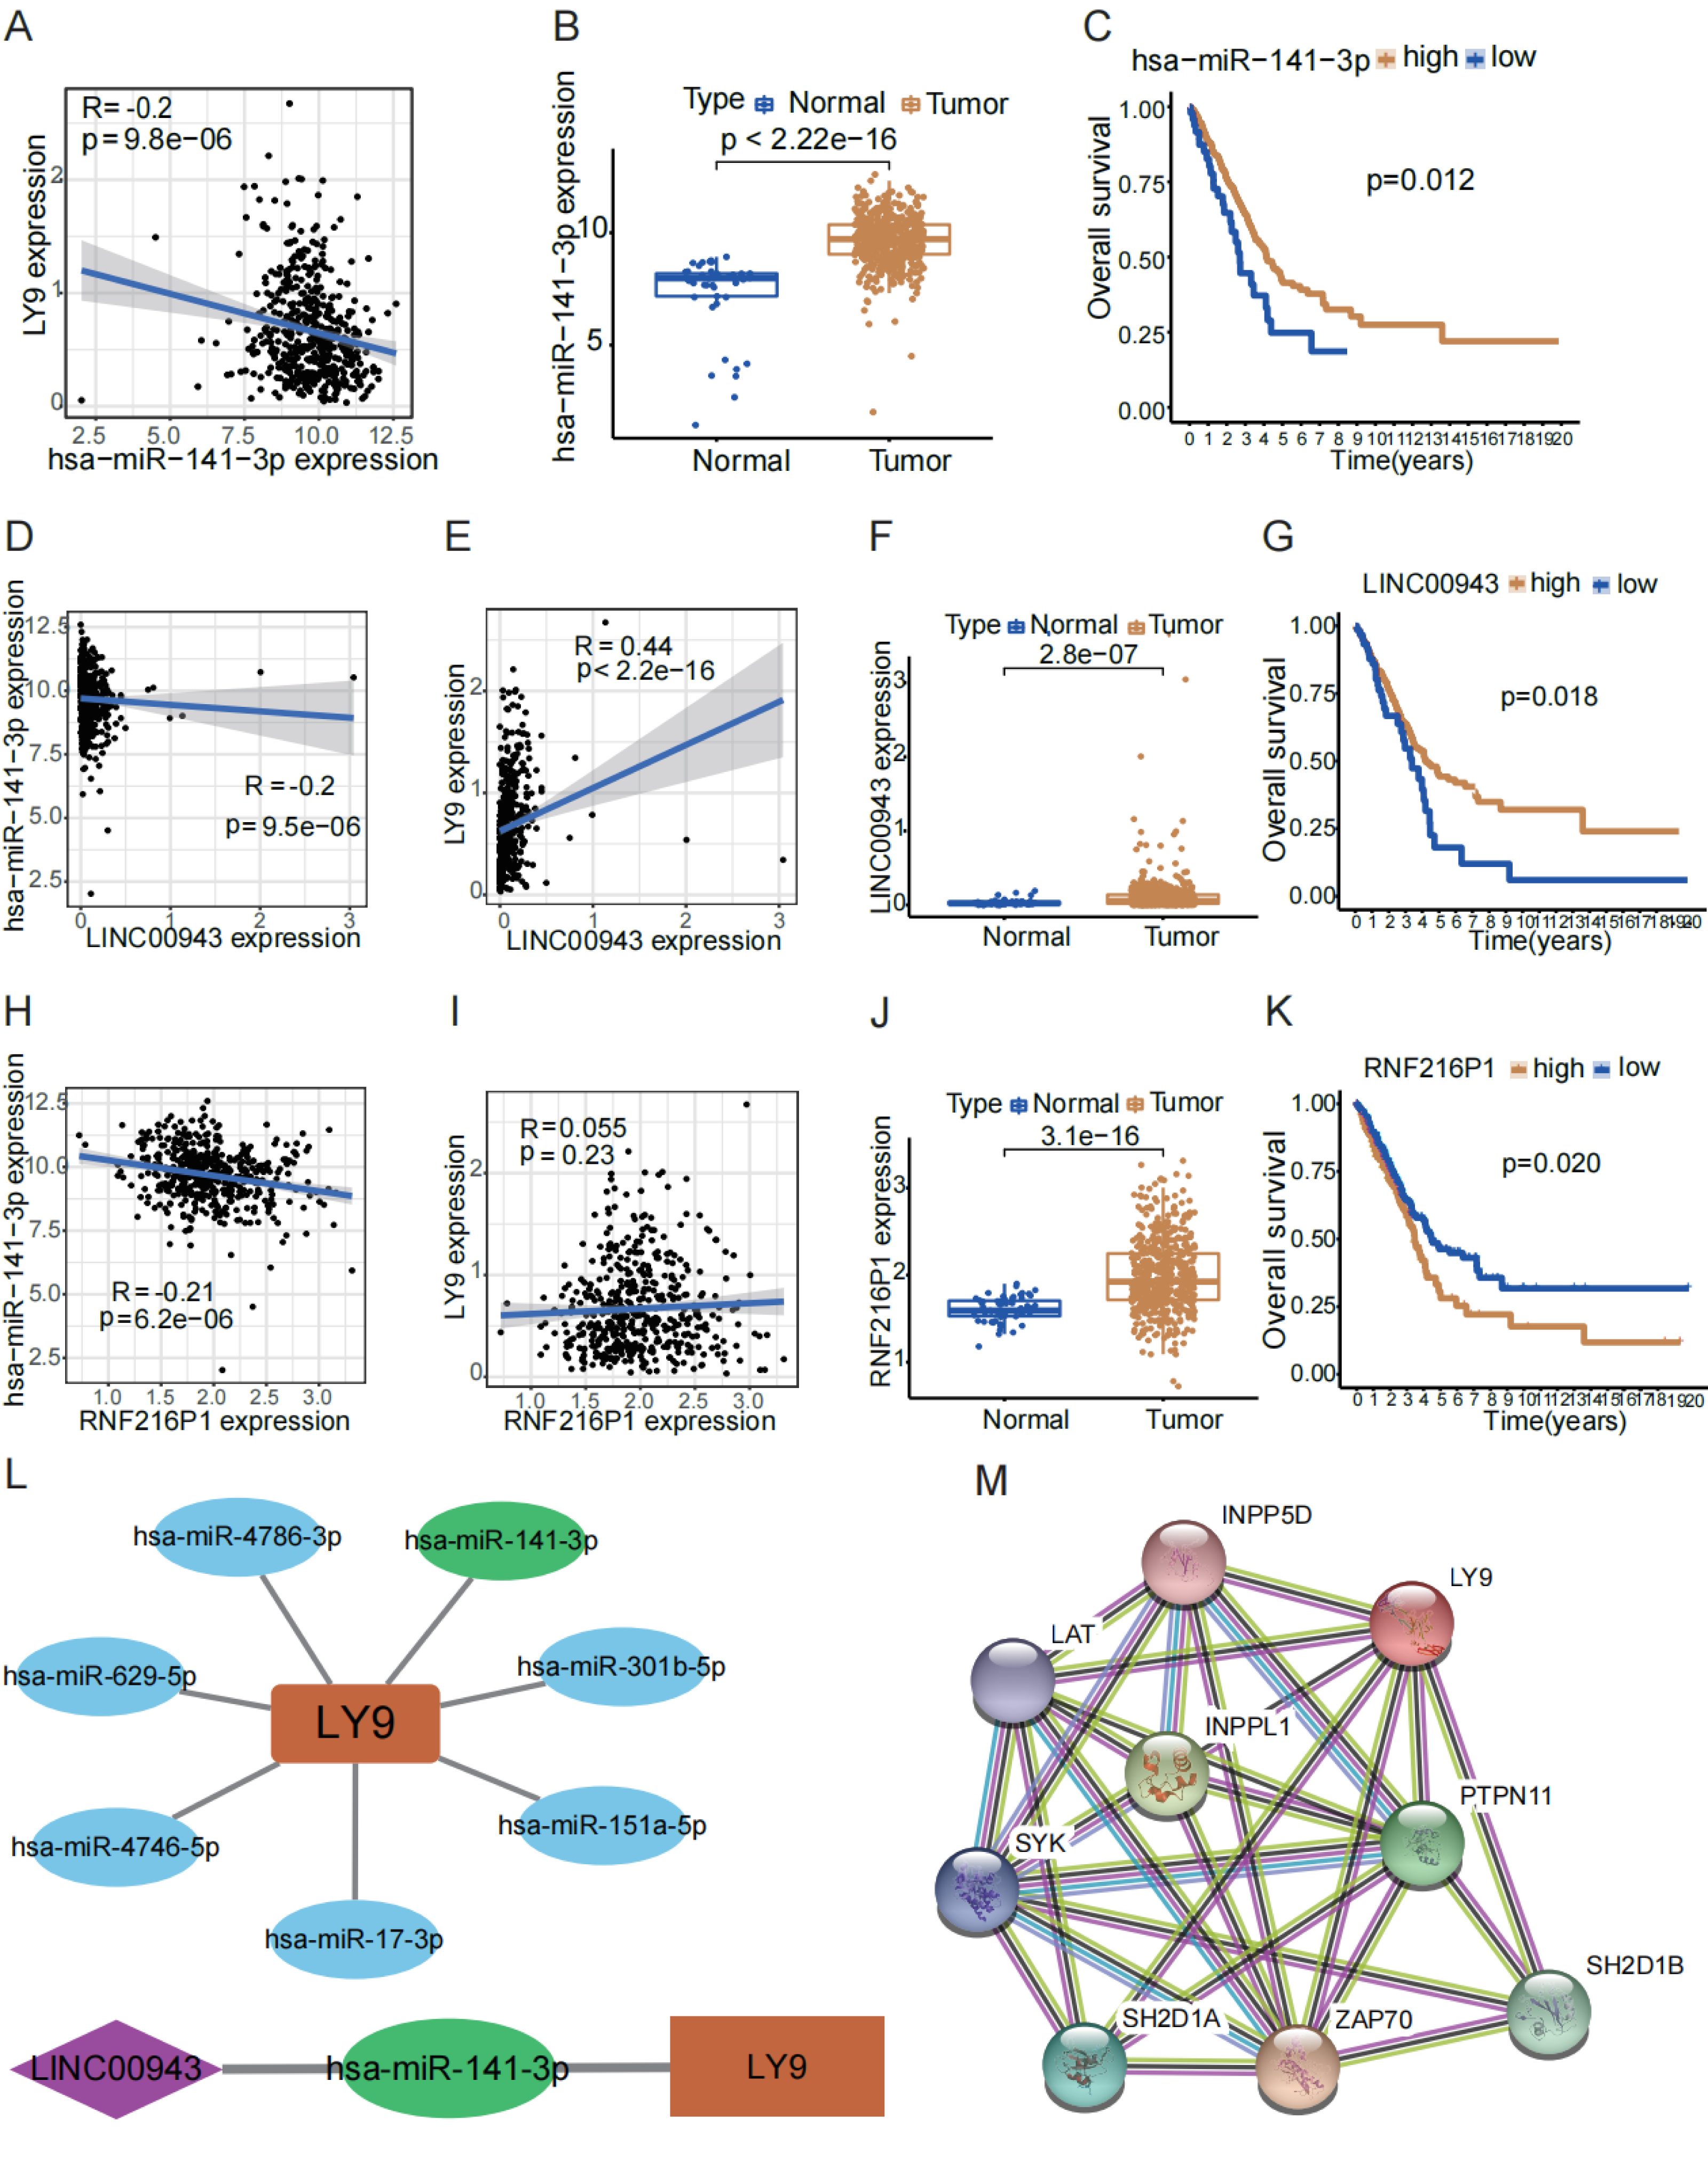
| lncRNA | miRNA | cor | p value | logFC | diff P val |
|---|---|---|---|---|---|
| DNM3OS | hsa-miR-141-3p | −0.28309 | 3.99E−10 | 0.077334 | 0.815973 |
| RNF216P1 | hsa-miR-141-3p | −0.20621 | 6.15E−06 | 0.383655 | 3.07E−16 |
| LINC00943 | hsa-miR-141-3p | −0.20159 | 9.53E−06 | 0.082655 | 2.78E−07 |
Correlation of LY9 expression levels in LUAD with immune cell infiltration and immune checkpoints
Through differential expression analysis and exploration of prognostic value in the above databases, we found that LY9 was differentially expressed in cancerous and paraneoplastic tissues and significantly correlated with prognostic value in LUAD patients. Therefore, we selected the TIMER 2.0 database to explore the correlation between the LY9 expression level in LUAD, and the infiltration of various immune cells in the TME. Results suggested a significant positive correlation with the level of B cells, CD4+ T cells, CD8+ T cells, neutrophils, macrophages, and dendritic cells (Fig. 6E). We also used the CIBERSORT algorithm to calculate the relative expression levels of 23 immune cells in each LUAD patient and to calculate the correlation between these immune cells. Then, we used a differential expression approach (i.e., we divided the patients into high and low groups according to the LY9 expression level), then calculated whether there was a difference in immune cell expression between high and low LY9 expression groups. We used a violin plot to show the results (Fig. 6A). Then, we analyzed the correlation between LY9 expression and these 23 immune cells using the Spearman correlation test. Results are shown in the correlation coefficient bar graph (Fig. 6B). These two methods showed that LY9 expression in LUAD was associated with 13 immune cells (Fig. 6C). They were Plasma cells, T cells CD8, T cells CD4 memory resting, T cells CD4 memory activated, T cells regulatory (Tregs), NK cells activated, Monocytes, Macrophages M0, Macrophages M1, Macrophages M2, Dendritic cells activated, Mast cells activated and Neutrophils. We also found that LY9 was significantly positively correlated with the B cell markers CD19 and CD79A, the CD8+T cell marker CD8, the CD4+T cell marker CD4, and the neutrophil marker CCR7 (Fig. 6D). This result indicated that LY9 might be a LUAD biomarker and can be used as a target for immunotherapy. Similarly, the TIMER database results showed that the LY9 expression in LUAD was strongly and positively correlated with the expression levels of CD8 and CD4 T cells (Fig. 6E). Additionally, the GEPIA (Figs. 6F–6H) and TIMER (Figs. 6I–6K) databases results suggested that the LY9 expression in LUAD was significantly and positively correlated with the immune checkpoints CD274, PDCD1, and CTLA4. These results demonstrated that LY9 was strongly positively associated with CD8+ and CD4+ T cell infiltration in the tumor microenvironment of LUAD, and was strongly positively associated with the expression of immune checkpoint genes. Therefore, we hypothesized that the expression status of LY9 might affect the therapeutic effect of immune checkpoint inhibitors in LUAD patients.
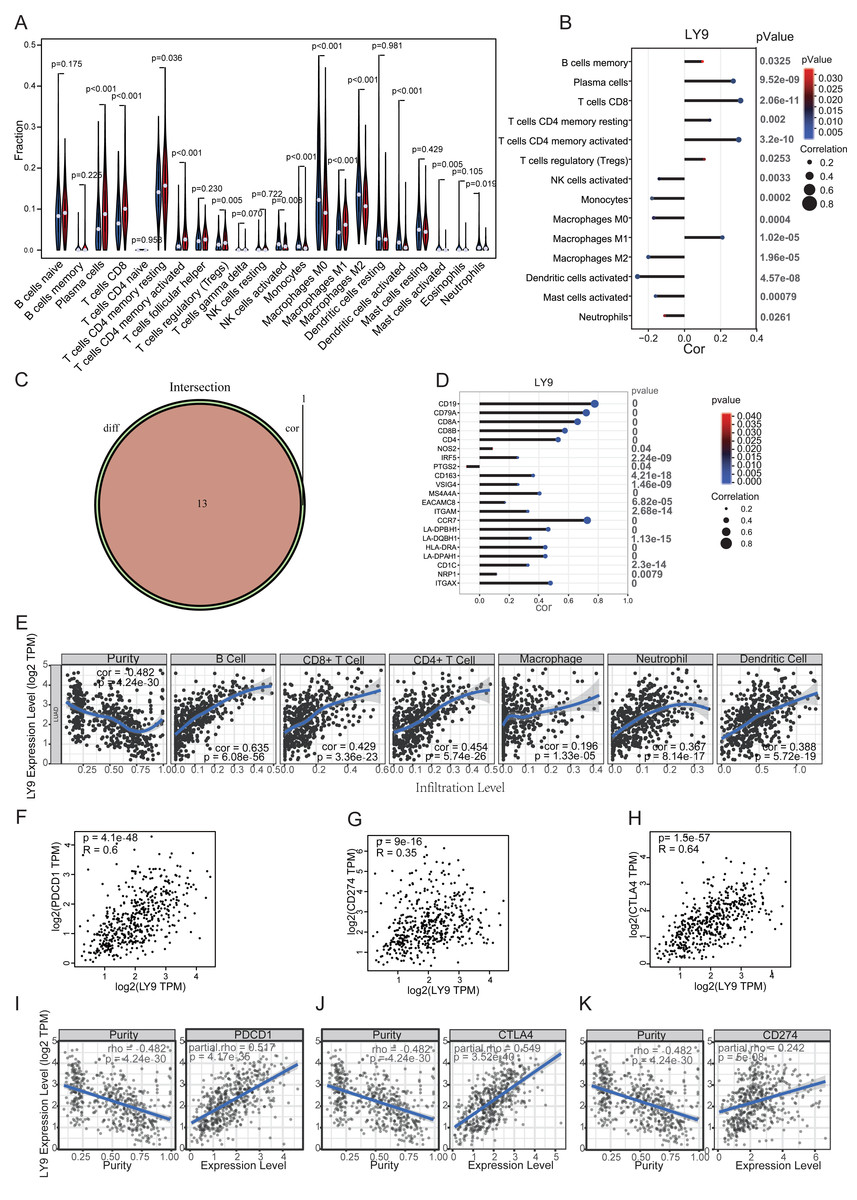
Figure 6: Correlation of LY9 expression in LUAD with immune cell infiltration and immune checkpoints.
(A) Correlation of LY9 expression in LUAD with immune cell infiltration by CIBERSORT differential expression analysis. (B) Correlation of LY9 expression in LUAD with immune cell infiltration by CIBERSORT and Spearman correlation analyses. (C) Number of intersecting immune cells obtained by CIBERSORT differential expression and Spearman correlation analyses (n = 13). (D) Correlation of LY9 expression in LUAD with immune cell marker genes. (E) Correlation between LY9 expression levels in LUAD and immune cell infiltration in the TIMER2.0 database. The blue line is the best-fit curve, black dots represent samples, and gray shading represents 95% confidence intervals. (F–H) Correlation of LY9 expression in LUAD with immune checkpoints PDCD1, CD274, and CTLA4 from the GEPIA database. Black dots represent samples. (I–K) Correlation of LY9 expression in LUAD with immune checkpoints PDCD1, CD274, and CTLA4 from TIMER2.0 database. The blue line is the best-fit curve, black dots represent samples, and gray shading represents 95% confidence intervals.
Validation using GEO dataset, qRT-PCR and IHC experiments
After averaging the Ct value obtained from the three amplifications, the relative quantification was performed by the 2−ΔΔCt method. The results of PCR experiments showed that the expression of LY9 in LUAD tissues was significantly and positively correlated with CD8 and CD4 expressions (Fig. 7A, CD8: R2 = 0.8541, p < 0.001; Fig. 7B, CD4: R2 = 0.4325, p = 0.003). Results showed that the expression of LY9 in LUAD was closely and positively associated with CD8 and CD4 expressions. Also, differential expression analysis of the LUAD RNA-seq dataset in the GEO database demonstrated high expression of LY9 in tumor tissues (Fig. 7E, P < 0.001), and therefore, we did not further validate it by experiment. Unfortunately, 26 pairs of LUAD tumor samples were negative for IHC experiments (Fig. 7C and 7D, only two tumor samples results are shown), which means the expression of LY9 at the protein level was relatively low. This may be one of the reasons for the low number of studies on LY9 in solid tumors in recent years. Therefore, the conclusions of this study were based only on the mRNA level of LY9.
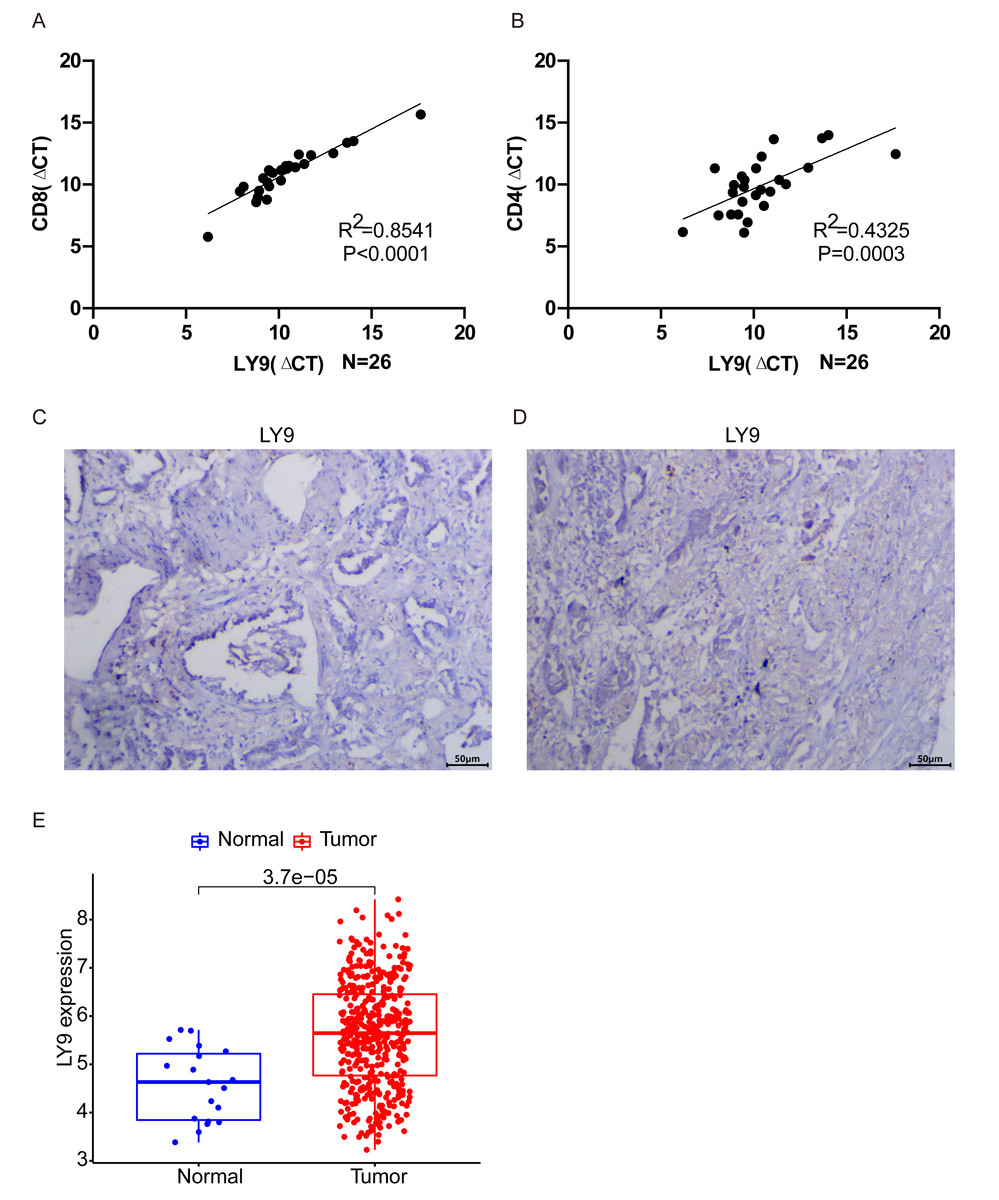
Figure 7: Validation of related experiments and GEO datasets.
(A) qRT-PCR assay to validate the correlation between LY9 and CD8 gene expression levels in LUAD. (B) qRT-PCR assay to validate the correlation between LY9 and CD4 gene expression levels in LUAD. (C–D) IHC assay to verify the expression of LY9 protein levels in LUAD tissues (only 2 samples are shown, the remaining samples also showed negative results). (E) Verification of differential expression of LY9 at mRNA levels in the GEO dataset of LUAD.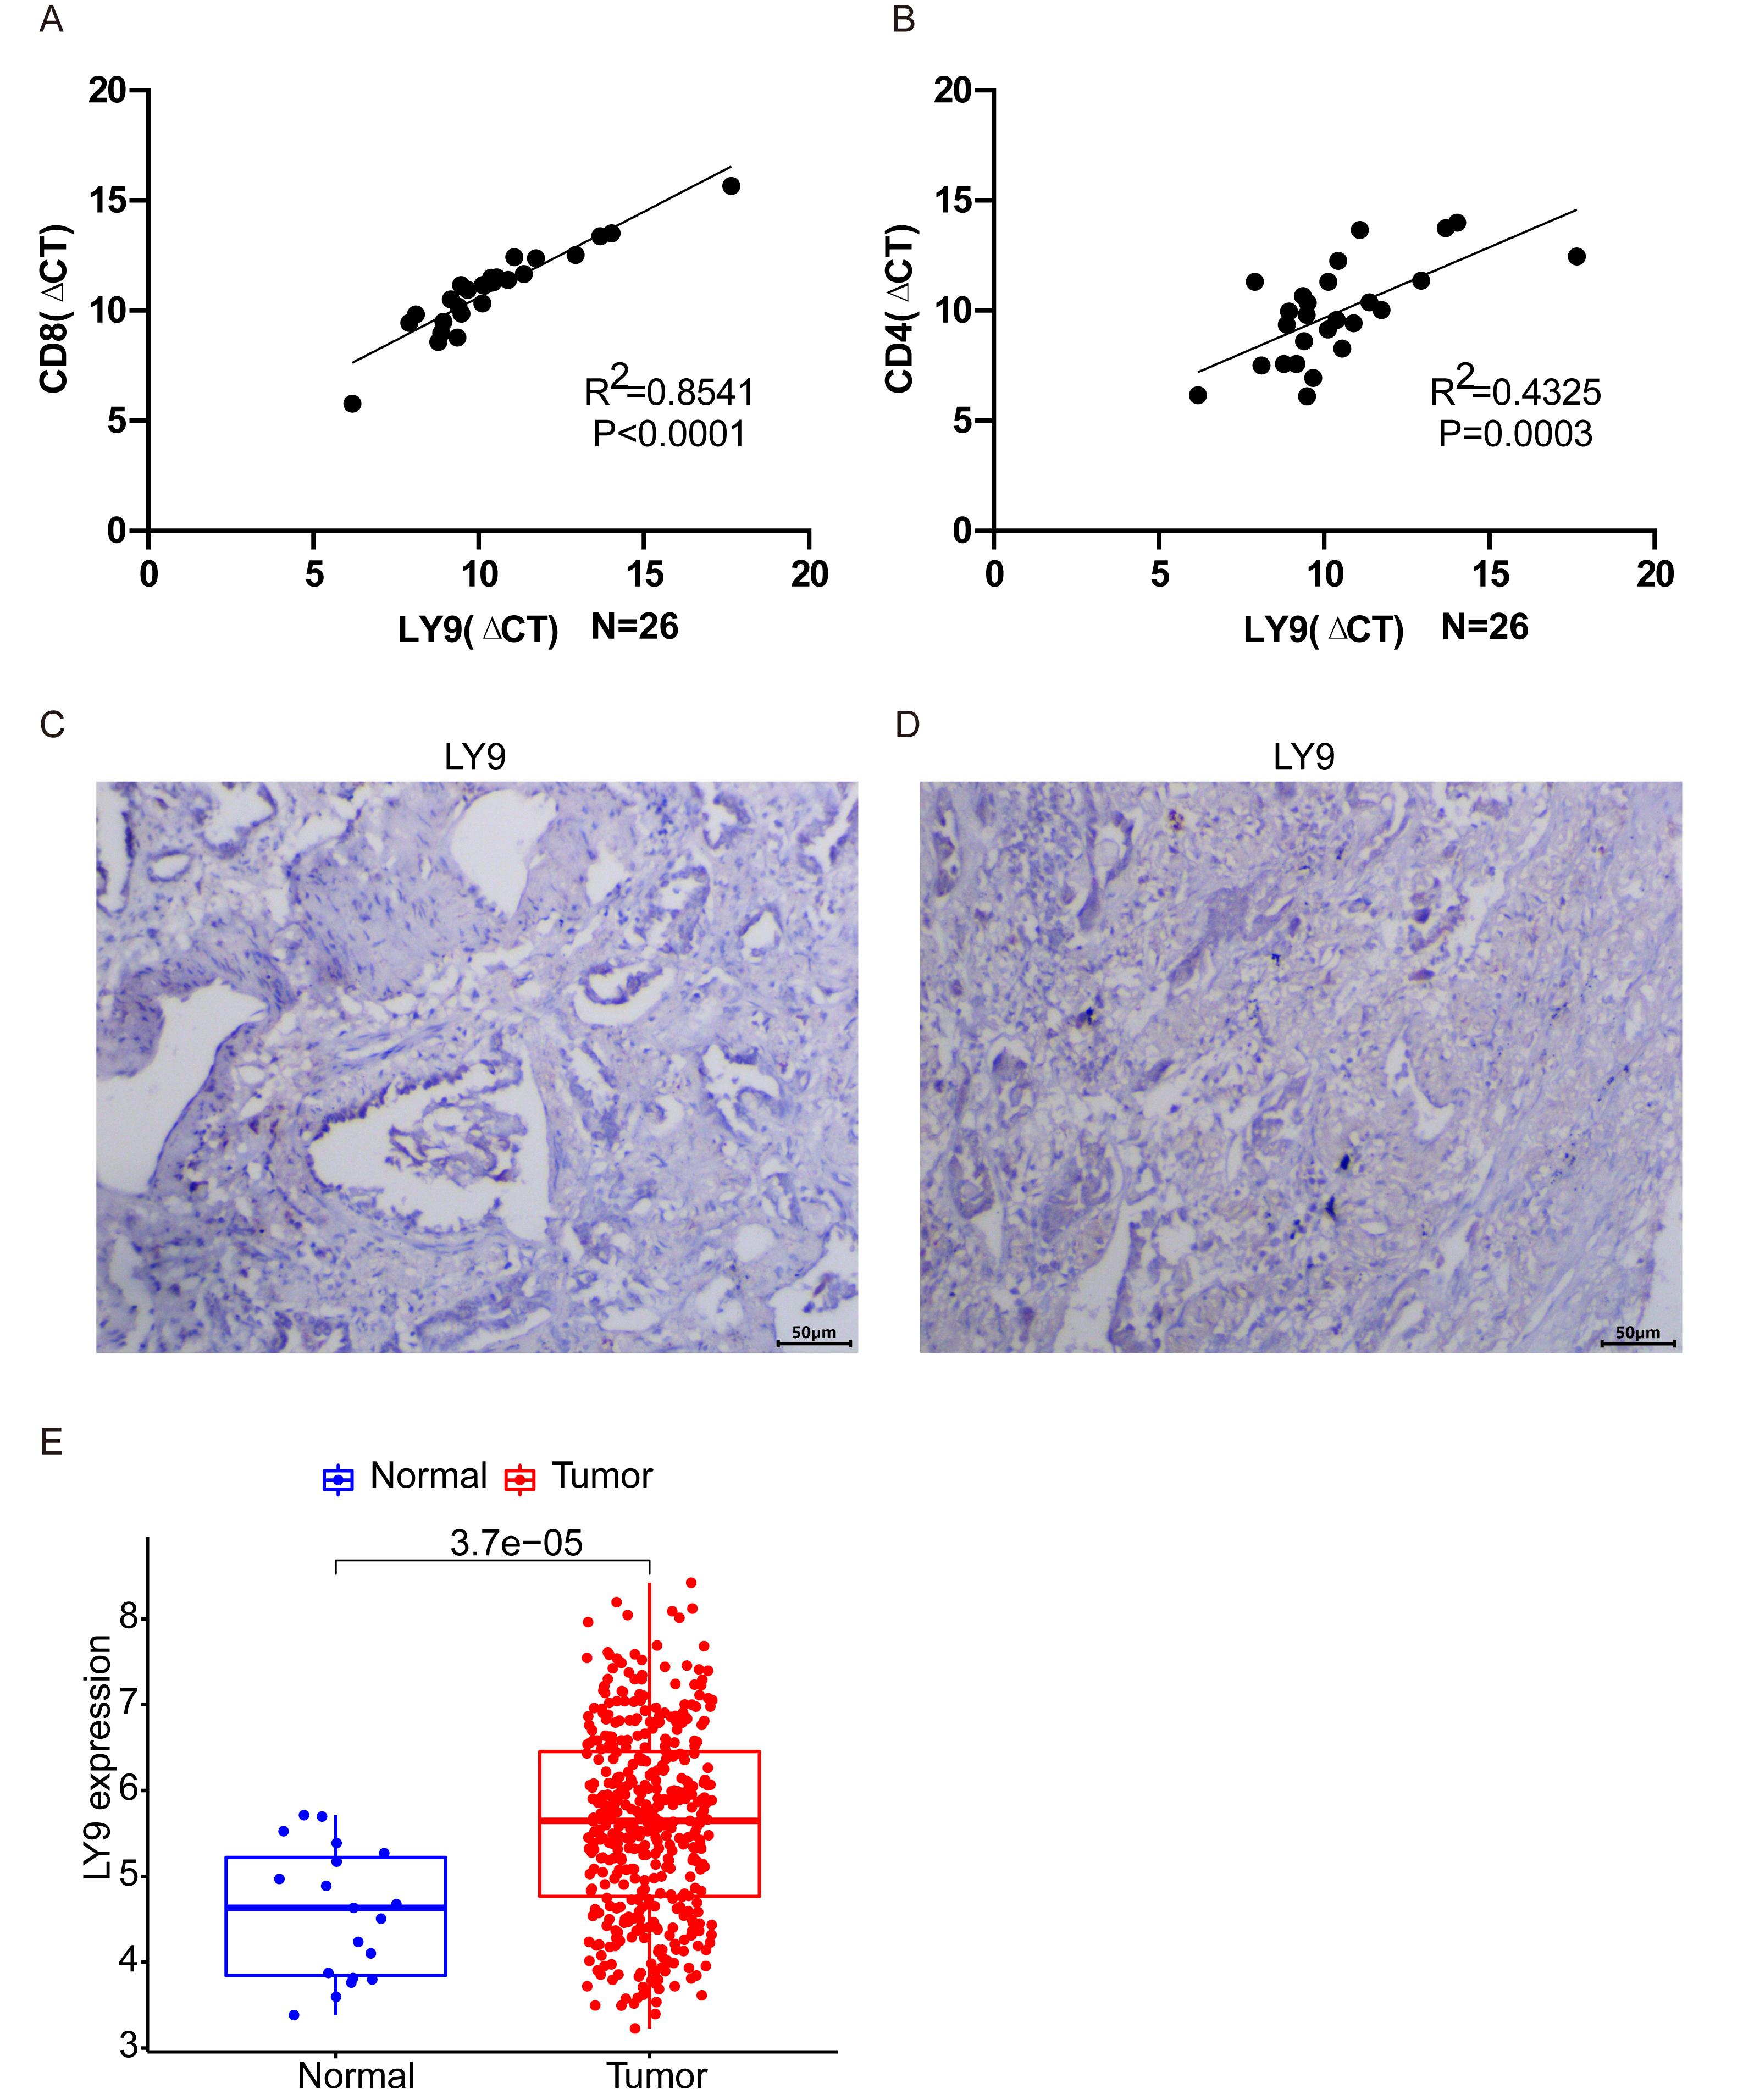
Discussion
LUAD is a disease with high morbidity and mortality, and surgical resection followed by adjuvant immunotherapy, or targeted therapy, is the predominant treatment modality. In the present study, we focused on the analysis of LY9 expression in 18 tumors (normal samples >5) from the TCGA database, retrieved from the UCSC website. Further, we performed survival analyses using the Kaplan–Meier and GEPIA databases. We found that LY9 was differentially expressed in LUAD and had prognostic significance. Then, we explored the correlation between the LY9 expression level in LUAD and the infiltration level of immune cells in the TME and immune checkpoints. Finally, we verified these results using qRT-PCR. Our results showed that LUAD patients with high LY9 expression levels had a better prognosis. The expression level of LY9 in LUAD was strongly positively correlated with the expression of CD8 and CD4 T cells. The GSEA results showed that LY9 was involved in different immune-related pathways and the development of small-cell lung cancer. Our results suggested that LY9 played a key role in immune cell infiltration in the LUAD TME, strongly indicating the potential of LY9 as an immunotherapeutic target.
Current immunotherapies, mainly represented by PD-1 and PD-L1 inhibitors, are important for the treatment of advanced non-small cell lung cancer patients (Mezquita et al., 2018). Previous studies have shown that PD1 immune checkpoint inhibitors act primarily by affecting CD8+ T effector cells, whereas CTLA4 by regulating CD4+ effector and regulatory T cell activity (Topalian et al., 2016). In our study, we found that the LY9 expression level in LUAD was significantly correlated with the immune checkpoints CD274, PDCD1, and CTLA4 by GEPIA and TIMER2.0 databases. Our experimental results further confirmed that the LY9 expression level in LUAD presented a high correlation with CD4 and CD8 T cells. Therefore, LY9 can be a novel therapeutic target for LUAD, but more experiments are still required to address this potential.
Besides the key role played by CD4 and CD8 T cells (Quaratino, Forssmann & Marschner, 2017), NKT cells are also important in the fight against tumor proliferation and progression (He et al., 2019; Ostroumov et al., 2018; Borst et al., 2018). LY9 deletion facilitates the differentiation of NKT2 cells, thereby increasing the number of innate CD8+ cells. Moreover, it has been experimentally demonstrated that, in vivo, the use of antibodies against LY9 reduces the number and activation of NKT cells in the spleen (Sintes et al., 2013; Cuenca et al., 2018). Additionally, type I and type II NKT cells form an immunomodulatory axis by cross-regulating each other, where type I NKT cells can promote anti-tumor immunity, while type II suppress tumor immunity (Kriegsmann et al., 2018; Terabe & Berzofsky, 2018). These studies demonstrate to some extent that LY9 upregulation leads to a decrease in type 2 NKT cell differentiation and a relative increase in type 1, thereby promoting antitumor immunity. This might explain why the prognoses are better in most tumors with high LY9 mRNA levels.
We also constructed the potential ceRNA regulatory network of LINC00943 - hsa-miR-141-3p - LY9 using online databases. Studies have shown that hsa-miR-141-3p can regulate cell migration and invasion in different cancers by silencing downstream targets (Guan et al., 2020), but its potential regulatory mechanisms in LUAD need to be further explored. LINC00943 was initially found to be aberrantly expressed in Parkinson’s disease (Lian et al., 2021), and recent studies have found that it is also involved in the regulation of proliferation and sensitivity to chemical drugs in gastric cancer cells (Xu et al., 2021). Our present study showed that LUAD patients with upregulated LINC00943 had a better prognosis. Currently, there are few studies related to LINC00943, hsa-miR-141-3p, and LY9, and their expression and mechanism of action in LUAD need to be further investigated. Since LY9 is in a high expression state in LUAD, the GSEA of the TCGA LUAD patient dataset showed that most pathways and functions involved in LY9 were also clustered in the high expression group. Previous studies have shown that LY9 is a unique inhibitory cell surface receptor that is crucial in the development and regulation of thymic innate CD8+ T cells and invariant natural killer T (i NKT) cells. Most surprisingly, LY9 is also involved in the non-small cell lung cancer process. The correlation between LY9 and other clinical characteristics of LUAD patients showed that the expression of LY9 tended to increase with age. Moreover, the overall trend of clinical and TNM staging showed a decreasing LY9 expression trend in early to advanced-stage patients. These results suggested that LUAD patients with high LY9 expression present better prognoses and more CD8 and CD4 T-cell infiltration. These characteristics might be related to the enhancement of anti-tumor immune efficacy by LY9 via the promotion of CD8 T cells, CD4 T cells, and NKT cells. Therefore, our current study identified LY9 as a tumor marker to assess the prognosis of LUAD patients and as a potential target for immunotherapy.
Conclusion
Overall, our results suggested that LY9 could be used as a novel tumor biomarker to assess the prognosis of LUAD patients as well as the sensitivity of immunotherapy and as a potential therapeutic target for immunotherapy. However, more studies are required to further assess this potential.