
Bioinformatic analysis and experimental validation of six cuproptosis-associated genes as a prognostic signature of breast cancer
- Published
- Accepted
- Received
- Academic Editor
- Vladimir Uversky
- Subject Areas
- Bioinformatics, Genetics, Oncology, Women’s Health
- Keywords
- Breast carcinoma, Cuproptosis, Bioinformatics, Prognostic signature, Tumor microenvironment
- Copyright
- © 2024 Chen et al.
- Licence
- This is an open access article distributed under the terms of the Creative Commons Attribution License, which permits using, remixing, and building upon the work non-commercially, as long as it is properly attributed. For attribution, the original author(s), title, publication source (PeerJ) and either DOI or URL of the article must be cited.
- Cite this article
- 2024. Bioinformatic analysis and experimental validation of six cuproptosis-associated genes as a prognostic signature of breast cancer. PeerJ 12:e17419 https://doi.org/10.7717/peerj.17419
Abstract
Background
Breast carcinoma (BRCA) is a life-threatening malignancy in women and shows a poor prognosis. Cuproptosis is a novel mode of cell death but its relationship with BRCA is unclear. This study attempted to develop a cuproptosis-relevant prognostic gene signature for BRCA.
Methods
Cuproptosis-relevant subtypes of BRCA were obtained by consensus clustering. Differential expression analysis was implemented using the ‘limma’ package. Univariate Cox and multivariate Cox analyses were performed to determine a cuproptosis-relevant prognostic gene signature. The signature was constructed and validated in distinct datasets. Gene set variation analysis (GSVA) and gene set enrichment analysis (GSEA) were also conducted using the prognostic signature to uncover the underlying molecular mechanisms. ESTIMATE and CIBERSORT algorithms were applied to probe the linkage between the gene signature and tumor microenvironment (TME). Immunotherapy responsiveness was assessed using the Tumor Immune Dysfunction and Exclusion (TIDE) web tool. Real-time quantitative PCR (RT-qPCR) was performed to detect the expressions of cuproptosis-relevant prognostic genes in breast cancer cell lines.
Results
Thirty-eight cuproptosis-associated differentially expressed genes (DEGs) in BRCA were mined by consensus clustering and differential expression analysis. Based on univariate Cox and multivariate Cox analyses, six cuproptosis-relevant prognostic genes, namely SAA1, KRT17, VAV3, IGHG1, TFF1, and CLEC3A, were mined to establish a corresponding signature. The signature was validated using external validation sets. GSVA and GSEA showed that multiple cell cycle-linked and immune-related pathways along with biological processes were associated with the signature. The results ESTIMATE and CIBERSORT analyses revealed significantly different TMEs between the two Cusig score subgroups. Finally, RT-qPCR analysis of cell lines further confirmed the expressional trends of SAA1, KRT17, IGHG1, and CLEC3A.
Conclusion
Taken together, we constructed a signature for projecting the overall survival of BRCA patients and our findings authenticated the cuproptosis-relevant prognostic genes, which are expected to provide a basis for developing prognostic molecular biomarkers and an in-depth understanding of the relationship between cuproptosis and BRCA.
Introduction
Breast carcinoma (BRCA) is the most common malignancy and the second leading cause of cancer-related deaths among women (Siegel et al., 2022). In most Asian countries, BRCA is a malignancy that threatens women’s lives (Mubarik et al., 2019), and its incidence is increasing more rapidly compared to Western countries (Mubarik et al., 2019; DeSantis et al., 2017). Based on the expression of hormone and cell membrane receptors, BRCA can be divided into four subtypes, namely luminal A-like, luminal B-like, HER2 positive, and triple-negative breast cancer (TNBC) (Goldhirsch et al., 2013). TNBC lacks expression of all three receptors and is an aggressive malignancy with a poor prognosis, accounting for 10–20% of all BRCA cases (Wahba & El-Hadaad, 2015). Clinically, some BRCA treatments, like mastectomy, chemotherapy, and radiotherapy, have serious side effects (Miller et al., 2016). Chemotherapy is more effective than mastectomy and radiotherapy for metastatic cancer (Chen et al., 2020); however, conventional chemotherapeutic drugs are associated with serious side effects such as neutropenia, stomatitis, and mucositis (Hesketh Paul et al., 2004). Nanoparticle-based cancer vaccines are currently being developed and are in the early stages (Wen et al., 2019). Therefore, although the prognosis of many BRCA patients has improved with the existing medical technology, due to individual differences, the clinical markers of tumor grade, tumor size, and TNM stage alone are far from satisfactory for personalised diagnosis and treatment. Moreover, many BRCA patients are still at risk of recurrence and death (Zhang et al., 2020; Bedenbender et al., 2019). There is therefore a need to develop new molecular prognostic markers and related therapeutic agents to achieve more precise treatment.
A recent study found that various copper ion carrier drugs such as elesclomol (ES), disulfiram, and NSC319726 can cause cell death. This copper-induced cell death or cuproptosis is a novel form that differs from other programmed cell death types (e.g., apoptosis, pyroptosis, necrosis, and ferroptosis) (Tsvetkov et al., 2022). Copper ions are necessary for all living things, including bacteria, animals, and humans. These also play a crucial role in biological processes as cofactors for key enzymes. While under normal physiological conditions, copper ions are kept at low concentrations in a state of dynamic equilibrium in living things, their excessive buildup may result in copper toxicity, which in turn can cause cell death. Further investigation into the potential cause of cuproptosis has revealed that copper ions can bind to thioctylated proteins in the tricarboxylic acid (TCA) cycle, contributing to abnormal oligomerization of thioctylated proteins and reduced Fe-S cluster protein levels, both of which cause a proteotoxic stress response that ultimately results in cell death. In addition, previous studies have shown that copper-chelating drugs can significantly increase the number of infiltrating CT8+ T and natural killer cells in tumor cells while reducing the growth rate of tumor cells (Voli et al., 2020). Recent studies have shown that cuproptosis-related genes are involved in numerous immune-related pathways in BRCA, whereby there is a heavy infiltration of CD4+, activated NK cells, memory T cells, macrophages, and CD8 T cells (Li et al., 2022; Huang et al., 2022; Li et al., 2022).
However, reports on cuproptosis in BRCA are relatively rare. In this study, we identified cuproptosis-relevant genes and their prognostic value in BRCA by bioinformatics and assessed the relationship between cuproptosis-relevant prognostic features and tumor microenvironment and immune cell infiltration. The findings are expected to facilitate the development of new treatment strategies for BRCA. Portions of this text were previously published as part of our preprint (https://www.researchsquare.com/article/rs-2123063/v1).
Materials and Methods
Data sources
The Cancer Genome Atlas (TCGA)-BRCA cohort comprising sequencing data and clinical information of 1,091 BRCA samples and 113 normal samples, was acquired from TCGA database (https://xenabrowser.net). Of these, 1,069 BRCA samples with survival information (after filtering out samples without details of age, M, N, T, and stage) were incorporated into the survival analysis. GSE42568 and GSE20711 cohorts were retrieved from the Gene Expression Omnibus (GEO) database (https://www.ncbi.nlm.nih.gov/) and employed as external validation sets for assessing the cuproptosis-relevant prognostic signature. GSE42568 and GSE20711 cohorts included 104 and 88 BRCA samples with corresponding survival information and data, respectively. The RNA-seq FPKM data of TCGA-BRCA cohort and GSE42568 dataset were normalized with log2 (FPKM+1) values. Ten cuproptosis-relevant genes (FDX1, LIAS, LIPT1, DLD, DLAT, PDHA1, PDHB, MTF1, GLS, and CDKN2A) were extracted from a previous study (Tsvetkov et al., 2022).
Additionally, human epithelial cell line from the mammary gland, MCF-10A (normal group), and three breast cancer cell lines, HCC1937, MCF-7, and MDA-MB-231 (BRCA group), were acquired from iCell Bioscience Inc (Shanghai, China), they were employed to perform RT-qPCR. Specifically, in the environment of 37 °C with 5% CO2, MCF-10A in MEGM Kit medium (Lonza/Clonetics, CC-3150), HCC1937 cells in RPMI-1640 medium (iCell-0002), MCF-7 cells in MEM basic medium (iCell-0012), and MDA-MB-231 cells in L15 medium (iCell-0009) were separately cultured.
Functional enrichment analysis
The online website DAVID (https://david.ncifcrf.gov/) (Sherman et al., 2022; Huang, Sherman & Lempicki, 2009) and the R package ‘clusterProfiler’ (Wu et al., 2021) were employed for Gene Ontology (GO) and Kyoto Encyclopedia of Genes and Genomes (KEGG) enrichment analyses (Kanehisa et al., 2017). GO terms were annotated as cellular component (CC), molecular function (MF), and biological process (BP).
Identifying BRCA-related subtypes
BRCA cases in TCGA-BRCA cohort were classified based on the expression of corresponding genes by consensus clustering using the ‘ConsensusClusterPlus’ package (Wilkerson & Hayes, 2010). The consensus matrix and consensus CDF curve were generated for selecting the optimal typing. Uniform manifold approximation and projection (UMAP) maximized the retention of features of the original data while reducing the feature dimensionality and was used to conduct dimensional reduction analysis on different subtypes.
Differential expression analysis
Depending on p-value < 0.05 and |log2FoldChange(FC)| > 0.5, we obtained differentially expressed genes (DEGs) using the ‘limma’ package (Ritchie et al., 2015).
Tumor microenvironment analysis
The ‘estimate’ package in R was utilized to compute the immune, stromal, and ESTIMATE scores, along with tumor purity for each BRCA sample (Yoshihara et al., 2013). Using the ssGSEA (Hänzelmann, Castelo & Guinney, 2013) and CIBERSORT algorithms (Newman et al., 2015), immune gene sets and the fraction of immune infiltrating cells were calculated for each BRCA sample.
Establishing cuproptosis-relevant prognostic signature in BRCA
First, we acquired genes that were significantly associated with overall survival (OS) of BRCA patients by univariate Cox analysis. Subsequently, we calculated the two principal components, PC1 and PC2, for each sample. The PC1 and PC2 values were subjected to multivariate Cox regression analysis to obtain corresponding coefficients; according to the formula, , where i represents the expression of genes, we calculated the Cusig score of each BRCA sample. The surv cutpoint function of the ‘survminer’ package (He et al., 2024) was used to obtain the optimal cutoff value to classify BRCA patients into the high-CuSig score and low-CuSig score groups. Kaplan-Meier (KM) curves were generated using the ‘survminer’ and the ‘survival’ packages (He et al., 2024; Liu et al., 2021; Shen et al., 2023).
Enrichment analysis of pre-defined gene sets based on the prognostic signature
Gene set variation analysis (GSVA) was implemented through the ‘gsva’ package in R (Hänzelmann, Castelo & Guinney, 2013; Subramanian et al., 2005) and ‘c2.cp.kegg.v7.2.symbols.gmt’ and ‘h.all.v7.5.1.symbols.gmt’ were the reference gene sets. Differential HALLMARK/KEGG entries were then obtained using the ‘limma’ package, and the filtering criteria were |log2FC| > 0.1 and p-value < 0.05. Gene set enrichment analysis (GSEA) (He et al., 2024) was also conducted by setting the GO gene set as the reference. The threshold values for significant entries were SIZE > 20 and NOM p-value < 0.05.
Immunotherapy efficacy analysis based on the prognostic signature
The sensitivity of the two Cusig score subgroups to immune checkpoint blockade (ICB) therapy was inferred and assessed on the Tumor Immune Dysfunction and Exclusion (TIDE) website (Jiang et al., 2018). The calculated TIDE value was used for evaluating the efficacy of immunotherapy.
Assessing mRNA expressions of cuproptosis-relevant prognostic genes in cell lines
The RT-qPCR validation was performed and reported according MIQE guidelines (Bustin et al., 2009). Total RNA from the one normal and three BRCA cell lines in the logarithmic phase was extracted using the TRIzol Reagent following the manufacturer’s instructions (Ambion, Austin, TX, USA). Chloroform (Chengdu Guerda Rubber Industry Co., LTD, Chengdu, China) was employed to remove proteins and fat-soluble magazines, ice isopropanol (Chengdu Guerda Rubber Industry Co., LTD, Chengdu, China) was utilized to precipitate RNA, and 75% ethanol (Chengdu Colon Chemical Co., LTD, Chengdu, China) was applied to further remove impurities. Following this, the RNA was solubilized by adding 20–50 μL of RNase-free water (Servicebio, Guangzhou, China) to the obtained RNA precipitate and the RNA concentration was detected with NanoPhotometer N50. Subsequently, total RNA was reverse transcribed into cDNA using the SweScript-First-strand-cDNA-synthesis-kit (Servicebio, Guangzhou, China) and the reaction system was made up of 4 μL of 5 × Reaction Buffer, 1 μL of primer, 1 μL of SweScript RT I Enzyme Mix, 0.1 ng-5 μg of total RNA, and nuclease-free water replenished to 20 μL. Afterthat, the qPCR was performed using the 2 × Universal Blue SYBR Green qPCR Master Mix following the manufacturer’s direction (Servicebio, Guangzhou, China) with the reaction system of 3 μL cDNA, 5 μL 2 × Universal Blue SYBR Green qPCR Master Mix and 1 μL each upstream and downstream primers. Finally, the reactions were performed on a CFX96 real-time quantitative fluorescence PCR instrument. The amplification reactions were programmed with pre-denaturation at 95 °C for 1 min, followed by 40 cycles, each cycle consisting of 95 °C for 20 s, 55 °C for 20 s, and 72 °C for 30 s. The relative expression of genes was calculated by the 2−ΔΔCt method using GADPH as the internal reference gene. p-value was calculated by Graphpad Prism 5, and p less than 0.05 was considered to have statistical difference. The sequences of the primers used in this study are presented in Table 1, and the concentration of primer was 10 μM. The amplicon size was 80–350 bp.
| Primer | Sequences |
|---|---|
| CLEC3A For | GGACTTGTAATTTGCATCCTGG |
| CLEC3A Rev | CTTGTGAACTTTAGTGCCTCGG |
| KRT17 For | GATGCCGAGGATTGGTTCTT |
| KRT17 Rev | TCTCTGTCTCCGCCAGGTTG |
| SAA1 For | GGTTTTCTGCTCCTTGGTCCT |
| SAA1 Rev | AGCCGATGTAATTGGCTTCTC |
| TFF1 For | CCCTCCCAGTGTGCAAATAAG |
| TFF1 Rev | GAACGGTGTCGTCGAAACAG |
| IGHG1 For | CTGGCTGAATGGCAAGGAGTA |
| IGHG1 Rev | GCGATGTCGCTGGGATAGAAG |
| VAV3 For | ACATTTCTTTCAGAACAAGGGAC |
| VAV3 Rev | GAATAATCTACTGGTTTGGGCAC |
| GAPDH For | CCCATCACCATCTTCCAGG |
| GAPDH Rev | CATCACGCCACAGTTTCCC |
Statistical analysis
The somatic mutation analysis and visualization were using the ‘maftools’ package in R. All bioinformatics analyses were undertaken in R language. The Wilcoxon test (comparison between two groups), Kruskal-Wallis test (comparison between three or more groups), and chi-square test (correlation analysis between cuproptosis-relevant subtypes and clinical factors) were employed to compare the data from different groups. Unless specified, a p-value < 0.05 was considered statistically significant.
Results
Expression of ten cuproptosis-relevant genes in BRCA
First, we conducted the functional enrichment analysis of 10 cuproptosis genes (FDX1, LIAS, LIPT1, DLD, DLAT, PDHA1, PDHB, MTF1, GLS, and CDKN2A) using the DAVID web tool. As shown in Figs. 1A and 1B, 11 GO entries (5 BP, 4 CC, and 2 MF) and 8 KEGG pathways were enriched. These genes were involved in ‘acetyl-CoA biosynthetic process from pyruvate’, ‘mitochondrial acetyl-CoA biosynthetic process from pyruvate’, ‘tricarboxylic acid cycle’, ‘glucose metabolic process’, ‘protein lipoylation’, ‘pyruvate metabolism’, ‘glycolysis/gluconeogenesis’, ‘carbon metabolism’, ‘metabolic pathways’, ‘central carbon metabolism in cancer’, ‘lipoic acid metabolism’ and ‘biosynthesis of cofactors’. The locations of these 10 cuproptosis genes on the chromosomes are exhibited in the circle diagram (Fig. S1). Somatic mutation analysis of 986 samples with somatic mutation information from TCGA-BRCA cohort revealed a very low mutation rate of the 10 cuproptosis genes in BRCA from the index of tumbor mutational burden (TMB), thus there was a lower probability for natural immune response (NA) (Fig. 1C). Further analysis of transcriptomic data from TCGA-BRCA cohort revealed that the expressions of CDKN2A and PDHB were significantly elevated, and those of DLAT, DLD, FDX1, GLS, LIAS, LIPT1, MTF1, and PDHA1 was significantly lowered in BRCA samples compared to normal samples (p < 0.05) (Fig. 1D).
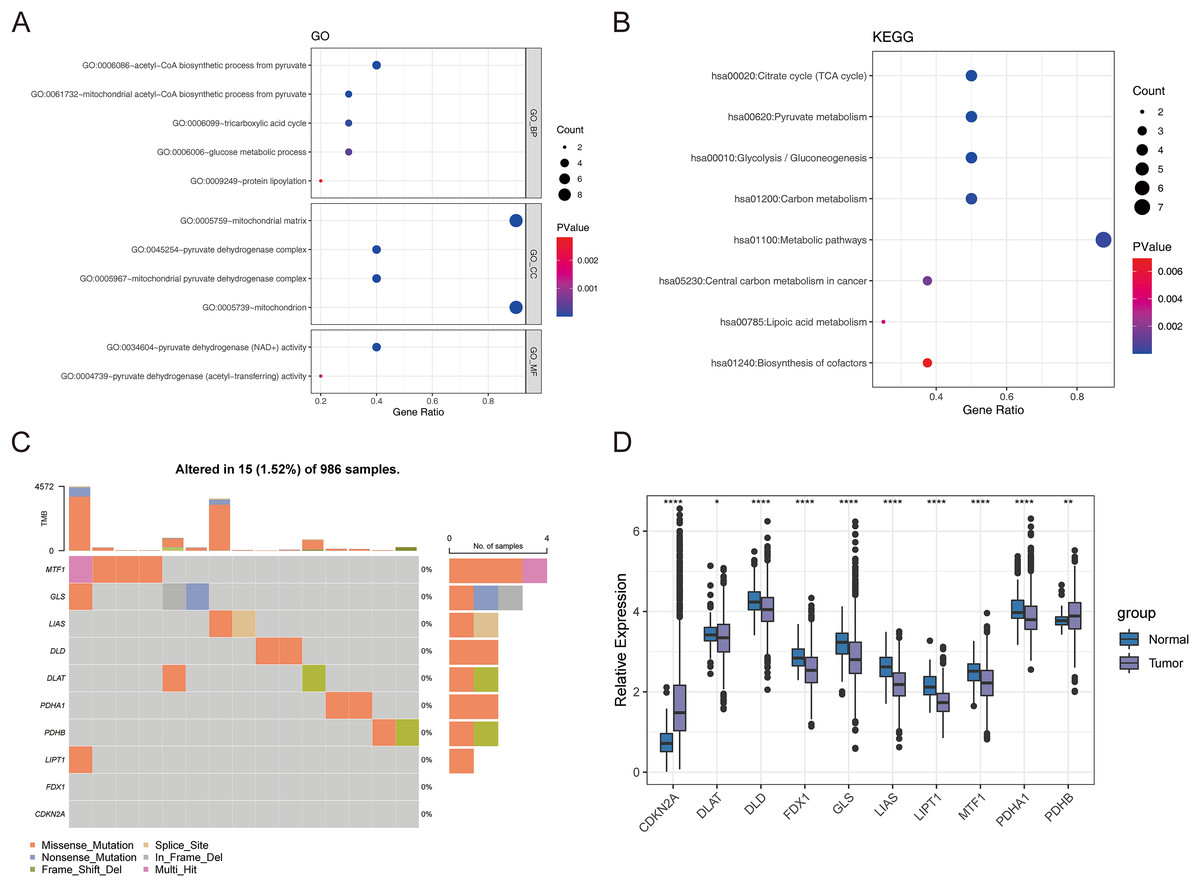
Figure 1: The expression of ten cuproptosis genes in BRCA.
(A and B) The GO and KEGG functional enrichment analysis of 10 cuproptosis genes. (C) Somatic mutational analysis of 10 cuproptosis genes in BRCA samples. (D) The expression trends of 10 cuproptosis genes in BRCA. *p < 0.05, **p < 0.01, ****p < 0.0001.
Identification of cuproptosis-associated subtypes of BRCA
Consensus clustering was implemented to identify BRCA-related subtypes, and 1,091 BRCA patients in TCGA-BRCA cohort were categorized into cuproptosis-associated subtypes based on the expression of 10 cuproptosis genes. Optimal clustering stability was confirmed at K = 3 (Figs. S2A–S2C). Clusters 1, 2, and 3 included 473, 296, and 322 samples, respectively. UMAP reduced dimensional analysis demonstrated that the samples of cluster 1 and cluster 2 were distributed separately and could be well distinguished (Fig. 2A). Survival analysis revealed significantly higher OS for patients in cluster 1 than in cluster 2 (p = 0.03688) (Fig. 2B). By chi-square tests, we examined the correlation between three cuproptosis-associated subtypes and clinical factors. The results showed that the three subtypes were significantly associated with age, race, and Node stage (N stage) but not with Tumor stage (T stage), Metastasis stage (M stage), and stage (Figs. 2C–2H). To further explore the discrepancies in the TMEs of the three cuproptosis-associated subtypes, we first calculated and compared the immune scores, stromal scores, estimate scores, and tumor purity across the three subtypes. As shown in Figs. 3A–3D, the stromal scores of all three subtypes were significantly different. The immune score, stromal score, and estimate score of cluster 1 and cluster 2 were significantly higher than those of cluster 3, and the tumor purity of cluster 1 and cluster 2 was significantly lower than that of cluster 3. Using the ssGSEA algorithm and Kruskal-Wallis test, we calculated and compared 28 immune gene sets across the three subtypes to further assess their differential immune activities. As shown in Figs. 3E and 3F, all 28 immune gene sets differed significantly among the three subtypes. To further compare the differences in fractions of immune cell infiltrates among the three subtypes, we employed the CIBERSORT algorithm and performed the Kruskal-Wallis test. The infiltration levels of a total of 14 immune cell types differed significantly among the three subtypes, including naïve B cells, memory B cells, activated dendritic cells, macrophages M1, macrophages M2, resting mast cells, neutrophils, activated NK cells, resting NK cells, resting CD4 memory T cells, activated CD4 memory T cells, CD8 T cells, follicular helper T cells, and regulatory T cells (Tregs) (Fig. 3G).
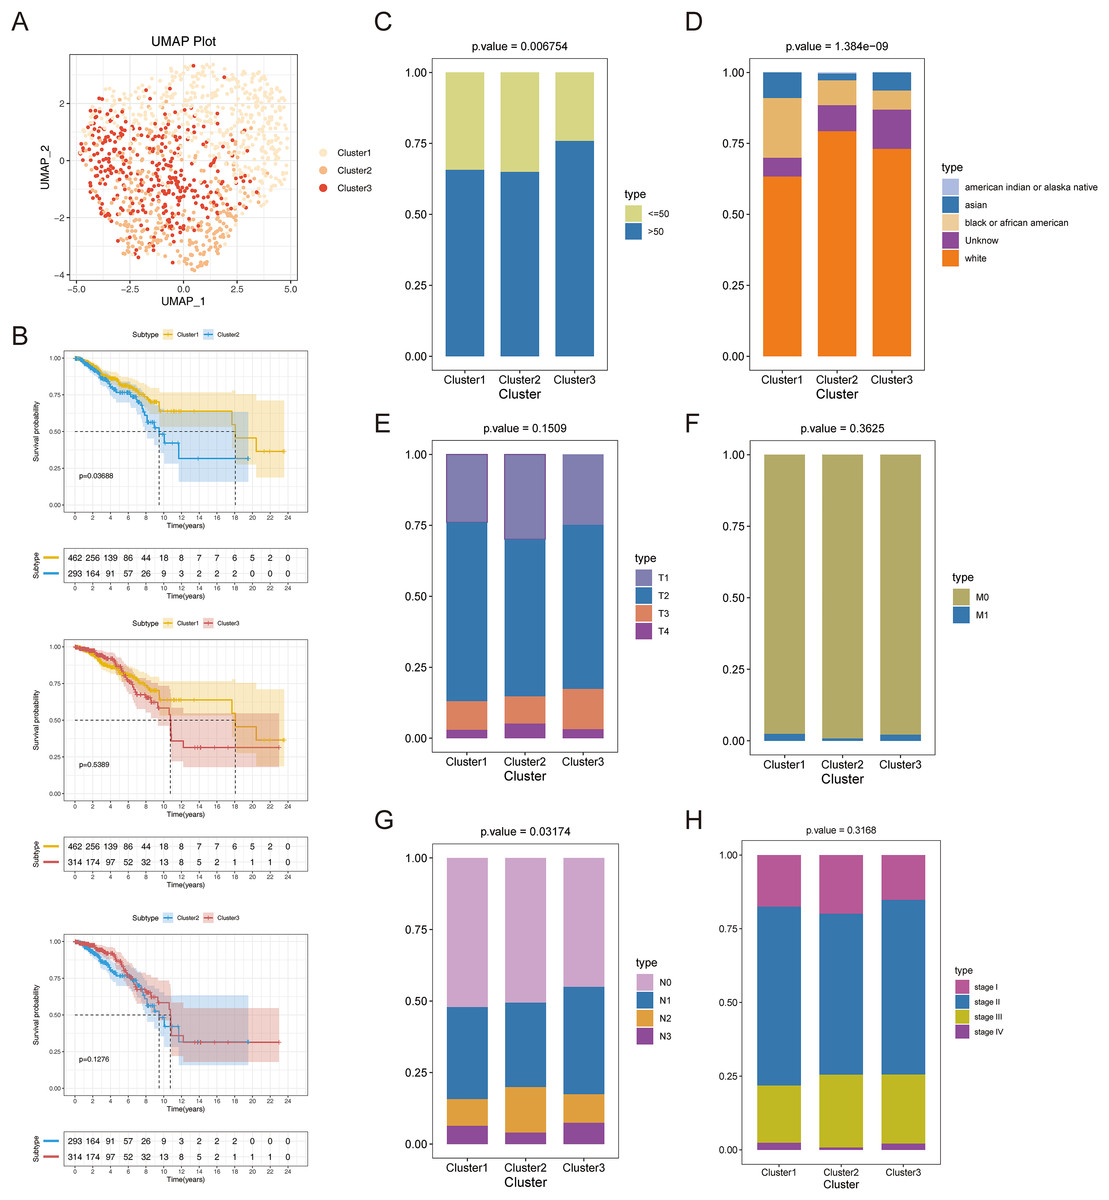
Figure 2: Recognition of cuproptosis-associated subtypes of BRCA.
(A) UMAP reduced dimensional analysis for three cuproptosis-related subtypes. (B) Kaplan-Meier curves of three cuproptosis-related subtypes. (C–H) Correlation analysis of three cuproptosis-related subtypes with clinical factors.
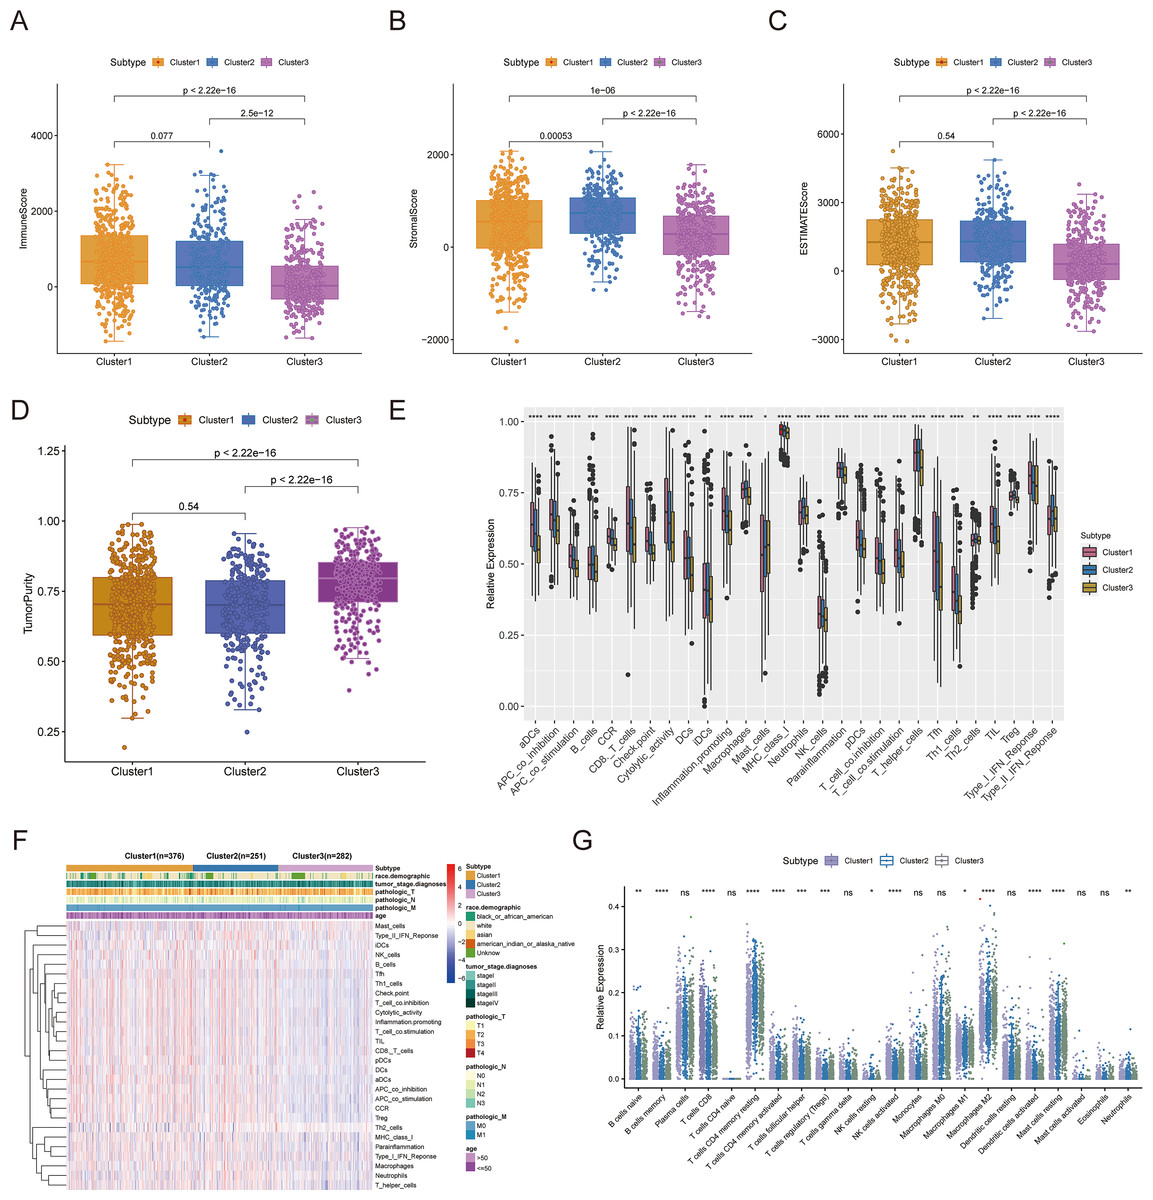
Figure 3: TME analysis of cuproptosis-associated subtypes of BRCA.
(A–D) Immune score, stromal score, ESTIMATE score, and tumor purity differences in three cuproptosis-related subtypes. (E and F) The fraction of 28 immune gene sets for three cuproptosis-associated subtypes. (G) Differential infiltration levels of 22 immune cell types in three cuproptosis-associated subtypes. ns: not significant, *p < 0.05, **p < 0.01, ***p < 0.001, ****p < 0.0001.
Cuproptosis-associated DEGs in BRCA
To authenticate the cuproptosis-associated DEGs in BRCA, we first identified the DEGs between BRCA and normal samples, between cluster 1 and cluster 2, between cluster 2 and cluster 3, and between cluster 1 and cluster 3. A total of 4,878 DEGs (2,441 up-regulated and 2,437 down-regulated genes) between BRCA and normal samples, 581 DEGs (270 up-regulated and 311 down-regulated genes) between cluster 1 and cluster 2, 705 DEGs (433 up-regulated and 272 down-regulated genes) between cluster 2 and cluster 3, and 1,221 DEGs (598 up-regulated and 623 down-regulated genes) between cluster 1 and cluster 3 were identified. By taking the intersection of the above four groups of DEGs using a Venn diagram, 38 common genes were defined as cuproptosis-associated DEGs in BRCA (Fig. 4A, Table S1). The results of Pearson correlation analysis between the 38 intersecting genes and 10 cuproptosis genes are shown in Fig. 4B. To further probe the function of these 38 genes in BRCA, a functional enrichment analysis was conducted. As shown in Table S2, 18 GO terms (13 BP, 2 CC, and 3 MF) and 1 KEGG pathway were significantly enriched. The top 10 items under each classification are shown in a bar diagram (Fig. 4C). The abovementioned genes were mainly linked to ‘response to iron ion’, ‘response to estradiol’, ‘response to estrogen’, ‘response to xenobiotic stimulus’, ‘neutrophil chemotaxis’, ‘response to drug’, ‘hormone metabolic process’, ‘mammary gland alveolus development’, and ‘estrogen signaling pathway’. We categorized the 1,091 BRCA patients in TCGA-BRCA cohort into five subtypes based on the expression of 38 cuproptosis-associated DEGs in BRCA and consensus clustering (Figs. S3A–S3C). Subtypes 1, 2, 3, 4, and 5 consisted of 225, 178, 210, 320, and 158 samples, respectively. The distribution of clinical features of the five subtypes and the expression of 38 cuproptosis-associated DEGs are shown as a heatmap (Fig. 4D). Survival analysis revealed no significant survival discrepancies among the five subtypes (Chi-square test = 6, df = 4, p = 0.2) (Fig. 4E).
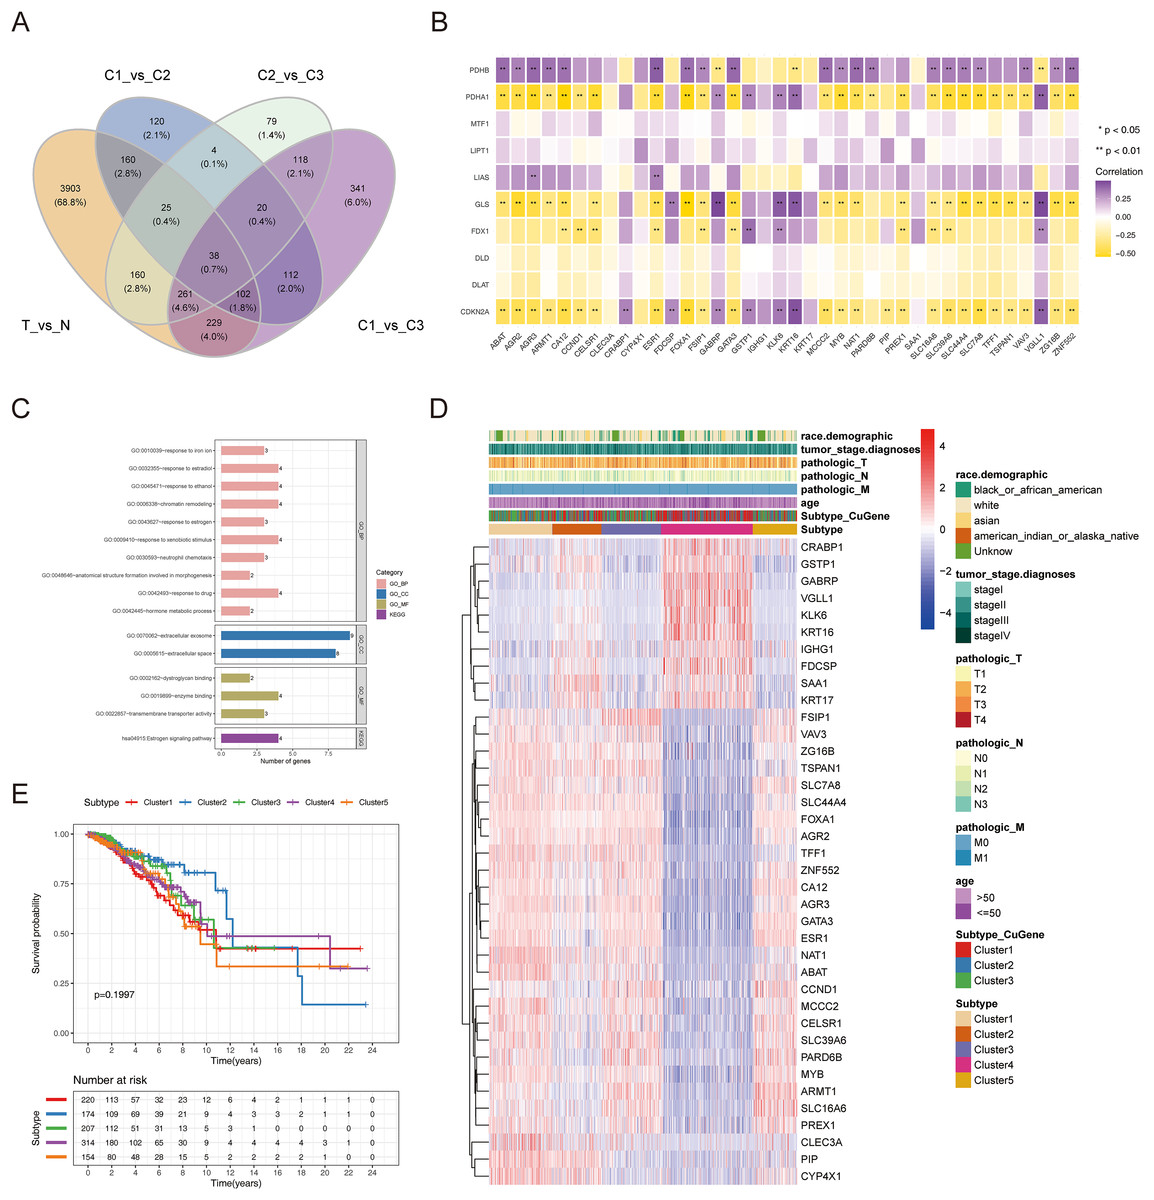
Figure 4: The cuproptosis-associated DEGs in BRCA.
(A) The Venn diagram to gain the cuproptosis-associated DEGs in BRCA. (B) Heatmap of the correlations between 38 intersecting genes and 10 cuproptosis-related genes. ** represents p < 0.01. (C) The results of functional enrichment analysis of 38 cuproptosis-associated DEGs in BRCA. (D) Distribution of clinical characteristics of five clustered subtypes and expression of 38 DEGs associated with cuproptosis. (E) Survival analysis among the five subtypes.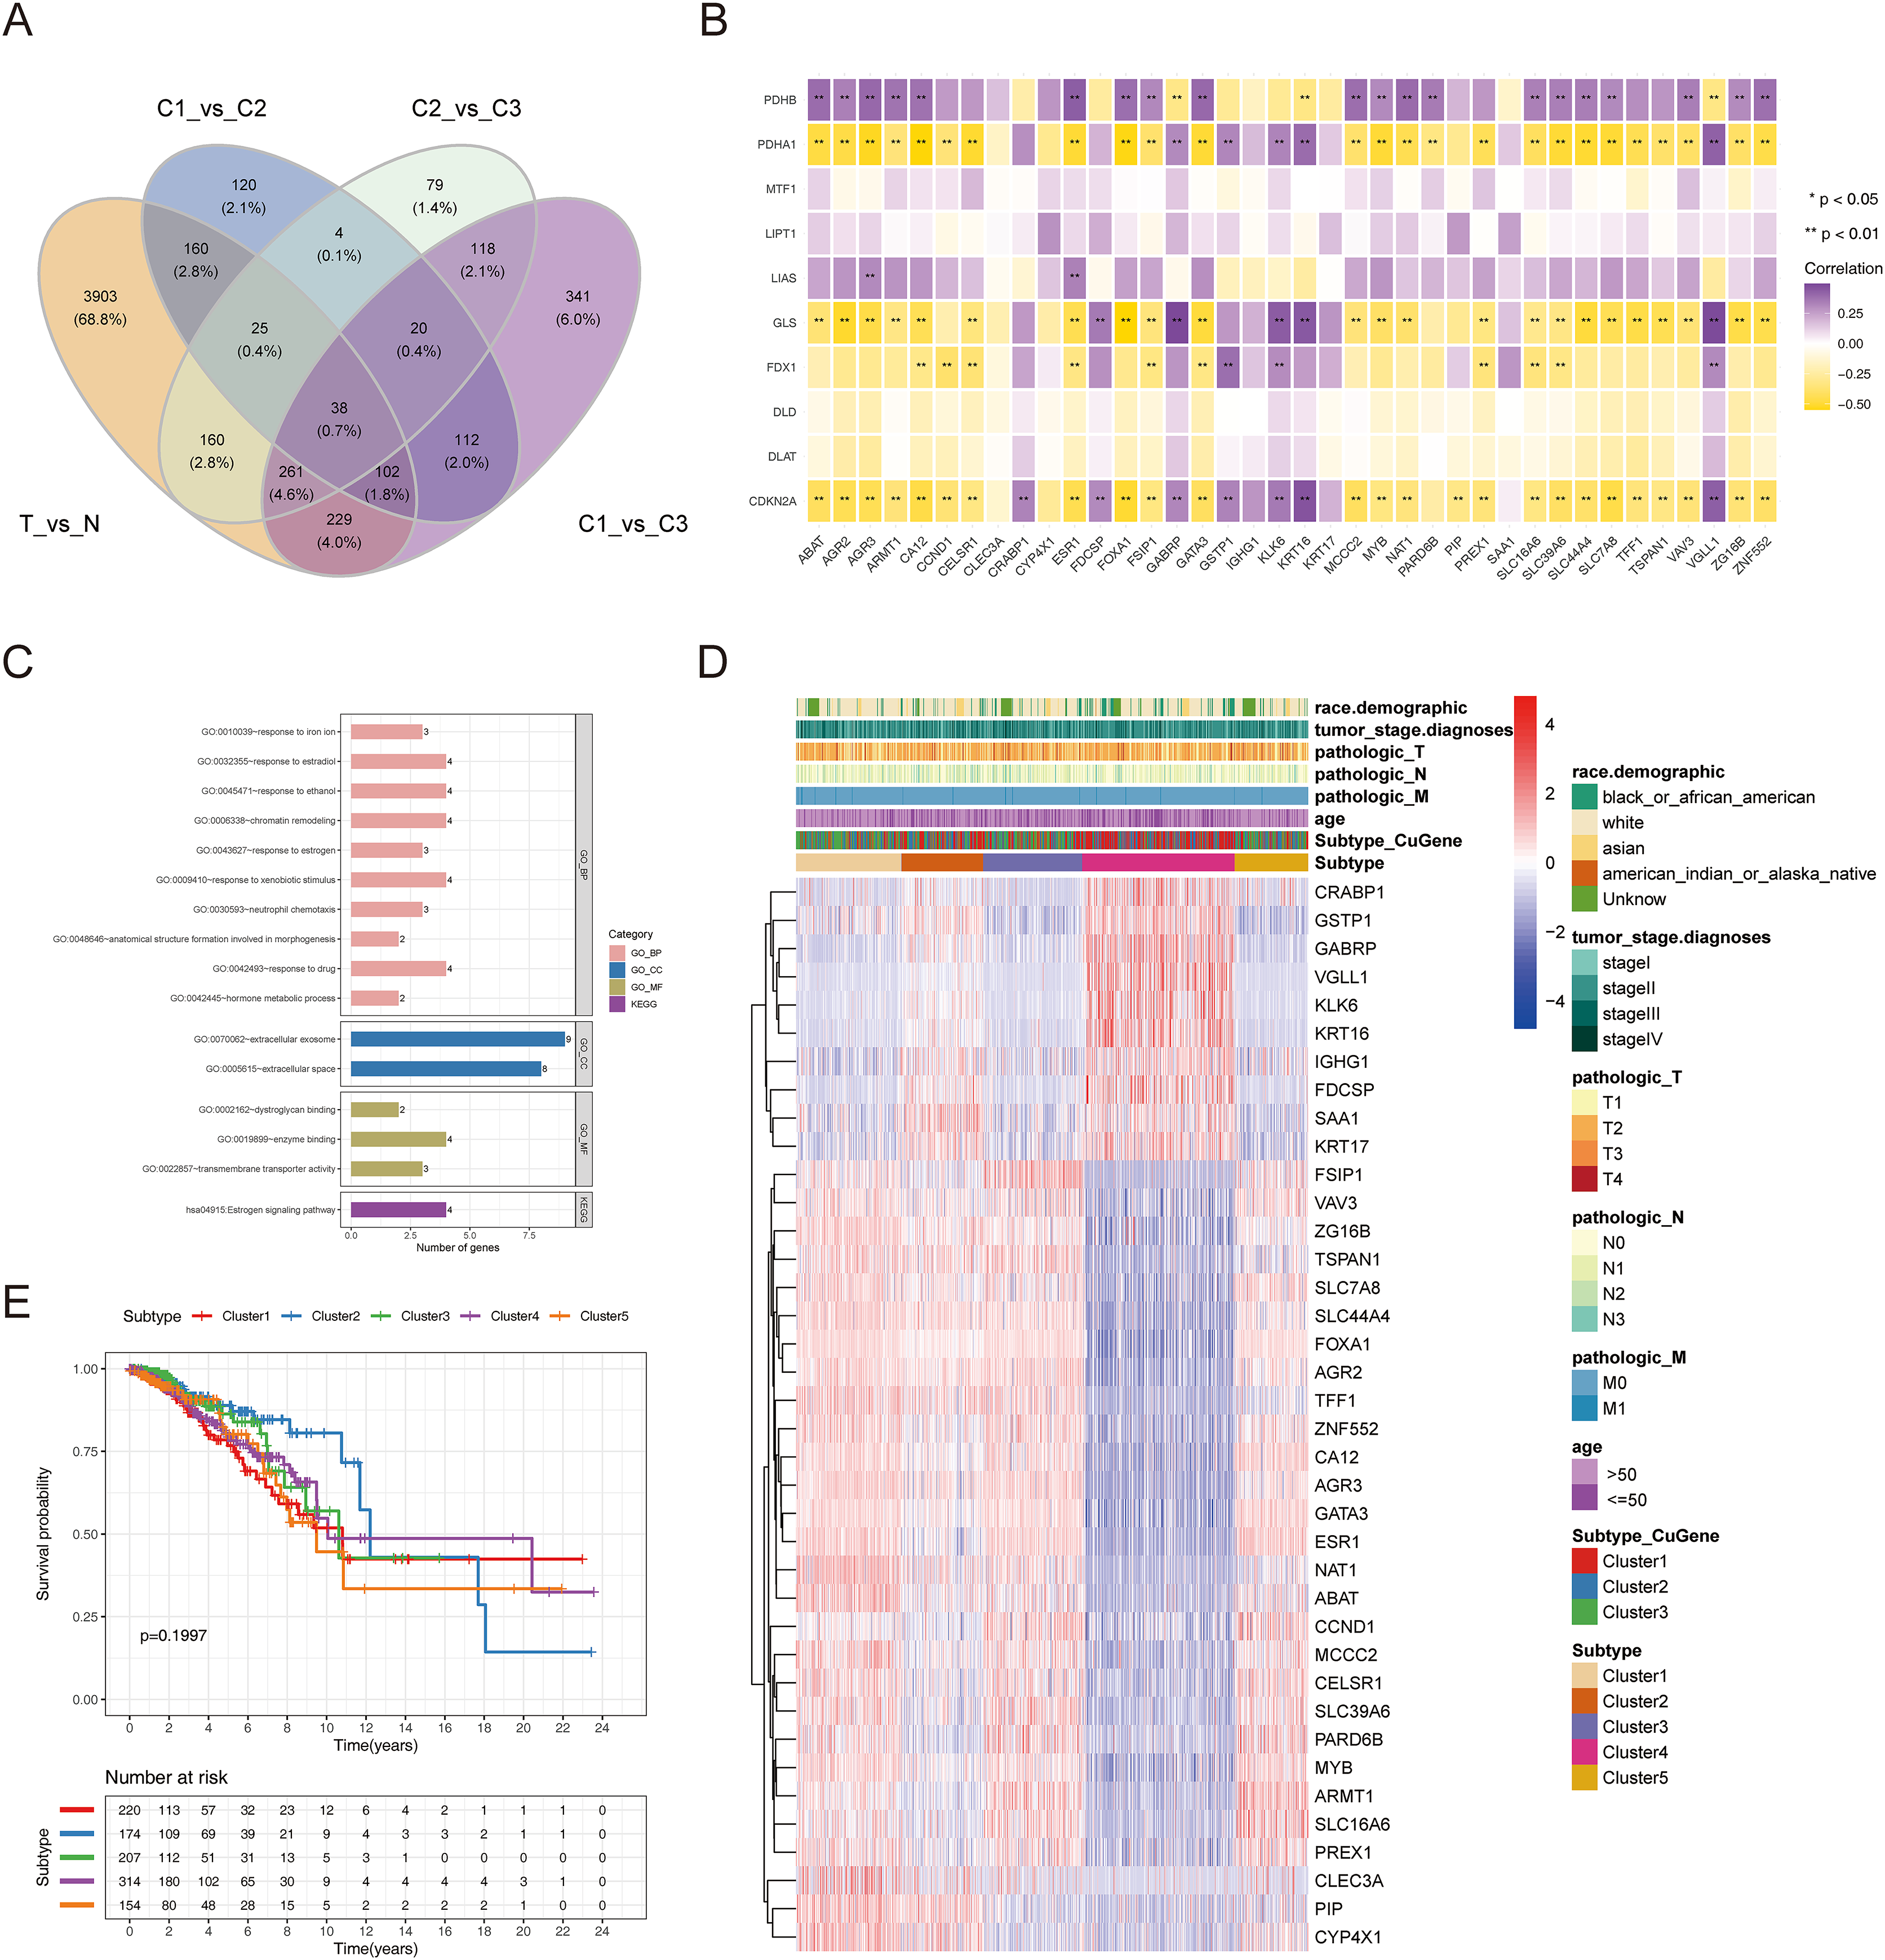
Cuproptosis-relevant prognostic signature for BRCA
To establish a cuproptosis-relevant prognostic signature, we first identified six genes significantly associated with OS in BRCA patients among the 38 cuproptosis-associated DEGs in BRCA using univariate Cox analysis, namely SAA1, KRT17, VAV3, IGHG1, TFF1, and CLEC3A (Fig. 5A). Next, we performed a principal component analysis for the above six genes and calculated the PC1 and PC2 values for each BRCA sample (Table S3). The coefficients of PC1 and PC2 values were obtained by multivariate Cox regression analysis. According to the formula, Cusig score = 0.087984 * PC1 value + 0.226539 * PC2 value, we calculated the Cusig score for each BRCA sample and subsequently categorized the BRCA patients into the high-Cusig score group (552 cases) and low-CuSig score group (517 cases) according to the optimal cut-off value (0.9889137). The KM curve suggested that the survival of the patients in the high-Cusig score group was significantly worse than that of the low-Cusig score group (Fig. 5B). The Sankey diagram exhibited the correlation between the different subtypes and high- and low-Cusig scores (Fig. 5C). The Cusig scores were also significantly different between the five BRCA subtypes based on 38 cuproptosis-associated DEGs in BRCA (Fig. 5D). Cluster 2, which had a better prognosis, had a lower Cusig score, compared to the other clusters (Figs. 4E, 5D). We further validated the Cusig score model in external datasets, GSE42568 and GSE20711, and similarly, the high-Cusig score group showed a significantly worse prognosis than the low-Cusig score group, consistent with the results of TCGA-BRCA cohort (Figs. 5E, 5F).
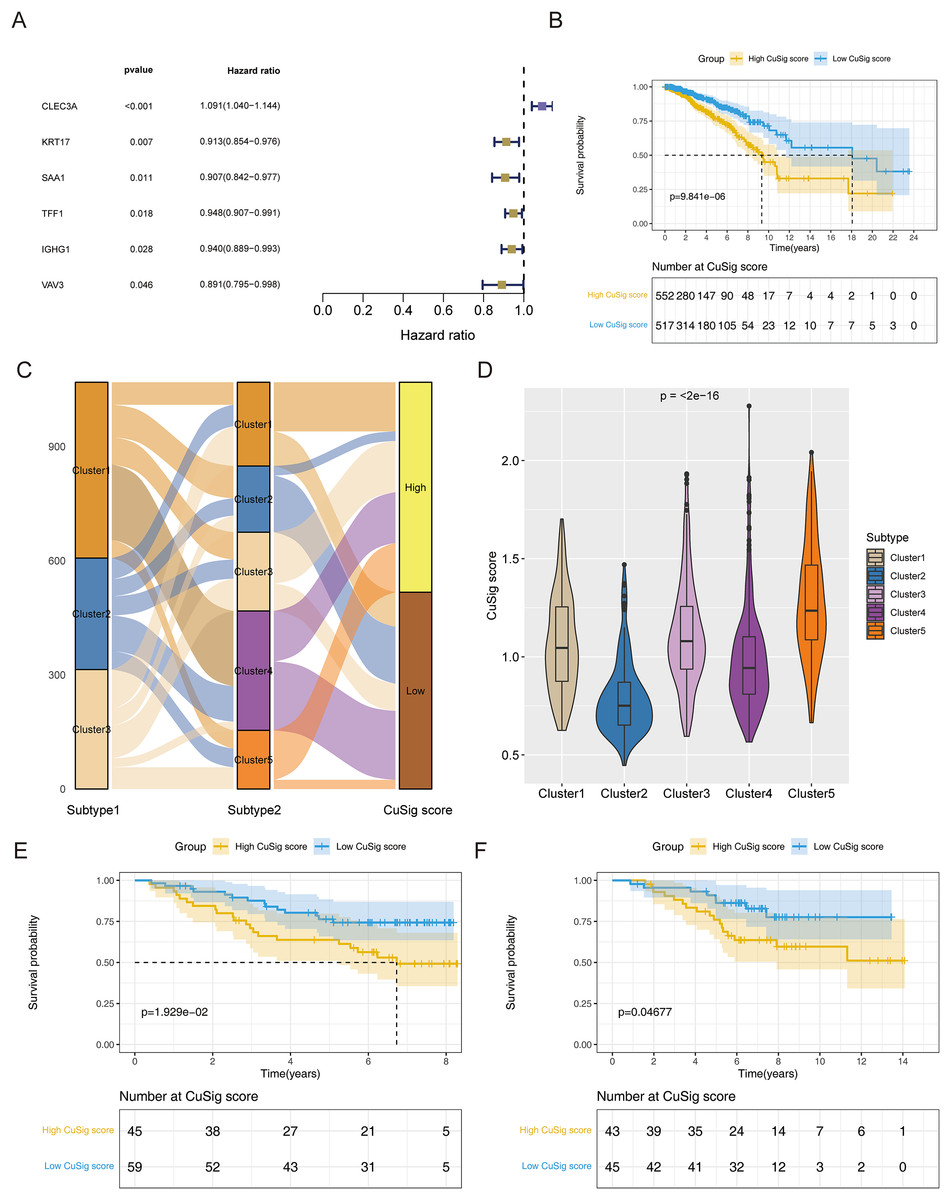
Figure 5: The cuproptosis-relevant prognostic signature in BRCA.
(A) The forest plot of six cuproptosis-associated genes significantly linked to OS in BRCA. (B) Survival rate comparison between high- and low-Cusig score groups. (C) The correlation between different subtypes and high- and low-Cusig scores. (D) Differences in Cusig scores between the five BRCA subtypes based on 38 cuproptosis-associated DEGs. (E) Prognostic validation of high- and low-Cusig score groups in GSE42568 dataset. (F) Prognostic validation of high- and low-Cusig score groups in GSE20711 dataset.
Uncovering the molecular mechanisms of cuproptosis-relevant prognostic signature underlying BRCA
In order to uncover potential mechanisms underlying the differential prognoses between the two Cusig score subgroups, GSVA was conducted to analyze the enrichment differences in the terms of KEGG and hallmark pathways between different Cusig score groups. As shown in Table S4 and Figs. 6A, 6B, 22 hallmark pathways and 73 KEGG pathways were enriched. ‘E2F targets’, ‘G2M checkpoint’, ‘protein secretion’, ‘unfolded protein response’, ‘MTORC1 signaling’, ‘MYC targets V1’, and ‘DNA repair’ were enriched in the high-Cusig score group (Fig. 6A). ‘Citrate cycle’, ‘TCA cycle’, ‘RNA degradation’, ‘cell cycle’ and ‘DNA replication’ were also enriched in the high-Cusig score group (Fig. 6B). Immune-related hallmark pathways, like ‘IL2-STAT5 signaling’, ‘inflammatory response’, ‘IL6-JAK-STAT3 signaling’, ‘TNFA signaling via NFKB’, and KEGG pathways, including ‘chemokine signaling pathway’, ‘NOD-like receptor signaling pathway’, ‘TGF-β signaling pathway’, ‘complement and coagulation cascades’, ‘natural killer cell-mediated cytotoxicity’, ‘cytokine-cytokine receptor interaction’, and ‘B cell receptor signaling pathway’ were enriched in low-Cusig score group (Figs. 6A, 6B). Next, we screened DEGs of the Cusig score subgroups and conducted GO functional enrichment analysis. As shown in Table S5, 1,289 GO entries (1,152 BP, 67 CC, and 70 MF) were derived based on 590 DEGs between the high- and low-Cusig score groups. The top 10 GO-BP terms are shown in Fig. 6C. Immune-related and cell adhesion-related BPs were associated with these DEGs. The results of GSEA indicated that 484 and 1,686 GO entries (NES > 0 and NES < 0, respectively) were enriched in the high-Cusig and low-Cusig score groups, respectively (Table S6). The top five enriched entries of the two Cusig score subgroups are shown in Fig. 6D. Notably, mitosis-related and DNA replication-related BPs were closely associated with the high-Cusig score group, and multiple immune-related BPs were closely associated with the low-Cusig score group.
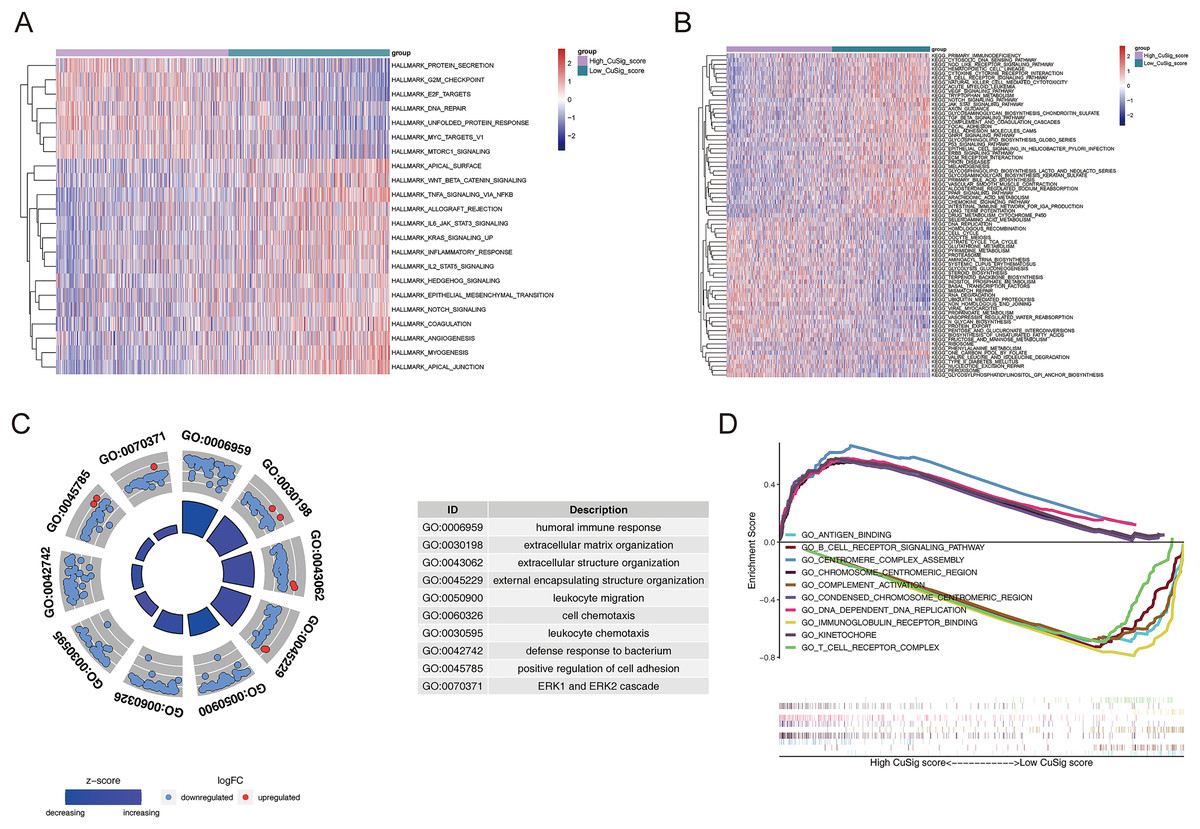
Figure 6: The functional enrichment analysis between high- and low-Cusig score samples.
(A and B) The GSVA analysis of high- and low-Cusig score groups based on Hallmark and KEGG gene sets. (C) The top 10 GO-BP entries enriched by DEGs between high- and low-Cusig score groups. (D) The top five enriched entries in the high- and low-Cusig score group.
Association of cuproptosis-relevant prognostic signature with TME
Since immune-related pathways and BPs were found to be associated with the low-Cusig score group, we next analyzed the relationship between the Cusig score and TME and immune cell infiltration. The ESTIMATE algorithm demonstrated that patients with low Cusig scores had higher immune scores, stromal scores, estimate scores, and lower tumor purity (Figs. 7A–7D). The results of the CIBERSORT algorithm showed that the fractions of naïve B cells, plasma cells, CD8 T cells, monocytes, resting dendritic cells, eosinophils, and neutrophils were elevated in the patients with lower Cusig scores, while the fractions of macrophages M0 and macrophages M2 were high in the patients with high Cusig scores (Fig. 7E). Moreover, PD-L1 expression and immunophenoscore (IPS) of the low-Cusig score group were higher than those of the high-Cusig score group (Figs. 7F, 7G). However, the results of the TIDE analysis showed that the high-Cusig score group had a lower TIDE score than the low-Cusig score group and these patients may be more sensitive to ICB therapy (Fig. 7H).
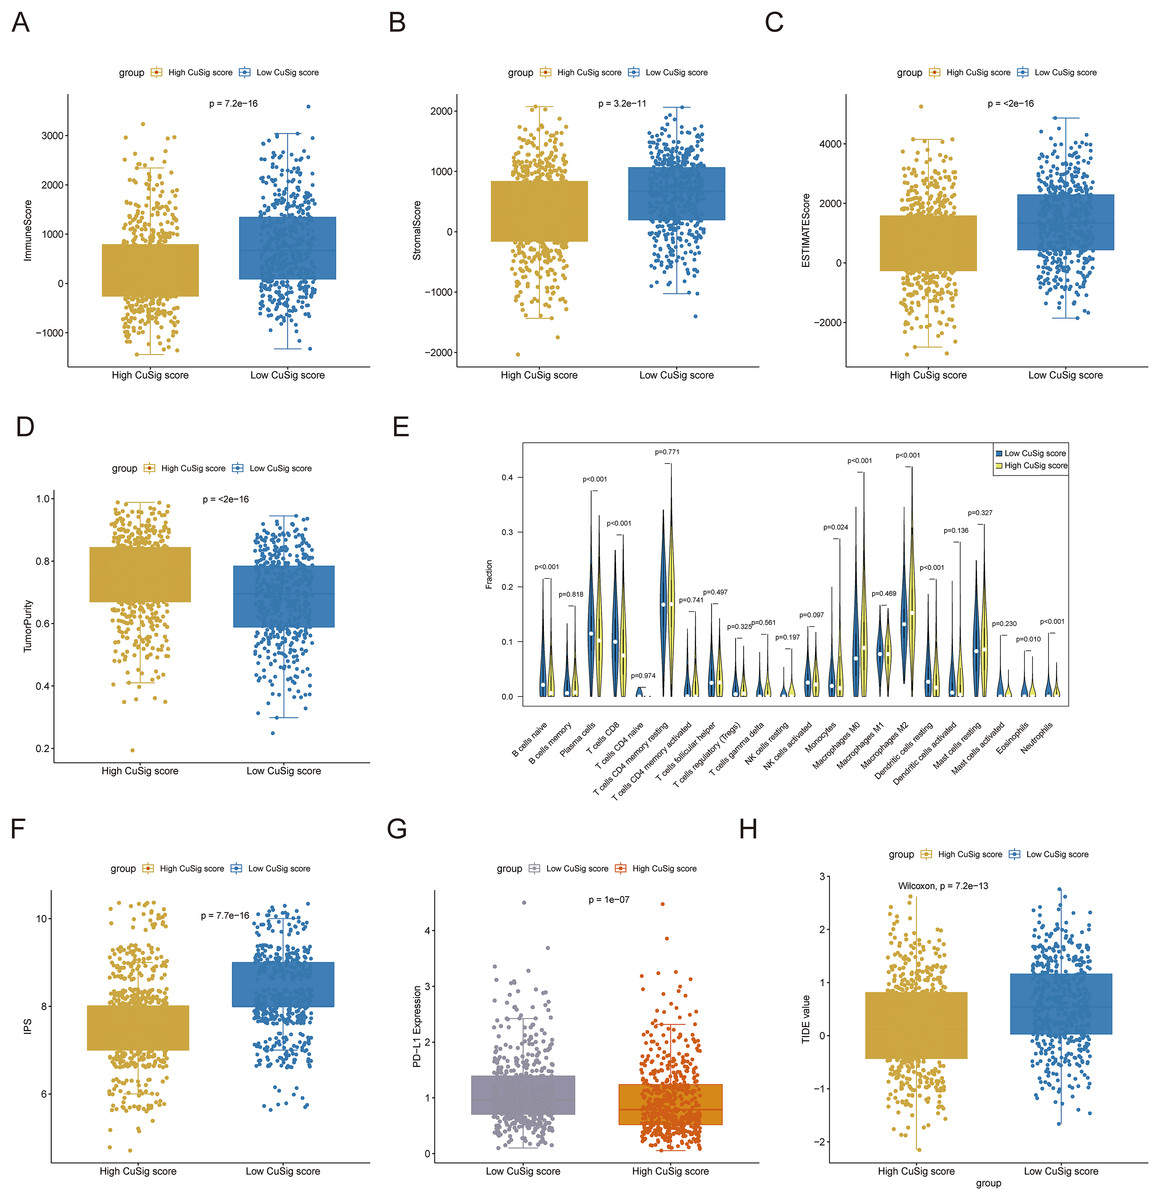
Figure 7: Association of cuproptosis-relevant prognostic signature with TME.
(A–D) Trends in immune score, stromal score, estimated score and tumour purity for high- and low-Cusig score groups. (E) The fraction of different immune cell infiltrations in high- and low-Cusig score groups. (F and G) The comparison of PD-L1 and immunophenotype scores in high- and low-Cusig score groups. (H) The TIDE value of high and low Cusig score groups.
The mutational landscape of high- and low-Cusig score samples
To further assess the mutation frequency of genes in high- and low-Cusig score samples, we performed somatic mutation analysis. The most frequently mutated genes in the high-Cusig score and low-Cusig score samples were TP53 and PIK3CA, respectively (Figs. 8A, 8B). The top 20 mutated genes were not identical between the two Cusig score subgroups, indicating different somatic mutation patterns (Figs. 8A, 8B). We then analyzed the copy number variation (CNV) in genes of the two Cusig score subgroups and found that the CNV of genes in the low-Cusig score samples were significantly higher than that in the high-Cusig score samples (Fig. 8C).
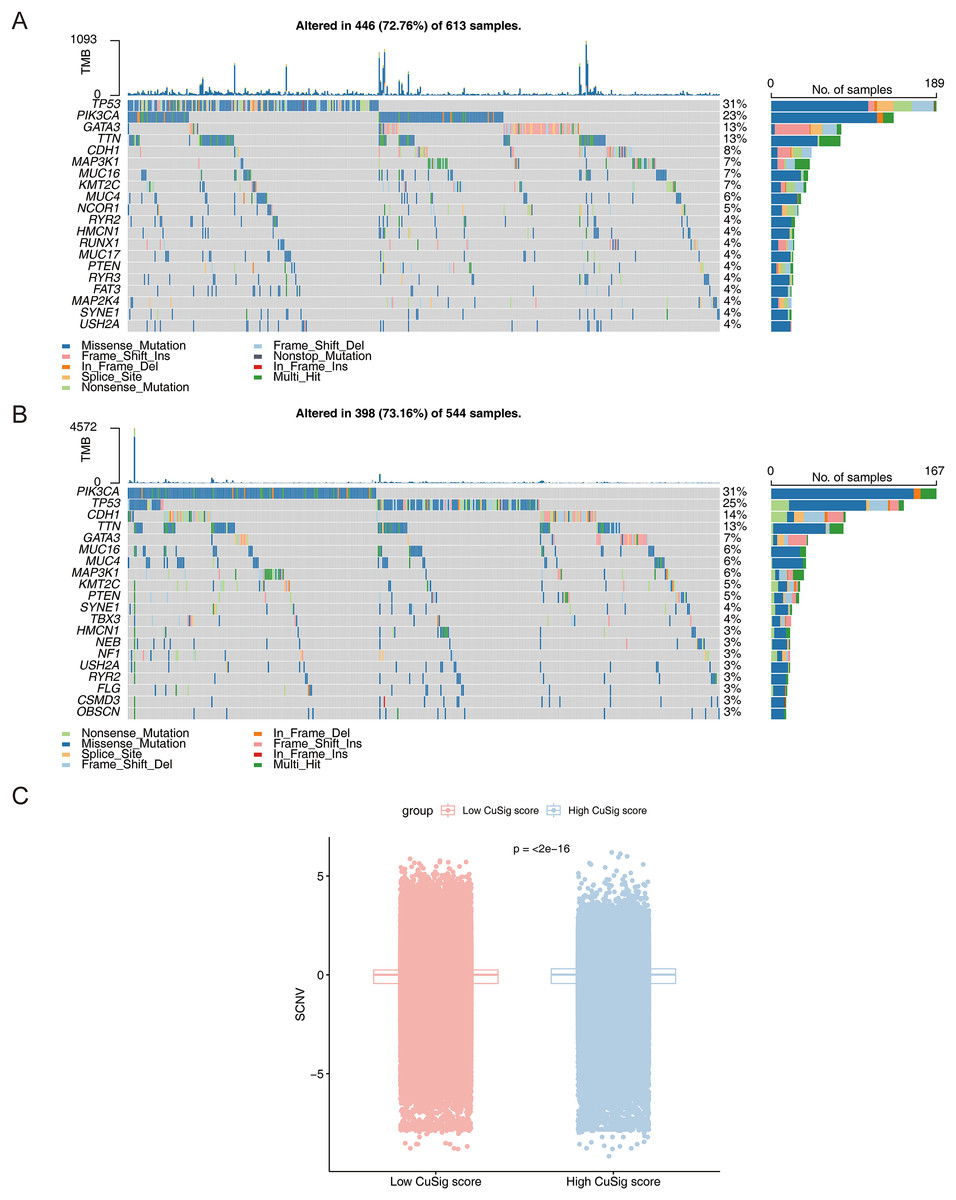
Figure 8: The mutation landscape analysis.
(A) The somatic mutations in high-Cusig score samples. (B) The somatic mutations in low-Cusig score samples. (C) The analysis of copy number variation in groups with high- and low-Cusig scores.
Expression of cuproptosis-relevant prognostic genes in BRCA
As shown in Fig. S4, CLEC3A, IGHG1, TFF1, and VAV3 were up-regulated, while KRT17 and SAA1 were down-regulated in BRCA tissues compared to normal tissues in TCGA-BRCA cohort. We then checked the expression of prognostic genes at the mRNA level in the human epithelial cell line from the mammary gland, MCF-10A, and three breast cancer cell lines HCC1937, MCF7, and MDA-MB-231. Consistent with the trend of results from public databases, levels of CLEC3A and IGHG1 were up-regulated, while those of KRT17 and SAA1 were down-regulated in breast cancer cell lines (Fig. 9). The amplification and dissolution curves of prognostic genes were displayed in Table S7. However, inconsistent with the results from the tissue samples, TFF1 and VAV3 were down-regulated in breast cancer cell lines (Fig. 9, Table S7). The amplification and dissolution curves of prognostic genes were displayed in Table S8. However, inconsistent with the results from the tissue samples, TFF1 and VAV3 were down-regulated in breast cancer cell lines (Fig. 9), probably due to the complexity of the tumor tissue.
Figure 9: The expression of prognostic genes in cell lines detected by RT-qPCR.
(A) CLEC3A (B) KRT17 (C) SAA1 (D) TFF1 (E) IGHG1 (F) VAV3 *p < 0.05, **p < 0.01, ***p < 0.001, ****p < 0.0001.
Discussion
Much progress has been made in research on BRCA but it remains one of the most common cancers seriously affecting women’s health. The incidence and mortality of BRCA will continue to increase in the coming years (Greaney et al., 2015). Cuproptosis gained traction as a novel form of cell death, and the dysregulation of copper, an indispensable trace element in human homeostasis, may trigger cytotoxicity (Babak & Ahn, 2021). Copper levels are significantly elevated in cancer patients compared to normal controls, and altered copper levels in cells can influence the development of cancer (Blockhuys, 2017; Ishida et al., 2013). In this context, we investigated the prognostic value of cuproptosis-related genes in BRCA as this is expected to facilitate the improvement of BRCA diagnosis and treatment.
In this study, we first performed a functional enrichment analysis of 10 cuproptosis genes in BRCA. We found that most of these genes were involved in BPs ‘acetyl-CoA biosynthetic process from pyruvate’, ‘mitochondrial acetyl-CoA biosynthetic process from pyruvate’, and ‘tricarboxylic acid cycle’, which are all closely linked to the development of BRCA (Sha et al., 2022). Among the 10 cuproptosis genes, the expressions of CDKN2A and PDHB were dramatically increased in BRCA samples compared to normal samples but those of the other genes decreased significantly. In BRCA, CDKN2A is defined as a tumor suppressor gene, and our review of the literature suggests that this gene has a low mutation rate in BRCA but a single mutation may significantly impact protein function (Aftab et al., 2019). A recent study showed similar results; interestingly, CDKN2A was overexpressed in BRCA (Cheng et al., 2022), however, its exact mechanism of action remains unknown. The trend of expression of this gene in BRCA is consistent with our findings. LIAS is primarily involved in the production of enzymes for mitochondria-related metabolism, and high expression of LIAS promotes immune cell infiltration and is linked to improved survival in BRCA (Yi et al., 2009; Cai et al., 2022). Although LIPT1 has a major role in TCA-related metabolism (Solmonson et al., 2022), its exact mode of action in BRCA is unknown. According to recent research, LIPT1 prevents cell migration in bladder cancer (Chen et al., 2021). In melanoma, it may prevent tumor growth by interfering with the mitochondrial TCA and causing copper dystrophy (Lv et al., 2022). Combined with our findings, this supports the possibility that LIPT1 may operate as a protective factor in breast cancer. MTF1 is a metal-regulated transcription factor that normally binds to zinc to activate its DNA-binding region to bind designated target genes (Heuchel et al., 1994). Down-regulation of the upstream gene, MTF1 in BRCA may reduce the activity of downstream genes, resulting in decreased cellular activity (Peng et al., 2019). PDHA1 is involved in the regulation of glucose metabolic reprogramming in BRCA cells and low expression of PDHA1 is detrimental to the prognosis of these patients (Liu et al., 2015; Vousden & Ryan, 2009).
Next, we divided the patients into three subgroups based on the expression of the 10 cuproptosis genes in BRCA. These three subgroups showed significant differences in their TMEs, with cluster 1 showing the highest levels of immune cell infiltration and cluster 3 showing the opposite pattern. The role of TME and immune cell infiltration in the development of cancer is well established (Kato et al., 2018). Significant immune cell infiltration occurs early in the development of the tumor or before invasion occurs (Clark et al., 2007; Choi et al., 2017). In the late stage, low levels of immune cell infiltration in TME often lead to a poorer prognosis (Tawfik et al., 2018), and this holds true in BRCA (Wang et al., 2020). In our study, OS was significantly higher in cluster 1 than in cluster 3, suggesting a possible correlation between immune cell infiltration and tumor stage in BRCA. Furthermore, the analysis of the level of immune cell infiltration in the three subtypes showed that cluster 1 had significant infiltration of memory B cells, CD8 T cells, follicular helper T cells, and activated NK cells. Cluster 3 showed significant infiltration of immune cells such as resting mast cells, plasma cells, and macrophages M2. Previous studies supported our finding that immune infiltrating cells in cluster 1 were associated with a better survival prognosis in breast cancer, while the latter occurred more often in advanced BRCA cases (Zahran et al., 2020; Bar et al., 2020; Weng et al., 2019). Through the functional enrichment analysis of cuproptosis-associated DEGs in BRCA, 38 cuproptosis-associated DEGs were found to be mainly associated with ‘response to iron ion’, ‘response to estradiol’, ‘response to estrogen’, ‘response to xenobiotic stimulus’, ‘neutrophil chemotaxis’, ‘response to drug’, ‘hormone metabolic process’, ‘mammary gland alveolus development’, and ‘estrogen signaling pathway’. A few studies have shown that these BPs are involved in the development of BRCA (Jerry et al., 2018; Parida & Sharma, 2019; Lee et al., 2015; Zhang et al., 2020; Printz, 2017; Kulkoyluoglu-Cotul, Arca & Madak-Erdogan, 2019; Kim & Moon, 2021).
Subsequently, we established a cuproptosis-associated prognostic signature based on cuproptosis-associated DEGs linked to the prognosis of BRCA (SAA1, KRT17, VAV3, IGHG1, TFF1, and CLEC3A). In BRCA, SAA1 knockdown induces cellular stress and fails to activate the relevant molecular mechanisms involved in DNA as well as underlying BPs, which may be more favorable for cancer cell survival (Olivier, Pretorius & Engelbrecht, 2021). SAA1 overexpression in BRCA may be associated with longer disease-free survival (Cao et al., 2021). KRT17 can promote carcinogenesis in several cancers (Wang et al., 2019; Sarlos et al., 2019; Chivu-Economescu et al., 2017). The expression of KRT17 affects the phenotype of TNBC and can regulate tumor differentiation through specific regulatory axes (Jinesh, Flores & Brohl, 2018). In addition, KRT17 is a member of the skeleton protein family, and when it is highly expressed, it can increase cell adhesion, thus making the cell structure more stable and less prone to migration (Wu et al., 2021). The expression of KRT17 is higher in primary melanoma than in metastatic melanoma (Han et al., 2021). Therefore, patients with high KRT17 expression may have a better prognosis. VAV3 is an oncogenic gene that is overexpressed in human BRCA and can promote its development by activating specific signaling pathways and related genes. Silencing VAV3 impairs the growth of estrogen-stimulated and non-dependent BRCA cells (Jiang et al., 2017; Lee et al., 2008). Although BRCA samples have a high level of IGHG1 expression (Yang et al., 2013), its precise mode of action is unknown. In other cancers, IGHG1 is linked to immunoglobulins made by the cancer cells and plays a key role in helping cancer cells grow and divide (Syed et al., 2015; Chu et al., 2019). TFF1 is an estrogen-regulatory gene because of the typical estrogen response element in its promoter (Ribieras, Tomasetto & Rio, 1998). However, there is controversy regarding its mechanism of action in BRCA. TFF1 is an informative marker of metastatic BRCA and its overexpression is associated with poor prognosis (Perry et al., 2008). However, another study showed that high TFF1 levels were associated with better clinical outcomes, especially in early BRCA (Corte et al., 2006). Similarly, TFF1 not only has pro-tumor properties but also exerts anti-tumor effects (Buache et al., 2011). Further studies are needed to assess its role in tumor biology. CLEC3A is a risk gene among the cuproptosis-related prognostic genes screened. Previous studies support our finding that CLEC3A is mainly involved in cellular invasion and metastatic spread of BRCA. Silencing CLEC3A downregulates the activity of cell survival factors and P13K/AKT, which reduces the proliferation, migration, and invasion of BRCA cells (Ni et al., 2018; Bakaeean et al., 2020). In conclusion, the genes screened herein may become new potential therapeutic targets for BRCA.
Next, we created a Cusig score model by Cox regression analysis based on six cuproptosis-associated prognostic genes, and as expected, the low Cusig score group was always associated with a better prognosis as well as a higher survival rate, while the high Cusig score group showed the opposite trend. To assess the causes more precisely, we performed GSVA and GSEA to determine the potential underlying molecular mechanisms. Several immune-related BPs were enriched in the low Cusig score group, while the high Cusig score group was significantly enriched in pathways unrelated to the immune pathway. Angiogenesis is involved in the proliferation and metastasis of breast cancer and has even been defined as a promising therapeutic target (Ribatti, Annese & Tamma, 2021; Chong, Yeap & Ho, 2021). In our study, angiogenesis was significantly upregulated in the low Cusig score group, which seems contrary intuitively. We propose the following hypothesis: most of the blood vessels on which more advanced BRCA cells depend for growth are actually formed at an early stage and advanced BRCA cells do not require the excessive formation of neovascularization for oxygen supply because the tumor cells themselves have a low rate of oxygen consumption (Steinberg et al., 1997). This hypothesis has been reflected in previous studies showing that tumors in advanced stages show less angiogenesis compared to early-stage BRCA and that the dependence of tumor growth on neovascularization may be limited to early stages (Boneberg et al., 2009). Epithelial-to-mesenchymal transition (EMT) showed a trend toward upregulation in the low Cusig score group. EMT has been widely recognized as a critical driver of BRCA (Lu et al., 2021; Vardas et al., 2022). Notably, this pathway is localized at the level of primary tumor invasion, and as it establishes secondary tumors at a distant site, it rapidly performs the reverse mesenchymal-epithelial transition (MET) to rid itself of its mesenchymal attributes (Kar et al., 2019). This may explain our results. A review of previous studies revealed that in breast cancer, the G2M checkpoint pathway is significantly associated with tumor cell proliferation, similar to MYC targets v1 and E2F targets and that tumors with high enrichment of the G2M checkpoint are more aggressive (Oshi et al., 2020); other studies have shown that the G2M checkpoint may be a promising therapeutic target for improving the prognosis of BRCA patients (Huang et al., 2018). In conclusion, the above results are consistent with our findings.
Finally, we analyzed the association between TME and the high and low Cusig score groups in BRCA. B-cell subpopulations (including naïve B cells) were significantly increased in non-metastatic BRCA and tumor metastasis may alter the function and phenotype of some of the B-cell subpopulations, leading to their reduced proportions in advanced BRCA (Mehdipour et al., 2016). Furthermore, the role of eosinophils in tumors has been demonstrated, and there is an association between higher eosinophil counts and a better prognosis (Poncin et al., 2021). Indeed, the mechanism underlying its role in BRCA remains unclear but in terms of expressional trends, this is consistent with our study. Similarly, macrophages M0 and macrophages M2 are strongly associated with poor prognosis in BRCA and may functionally mediate chemoresistance in BRCA (Ali et al., 2016). Immune checkpoint inhibitors are a research hotspot. In BRCA, PD-L1 overexpression can inhibit the tumor-killing effect of the autoimmune system. Clinically, drugs targeting the PD-1/PD-L1 axis have also been used initially (Lotfinejad et al., 2021; Schütz et al., 2017). In our study, PD-L1 expression was higher in the low Cusig score group, which may be because the low Cusig score group possesses more immune-related mechanisms.
Previous studies have also created models that show good predictions (Sha et al., 2022) but we have further validated our results using qPCR experiments, which demonstrates the reliability of our findings. Additionally, as our analysis in this study was mostly bioinformatics-based, care should be taken when interpreting the findings. We could only provide relationships in which functional pathways play a role in TME processes and influence the prognosis of BRCA patients but we have very limited evidence for a specific potential causal relationship, and this is the focus of our future work.
Conclusion
In summary, herein, we constructed a signature for projecting the overall survival of BRCA patients and our findings authenticated the cuproptosis-relevant prognostic genes, which are expected to provide a basis for developing prognostic molecular biomarkers and an in-depth understanding of the relationship between cuproptosis and BRCA.
Supplemental Information
The functional enrichment result of cuproptosis-associated DEGs in BRCA.
The GSVA result between high- and low-Cusig score groups based on KEGG and hallmark gene set.
The GO functional enrichment result of DEGs between high- and low-Cusig score groups.
The GSEA functional enrichment result of DEGs between high- and low-Cusig score groups.
The amplification and dissolution curves of prognostic genes.
Consensus clustering analysis of BRCA patients.
(A) Consensus clustering cumulative distribution function (CDF) for k = 2 to k = 8. (B) Relative change in area under CDF curve according to various k values. (C) Consensus clustering matrix of 1091 samples from TCGA dataset for k = 3.
Consistent clustering analysis of BRCA patients based on 38 cuproptosis-associated DEGs.
(A) Consensus clustering cumulative distribution function (CDF) for k = 2 to k = 8. (B) Relative change in area under CDF curve according to various k values. (C) Consensus clustering matrix of 1091 samples from TCGA dataset for k = 5.