

Regional trends in the moderate-to-vigorous intensity physical activity and screen time of Canadians before and during the COVID-19 pandemic
- Published
- Accepted
- Received
- Academic Editor
- Arindam Basu
- Subject Areas
- Epidemiology, Kinesiology, Public Health, COVID-19
- Keywords
- Physical activity, Sedentary Behaviour, Population Surveillance, COVID-19, Canada, Screen time
- Copyright
- © 2024 Saunders and Colley
- Licence
- This is an open access article distributed under the terms of the Creative Commons Attribution License, which permits unrestricted use, distribution, reproduction and adaptation in any medium and for any purpose provided that it is properly attributed. For attribution, the original author(s), title, publication source (PeerJ) and either DOI or URL of the article must be cited.
- Cite this article
- 2024. Regional trends in the moderate-to-vigorous intensity physical activity and screen time of Canadians before and during the COVID-19 pandemic. PeerJ 12:e16913 https://doi.org/10.7717/peerj.16913
Abstract
Background
During the COVID-19 pandemic, public health approaches and disease-transmission varied widely across Canadian regions. This may have led to different trajectories for moderate-to-vigorous intensity physical activity (MVPA) and screen time during this period. The purpose of this investigation was to describe age- and gender-specific regional trends in MVPA and screen time for Canadian youth (ages 12–17 years) and adults (ages 18+) from 2018 to 2021.
Methods
Data was collected using the Canadian Community Health Survey, which includes representative data for 5 distinct regions: Atlantic Canada, Québec, Ontario, the Prairie Provinces, and British Columbia (BC). Participants aged 12+ in each region self-reported their total daily screen time, as well as MVPA in 5 domains: overall, recreational, school, occupational/household and active transportation. Results were compared for 2018 (pre-pandemic), January–March of 2020, September–December of 2020, and 2021 using repeated measures t-tests.
Results
Among youth, all regions except for Atlantic Canada and BC experienced significant reductions in the proportion of youth meeting MVPA recommendations in the fall of 2020 (all p < 0.001), although these had returned to baseline for all regions except Ontario by 2021. Trends varied across regions among adults aged 18–64 years. In Québec, there was 7-percentage point reduction in the proportion of males meeting the MVPA recommendations in the fall of 2020 compared to 2018, while there was a 4-percentage point increase among females in 2021 (all p < 0.05). In Ontario and the Prairie provinces, males saw a 4-percentage point decrease in activity recommendation adherence in 2021, when compared to 2018 (p < 005). There were no other significant differences for any region when comparing the fall of 2020 or 2021 with 2018 (all p > 0.05). Among adults aged 65+ years, significant increases in MVPA were observed in Atlantic Canada and the Prairies in the fall of 2020, and in Atlantic Canada, Québec and the Prairies in 2021 (all p < 0.05). With limited exceptions, self-reported screen time increased significantly across regions and age groups for both males and females (all p < 0.05).
Conclusions
MVPA levels of Canadians during the COVID-19 pandemic varied both by region and age group. Self-reported MVPA of Canadian youth dropped in most regions in the fall of 2020, before returning to pre-pandemic levels in 2021. Activity levels of Canadians aged 18–64 years were relatively stable during the pandemic and increased for Canadians aged 65+ in most regions. Differences in trajectories across genders observed at the national level were often less apparent in individual regions. Recreational screen use increased across all regions, ages and genders with very few exceptions. These results highlight the differences and similarities in activity and screen time trajectories across the Canadian population and suggest the need for additional research to identify best practices for promoting healthy movement behaviours during future pandemics.
Introduction
Low levels of moderate-to-vigorous intensity physical activity (MVPA) and high levels of recreational screen time are associated with increased risk of chronic disease morbidity and mortality (Warburton, Nicol & Bredin, 2006; Carson et al., 2016; Ekelund et al., 2016; Saunders et al., 2020). To maximize health, the Canadian 24-Hour Movement Guidelines recommend that youth aged 12–17 years accumulate at least 60 min per day of MVPA, and no more than 2 h of recreational screen time (Tremblay et al., 2016). Adults aged 18+ should accumulate at least 150 min of moderate-to-vigorous activity per week, along with no more than 3 h per day of recreational screen time (Ross et al., 2020). Data collected early in the COVID-19 pandemic suggested rapid and significant reductions in the proportion of Canadians meeting recommendations for MVPA and screen time among Canadians of all ages (Rhodes et al., 2020; Moore et al., 2020; Moore et al., 2021; Caldwell et al., 2022; Colley & Saunders, 2023a; Colley & Saunders, 2023b; Liu et al., 2023). Recent investigations using the Canadian Community Health Survey (CCHS) have suggested that the MVPA levels of Canadian adults and male youth returned to or surpassed pre-pandemic levels by 2021, although the activity levels of female youth remained depressed (Colley & Saunders, 2023a; Colley & Saunders, 2023b). When examined at the national level, recreational screen time remained significantly higher in 2021 than in 2018 for all Canadian age groups (Colley & Saunders, 2023a; Colley & Saunders, 2023b). The above studies have identified nation-wide trends in MVPA and recreational screen time but did not examine regional trends. To our knowledge only one study has examined regional differences in MVPA and screen time among Canadian children and youth during the COVID pandemic (Caldwell et al., 2022), and reported that individuals in the Prairies and Atlantic Canada accumulated more MVPA than those living in Québec. However, to date no study has examined regional differences among adults, nor compared regional trends using data collected in real time for any age group. This is important, as policy approaches, and the spread of virus itself, varied greatly across regions throughout the pandemic (Cameron-Blake et al., 2021; Bignami, 2021).
Canada is a decentralized federation, with the provision of healthcare falling under the responsibility of the provinces and territories, while public health is a shared responsibility between municipal, provincial and federal governments (Canada, 2011). Canadian provinces also differ greatly in terms of demographics and population density, all contributing to different approaches and experiences across regions. In July of 2020 the 4 (largely rural) Atlantic provinces formed the “Atlantic Bubble” and took a “COVID-zero” approach throughout much of 2020 and 2021. This approach dramatically limited travel into the region and saw targeted restrictions and/or closures in response to signs of community transmission. With the exception of the above targeted and time-limited restrictions, schools, child-care and recreation facilities largely remained open in Atlantic Canada from the fall of 2020 onwards (Canadian Institute for Health Information, 2023). The combination of relatively few restrictions within the region, as well as limited community spread compared to other Canadian regions, led to a comparatively higher “normalcy” in Atlantic Canada than other Canadian regions for much of 2020 and 2021 (Cameron-Blake et al., 2021). In contrast, the province of Quebec, which has large population centers in both Montreal and Quebec City, was among the hardest hit regions of North America early in the COVID-19 pandemic, leading to both widespread restrictions and high levels of community spread throughout 2020 and 2021 (Cameron-Blake et al., 2021; Canadian Institute for Health Information, 2023). Ontario, Canada’s largest province, and the three relatively rural Prairie Provinces, also experienced relatively higher community transmission throughout 2020 and 2021, while enacting less stringent restrictions than in Quebec or Atlantic Canada early in the pandemic (Cameron-Blake et al., 2021). In particular, Alberta’s approach focused on supporting businesses and encouraging personal responsibility (Cameron-Blake et al., 2021). Finally, the policy approaches in BC was a roughly similar level of stringency as Ontario and the Prairie provinces, despite experiencing relatively lower community spread throughout 2020 and 2021 (Cameron-Blake et al., 2021). As noted by Cameron-Blake et al. (2021), in addition to differing in terms of policy approaches to COVID-19, provinces also varied in terms of COVID messaging. In particular, they highlight the examples of BC and the Atlantic province of Prince Edward Island, which had relatively low transmission throughout the pandemic, and where messaging was led by public health officials. In contrast, in Quebec, Ontario and Alberta, messaging was often led by the provincial premiers, which may have led to greater confusion (Cameron-Blake et al., 2021).
It is likely that the above regional differences in policy and COVID-19 transmission may have led to different trajectories in the MVPA and screen time of individuals living in each Canadian regions. Therefore, the purpose of this article was to describe age- and gender-specific regional trends in MVPA and screen time for Canadians aged 12+ years from 2018 to 2021.
Materials & Methods
Data source
The CCHS is an annual cross-sectional survey that collects information related to health status, health care utilization, and health determinants for the Canadian population (Statistics Canada, 2019). The CCHS is collected under the Statistics Act, and therefore does not require Research Ethics Board approval. All participants provided written informed consent prior to data collection. The present analysis includes self-reported MVPA and screen time data for Canadians aged 12+ years. The primary comparison of the present analysis is between the full annual dataset collected in 2018 (pre-pandemic, n = 54,045) and 2021 (during pandemic, n = 49,243). Additional comparisons are made to sub-annual datasets collected in 2020: pre-pandemic (January to March 2020, n = 14,844) and during pandemic (September to December 2020, n = 27,234). The response rate was as follows: 58.8% in 2018, 45.6% in January to March 2020, 27.4% in September to December 2020, and 28.4% in January 2021 to February 2022. The COVID-19 pandemic had major impacts on the data collection operations for CCHS 2020. Important analytical and data quality implications related to the 2020 data are described elsewhere (Statistics Canada, 2019; Colley & Watt, 2022). Briefly, CCHS data collection was paused from March to August 2020, and this resulted in a small pre-pandemic dataset spanning January to March 2020. The CCHS data collection re-started in September 2020 and continued until December 2020. Screen time data were not collected in 2020 in a full sample and therefore are not included in the present analysis.
MVPA and screen time questions
CCHS respondents were asked to provide estimates of time (hours and minutes) spent in the past 7 days engaged in transportation, recreational, occupational/household and school-based MVPA (Statistics Canada, 2019). The specific wording of individual questions are provided in Table 1. Values greater than 2 h per day of any domain were flagged as outliers and re-coded to 2 h. This occurred in less than 4% of respondents. Youth were classified as meeting the MVPA recommendation if their average daily quantity of MVPA (including all domains of MVPA) was equal to or greater than 60 min (Tremblay et al., 2016). Adults were classified as meeting the MVPA recommendation if their weekly sum of MVPA (including all domains of MVPA) was equal to or greater than 150 min (Ross et al., 2020).
| Domain of physical activity & sedentary behaviour | Question |
|---|---|
| Youth aged 12–17 years | |
| Pre-Amble | The following questions are about various types of physical activities that you have done each day in the past week. |
| Transportation | In the last 7 days, did you use active ways like walking or cycling to get to places such [school,] the bus stop, the shopping centre, [work] or to visit friends? [If yes] How much time did you spend using active ways to get to places... |
| School-based | In the last 7 days, did you do sports, fitness or recreational physical activities while at [school or day camp], including during physical education classes, during your breaks and any other time you played indoors or outdoors / day camp, including any time you played indoors or outdoors]? [If yes] Did any of these activities make you sweat at least a little and breathe harder? [If yes] How much time did you spend doing these activities at [school / day camp/school or day camp] that made you sweat at least a little and breathe harder... |
| Recreation | In the last 7 days, did you do physical activities in your leisure time including exercising, playing an organized or non-organized sport or playing with your friends? [If yes] Did any of these leisure-time activities make you sweat at least a little and breathe harder? How much time did you spend doing these leisure-time activities that made you sweat at least a little and breathe harder... |
| Household/Occupational | In the last 7 days, did you do any other physical activities [that you have not already reported], for example, while you were [doing paid or unpaid work or] helping your family with chores? [If yes] Did any of these other physical activities make you sweat at least a little and breathe harder? [If yes] How much time did you spend doing these other physical activities that made you sweat at least a little and breathe harder... |
| Sedentary Behaviour | On a [school or work day / day that was not a school or workday], how much of your free time did you spend watching television or a screen on any electronic device while sitting or lying down? |
| Adults aged 18+ years | |
| Pre-Amble | The following questions are about various types of physical activities done in the last 7 days. I want you to only think of activities you did for a minimum of 10 continuous minutes. |
| Transportation | In the last 7 days, that is from last [Day of the week 7 days ago] to yesterday, did you use active ways like walking or cycling to get to places such as work, school, the bus stop, the shopping centre or to visit friends? [If yes] How much time in total, in the last 7 days, did you spend doing these activities? Please only include activities that lasted a minimum of 10 continuous minutes. |
| Recreation | [Not including activities you just reported,] in the last 7 days, did you do sports, fitness or recreational physical activities, organized or non-organized, that lasted a minimum of 10 continuous minutes? Examples are walking, home or gym exercise, swimming, cycling, running, skiing, dancing and all team sports. [If yes] Did any of these recreational physical activities make you sweat at least a little and breathe harder? [If yes] In the last 7 days, how much time in total did you spend doing these activities that made you sweat at least a little and breathe harder? |
| Occupational/Household | In the last 7 days, did you do any other physical activities while at work, in or around your home or while volunteering? Examples are carrying heavy loads, shoveling, and household chores such as vacuuming or washing windows. Please remember to only include activities that lasted a minimum of 10 continuous minutes. [If yes] Did any of these other physical activities make you sweat at least a little and breathe harder? [If yes] In the last 7 days, how much time in total did you spend doing these activities that made you sweat at least a little and breathe harder? |
| Sedentary Behaviour | On a [school or work day / day that was not a school or workday], how much of your free time did you spend watching television or a screen on any electronic device while sitting or lying down? |
Youth aged 12–17 years were asked to estimate their average daily recreational screen time for days they went to school and days they did not go to school (≤2 h per day, 2 to ≤4, 4 to ≤6, 6 to ≤8 and 8+ hours per day). Adults aged 18+ were asked to estimate their average daily recreational screen time for days that they went to work and days they did not go to work using the same categories. Screen time categories were re-coded to: ≤2 h per day, 2 to ≤4, 4+ hours per day for all respondents. Youth averaging ≤2 h per day were classified as meeting screen time recommendations for their age group (Tremblay et al., 2016). None of the screen time categories used by the CCHS align with the screen time recommendation for adults within the Canadian 24-Hour Movement Guidelines (≤3 h per day Ross et al., 2020), therefore adherence to this benchmark was not assessed in the present analysis.
Statistical analysis
Descriptive statistics were used to produce weighted means of hours of screen time and weighted percentages of those accumulating ≤2 h per day, 2 to ≤4, 4+ hours per day for all respondents. Results are presented as youth 12–17 years, adults 18–64 years, and adults 65+ years. The CCHS gathers health-related data at sub-provincial levels of geography to provide estimates representative of health regions or combined health regions. The present analysis compares five regions of Canada moving from east to west: Atlantic Canada (Newfoundland & Labrador, Nova Scotia, New Brunswick, and Prince Edward Island), Québec, Ontario, the Prairie Provinces (Saskatchewan, Manitoba and Alberta), and British Columbia (BC). The Canadian Territories of the Yukon, Northwest Territories and Nunavut were excluded from this analysis because two years of data collection are required to produce reliable estimates in the territories. Excluded from the survey’s coverage are: person living on reserves and other Aboriginal settlements in the provinces; full-time members of the Canadian Forces; the institutionalized population, and persons living in the Québec health regions of Région du Nunavik and Région des Terres-Cries-de-la-baie-James. Altogther, these exclusions represent less than 3% of the Canadian population aged 18 and over (Statistics Canada, 2019).
Variance of the estimates was examined using 95% confidence intervals with bootstrap weights applied. Survey weights were applied to the data to address non-response bias and to make the results representative of the Canadian population living in the ten provinces, as described in detail elsewhere (Statistics Canada, 2019). Analyses were conducted using SAS (Version 9.4) and differences between the three time periods were tested using contrast statements within the PROC DESCRIPT procedure in SAS-callable SUDAAN (version 11.0.3).
Results
Participant demographics
The mean age of participants across all time points ranged between 14.4–14.7 years for youth, 41.2–41.5 years for adults 18–64 years, and 73.7–74.2 for adults 65+. Across all ages and time-points, the sample ranged from 48.6–53.6% female, and was 79.0–85.8% urban. The highest level of household education varied by age group: among youth 83.6–86.9% of respondents came from a household with at least some post-secondary education across all time points. Among adults aged 18–64 years, this varied from 67.6–71.2%, and among adults 65+ years it varied from 53.6%–57.5%.
Overall MVPA
National and regional trends in MVPA are presented in Tables 2 and 3 and Fig. 1. At the national level, the proportion of youth meeting Canada’s MVPA recommendation dropped by 14.8 and 9.9 percentage points among boys and girls respectively between 2018 and fall of 2020 at the national level (all p < 0.001), and returned to pre-pandemic levels by the fall of 2021 for boys, but not girls. At the regional level, Ontario and the Prairie Provinces saw significant reductions in the proportion of youth meeting the recommendations in late 2020 in both genders, while a decrease was seen for boys only in Québec (all p < 0.001). By 2021 the number of youth meeting MVPA guidelines had returned to pre-pandemic levels for boys and girls in all provinces outside of Ontario. In BC and Atlantic Canada, there were no significant changes in MVPA levels when comparing either the fall of 2020 or 2021 with the pre-pandemic period (2018) in either gender (all p > 0.05).
| 2018 | Jan–Mar 2020 | Sept–Dec 2020 | 2021 | |||||
|---|---|---|---|---|---|---|---|---|
| n | Estimate | n | Estimate | n | Estimate | n | Estimate | |
| 12–17 years | ||||||||
| Canada-wide | 3,952 | 49.6 (47.3, 51.9) | 911 | 53.7 (49.5, 58.0) | 1,573 | 37.2 (34.2, 40.3)* | 3,501 | 43.8 (41.2, 46.4)* |
| Males | 2,024 | 54.3 (51.2, 57.4) | 465 | 60.0 (53.9, 65.8) | 813 | 39.5 (35.5, 43.8)* | 1,809 | 52.2 (48.6, 55.9) |
| Females | 1,928 | 44.7 (41.3, 48.1) | 446 | 47.1 (41.3, 53.1) | 760 | 34.8 (30.6, 39.2)* | 1,692 | 35.0 (31.7, 38.4)* |
| Atlantic Canada | 496 | 44.0 (38.9, 49.2) | 123 | 46.9 (37.3, 56.7) | 170 | 42.1 (33.5, 51.3) | 422 | 45.8 (40.1, 51.6) |
| Males | 258 | 46.1 (39.2, 53.1) | 62 | 52.5 (38.4, 66.2) | 81 | 39.0 (26.8, 52.7) | 217 | 49.4 (41.3, 57.6) |
| Females | 238 | 41.7 (34.5, 49.2) | 61 | 41.0 (28.3, 55.1) | 89 | 45.0 (33.6, 57.0) | 205 | 41.9 (34.1, 50.2) |
| Québec | 843 | 45.0 (40.3, 49.7) | 206 | 48.6 (40.9, 56.4) | 386 | 29.8 (24.7, 35.5)* | 792 | 43.4 (38.7, 48.3) |
| Males | 417 | 52.0 (45.6, 58.3) | 107 | 48.9 (38.4, 59.4) | 190 | 31.3 (24.2, 39.4)* | 393 | 51.2 (43.8, 58.6) |
| Females | 426 | 37.6 (31.3, 44.4) | 99 | 48.4 (36.8, 60.1) | 196 | 28.3 (21.3, 36.5) | 399 | 35.4 (29.4, 41.8) |
| Ontario | 1,185 | 51.7 (47.3, 56.0) | 258 | 53.5 (45.2, 61.6) | 413 | 36.9 (31.1 43.0)* | 1,003 | 37.9 (33.3, 42.7)* |
| Males | 618 | 56.3 (50.4, 62.0) | 137 | 63.1 (50.7, 74.0) | 212 | 37.8 (29.9, 46.4)* | 526 | 46.8 (40.2, 53.5)* |
| Females | 567 | 46.8 (40.6, 53.0) | 121 | 43.4 (32.2, 55.2) | 201 | 35.9 (28.0, 44.6)* | 477 | 28.7 (23.0, 35.1)* |
| Prairie Provinces | 896 | 51.3 (46.9, 55.6) | 196 | 54.5 (46.5, 62.2) | 446 | 36.2 (31.2, 41.4)* | 767 | 49.5 (44.6, 54.4) |
| Males | 458 | 54.0 (48.0, 59.9) | 92 | 60.6 (49.0, 71.2) | 245 | 39.3 (32.6, 46.5)* | 391 | 56.3 (49.4, 63.0) |
| Females | 438 | 48.4 (42.2, 54.6) | 104 | 47.9 (37.4, 58.6) | 201 | 32.8 (25.7, 40.9)* | 376 | 42.5 (35.7, 49.6) |
| British Columbia | 532 | 51.2 (45.5, 56.8) | 128 | 65.6 (56.6, 73.5)* | 158 | 50.4 (42.3, 58.4) | 517 | 52.8 (47.5, 58.1) |
| Males | 273 | 56.6 (48.2, 64.6) | 67 | 71.7 (59.0, 81.8)* | 85 | 59.6 (48.4, 69.9) | 282 | 66.3 (58.0, 73.7) |
| Females | 259 | 45.4 (37.7, 53.3) | 61 | 59.0 (45.6, 71.2) | 73 | 40.5 (29.5, 52.6) | 235 | 38.8 (31.5, 46.8) |
| 18–64 years | ||||||||
| Canada-wide | 34,040 | 58.7 (57.7, 59.6) | 7,468 | 56.5 (54.6, 58.4) | 11,459 | 57.0 (55.5, 58.5) | 26,797 | 57.5 (56.5, 58.4) |
| Males | 15,898 | 63.0 (61.6, 64.3) | 3,485 | 60.2 (57.5, 62.8) | 5,191 | 59.2 (56.9, 61.3)* | 12,199 | 59.8 (58.4, 61.3)* |
| Females | 18,142 | 54.3 (53.1, 55.6) | 3,983 | 52.9 (50.2, 55.5) | 6,268 | 54.9 (52.8, 56.9) | 14,598 | 55.1 (53.6, 56.5) |
| Atlantic Canada | 4,122 | 56.5 (54.4, 58.7) | 792 | 62.4 (56.6, 67.9) | 1,119 | 56.3 (52.1, 60.3) | 5,346 | 58.4 (56.5, 60.2) |
| Males | 1,800 | 59.0 (55.9, 61.9) | 339 | 72.2 (63.4, 79.5)* | 510 | 53.7 (47.1, 60.2) | 2,360 | 62.0 (59.1, 64.8) |
| Females | 2,322 | 54.2 (51.3, 57.1) | 453 | 52.9 (45.8. 59.9) | 609 | 58.7 (53.4, 63.8) | 2,986 | 54.9 (52.4, 57.3) |
| Québec | 7,595 | 55.6 (53.8, 57.3) | 1,609 | 59.1 (55.3, 62.9) | 2,556 | 52.5 (49.1, 55.8) | 3,914 | 56.2 (53.9, 58.4) |
| Males | 3,642 | 61.2 (58.8, 63.6) | 751 | 65.3 (60.0, 70.3) | 1,192 | 54.6 (50.1, 59.0)* | 1,839 | 58.3 (54.9, 61.5) |
| Females | 3,953 | 49.8 (47.4, 52.3) | 585 | 52.8 (47.9, 57.7) | 1,364 | 50.3 (45.6, 54.9) | 2,075 | 54.1 (51.0, 57.1)* |
| Ontario | 9,875 | 57.2 (55.5, 58.8) | 2,514 | 53.4 (50.2, 56.6)* | 3,927 | 54.6 (52.0, 57.2) | 7,182 | 54.8 (53.0, 56.6) |
| Males | 4,548 | 61.4 (59.0, 63.8) | 1,186 | 55.3 (50.5, 59.9)* | 1,765 | 57.9 (53.9, 61.8) | 3,216 | 57.0 (54.5, 59.6)* |
| Females | 5,327 | 53.0 (50.6, 55.3) | 1,328 | 51.6 (47.0, 56.1) | 2,162 | 51.4 (47.9, 54.9) | 3,966 | 52.6 (50.0, 55.3) |
| Prairie Provinces | 7,742 | 59.7 (58.0, 61.3) | 1,592 | 54.0 (49.6, 58.3)* | 2,474 | 59.3 (56.5, 62.1) | 7,731 | 58.4 (56.6, 60.2) |
| Males | 3,705 | 64.3 (61.8, 66.7) | 757 | 57.5 (51.5, 63.2)* | 1,134 | 61.8 (57.5, 65.8) | 3,582 | 60.3 (57.8, 62.8)* |
| Females | 4,037 | 54.9 (52.6, 57.2) | 835 | 50.4 (45.2, 55.7) | 1,340 | 56.8 (53.1, 60.4) | 4,149 | 56.4 (54.0, 58.8) |
| British Columbia | 4,706 | 68.0 (65.7, 70.2) | 961 | 62.2 (57.3, 66.8)* | 1,383 | 69.0 (65.0, 72.8) | 2,624 | 65.5 (62.7, 68.1) |
| Males | 2,203 | 70.7 (67.4, 73.8) | 452 | 64.2 (56.9, 70.9) | 590 | 69.7 (63.2, 75.6) | 1,202 | 69.0 (65.2, 72.5) |
| Females | 2,503 | 65.3 (62.4, 68.2) | 509 | 60.2 (53.7, 66.4) | 792 | 68.3 (63.2, 73.0) | 1,422 | 62.0 (58.3, 65.6) |
| 65+ years | ||||||||
| Canada-wide | 16,053 | 36.8 (35.6, 38.0) | 6,465 | 38.9 (36.8, 41.0) | 14,202 | 39.9 (38.5, 41.4)* | 18,945 | 40.1 (38.9, 41.3)* |
| Males | 7,067 | 40.7 (38.9, 42.5) | 2,821 | 43.8 (40.6, 47.1) | 6,063 | 44.9 (42.7, 47.0)* | 8,254 | 43.8 (42.1, 45.6)* |
| Females | 8,986 | 33.4 (31.8, 35.0) | 3,644 | 34.6 (32.0, 37.2) | 8,139 | 35.6 (33.7, 37.6) | 10,691 | 36.9 (35.3, 38.5)* |
| Atlantic Canada | 2,259 | 31.5 (29.0, 34.0) | 1,859 | 34.8 (32.1, 37.5) | 4,509 | 36.9 (34.8, 39.0)* | 4,113 | 35.4 (33.4, 37.4)* |
| Males | 1,002 | 37.6 (33.8, 41.6) | 824 | 38.1 (33.8, 42.6) | 1,933 | 40.8 (37.7, 44.0) | 1,788 | 41.9 (39.0, 45.0) |
| Females | 1,257 | 26.1 (23.2, 29.2) | 1,035 | 31.8 (28.3, 35.6)* | 2,576 | 33.4 (30.5, 36.4)* | 2,325 | 29.6 (27.1, 32.2) |
| Québec | 3,582 | 32.3 (30.0, 34.6) | 907 | 36.6 (32.8, 40.6) | 1,762 | 33.3 (30.1, 36.5) | 2,641 | 36.4 (34.0, 38.9)* |
| Males | 1,613 | 37.6 (33.9, 41.3) | 419 | 38.1 (31.5, 45.1) | 779 | 37.9 (33.0, 43.1) | 1,156 | 42.1 (38.2, 46.0) |
| Females | 1,969 | 27.7 (25.1, 30.6) | 488 | 35.4 (30.0, 41.1)* | 983 | 29.2 (25.2, 33.5) | 1,485 | 31.4 (28.3, 34.7) |
| Ontario | 4,890 | 35.9 (33.6, 38.3) | 1,357 | 37.7 (33.7, 41.9) | 2,966 | 38.9 (36.1, 41.8) | 5,430 | 37.8 (35.8, 39.8) |
| Males | 2,098 | 38.3 (35.0, 41.8) | 591 | 46.4 (39.8, 53.2)* | 1,265 | 45.1 (40.9, 49.3)* | 2,347 | 39.7 (36.7, 42.8) |
| Females | 2,792 | 33.9 (30.8, 37.2) | 766 | 30.3 (25.7, 35.3) | 1,701 | 33.7 (30.1, 37.4) | 3,083 | 36.2 (33.5, 39.0) |
| Prairie Provinces | 3,064 | 36.4 (33.8, 39.0) | 1,715 | 38.1 (34.9, 41.3) | 3,413 | 42.6 (40.0, 45.3)* | 4,669 | 44.3 (42.0, 46.7)* |
| Males | 1,341 | 42.3 (38.4, 46.3) | 706 | 47.3 (41.9, 52.7) | 1,428 | 48.0 (44.1, 51.9)* | 2,040 | 49.1 (45.8, 52.5)* |
| Females | 1,723 | 31.2 (27.9, 34.6) | 1,009 | 29.9 (26.2, 33.9) | 1,985 | 37.9 (34.5, 41.4)* | 2,629 | 40.1 (36.8, 43.4)* |
| British Columbia | 2,258 | 50.4 (47.4, 53.5) | 627 | 49.1 (43.9, 54.2) | 1,552 | 53.3 (49.7, 56.9) | 2,092 | 50.7 (47.3, 54.1) |
| Males | 1,013 | 52.2 (47.9, 56.6) | 281 | 46.3 (39.0, 53.9) | 658 | 55.1 (49.4, 60.6) | 923 | 53.1 (47.7, 58.4) |
| Females | 1,245 | 48.8 (44.8, 52.8) | 346 | 51.5 (44.1, 58.9) | 894 | 51.6 (46.8, 56.4) | 1,169 | 48.6 (44.4, 52.8) |
| 2018 | Jan–Mar 2020 | Sept–Dec 2020 | 2021 | |||||
|---|---|---|---|---|---|---|---|---|
| n | Estimate | n | Estimate | n | Estimate | n | Estimate | |
| 12–17 years | ||||||||
| Canada-wide | 3,952 | 72.3 (69.5, 75.1) | 911 | 75.1 (70.2, 80.0) | 1,573 | 56.3 (52.6, 60.0)* | 3,501 | 67.1 (63.8, 70.4)* |
| Males | 2,024 | 80.3 (76.0, 84.6) | 465 | 81.8 (74.4, 89.1) | 813 | 61.0 (55.4, 66.5)* | 1,809 | 78.3 (73.0, 83.6) |
| Females | 1,928 | 63.8 (60.1, 67.6) | 446 | 68.1 (61.6, 74.7) | 760 | 51.5 (46.5, 56.4)* | 1,692 | 55.5 (51.8, 59.2)* |
| Atlantic Canada | 496 | 63.2 (56.6, 69.7) | 123 | 68.2 (56.7, 79.8) | 170 | 58.0 (48.9, 67.2) | 422 | 69.7 (62.3, 77.0) |
| Males | 258 | 68.4 (58.5, 78.2) | 62 | 76.4 (59.7, 93.1) | 81 | 63.2 (48.0, 78.3) | 217 | 76.0 (64.9, 87.0) |
| Females | 238 | 57.5 (49.4, 65.6) | 61 | 59.7 (43.7, 75.6) | 89 | 53.3 (42.5, 64.1) | 205 | 62.9 (53.0, 72.9) |
| Québec | 843 | 64.2 (58.9, 69.5) | 206 | 70.7 (61.7, 79.7) | 386 | 49.1 (43.3, 54.9)* | 792 | 65.1 (57.0, 73.1) |
| Males | 417 | 73.4 (65.9, 80.8) | 107 | 69.5 (56.6, 82.3) | 190 | 50.3 (41.0, 59.6)* | 393 | 76.8 (62.3, 91.3) |
| Females | 426 | 54.6 (47.1, 62.1) | 99 | 71.9 (59.2, 84.7)* | 196 | 47.9 (40.7, 55.1) | 399 | 52.9 (46.5, 59.3) |
| Ontario | 1,185 | 74.2 (68.7, 79.8) | 258 | 72.3 (62.8, 81.9) | 413 | 55.3 (47.9, 62.8)* | 1,003 | 57.8 (52.6, 62.9)* |
| Males | 618 | 81.7 (73.4, 90.0) | 137 | 85.5 (71.2, 99.8) | 212 | 57.6 (46.4, 68.9)* | 526 | 68.3 (60.9, 75.8)* |
| Females | 567 | 66.4 (59.5, 73.2) | 121 | 58.5 (46.3, 70.7) | 201 | 53.0 (42.6, 63.4)* | 477 | 46.8 (40.2, 53.4)* |
| Prairie Provinces | 896 | 76.7 (71.0, 82.3) | 196 | 76.1 (66.6, 85.6) | 446 | 55.0 (48.7, 61.4)* | 767 | 80.1 (73.0, 87.2) |
| Males | 458 | 85.2 (76.3, 94.1) | 92 | 78.2 (64.6, 91.7) | 245 | 60.5 (51.1, 69.9)* | 391 | 90.7 (79.3, 102.0) |
| Females | 438 | 67.6 (60.7, 74.5) | 104 | 73.9 (61.3, 86.5) | 201 | 49.3 (40.6, 58.0)* | 376 | 69.1 (60.5, 77.7) |
| British Columbia | 532 | 77.4 (70.1, 84.6) | 128 | 93.5 (80.4, 106.6)* | 158 | 73.1 (63.5, 82.7) | 517 | 78.3 (71.4, 85.1) |
| Males | 273 | 85.8 (74.5, 97.1) | 67 | 98.9 (81.1, 116.6) | 85 | 89.5 (75.2, 103.8) | 282 | 93.7 (83.2, 104.1) |
| Females | 259 | 68.5 (58.7, 78.3) | 61 | 87.9 (68.7, 107.2) | 73 | 55.6 (43.6, 67.6) | 235 | 62.3 (53.2, 71.4) |
| 18–64 years | ||||||||
| Canada-wide | 34,040 | 45.2 (44.3, 46.1) | 7,468 | 41.6 (39.9, 43.3)* | 11,459 | 44.0 (42.7, 45.4) | 26,797 | 44.6 (43.5, 45.6) |
| Males | 15,898 | 51.9 (50.5, 53.3) | 3,485 | 47.6 (45.1, 50.1)* | 5,191 | 49.8 (47.5, 52.1) | 12,199 | 49.4 (47.8, 51.1)* |
| Females | 18,142 | 38.5 (37.4, 39.5) | 3,983 | 35.6 (33.4, 37.7)* | 6,268 | 38.3 (36.6, 40.0) | 14,598 | 39.7 (38.3, 41.0) |
| Atlantic Canada | 4,122 | 45.8 (43.6, 48.0) | 792 | 49.7 (43.8, 55.7) | 1,119 | 44.9 (41.0, 48.7) | 5,346 | 45.8 (43.9, 47.8) |
| Males | 1,800 | 51.0 (47.7, 54.3) | 339 | 61.4 (52.5, 70.3)* | 510 | 48.5 (42.1, 55.0) | 2,360 | 52.3 (49.0, 55.7) |
| Females | 2,322 | 40.8 (38.1, 43.4) | 453 | 38.3 (31.1, 45.6) | 609 | 41.3 (37.1, 45.6) | 2,986 | 39.5 (37.4, 41.6) |
| Québec | 7,595 | 39.3 (37.8, 40.8) | 1,609 | 39.8 (37.0, 42.7) | 2,556 | 37.7 (34.9, 40.5) | 3,914 | 41.1 (38.9, 43.2) |
| Males | 3,642 | 46.2 (43.9, 48.6) | 751 | 48.8 (44.1, 53.6) | 1,192 | 43.7 (39.1, 48.2) | 1,839 | 46.3 (42.8, 49.7) |
| Females | 3,953 | 32.2 (30.3, 34.0) | 585 | 30.7 (27.7, 33.7) | 1,364 | 31.6 (28.2, 35.0) | 2,075 | 35.7 (33.4, 38.1)* |
| Ontario | 9,875 | 44.6 (43.0, 46.3) | 2,514 | 37.5 (34.8, 40.2)* | 3,927 | 42.3 (39.8, 44.8) | 7,182 | 41.7 (39.9, 43.6)* |
| Males | 4,548 | 51.8 (49.2, 54.4) | 1,186 | 41.8 (37.4, 46.2)* | 1,765 | 48.6 (44.5, 52.7) | 3,216 | 44.8 (42.1, 47.5)* |
| Females | 5,327 | 37.6 (35.8, 39.4) | 1,328 | 33.2 (29.9, 36.5)* | 2,162 | 36.1 (33.1, 39.1) | 3,966 | 38.7 (36.0, 41.3) |
| Prairie Provinces | 7,742 | 47.2 (45.6, 48.9) | 1,592 | 43.4 (39.4, 47.3) | 2,474 | 45.3 (42.6, 48.0) | 7,731 | 47.2 (45.3, 49.1) |
| Males | 3,705 | 54.0 (51.3, 56.7) | 757 | 49.6 (44.1, 55.1) | 1,134 | 50.6 (46.3, 55.0) | 3,582 | 52.9 (50.0, 55.8) |
| Females | 4,037 | 40.2 (38.1, 42.4) | 835 | 36.9 (32.1, 41.7) | 1,340 | 39.8 (36.6, 42.9) | 4,149 | 41.4 (39.2, 43.7) |
| British Columbia | 4,706 | 53.8 (51.5, 56.1) | 961 | 50.6 (46.1, 55.2) | 1,383 | 57.9 (53.5, 62.3) | 2,624 | 54.2 (51.1, 57.3) |
| Males | 2,203 | 59.5 (56.2, 62.8) | 452 | 53.7 (47.0, 60.4) | 590 | 63.2 (56.4, 69.9) | 1,202 | 62.1 (57.2, 67.1) |
| Females | 2,503 | 48.2 (45.2, 51.1) | 509 | 47.6 (41.3, 54.0) | 792 | 52.7 (47.3, 58.0) | 1,422 | 46.4 (42.7, 50.1) |
| 65+ years | ||||||||
| Canada-wide | 16,053 | 26.4 (25.3, 27.5) | 6,465 | 26.2 (24.6, 27.7) | 14,202 | 30.2 (28.8, 31.5)* | 18,945 | 31.1 (30.0, 32.1)* |
| Males | 7,067 | 30.7 (28.8, 32.5) | 2,821 | 30.3 (27.9, 32.7) | 6,063 | 35.2 (33.0, 37.4)* | 8,254 | 35.2 (33.6, 36.9)* |
| Females | 8,986 | 22.7 (21.5, 24.0) | 3,644 | 22.6 (20.7, 24.5) | 8,139 | 25.8 (24.1, 27.4)* | 10,691 | 27.5 (26.0 28.9)* |
| Atlantic | 2,259 | 24.2 (22.1, 26.3) | 1,859 | 24.4 (22.2, 26.6) | 4,509 | 28.3 (26.3, 30.4)* | 4,113 | 27.8 (25.7, 29.9)* |
| Males | 1,002 | 29.9 (26.5, 33.3) | 824 | 28.1 (24.4, 31.8) | 1,933 | 34.3 (31.1, 37.5) | 1,788 | 35.4 (31.8, 39.0* |
| Females | 1,257 | 19.2 (16.7, 21.6) | 1,035 | 21.2 (18.4, 24.0) | 2,576 | 23.1 (20.7, 25.5)* | 2,325 | 21.1 (19.0, 23.1) |
| Québec | 3,582 | 21.7 (20.0, 23.3) | 907 | 23.7 (21.0, 26.4) | 1,762 | 22.0 (19.8, 24.2) | 2,641 | 26.8 (24.9, 28.8)* |
| Males | 1,613 | 26.4 (23.7, 29.2) | 419 | 24.9 (20.7, 29.2) | 779 | 25.0 (21.4, 28.6) | 1,156 | 31.0 (27.9, 34.1)* |
| Females | 1,969 | 17.6 (15.8, 19.4) | 488 | 22.6 (18.4, 26.9)* | 983 | 19.4 (16.7, 22.2) | 1,485 | 23.0 (20.6, 25.5)* |
| Ontario | 4,890 | 26.4 (24.1, 28.7) | 1,357 | 24.8 (21.9, 27.7) | 2,966 | 30.7 (28.0, 33.5)* | 5,430 | 28.3 (26.5, 30.1) |
| Males | 2,098 | 29.9 (26.2, 33.7) | 591 | 31.6 (26.8, 36.5) | 1,265 | 37.8 (33.2, 42.4)* | 2,347 | 30.7 (27.9, 33.4) |
| Females | 2,792 | 23.4 (20.9, 25.9) | 766 | 18.9 (15.6, 22.3)* | 1,701 | 24.7 (21.6, 27.9) | 3,083 | 26.3 (23.8, 28.7) |
| Prairie Provinces | 3,064 | 25.2 (23.3, 27.0) | 1,715 | 27.8 (24.8, 30.7) | 3,413 | 32.0 (29.6, 34.3)* | 4,669 | 36.6 (33.6, 39.6)* |
| Males | 1,341 | 30.4 (27.2, 33.5) | 706 | 34.0 (29.0, 39.1) | 1,428 | 37.0 (33.2, 40.8)* | 2,040 | 42.6 (38.7, 46.5)* |
| Females | 1,723 | 20.6 (18.3, 22.8) | 1,009 | 22.2 (18.9, 25.5) | 1,985 | 27.5 (24.7, 30.3)* | 2,629 | 31.3 (26.9, 35.7)* |
| British Columbia | 2,258 | 37.4 (34.5, 40.3) | 627 | 33.5 (29.7, 37.3) | 1,552 | 41.9 (38.2, 45.7) | 2,092 | 41.9 (38.6, 45.3)* |
| Males | 1,013 | 40.6 (36.0, 45.1) | 281 | 33.3 (27.6, 38.9)* | 658 | 44.4 (38.8, 50.0) | 923 | 46.7 (41.1, 52.2) |
| Females | 1,245 | 34.5 (31.0, 38.0) | 346 | 33.7 (28.8, 38.7) | 894 | 39.7 (34.4, 45.0) | 1,169 | 37.7 (33.5, 41.9) |
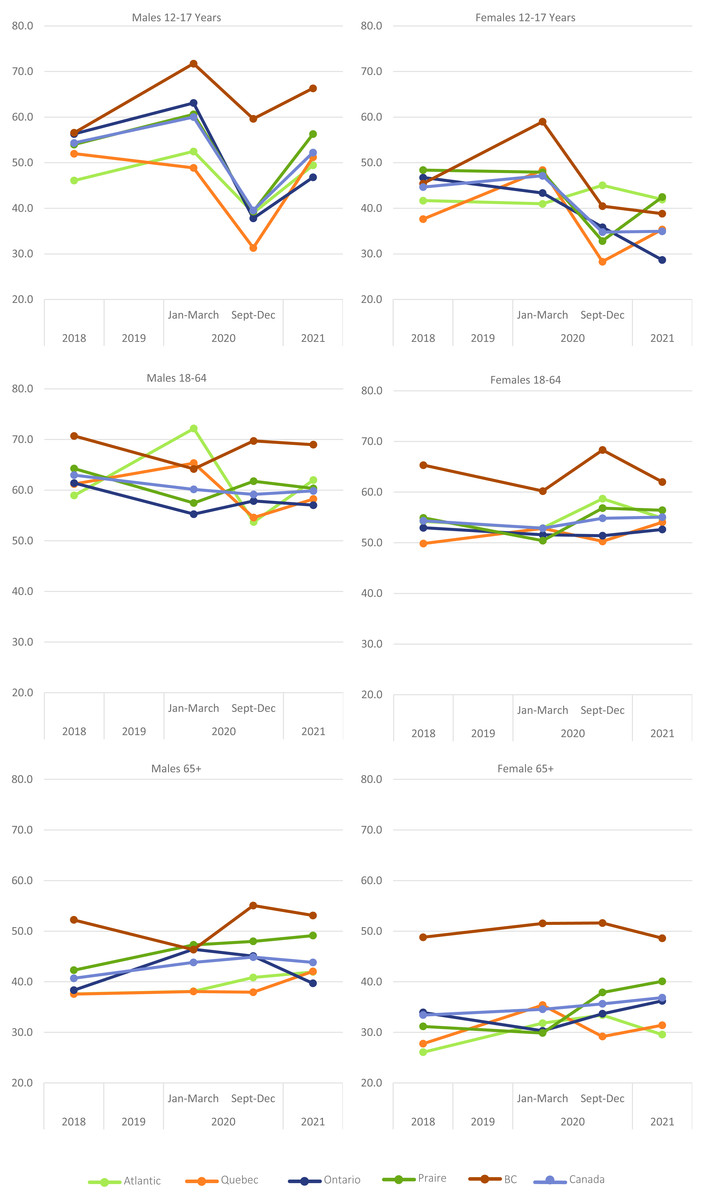
Figure 1: Proportion of Canadians meeting physical activity guidelines across ages and regions.
Among adults 18–64 years at the national level, there was a significant reduction in the proportion of men (but not women) meeting the MVPA guidelines in both the fall of 2020 and 2021, when compared to 2018. In Québec, there was 7-percentage point reduction in the proportion of males meeting the recommendations in the fall of 2020, compared to 2018, while there was a 4-percentage point increase among females in 2021 (all p < 0.05). In Ontario and the Prairie provinces, males saw a 4-percentage point decrease in recommendation adherence in the fall of 2021, when compared to 2018 (p = 0.01). There were no other significant differences across regions when comparing the fall of 2020 or 2021 with 2018 (all p > 0.05).
Among adults aged 65+ years, there was a significant increase in the proportion of men meeting MVPA recommendations at the national level in the fall of 2020 (p < 0.05) and for both men and women in 2021 (p < 0.05). Similar trends were seen at the regional level. Compared to 2018, significant increases were observed in Atlantic Canada and the Prairies in the fall of 2020, and in Atlantic Canada, Québec and the Prairies in 2021 (all p < 0.05), although these changes were not always significant when examining men and women separately. Aside from an increase among Ontario men in the fall of 2020, there were no other changes observed in this age group for adults living in Ontario or BC (all p > 0.05).
Recreational MVPA
Daily recreational MVPA is reported in Table 4. At the national-level, youth reported an average decrease of 10 min per day of recreational MVPA in the fall of 2020, compared to 2018 (p < 0.001), while the difference between 2021 and 2018 was significant in girls, but not boys. Except for boys in Atlantic Canada and BC, all groups saw reductions in the fall of 2020 at the regional level (all p < 0.05). By the fall of 2021 most regions had returned to baseline levels, with the exception of Ontario, which remained lower when both genders were combined (but not in either gender individually).
| 2018 | Jan–Mar 2020 | Sept–Dec 2020 | 2021 | |||||
|---|---|---|---|---|---|---|---|---|
| n | Estimate | n | Estimate | n | Estimate | n | Estimate | |
| 12–17 years | ||||||||
| Canada-wide | 3,952 | 29.8 (28.3, 31.4) | 911 | 29.1 (26.3, 32.0) | 1,573 | 20.3 (18.5, 22.1)* | 3,501 | 27.6 (25.7, 29.6) |
| Males | 2,024 | 33.9 (31.6, 36.2) | 465 | 31.5 (27.4, 35.5) | 813 | 23.3 (20.5, 26.0)* | 1,809 | 33.2 (30.3, 36.1) |
| Females | 1,928 | 25.4 (23.3, 27.5) | 446 | 26.7 (22.6, 30.7) | 760 | 17.2 (14.9, 19.5)* | 1,692 | 21.8 (19.5, 24.2)* |
| Atlantic Canada | 496 | 31.0 (27.2, 34.7) | 123 | 29.6 (22.6, 36.5) | 170 | 24.1 (19.4, 28.8)* | 422 | 33.2 (28.7, 37.7) |
| Males | 258 | 33.1 (27.3, 38.8) | 62 | 33.3 (21.9, 44.6) | 81 | 28.0 (20.0, 35.9) | 217 | 35.0 (29.2, 40.8) |
| Females | 238 | 28.7 (24.3, 33.1) | 61 | 25.4 (17.0, 33.9) | 89 | 20.6 (15.3, 25.9)* | 205 | 31.2 (24.3, 38.2) |
| Québec | 843 | 24.0 (21.0, 27.0) | 206 | 28.1 (22.9, 33.3) | 386 | 14.5 (11.8, 17.2)* | 792 | 25.0 (20.8, 29.2) |
| Males | 417 | 29.3 (24.5, 34.0) | 107 | 31.2 (23.4, 39.1) | 190 | 16.6 (12.0, 21.3)* | 393 | 32.0 (24.9, 39.0) |
| Females | 426 | 18.3 (14.9, 21.7) | 99 | 24.9 (18.1, 31.7) | 196 | 12.3 (9.1, 15.5)* | 399 | 17.7 (13.7, 21.8) |
| Ontario | 1,185 | 31.3 (28.3, 34.3) | 258 | 25.5 (20.1, 31.0) | 413 | 21.0 (17.2, 24.7)* | 1,003 | 26.4 (23.0, 29.9)* |
| Males | 618 | 35.7 (31.3, 40.0) | 137 | 27.7 (20.4, 34.9) | 212 | 22.8 (17.1, 28.6)* | 526 | 31.2 (26.2, 36.2) |
| Females | 567 | 26.7 (22.7, 30.6) | 121 | 23.2 (14.9, 31.6) | 201 | 19.1 (14.2, 24.0* | 477 | 21.5 (17.0, 25.9) |
| Prairie Provinces | 896 | 31.5 (28.4, 34.6) | 196 | 29.9 (24.7, 35.2) | 446 | 20.4 (17.4, 23.5)* | 767 | 29.4 (25.8, 33.0) |
| Males | 458 | 36.4 (31.8, 40.9) | 92 | 31.9 (23.9, 39.9) | 245 | 24.2 (19.6, 28.9)* | 391 | 34.8 (28.9, 40.7) |
| Females | 438 | 26.1 (21.8, 30.4) | 104 | 28.0 (21.6, 34.5) | 201 | 16.5 (12.6, 20.5)* | 376 | 23.8 (19.9, 27.8) |
| British Columbia | 532 | 31.7 (27.4, 36.0) | 128 | 41.1 (33.7, 48.5)* | 158 | 25.8 (21.1, 30.5) | 517 | 30.3 (26.3, 34.3) |
| Males | 273 | 32.7 (26.3, 39.1) | 67 | 42.8 (33.0, 52.6) | 85 | 32.4 (24.6, 40.1) | 282 | 38.1 (32.3, 43.9) |
| Females | 259 | 30.6 (24.9, 36.3) | 61 | 39.4 (28.5, 50.2) | 73 | 18.9 (13.3, 24.5)* | 235 | 22.2 (16.4, 27.9) |
| 18–64 years | ||||||||
| Canada-wide | 34,040 | 15.0 (14.6, 15.4) | 7,468 | 15.0 (14.1, 15.8) | 11,459 | 15.4 (14.7, 16.2) | 26,797 | 16.5 (16.0, 17.1)* |
| Males | 15,898 | 16.7 (16.1, 17.3) | 3,485 | 16.4 (15.2, 17.7) | 5,191 | 16.5 (15.3,17.6) | 12,199 | 17.7 (16.8, 18.5) |
| Females | 18,142 | 13.3 (12.8, 13.8) | 3,983 | 13.5 (12.4, 14.6) | 6,268 | 14.4 (13.4, 15.4)* | 14,598 | 15.4 (14.7,16.1)* |
| Atlantic Canada | 4,122 | 14.2 (13.3, 15.2) | 792 | 15.8 (13.1, 18.6) | 1,119 | 15.2 (13.1, 17.4) | 5,346 | 17.2 (16.0, 18.3)* |
| Males | 1,800 | 14.3 (12.9, 15.8) | 339 | 18.6 (13.8, 23.3) | 510 | 16.4 (12.9, 19.9) | 2,360 | 18.3 (16.4, 20.3)* |
| Females | 2,322 | 14.1 (12.9, 15.4) | 453 | 13.2 (10.5, 15.9) | 609 | 14.1 (11.7, 16.5) | 2,986 | 16.0 (14.8, 17.2)* |
| Québec | 7,595 | 13.9 (13.1, 14.6) | 1,609 | 14.8 (13.1, 16.6) | 2,556 | 13.6 (12.1, 15.0) | 3,914 | 15.5 (14.4, 16.7)* |
| Males | 3,642 | 15.5 (14.4, 16.5) | 751 | 16.0 (13.5, 18.6) | 1,192 | 14.7 (12.4, 17.1) | 1,839 | 16.8 (15.0, 18.6) |
| Females | 3,953 | 12.2 (11.2, 13.2) | 585 | 13.6 (11.6, 15.7) | 1,364 | 12.3 (10.7, 14.0) | 2,075 | 14.3 (12.9, 15.6)* |
| Ontario | 9,875 | 14.3 (13.6, 15.1) | 2,514 | 13.9 (12.6, 15.3) | 3,927 | 14.8 (13.5, 16.1) | 7,182 | 15.3 (14.3, 16.3) |
| Males | 4,548 | 16.4 (15.2, 17.6) | 1,186 | 16.1 (13.8, 18.3) | 1,765 | 16.5 (14.5, 18.5) | 3,216 | 16.4 (15.0, 17.8) |
| Females | 5,327 | 12.3 (11.5, 13.2) | 1,328 | 11.8 (10.1, 13.5) | 2,162 | 13.1 (11.5, 14.8) | 3,966 | 14.2 (12.9, 15.6)* |
| Prairie Provinces | 7,742 | 15.8 (15.0, 16.6) | 1,592 | 15.3 (13.4, 17.3) | 2,474 | 15.9 (14.5, 17.4) | 7,731 | 17.0 (16.0, 18.0) |
| Males | 3,705 | 17.4 (16.1, 18.7) | 757 | 17.0 (14.3, 19.8) | 1,134 | 16.6 (14.3, 18.8) | 3,582 | 17.8 (16.3, 19.3) |
| Females | 4,037 | 14.2 (13.2, 15.1) | 835 | 13.6 (11.3, 15.9) | 1,340 | 15.3 (13.5, 17.1) | 4,149 | 16.3 (15.1, 17.5)* |
| British Columbia | 4,706 | 18.2 (17.1, 19.3) | 961 | 17.4 (14.9, 19.8) | 1,383 | 19.9 (17.3, 22.4) | 2,624 | 20.7 (18.9, 22.4)* |
| Males | 2,203 | 20.0 (18.2, 21.8) | 452 | 16.2 (13.0, 19.5)* | 590 | 19.1 (15.8, 22.5) | 1,202 | 22.2 (19.7, 24.7) |
| Females | 2,503 | 16.4 (15.0, 17.8) | 509 | 18.5 (14.6, 22.3) | 792 | 20.6 (17.0, 24.2)* | 1,422 | 19.2 (16.8, 21.6)* |
| 65+ years | ||||||||
| Canada-wide | 16,053 | 9.0 (8.4, 9.6) | 6,465 | 8.2 (7.4, 9.0) | 14,202 | 9.2 (8.5, 9.8) | 18,945 | 11.1 (10.5, 11.7)* |
| Males | 7,067 | 11.0 (9.9, 12.1) | 2,821 | 10.0 (8.7, 11.3) | 6,063 | 11.1 (10.0, 12.3) | 8,254 | 13.0 (12.0, 14.0)* |
| Females | 8,986 | 7.3 (6.7, 7.8) | 3,644 | 6.6 (5.5, 7.6) | 8,139 | 7.4 (6.7, 8.2) | 10,691 | 9.5 (8.7, 10.2)* |
| Atlantic Canada | 2,259 | 7.8 (6.8, 8.7) | 1,859 | 7.4 (6.3, 8.5) | 4,509 | 9.1 (8.1, 10.1) | 4,113 | 8.7 (7.8, 9.7) |
| Males | 1,002 | 9.7 (8.0, 11.4) | 824 | 8.1 (6.1, 10.1) | 1,933 | 10.3 (8.7, 11.9) | 1,788 | 11.5 (9.7, 13.3) |
| Females | 1,257 | 6.1 (5.0, 7.1) | 1,035 | 6.7 (5.3, 8.2) | 2,576 | 8.0 (6.7, 9.4)* | 2,325 | 6.3 (5.5, 7.1) |
| Québec | 3,582 | 8.1 (7.1, 9.1) | 907 | 7.9 (6.0, 9.8) | 1,762 | 6.9 (5.7, 8.0) | 2,641 | 9.9 (8.8, 11.1)* |
| Males | 1,613 | 10.1 (8.4, 11.8) | 419 | 7.6 (5.6, 9.5) | 779 | 7.7 (5.9, 9.5) | 1,156 | 12.6 (10.5, 14.6) |
| Females | 1,969 | 6.5 (5.5, 7.4) | 488 | 8.2 (5.2, 11.2) | 983 | 6.1 (4.7, 7.5) | 1,485 | 7.6 (6.4, 8.8) |
| Ontario | 4,890 | 9.2 (8.0, 10.4) | 1,357 | 7.2 (5.8, 8.5)* | 2,966 | 9.2 (7.8, 10.7) | 5,430 | 10.6 (9.5, 11.7) |
| Males | 2,098 | 11.1 (8.8, 13.5) | 591 | 10.4 (7.7, 13.0) | 1,265 | 11.7 (9.4, 14.1) | 2,347 | 11.9 (10.2, 13.6) |
| Females | 2,792 | 7.5 (6.4, 8.6) | 766 | 4.4 (3.3, 5.6)* | 1,701 | 7.1 (5.5, 8.7) | 3,083 | 9.5 (8.1, 11.0)* |
| Prairie Provinces | 3,064 | 8.4 (7.4, 9.4) | 1,715 | 10.2 (8.5, 11.9) | 3,413 | 10.8 (9.4, 12.3)* | 4,669 | 11.9 (10.5, 13.4)* |
| Males | 1,341 | 10.2 (8.5, 11.9) | 706 | 13.1 (10.3, 15.9) | 1,428 | 13.0 (10.4, 15.6) | 2,040 | 12.5 (10.5, 14.6) |
| Females | 1,723 | 6.9 (5.8, 8.0) | 1,009 | 7.7 (5.8, 9.6) | 1,985 | 8.9 (7.5, 10.4)* | 2,629 | 11.4 (9.4, 13.4)* |
| British Columbia | 2,258 | 11.4 (10.1, 12.7) | 627 | 9.7 (7.6, 11.8) | 1,552 | 11.2 (9.5, 12.8) | 2,092 | 14.8 (13.2, 16.5)* |
| Males | 1,013 | 13.9 (11.8, 16.0) | 281 | 11.2 (7.8, 14.6) | 658 | 13.8 (11.0, 16.5) | 923 | 17.8 (15.0, 20.6)* |
| Females | 1,245 | 9.1 (7.6, 10.6) | 346 | 8.3 (5.5, 11.0) | 894 | 8.8 (7.1, 10.5) | 1,169 | 12.2 (10.3, 14.0)* |
Among adults aged 18–64 years, recreational MVPA levels generally remained stable between 2018 and the fall of 2020, with the exception of increased MVPA among women in BC (p < 0.05). In the fall of 2021, significant increases in recreational MVPA were seen nationally, as well as in Québec (overall and in women) and in, Ontario, and the Prairie Provinces (women only) (all p < 0.05). Among males, an increase in recreational MVPA was seen only in Atlantic Canada. Among adults 65+ years, recreational MVPA levels were significantly increased in the fall of 2020 in females in Atlantic Canada and the Prairie Provinces (all p < 0.05). In the fall of 2021, increases were observed for females in Ontario and the Prairies, in both genders in BC, and overall in Québec (but not in either gender individually).
Active transportation
Active transportation decreased significantly among boys and girls at the national level in the fall of 2020 (all p < 0.001) and remained at this level in the fall of 2021 for girls, but not boys (Table 5). Both genders in Ontario and the Prairies, and boys in Québec saw reduced time spent in active transportation in the fall of 2020, which remained reduced in 2021 in Ontario only (all p < 0.05). There was no change in active transportation in either Atlantic Canada or BC at any time point (all p > 0.05). Among adults 18–64 years nation-wide, there was a significant reduction in active transportation levels in the fall of 2020 for females, and for both genders in 2021 (all p < 0.05). At the regional level in the fall of 2020, a significant increase was seen for females in Atlantic Canada, along with a significant decrease for females in Ontario, with no changes seen among males in any region. In the fall of 2021, decrease in active transportation was observed in BC (among women), Ontario saw a decrease in both genders, and Atlantic Canada saw an increase among males only. Among adults 65+ years there were small but significant increases nation-wide in the fall of 2020 but not 2021 (all p < 0.001) for both males and females. At the regional level, overall increases were seen in the fall of 2020 in Ontario, and for both males and females in Atlantic Canada (all p < 0.05). In the fall of 2021, Atlantic Canada, Quebec and the Prairies saw an increase either overall or in at least one gender, while BC saw an overall decrease (all p < 0.05). There were no changes seen in Ontario when comparing 2021 and 2018 (p > 0.05).
| 2018 | Jan–Mar 2020 | Sept–Dec 2020 | 2021 | |||||
|---|---|---|---|---|---|---|---|---|
| n | Estimate | n | Estimate | n | Estimate | n | Estimate | |
| 12–17 years | ||||||||
| Canada-wide | 3,952 | 24.8 (23.3, 26.3) | 911 | 23.1 (20.4, 25.7) | 1,573 | 19.6 (17.8, 21.4)* | 3,501 | 20.4 (18.8, 22.0)* |
| Males | 2,024 | 25.9 (23.6, 28.1) | 465 | 24.7 (20.6, 28.9) | 813 | 19.4 (16.9, 21.9)* | 1,809 | 22.7 (20.1, 25.4) |
| Females | 1,928 | 23.6 (21.5, 25.7) | 446 | 21.3 (18.2, 24.4) | 760 | 19.8 (17.2, 22.3* | 1,692 | 17.9(16.3, 19.6)* |
| Atlantic Canada | 496 | 17.3 (14.2, 20.4) | 123 | 21.8 (15.0, 28.6) | 170 | 19.7 (14.6, 24.9) | 422 | 18.8 (15.4, 22.3) |
| Males | 258 | 18.6 (14.3, 22.9) | 62 | 25.6E (15.9, 35.4) | 81 | 19.6E (11.7, 27.5) | 217 | 21.0 (15.5, 26.6) |
| Females | 238 | 15.9 (11.4, 20.3) | 61 | 17.9E (9.0, 26.7) | 89 | 19.8E (12.9, 26.8) | 205 | 16.5 (12.2, 20.8) |
| Québec | 843 | 21.5 (18.8, 24.2) | 206 | 18.7 (14.7, 22.6) | 386 | 15.8 (13.2, 18.4)* | 792 | 21.9 (18.0, 25.8) |
| Males | 417 | 22.1 (18.2, 25.9) | 107 | 17.9 (12.5, 23.2) | 190 | 13.3 (10.5, 16.1)* | 393 | 23.8 (17.1, 30.6) |
| Females | 426 | 20.8 (17.0, 24.7) | 99 | 19.4 (13.3, 25.6) | 196 | 18.4 (13.8, 22.9) | 399 | 19.9 (16.2, 23.5) |
| Ontario | 1,185 | 27.3 (24.3, 30.4) | 258 | 23.9 (18.3, 29.5) | 413 | 19.7 (16.3, 23.1)* | 1,003 | 17.1 (14.7, 19.5)* |
| Males | 618 | 28.1 (23.6, 32.5) | 137 | 29.1 (19.6, 38.5) | 212 | 19.3 (14.3, 24.2)* | 526 | 20.1 (16.1, 24.1)* |
| Females | 567 | 26.6 (22.5, 30.7) | 121 | 18.2 (12.8, 23.7)* | 201 | 20.1 (15.4, 24.8* | 477 | 14.0 (11.3, 16.8)* |
| Prairie Provinces | 896 | 24.1 (21.2, 27.1) | 196 | 21.1 (16.9, 25.3) | 446 | 17.3 (14.5, 20.0)* | 767 | 23.8 (19.8, 27.7) |
| Males | 458 | 25.7 (21.1, 30.3) | 92 | 20.5 (14.7, 26.4) | 245 | 17.9 (14.2, 21.6)* | 391 | 24.9 (18.5, 31.2) |
| Females | 438 | 22.4 (18.8, 26.0) | 104 | 21.6 (15.9, 27.4) | 201 | 16.6 (12.4, 20.8* | 376 | 22.6 (18.3, 26.8) |
| British Columbia | 532 | 26.6 (23.0, 30.2) | 128 | 32.2 (25.8, 38.6) | 158 | 29.2 (22.8, 35.7) | 517 | 23.8 (20.6, 26.9) |
| Males | 273 | 29.0 (23.6, 34.3) | 67 | 29.1 (21.7, 36.4) | 85 | 32.0 (22.8, 41.1) | 282 | 26.7 (21.5, 31.8) |
| Females | 259 | 24.0 (19.0, 29.0) | 61 | 35.4 (25.2, 45.7) | 73 | 26.3 (17.6, 34.9) | 235 | 20.7 (16.8, 24.7) |
| 18–64 years | ||||||||
| Canada-wide | 34,040 | 13.8 (13.4, 14.3) | 7,468 | 13.3 (12.5, 14.2) | 11,459 | 12.9 (12.2, 13.7)* | 26,797 | 12.3 (11.8, 12.7)* |
| Males | 15,898 | 14.7 (14.0, 15.4) | 3,485 | 14.9 (13.6, 16.2) | 5,191 | 14.1 (13.0, 15.2) | 12,199 | 12.8 (12.1, 13.5)* |
| Females | 18,142 | 13.0 (12.4, 13.5) | 3,983 | 11.7 (10.7, 12.8)* | 6,268 | 11.8 (10.8, 12.7)* | 14,598 | 11.7 (11.0, 12.4)* |
| Atlantic Canada | 4,122 | 8.8 (7.9, 9.6) | 792 | 14.7 (10.9, 18.5)* | 1,119 | 11.0 (8.9, 13.1) | 5,346 | 10.0 (9.1, 10.9)* |
| Males | 1,800 | 9.3 (8.0, 10.6) | 339 | 18.3E (11.9, 24.7)* | 510 | 9.7 (7.2, 12.3) | 2,360 | 11.7 (10.2, 13.2)* |
| Females | 2,322 | 8.2 (7.3, 9.2) | 453 | 11.3E (7.4, 15.2) | 609 | 12.2 (9.1, 15.3)* | 2,986 | 8.4 (7.4, 9.3) |
| Québec | 7,595 | 11.8 (11.1, 12.6) | 1,609 | 12.3 (10.7, 14.0) | 2,556 | 11.1 (9.5, 12.7) | 3,914 | 12.2 (11.2, 13.2) |
| Males | 3,642 | 12.9 (11.6, 14.2) | 751 | 14.5 (11.5, 17.5) | 1,192 | 12.1 (9.8, 14.3) | 1,839 | 12.3 (10.8, 13.9) |
| Females | 3,953 | 10.8 (9.9, 11.6) | 585 | 10.0 (8.5, 11.6) | 1,364 | 10.1 (8.0, 12.2) | 2,075 | 12.1 (10.8, 13.5) |
| Ontario | 9,875 | 15.2 (14.3, 16.2) | 2,514 | 12.0 (10.8, 13.2)* | 3,927 | 13.0 (11.8, 14.3)* | 7,182 | 11.9 (11.0, 12.8)* |
| Males | 4,548 | 16.3 (14.9, 17.7) | 1,186 | 12.6 (10.8, 14.5)* | 1,765 | 14.1 (12.2, 16.0) | 3,216 | 12.1 (10.8, 13.4)* |
| Females | 5,327 | 14.2 (13.1, 15.4) | 1,328 | 11.4 (10.1, 12.8)* | 2,162 | 12.0 (10.3, 13.7)* | 3,966 | 11.8 (10.5, 13.1)* |
| Prairie Provinces | 7,742 | 11.9 (11.1, 12.6) | 1,592 | 13.4 (11.6, 15.3) | 2,474 | 11.6 (10.4, 12.9) | 7,731 | 11.4 (10.6, 12.3) |
| Males | 3,705 | 12.9 (11.7, 14.1) | 757 | 16.5 (13.7, 19.3)* | 1,134 | 13.4 (11.3, 15.5) | 3,582 | 12.2 (11.0, 13.5) |
| Females | 4,037 | 10.9 (10.0, 11.7) | 835 | 10.4 (7.9, 12.8) | 1,340 | 9.8 (8.5, 11.1) | 4,149 | 10.6 (9.5, 11.7) |
| British Columbia | 4,706 | 18.4 (17.1, 19.7) | 961 | 18.2 (15.8, 20.6) | 1,383 | 18.5 (16.0, 21.1) | 2,624 | 15.2 (13.8, 16.7)* |
| Males | 2,203 | 18.5 (16.5, 20.5) | 452 | 18.9 (15.3, 22.5) | 590 | 20.8 (16.5, 25.0) | 1,202 | 16.9 (14.7, 19.1) |
| Females | 2,503 | 18.2 (16.6, 19.8) | 509 | 17.5 (14.3, 20.7) | 792 | 16.4 (13.9, 18.8) | 1,422 | 13.6 (11.8, 15.4)* |
| 65+ years | ||||||||
| Canada-wide | 16,053 | 9.3 (8.7, 9.9) | 6,465 | 11.7 (10.7, 12.6)* | 14,202 | 11.1 (10.3, 11.9)* | 18,945 | 10.0 (9.4, 10.5) |
| Males | 7,067 | 10.0 (9.1, 10.9) | 2,821 | 13.0 (11.5, 14.5)* | 6,063 | 12.1 (10.8, 13.4)* | 8,254 | 10.7 (9.8, 11.5) |
| Females | 8,986 | 8.7 (8.0, 9.4) | 3,644 | 10.5 (9.3, 11.7)* | 8,139 | 10.3 (9.3, 11.3)* | 10,691 | 9.4 (8.6, 10.1) |
| Atlantic Canada | 2,259 | 5.1 (4.3, 5.9) | 1,859 | 7.5 (6.2, 8.7)* | 4,509 | 7.9 (7.0, 8.8)* | 4,113 | 7.1 (6.2, 7.9)* |
| Males | 1,002 | 5.4 (4.2, 6.6) | 824 | 8.8 (6.9, 10.6)* | 1,933 | 9.7 (8.1, 11.2)* | 1,788 | 8.5 (7.0, 10.0)* |
| Females | 1,257 | 4.8 (3.7, 5.9) | 1,035 | 6.3 (4.8, 7.8) | 2,576 | 6.4 (5.4, 7.4)* | 2,325 | 5.8 (4.9, 6.6) |
| Québec | 3,582 | 7.4 (6.6, 8.2) | 907 | 10.2 (8.6, 11.8)* | 1,762 | 7.7 (6.5, 8.9) | 2,641 | 9.4 (8.4, 10.4)* |
| Males | 1,613 | 8.0 (6.7, 9.3) | 419 | 10.9 (7.9, 13.8) | 779 | 8.5 (6.4, 10.7) | 1,156 | 10.2 (8.6, 11.7)* |
| Females | 1,969 | 6.9 (5.9, 7.8) | 488 | 9.6 (7.5, 11.7)* | 983 | 7.0 (5.6, 8.5) | 1,485 | 8.6 (7.4, 9.9)* |
| Ontario | 4,890 | 9.4 (8.2, 10.5) | 1,357 | 12.1 (10.3, 13.9)* | 2,966 | 11.8 (10.1, 13.5)* | 5,430 | 9.2 (8.3, 10.2) |
| Males | 2,098 | 10.4 (8.6, 12.2) | 591 | 14.7 (11.7, 17.8)* | 1,265 | 12.7 (10.1, 15.4) | 2,347 | 9.3 (7.9, 10.7) |
| Females | 2,792 | 8.5 (7.1, 9.8) | 766 | 9.9 (7.8, 12.0) | 1,701 | 11.0 (8.9, 13.1) | 3,083 | 9.1 (7.8, 10.5) |
| Prairie Provinces | 3,064 | 8.3 (7.1, 9.4) | 1,715 | 10.4 (8.5, 12.4) | 3,413 | 9.7 (8.5, 10.8) | 4,669 | 11.0 (9.5, 12.6)* |
| Males | 1,341 | 9.1 (7.4, 10.8) | 706 | 13.3 (9.6, 16.9)* | 1,428 | 10.9 (9.0, 12.7) | 2,040 | 13.0 (11.1, 14.8)* |
| Females | 1,723 | 7.5 (6.0, 9.0) | 1,009 | 8.0 (6.3, 9.7) | 1,985 | 8.6 (7.1, 10.1) | 2,629 | 9.3 (7.0, 11.6) |
| British Columbia | 2,258 | 16.1 (14.3, 17.8) | 627 | 16.6 (13.8, 19.4) | 1,552 | 18.7 (16.4, 21.1) | 2,092 | 13.5 (11.8, 15.3)* |
| Males | 1,013 | 15.8 (13.3, 18.4) | 281 | 14.0 (10.2, 17.9) | 658 | 19.1 (15.6, 22.5) | 923 | 13.8 (11.0, 16.5) |
| Females | 1,245 | 16.3 (14.1, 18.5) | 346 | 18.9 (14.9, 22.9) | 894 | 18.4 (15.3, 21.5) | 1,169 | 13.3 (11.2, 15.4) |
School-related MVPA
Nationally, school-related MVPA was significantly lower in the fall of 2020 and 2021 when compared to 2018 for both genders (all p < 0.05) (Table 6). School-related MVPA was significantly reduced in the fall of 2020 for boys in the Prairie Provinces, girls in BC, and both genders in Ontario (all p < 0.05). In the fall of 2021, school-related MVPA was significantly reduced from 2018 levels in Québec females and both genders in Ontario, with no significant changes seen in any other groups.
| 2018 | Jan–Mar 2020 | Sept–Dec 2020 | 2021 | |||||
|---|---|---|---|---|---|---|---|---|
| n | Estimate | n | Estimate | n | Estimate | n | Estimate | |
| 12–17 years | ||||||||
| Canada-wide | 3,952 | 19.1 (18.0, 20.3) | 911 | 22.0 (19.9, 24.0)* | 1,573 | 13.0 (11.6, 14.5)* | 3,501 | 13.8 (12.8, 14.9)* |
| Males | 2,024 | 21.1 (19.3, 22.8) | 465 | 23.6 (20.7, 26.5) | 813 | 14.6 (12.4, 16.8)* | 1,809 | 16.4 (14.7, 18.2)* |
| Females | 1,928 | 17.0 (15.4, 18.6) | 446 | 20.2 (17.4, 22.9) | 760 | 11.4 (9.5, 13.3)* | 1,692 | 11.2 (10.0, 12.4)* |
| Atlantic Canada | 496 | 16.2 (13.5, 18.8) | 123 | 16.0 (12.2, 19.8) | 170 | 12.1 (8.8, 15.4) | 422 | 13.0 (10.6, 15.4) |
| Males | 258 | 18.0 (14.1, 21.9) | 62 | 15.9E (10.7, 21.1) | 81 | 12.0E (6.8, 17.1) | 217 | 14.8 (11.2, 18.3) |
| Females | 238 | 14.1 (10.7, 17.5) | 61 | 16.2E (10.6, 21.8) | 89 | 12.2E (7.9, 16.5) | 205 | 11.1 (7.8, 14.4) |
| Québec | 843 | 19.4 (17.1, 21.8) | 206 | 23.3 (19.4, 27.2) | 386 | 17.6 (14.6, 20.6) | 792 | 13.7 (11.5, 16.0)* |
| Males | 417 | 19.5 (16.7, 22.4) | 107 | 21.5 (15.7, 27.2) | 190 | 19.8 (15.5, 24.2) | 393 | 14.9 (11.0, 18.7) |
| Females | 426 | 19.4 (15.6, 23.2) | 99 | 25.2 (20.1, 30.2) | 196 | 15.4 (11.3, 19.5) | 399 | 12.6 (10.1, 15.1)* |
| Ontario | 1,185 | 18.5 (16.3, 20.6) | 258 | 20.8 (17.0, 24.6) | 413 | 10.3 (7.6, 12.9)* | 1,003 | 9.8 (8.1, 11.5)* |
| Males | 618 | 20.6 (17.4, 23.8) | 137 | 24.5 (18.9, 30.0) | 212 | 10.2E (6.4, 13.9)* | 526 | 13.1 (10.3, 16.0)* |
| Females | 567 | 16.2 (13.5, 19.0) | 121 | 16.8 (11.8, 21.8) | 201 | 10.4E (6.7, 14.0)* | 477 | 6.4 (4.7, 8.0)* |
| Prairie Provinces | 896 | 20.5 (18.0, 23.0) | 196 | 23.7 (19.6, 27.9) | 446 | 14.3 (11.7, 17.0)* | 767 | 18.6 (16.1, 21.2) |
| Males | 458 | 23.8 (19.9, 27.6) | 92 | 23.1 (18.1, 28.2) | 245 | 16.0 (12.0, 20.0)* | 391 | 20.6 (16.6, 24.6) |
| Females | 438 | 16.9 (14.0, 19.9) | 104 | 24.4 (17.7, 31.1)* | 201 | 12.6 (8.9, 16.3) | 376 | 16.6 (13.4, 19.8) |
| British Columbia | 532 | 20.1 (17.0, 23.1) | 128 | 23.5 (18.6, 28.5) | 158 | 12.5 (8.8, 16.1)* | 517 | 19.6 (16.2, 23.0) |
| Males | 273 | 22.6 (17.8, 27.5) | 67 | 29.3 (22.6, 36.0) | 85 | 18.8E (12.3, 25.3) | 282 | 23.5 (18.1, 28.9) |
| Females | 259 | 17.4 (13.9, 20.9) | 61 | 17.5 (10.1, 24.9) | 73 | 5.7E (2.6, 8.8)* | 235 | 15.7 (11.8, 19.6) |
Occupational/household MVPA
Although there was excessive variability to perform statistical testing for examine occupational/household MVPA at the regional level among youth, nationally this form of activity increased in 2021 (p < 0.001), but not the fall of 2020 (p =0.71), when compared to 2018 in this age group (Table 7). Among adults 18–64 years national trends saw no change in the fall of 2020, with a significant decrease seen in males only (p < 0.05). Atlantic Canada observed a significant decrease among women in the fall of 2020, and among both genders in the fall of 2021 (all p < 0.05). Ontario also saw a significant reduction among males in the fall of 2021 (all p < 0.05). There were no other significant changes observed in any region for this age group (all p > 0.05). Among adults 65+ years, the national trend was for a significant increase in household and occupational MVPA for both genders in both the fall of 2020 and in 2021 (all p < 0.05). At the regional level, significant increases in the fall of 2020 were seen among females in Québec and the Prairie Provinces, and among males in Ontario (all p < 0.05). In the fall of 2021, we observed significant increases in occupational and household MVPA for both males and females in the Prairie Provinces, females in Québec, and for BC overall (but not in either gender individually) (all p < 0.05).
| 2018 | Jan–Mar 2020 | Sept–Dec 2020 | 2021 | |||||
|---|---|---|---|---|---|---|---|---|
| n | Estimate | n | Estimate | n | Estimate | n | Estimate | |
| 12–17 years | ||||||||
| Canada-wide | 3,952 | 4.9 (4.3, 5.4) | 911 | 4.6E (3.0, 6.2) | 1,573 | 5.1 (3.9, 6.4) | 3,501 | 6.9 (5.9, 7.9)* |
| Males | 2,024 | 5.4 (4.6, 6.2) | 465 | 6.0E (3.2, 8.7) | 813 | 5.7E (3.7, 7.7) | 1,809 | 7.7 (6.1, 9.4)* |
| Females | 1,928 | 4.3 (3.5, 5.1) | 446 | 3.2E (1.5, 4.8) | 760 | 4.5 (3.0, 5.9) | 1,692 | 6.0 (4.8, 7.2)* |
| Atlantic Canada | 496 | 4.7E (2.8, 6.6) | 123 | 4.3E (1.8, 6.7) | 170 | – | 422 | 6.4E (4.0, 8.8) |
| Males | 258 | 5.2E (2.6, 7.8) | 62 | – | 81 | – | 217 | 7.8E (4.1, 11.5) |
| Females | 238 | 4.2E (1.7, 6.6) | 61 | – | 89 | – | 205 | 5.0E (2.0, 8.0) |
| Québec | 843 | 4.5 (3.3, 5.7) | 206 | – | 386 | 3.2E (1.4, 4.9) | 792 | 7.1E (4.4, 9.8) |
| Males | 417 | 6.6 (4.5, 8.7) | 107 | 1.8 (0.6, 2.9) | 190 | – | 393 | 9.1E (4.3, 14.0) |
| Females | 426 | 2.3E (1.3, 3.4) | 99 | – | 196 | 3.6E (1.5, 5.6) | 399 | 5.1E (2.8, 7.3) |
| Ontario | 1,185 | 3.8 (3.0, 4.7) | 258 | 6.2E (2.5, 9.9) | 413 | 5.7E (3.1, 8.3) | 1,003 | 5.5 (4.2, 6.9) |
| Males | 618 | 4.1 (2.9, 5.4) | 137 | – | 212 | 6.9E (2.7, 11.2) | 526 | 5.2 (3.8, 6.7) |
| Females | 567 | 3.5E (2.4, 4.7) | 121 | – | 201 | – | 477 | 5.9E (3.7, 8.0) |
| Prairie Provinces | 896 | 6.9 (5.4, 8.4) | 196 | 4.6E (2.2, 7.1) | 446 | 4.3 (3.0, 5.7) | 767 | 10.3 (7.4, 13.2) |
| Males | 458 | 5.5 (3.8, 7.1) | 92 | 7.3E (2.7, 12.0) | 245 | 4.2E (2.3, 6.1) | 391 | 11.9E (7.4, 16.4) |
| Females | 438 | 8.5 (5.8, 11.2) | 104 | – | 201 | 4.4E (2.6, 6.3) | 376 | 8.6 (5.1, 12.1) |
| British Columbia | 532 | 5.6 (4.0, 7.1) | 128 | 3.0E (1.2, 4.9) | 158 | 8.2E (4.4, 11.9) | 517 | 5.5 (3.5, 7.4) |
| Males | 273 | 7.6E (5.1, 10.1) | 67 | – | 85 | 8.9E (3.1, 14.7) | 282 | 6.4E (3.8, 9.0) |
| Females | 259 | 3.5 (1.6, 5.4) | 61 | – | 73 | 7.3E (2.8, 11.8) | 235 | 4.5E (1.7, 7.4) |
| 18–64 years | ||||||||
| Canada-wide | 34,040 | 16.6 (16.0, 17.2) | 7,468 | 13.5 (12.6, 14.5)* | 11,459 | 15.9 (14.9, 16.8) | 26,797 | 16.0 (15.4, 16.6) |
| Males | 15,898 | 20.8 (19.8, 21.7) | 3,485 | 16.5 (14.9, 18.1)* | 5,191 | 19.4 (17.8, 21.1) | 12,199 | 19.2 (18.3, 20.2)* |
| Females | 18,142 | 12.4 (11.8, 13.0) | 3,983 | 10.6 (9.4, 11.7)* | 6,268 | 12.3 (11.3, 13.2) | 14,598 | 12.7 (11.9, 13.5) |
| Atlantic Canada | 4,122 | 23.2 (21.5, 24.8) | 792 | 19.3 (15.8, 22.8) | 1,119 | 18.7 (16.0, 21.5)* | 5,346 | 18.8 (17.5, 20.2)* |
| Males | 1,800 | 27.7 (25.1, 30.3) | 339 | 24.9 (19.4, 30.4) | 510 | 22.6 (17.6, 27.5) | 2,360 | 22.5 (20.4, 24.7)* |
| Females | 2,322 | 18.8 (16.8, 20.7) | 453 | 13.9 (10.0, 17.8)* | 609 | 15.1 (12.5, 17.7)* | 2,986 | 15.3 (13.7, 16.8)* |
| Québec | 7,595 | 13.7 (12.7, 14.8) | 1,609 | 12.9 (11.0, 14.8) | 2,556 | 13.2 (11.4, 15.0) | 3,914 | 13.4 (12.1, 14.7) |
| Males | 3,642 | 18.0 (16.4, 19.7) | 751 | 18.5 (15.0, 22.0) | 1,192 | 16.9 (13.9, 19.9) | 1,839 | 17.3 (15.1, 19.6) |
| Females | 3,953 | 9.3 (8.1, 10.5) | 585 | 7.2 (5.7, 8.6)* | 1,364 | 9.3 (7.4, 11.3) | 2,075 | 9.4 (8.1, 10.6) |
| Ontario | 9,875 | 15.4 (14.4, 16.4) | 2,514 | 11.8 (10.3, 13.4)* | 3,927 | 14.7 (13.1, 16.2) | 7,182 | 14.7 (13.7, 15.8) |
| Males | 4,548 | 19.6 (17.9, 21.3) | 1,186 | 13.4 (10.8, 16.1)* | 1,765 | 18.3 (15.6, 21.0) | 3,216 | 16.5 (15.1, 18.0)* |
| Females | 5,327 | 11.3 (10.3, 12.3) | 1,328 | 10.3 (8.4, 12.2) | 2,162 | 11.1 (9.4, 12.7) | 3,966 | 13.0 (11.4, 14.6) |
| Prairie Provinces | 7,742 | 19.7 (18.5, 21.0) | 1,592 | 14.8 (12.6, 17.0)* | 2,474 | 17.9 (16.1, 19.6) | 7,731 | 18.9 (17.7, 20.1) |
| Males | 3,705 | 23.9 (21.9, 25.9) | 757 | 16.5 (13.3, 19.7)* | 1,134 | 20.9 (17.9, 23.8) | 3,582 | 23.0 (21.1, 24.9) |
| Females | 4,037 | 15.4 (3.8, 16.9) | 835 | 13.0 (10.2, 15.9) | 1,340 | 14.8 (12.7, 17.0) | 4,149 | 14.7 (13.3, 16.0) |
| British Columbia | 4,706 | 17.5 (16.1, 18.9) | 961 | 15.3 (12.6, 17.9) | 1,383 | 19.8 (16.9, 22.6) | 2,624 | 18.4 (16.5, 20.4) |
| Males | 2,203 | 21.2 (19.0, 23.4) | 452 | 18.6 (14.0, 23.1) | 590 | 23.8 (18.6, 29.0) | 1,202 | 23.4 (20.1, 26.6) |
| Females | 2,503 | 13.8 (12.1, 15.5) | 509 | 12.0 (8.6, 15.4) | 792 | 15.8 (12.8, 18.8) | 1,422 | 13.6 (11.6, 15.7) |
| 65+ years | ||||||||
| Canada-wide | 16,053 | 8.4 (7.8, 8.9) | 6,465 | 6.5 (5.7, 7.3)* | 14,202 | 10.1 (9.4, 10.8)* | 18,945 | 10.2 (9.6, 10.8)* |
| Males | 7,067 | 9.9 (9.1, 10.8) | 2,821 | 7.4 (6.3, 8.6)* | 6,063 | 12.2 (11.0, 13.4)* | 8,254 | 11.8 (10.9, 12.7)* |
| Females | 8,986 | 7.0 (6.2, 7.8) | 3,644 | 5.7 (4.7, 6.7) | 8,139 | 8.2 (7.4, 9.1)* | 10,691 | 8.8 (8.0, 9.6)* |
| Atlantic Canada | 2,259 | 11.5 (9.9, 13.1) | 1,859 | 9.8 (8.4, 11.1) | 4,509 | 11.5 (10.3, 12.8) | 4,113 | 12.2 (10.9, 13.5) |
| Males | 1,002 | 15.0 (12.4, 17.5) | 824 | 11.5 (9.4, 13.6)* | 1,933 | 14.7 (12.6, 16.8) | 1,788 | 15.6 (13.3, 17.9) |
| Females | 1,257 | 8.4 (6.6, 10.3) | 1,035 | 8.3 (6.4, 10.2) | 2,576 | 8.8 (7.4, 10.3) | 2,325 | 9.2 (7.7, 10.7) |
| Québec | 3,582 | 6.3 (5.5, 7.0) | 907 | 5.7 (4.2, 7.3) | 1,762 | 7.6 (6.3, 8.8) | 2,641 | 7.7 (6.6, 8.8)* |
| Males | 1,613 | 8.5 (7.2, 9.9) | 419 | 6.6E (4.1, 9.0) | 779 | 8.9 (6.6, 11.1) | 1,156 | 8.5 (6.8, 10.2) |
| Females | 1,969 | 4.3 (3.5, 5.1) | 488 | 5.0E (3.2, 6.7) | 983 | 6.4 (4.9, 8.0)* | 1,485 | 6.9 (5.5, 8.3)* |
| Ontario | 4,890 | 8.2 (7.0, 9.4) | 1,357 | 5.8 (4.3, 7.3)* | 2,966 | 10.0 (8.6, 11.4) | 5,430 | 8.6 (7.7, 9.5) |
| Males | 2,098 | 8.7 (7.1, 10.3) | 591 | 6.8 (4.8, 8.8) | 1,265 | 13.7 (11.2, 16.2)* | 2,347 | 9.6 (8.2, 11.0) |
| Females | 2,792 | 7.7 (6.0, 9.4) | 766 | 4.9E (2.9, 7.0)* | 1,701 | 6.9 (5.4, 8.4) | 3,083 | 7.8 (6.5, 9.0) |
| Prairie Provinces | 3,064 | 8.8 (7.6, 10.0) | 1,715 | 7.2 (5.5, 8.9) | 3,413 | 11.7 (10.3, 13.1)* | 4,669 | 13.9 (12.3, 15.6)* |
| Males | 1,341 | 11.4 (9.2, 13.5) | 706 | 7.9 (5.6, 10.1)* | 1,428 | 13.4 (11.2, 15.5) | 2,040 | 17.5 (14.8, 20.3)* |
| Females | 1,723 | 6.5 (5.4, 7.6) | 1,009 | 6.6 (4.1, 9.1) | 1,985 | 10.2 (8.4, 12.0)* | 2,629 | 10.8 (8.9, 12.7)* |
| British Columbia | 2,258 | 10.4 (8.8, 11.9) | 627 | 7.4 (5.7, 9.1)* | 1,552 | 12.3 (10.2, 14.4) | 2,092 | 13.7 (11.7, 15.8)* |
| Males | 1,013 | 11.3 (9.1, 13.5) | 281 | 8.2 (5.4, 10.9) | 658 | 11.8 (9.1, 14.6) | 923 | 15.3 (11.8, 18.7) |
| Females | 1,245 | 9.5 (7.4, 11.7) | 346 | 6.7 (4.8, 8.6) | 894 | 12.7 (9.4, 16.0) | 1,169 | 12.4 (9.9, 14.8) |
Recreational screen time
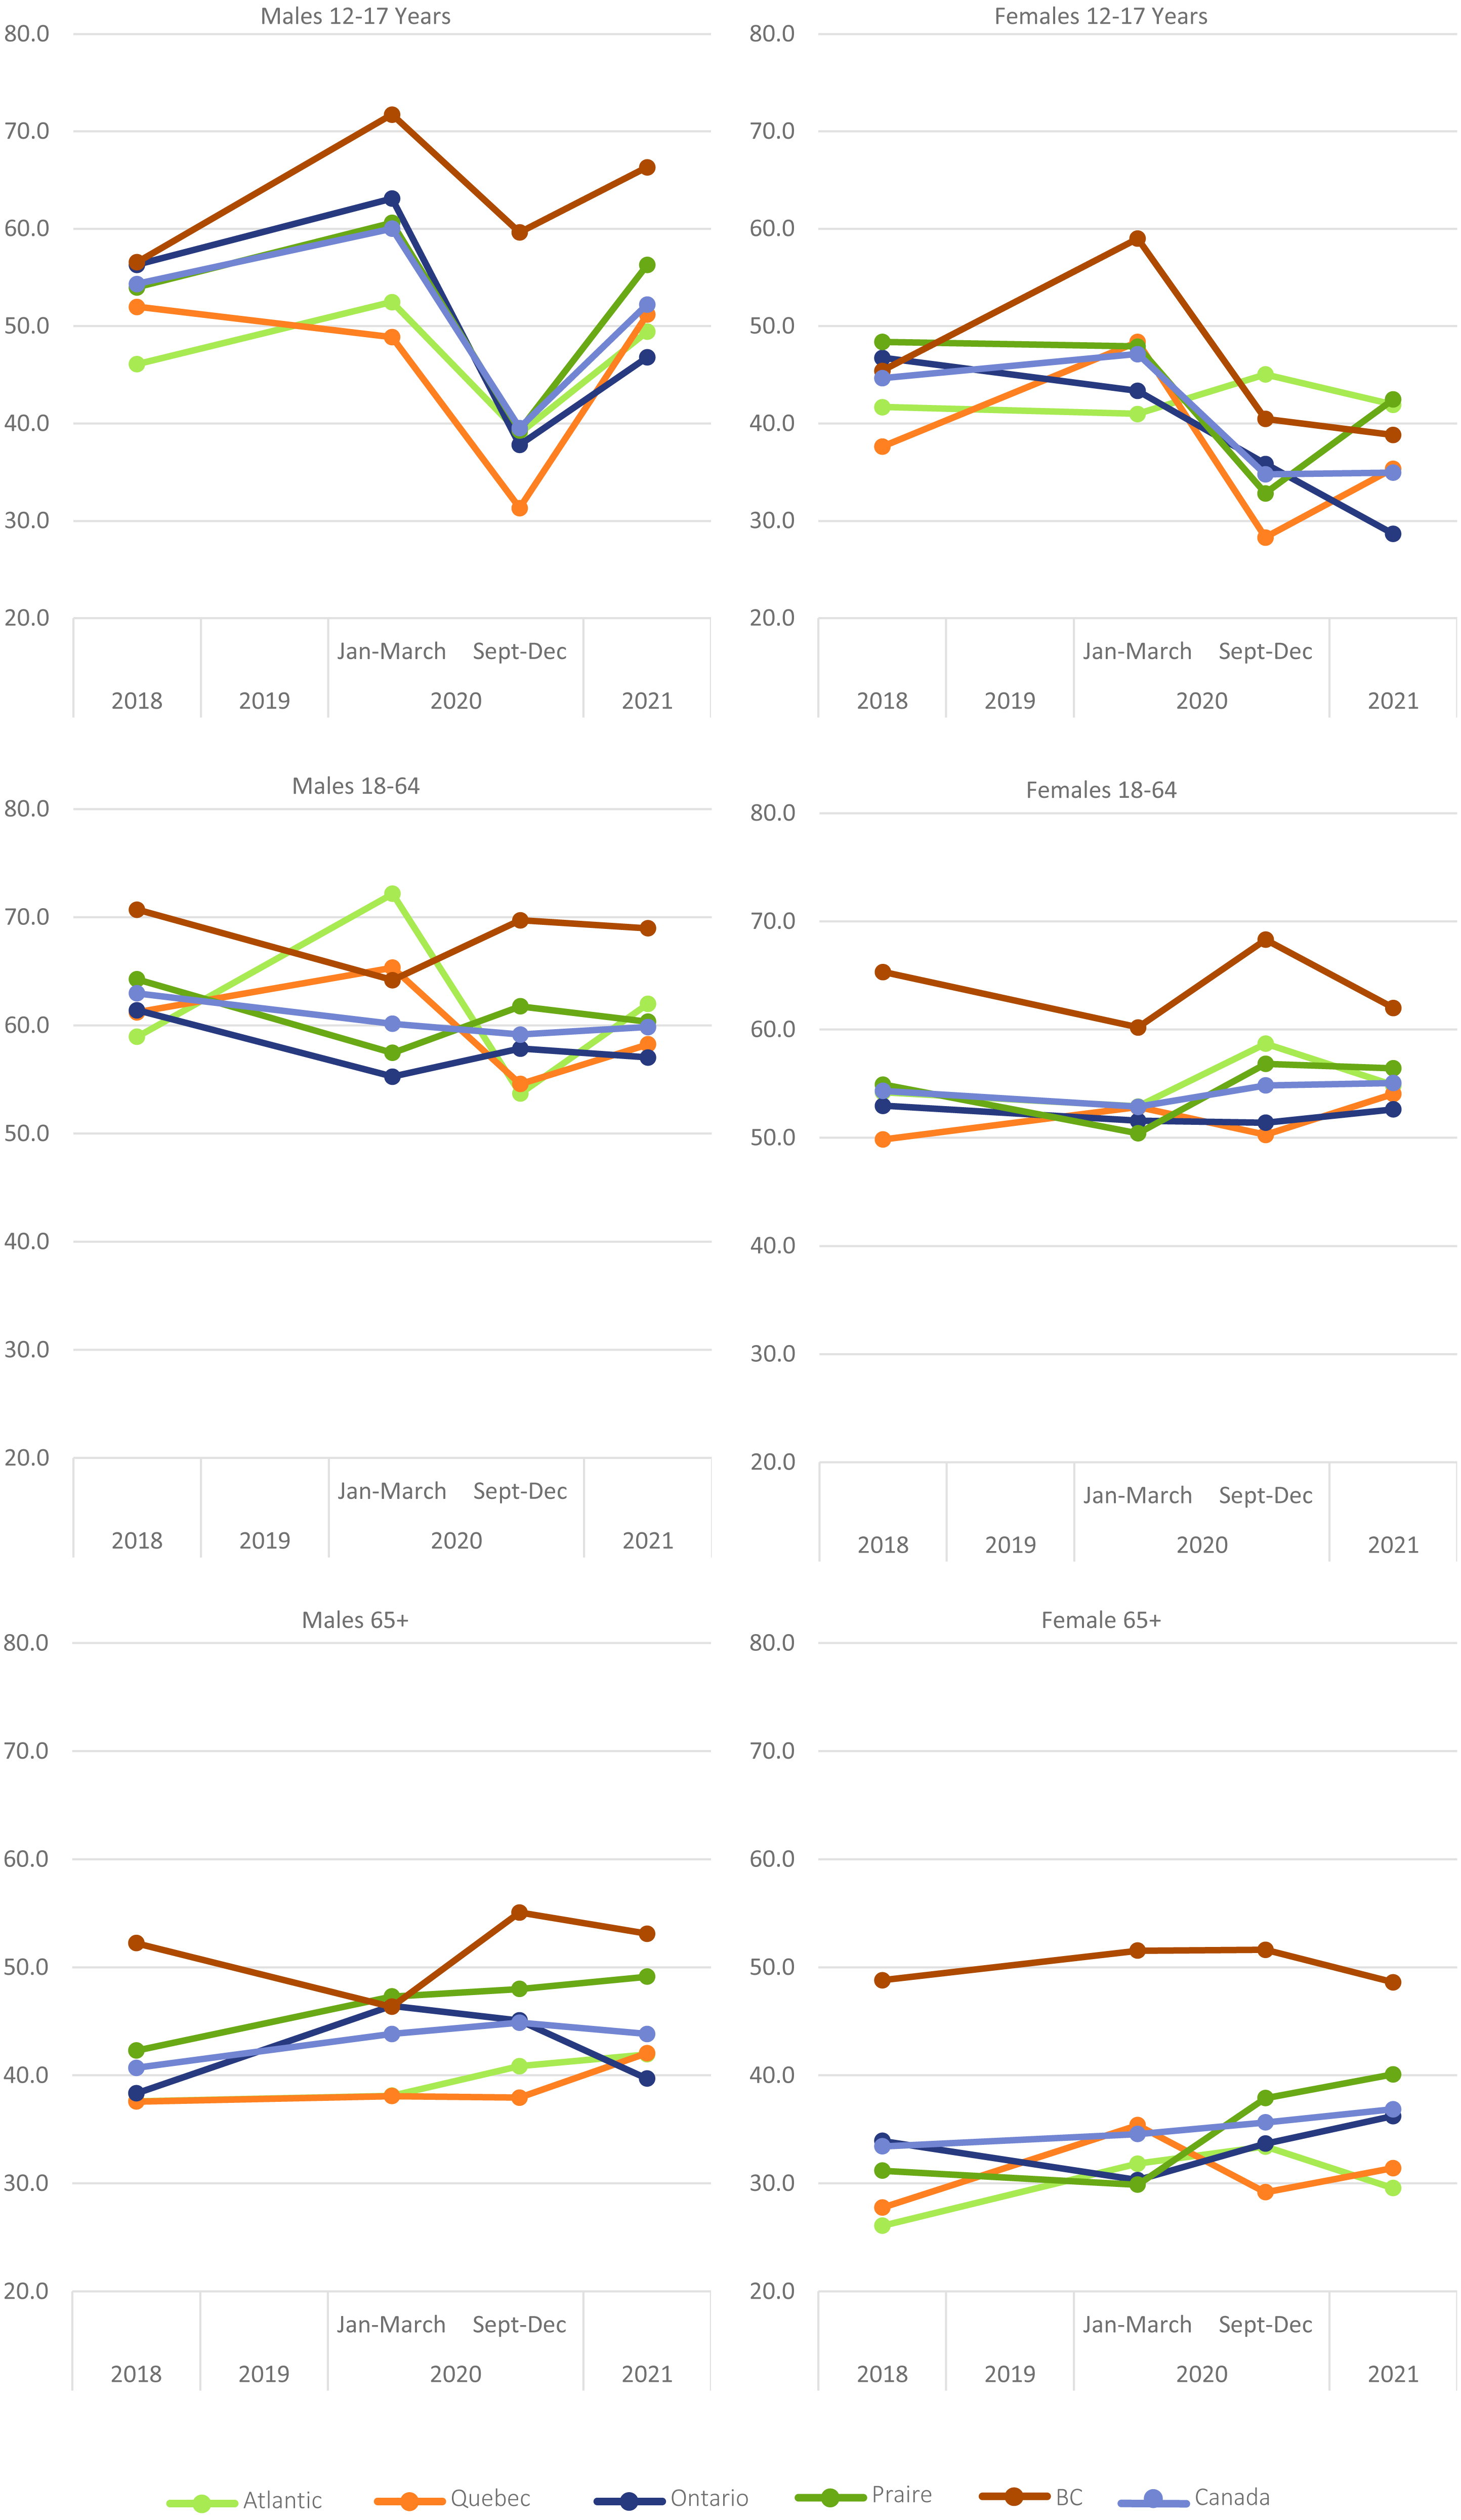
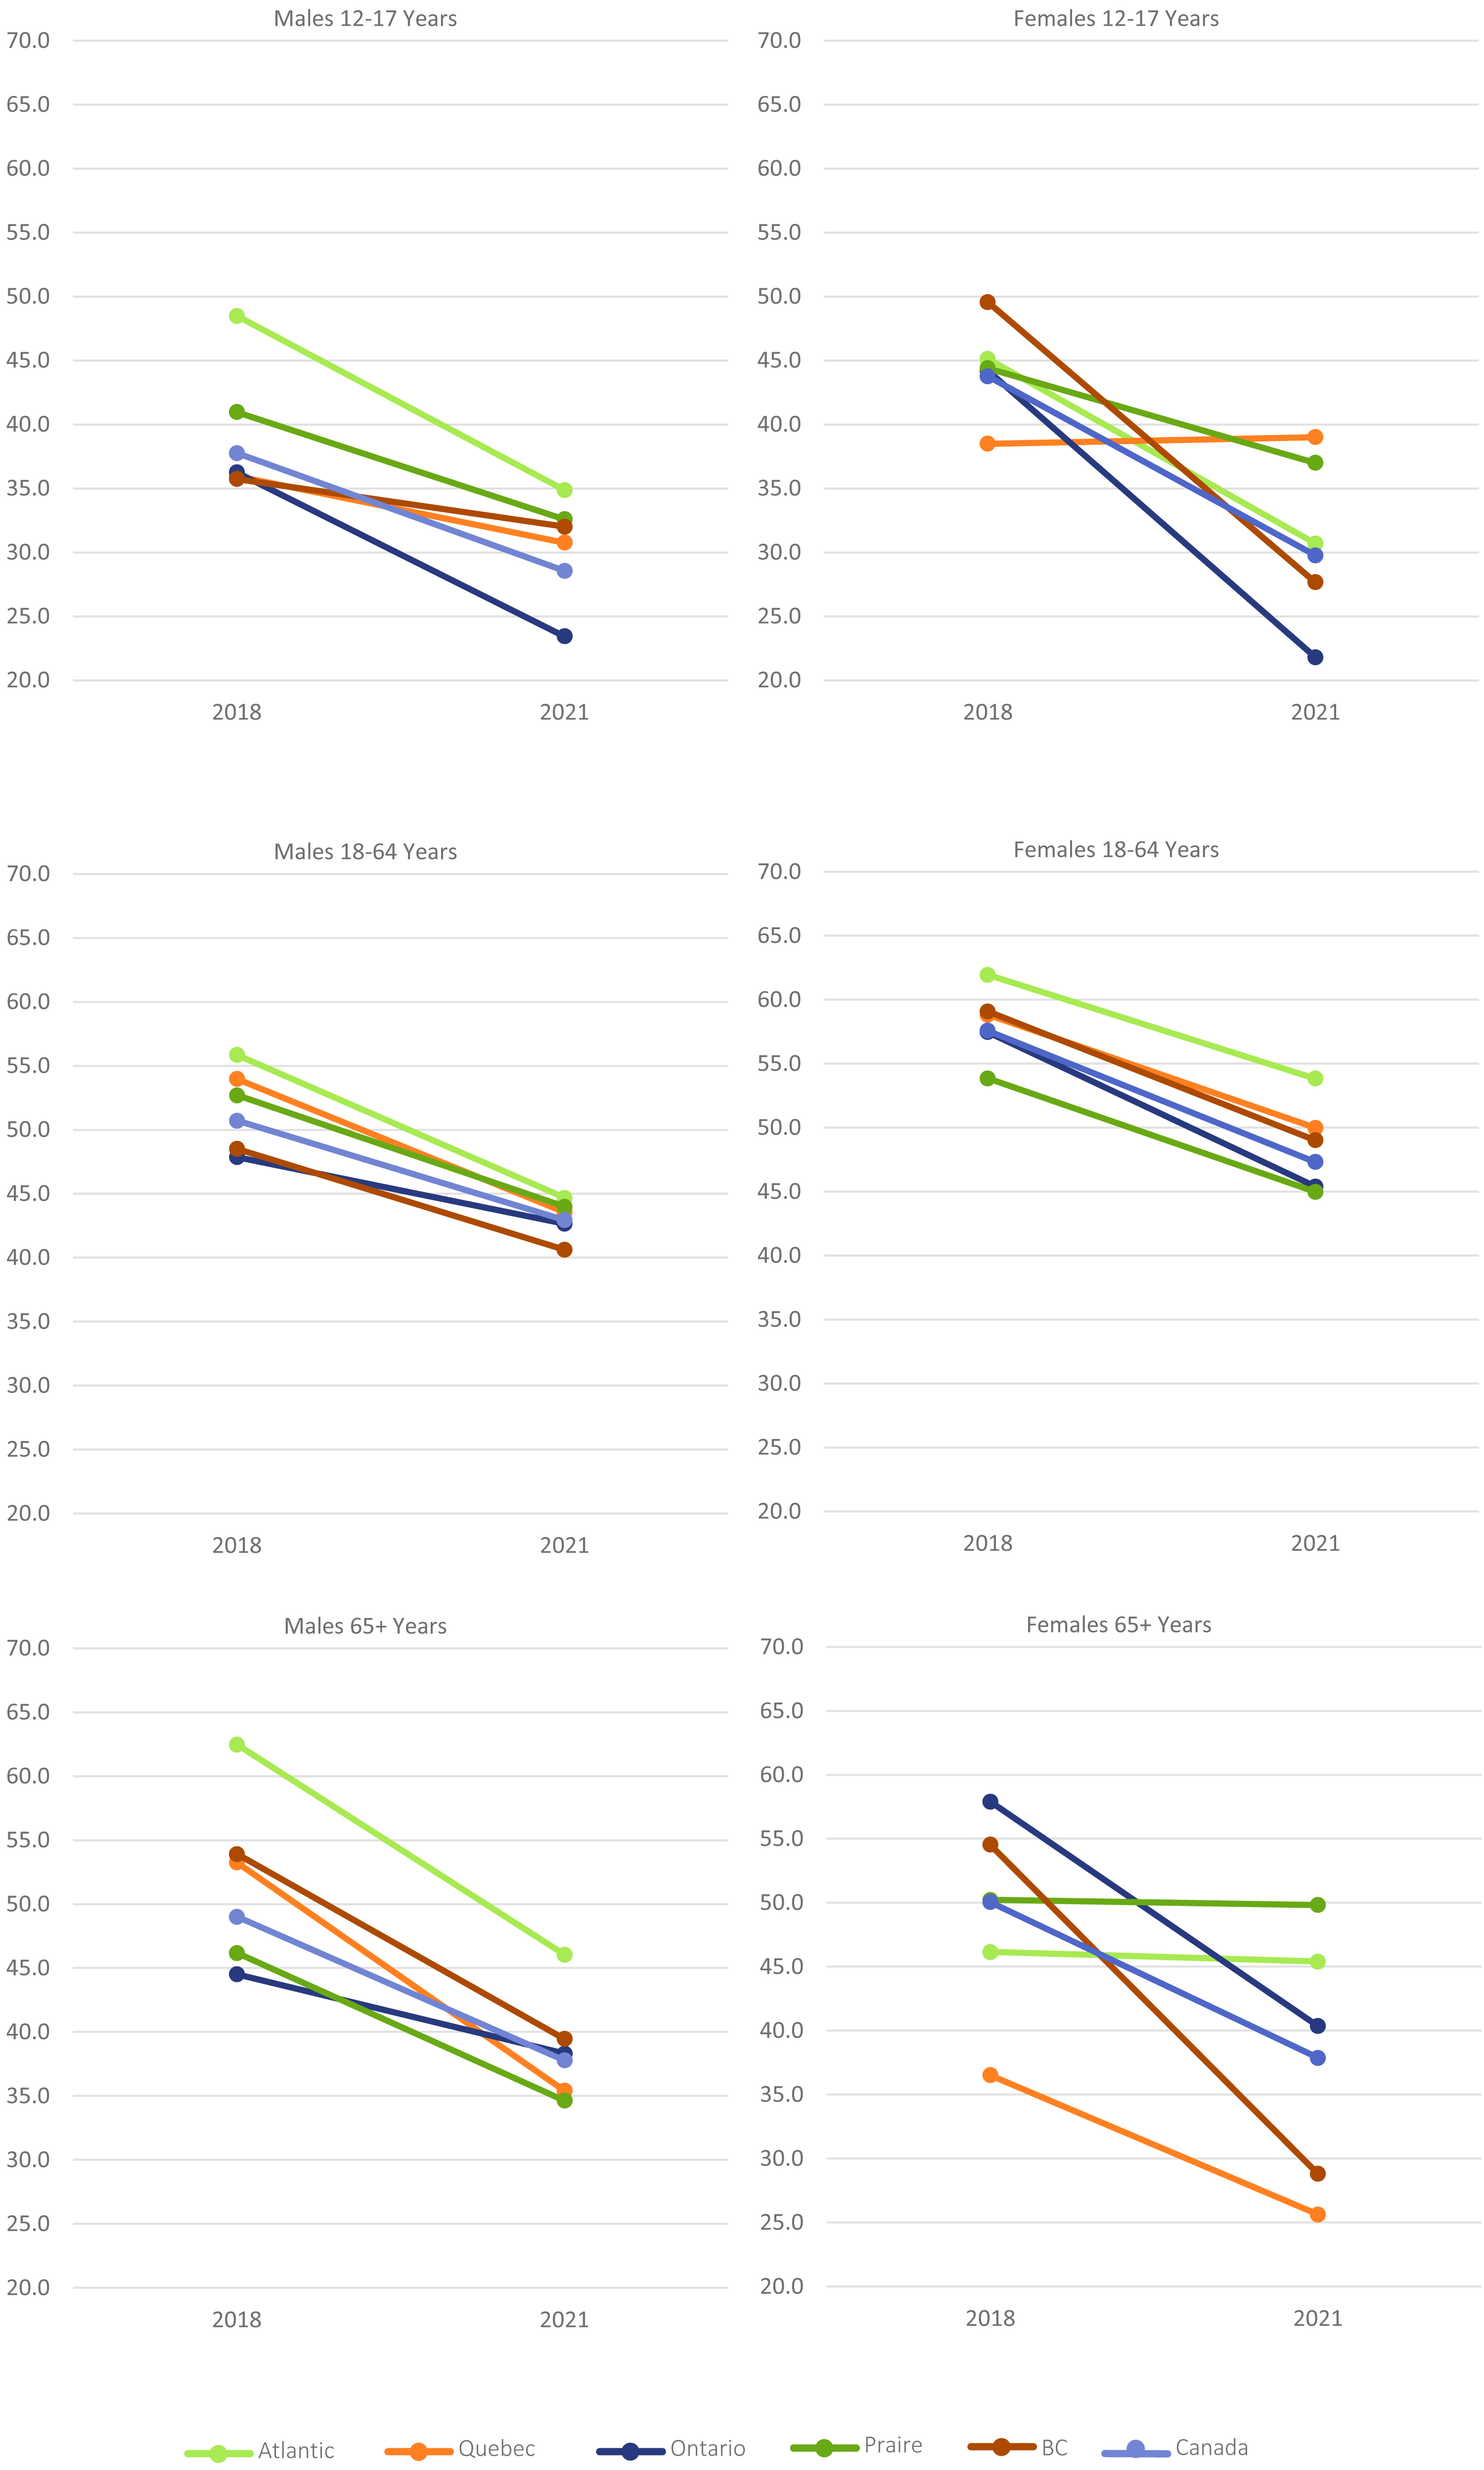
Compared to 2018, the proportion of youth accumulating ≤2 h per day of recreational screen time per day in 2021 decreased significantly at the national level for both genders on both school days and non-school days (all p < 0.05) (Table 8, Fig. 2). Females in BC, and both genders in Ontario and Atlantic Canada were significantly less likely to meet recommendations on week- or weekend-days, while females in the Prairie Provinces were less likely to meet recommendations on weekends only.
| Work/school days | Non-work/non-school days | |||||||
|---|---|---|---|---|---|---|---|---|
| 2018 | 2021 | 2018 | 2021 | |||||
| n | Estimate | n | Estimate | n | Estimate | n | Estimate | |
| 12–17 years | ||||||||
| Canada-wide | 3,952 | 40.7 (38.4, 43.0) | 3,501 | 29.1 (26.9, 31.5)* | 3,952 | 21.4 (19.7, 23.2) | 3,501 | 13.2 (11.6, 15.0)* |
| Males | 2,024 | 37.8 (34.7, 40.9) | 1,809 | 28.6 (25.4, 31.9)* | 2,024 | 20.1 (17.8, 22.6) | 1,809 | 14.0 (11.7, 16.8)* |
| Females | 1,928 | 43.8 (40.4, 47.2) | 1,692 | 29.8 (26.7, 33.1)* | 1,928 | 22.8 (20.3, 25.5) | 1,692 | 12.3 (10.2, 14.8)* |
| Atlantic Canada | 496 | 46.8 (41.3, 52.4) | 422 | 32.8 (26.9, 39.2)* | 496 | 22.6 (18.5, 27.2) | 422 | 12.3 (9.0, 16.4)* |
| Males | 258 | 48.5 (40.8, 56.2) | 217 | 34.9 (26.6, 44.2)* | 258 | 22.9 (17.2, 29.8) | 217 | 14.4 (9.7, 20.9)* |
| Females | 238 | 45.1 (37.4, 53.1) | 205 | 30.7 (22.9, 39.8)* | 238 | 22.2 (16.8, 28.8) | 205 | 9.9 (6.0, 15.8)* |
| Québec | 843 | 37.2 (32.7, 41.9) | 792 | 34.8 (30.2, 39.7) | 843 | 17.3 (14.6, 20.5) | 792 | 14.3 (11.3, 18.0) |
| Males | 417 | 36.0 (30.0, 42.4) | 393 | 30.8 (24.6, 37.7) | 417 | 15.6 (11.9, 20.2) | 393 | 13.7 (9.7, 19.0) |
| Females | 426 | 38.5 (32.2, 45.2) | 399 | 39.0 (32.1, 46.4) | 426 | 19.1 (15.1, 23.8) | 399 | 14.9 (10.7, 20.5) |
| Ontario | 1,185 | 40.2 (36.0, 44.6) | 1,003 | 22.6 (18.7, 27.1)* | 1,185 | 22.1 (18.9, 25.6) | 1,003 | 11.1 (8.3, 14.6)* |
| Males | 618 | 36.3 (30.5, 42.4) | 526 | 23.4 (17.8, 30.2)* | 618 | 21.5 (17.0, 26.7) | 526 | 13.1 (9.0, 18.6)* |
| Females | 567 | 44.2 (38.0, 50.6) | 477 | 21.8 (16.7, 27.9)* | 567 | 22.7 (18.3, 27.9) | 477 | 9.0 (5.7, 13.9)* |
| Prairie Provinces | 896 | 42.6 (38.4, 47.0) | 767 | 34.7 (29.9, 39.9)* | 896 | 24.3 (21.0, 28.0) | 767 | 17.1 (13.6, 21.2)* |
| Males | 458 | 41.0 (35.3, 46.9) | 391 | 32.6 (26.2, 39.7) | 458 | 22.9 (18.6, 28.0) | 391 | 16.5 (12.0, 22.3) |
| Females | 438 | 44.4 (38.0, 51.0) | 376 | 37.0 (30.0, 44.6) | 438 | 25.8 (20.9, 31.3) | 376 | 17.7 (13.1, 23.7)* |
| British Columbia | 532 | 42.5 (36.6, 48.6) | 517 | 29.8 (24.8, 35.3)* | 532 | 21.0 (16.8, 26.0) | 517 | 12.2 (9.4, 15.7)* |
| Males | 273 | 35.7 (28.2, 44.1) | 282 | 32.0 (24.9, 40.1) | 273 | 17.6 (12.4, 24.4) | 282 | 13.7 (9.6, 19.0) |
| Females | 259 | 49.6 (40.8, 58.3) | 235 | 27.7 (21.3, 35.1)* | 259 | 24.7 (18.4, 32.3) | 235 | 10.8 (7.4, 15.5)* |
| 18–64 years | ||||||||
| Canada-wide | 34,040 | 53.9 (52.9, 55.0) | 26,797 | 45.0 (43.9, 46.2)* | 34,040 | 37.8 (36.9, 38.7) | 26,797 | 28.0 (27.1, 29.0)* |
| Males | 15,898 | 50.7 (49.3, 52.1) | 12,199 | 42.9 (41.3, 44.6)* | 15,898 | 35.5 (34.2, 36.7) | 12,199 | 26.2 (24.9, 27.6)* |
| Females | 18,142 | 57.6 (56.2, 59.0) | 14,598 | 47.3 (45.7, 49.0)* | 18,142 | 40.1 (38.9, 41.4) | 14,598 | 29.8 (28.5, 31.2)* |
| Atlantic Canada | 4,122 | 58.8 (56.3, 61.3) | 5,346 | 49.1 (46.8, 51.4)* | 4,122 | 37.6 (35.7, 39.6) | 5,346 | 30.2 (28.4, 32.1)* |
| Males | 1,800 | 55.9 (52.3, 59.4) | 2,360 | 44.7 (41.3, 48.1)* | 1,800 | 36.2 (33.4, 39.0) | 2,360 | 28.4 (25.9, 31.1)* |
| Females | 2,322 | 62.0 (58.7, 65.1) | 2,986 | 53.8 (50.8, 56.9)* | 2,322 | 39.0 (36.2, 41.8) | 2,986 | 32.0 (29.6, 34.4)* |
| Québec | 7,595 | 56.3 (54.4, 58.2) | 3,914 | 46.6 (44.0, 49.1)* | 7,595 | 36.6 (34.9, 38.3) | 3,914 | 30.6 (28.5, 32.7)* |
| Males | 3,642 | 54.0 (51.2, 56.7) | 1,839 | 43.6 (39.8, 47.4)* | 3,642 | 35.8 (33.4, 38.3) | 1,839 | 29.2 (26.2, 32.4)* |
| Females | 3,953 | 58.8 (56.2, 61.4) | 2,075 | 50.0 (46.4, 53.5)* | 3,953 | 37.4 (35.1, 39.8) | 2,075 | 32.0 (29.2, 35.0)* |
| Ontario | 9,875 | 52.4 (50.4, 54.3) | 7,182 | 44.0 (42.0, 46.0)* | 9,875 | 38.5 (36.8, 40.1) | 7,182 | 27.0 (25.4, 28.7)* |
| Males | 4,548 | 47.9 (45.3, 50.5) | 3,216 | 42.7 (39.7, 45.6)* | 4,548 | 35.3 (33.0, 37.7) | 3,216 | 24.5 (22.1, 26.9)* |
| Females | 5,327 | 57.5 (54.8, 60.1) | 3,966 | 45.4 (42.5, 48.3)* | 5,327 | 41.5 (39.3, 43.7) | 3,966 | 29.6 (27.2, 32.0)* |
| Prairie Provinces | 7,742 | 53.2 (51.3, 55.1) | 7,731 | 44.5 (42.7, 46.3)* | 7,742 | 37.1 (35.4, 38.8) | 7,731 | 27.3 (25.8, 28.8)* |
| Males | 3,705 | 52.7 (49.9, 55.5) | 3,582 | 44.0 (41.4, 46.6)* | 3,705 | 36.3 (33.9, 38.7) | 3,582 | 25.8 (23.8, 28.0)* |
| Females | 4,037 | 53.9 (51.2, 56.5) | 4,149 | 45.0 (42.4, 47.6)* | 4,037 | 37.9 (35.5, 40.3) | 4,149 | 28.7 (26.7, 30.8)* |
| British Columbia | 4,706 | 53.4 (51.1, 55.8) | 2,624 | 44.6 (41.5, 47.7)* | 4,706 | 39.1 (36.9, 41.2) | 2,624 | 26.7 (24.5, 29.1)* |
| Males | 2,203 | 48.5 (45.2, 51.9) | 1,202 | 40.6 (36.5, 44.9)* | 2,203 | 33.7 (30.7, 36.8) | 1,202 | 25.7 (22.5, 29.3)* |
| Females | 2,503 | 59.1(55.6, 62.5) | 1,422 | 49.0 (44.8, 53.3)* | 2,503 | 44.4 (41.5, 47.3) | 1,422 | 27.7 (24.6, 31.0)* |
| 65+ years | ||||||||
| Canada-wide | 16,053 | 49.4 (45.9, 52.9) | 18,945 | 37.8 (34.5, 41.2)* | 16,053 | 29.4 (28.2, 30.6) | 18,945 | 21.5 (20.5, 22.6)* |
| Males | 7,067 | 49.0 (44.5, 53.6) | 8,254 | 37.8 (33.5, 42.2)* | 7,067 | 27.3 (25.7, 29.0) | 8,254 | 21.1 (19.6, 22.7)* |
| Females | 8,986 | 50.1 (44.2, 55.9) | 10,691 | 37.9 (33.1, 42.9)* | 8,986 | 31.2 (29.6, 32.9) | 10,691 | 21.9 (20.5, 23.4)* |
| Atlantic Canada | 2,259 | 56.0 (48.2, 63.5) | 4,113 | 45.8 (39.3, 52.5)* | 2,259 | 32.2 (29.7, 34.9) | 4,113 | 27.5 (25.5, 29.5)* |
| Males | 1,002 | 62.5 (51.5, 72.3) | 1,788 | 46.0 (37.8, 54.5)* | 1,002 | 32.9 (29.2, 36.9) | 1,788 | 25.8 (22.9, 28.9)* |
| Females | 1,257 | 46.1 (35.1, 57.6) | 2,325 | 45.4 (36.2, 55.0) | 1,257 | 31.6 (28.5, 34.9) | 2,325 | 29.0 (26.3, 31.8) |
| Québec | 3,582 | 45.6 (38.4, 53.1) | 2,641 | 31.7 (24.9, 39.3)* | 3,582 | 26.2 (24.2, 28.4) | 2,641 | 19.6 (17.6, 21.7)* |
| Males | 1,613 | 53.3 (43.8, 62.5) | 1,156 | 35.4 (26.3, 45.8)* | 1,613 | 25.4 (22.4, 28.7) | 1,156 | 20.6 (17.8, 23.8)* |
| Females | 1,969 | 36.5 (26.1, 48.4) | 1,485 | 25.6 (17.3, 36.3) | 1,969 | 27.0 (24.2, 30.0) | 1,485 | 18.6 (15.9, 21.6)* |
| Ontario | 4,890 | 49.6 (43.2, 56.1) | 5,430 | 39.3 (33.6, 45.2)* | 4,890 | 28.4 (26.2, 30.7) | 5,430 | 21.3 (19.4, 23.3)* |
| Males | 2,098 | 44.5 (36.4, 52.9) | 2,347 | 38.3 (30.7, 46.5) | 2,098 | 25.4 (22.4, 28.7) | 2,347 | 21.6 (18.8, 24.8) |
| Females | 2,792 | 57.9 (47.0, 68.1) | 3,083 | 40.4 (32.3, 49.0)* | 2,792 | 31.0 (27.7, 34.4) | 3,083 | 20.9 (18.5, 23.6)* |
| Prairie Provinces | 3,064 | 47.6 (41.8, 53.4) | 4,669 | 40.7 (34.3, 47.5)* | 3,064 | 30.3 (27.7, 33.0) | 4,669 | 23.7 (21.5, 26.1)* |
| Males | 1,341 | 46.2 (38.5, 54.1) | 2,040 | 34.6 (27.8, 42.2)* | 1,341 | 27.8 (24.0, 32.1) | 2,040 | 20.7 (17.9, 23.8)* |
| Females | 1,723 | 50.2 (41.2, 59.2) | 2,629 | 49.8 (39.0, 60.7) | 1,723 | 32.5 (29.2, 36.0) | 2,629 | 26.4 (23.2, 29.8)* |
| British Columbia | 2,258 | 54.2 (46.3, 61.8) | 2,092 | 34.7 (27.2, 43.1)* | 2,258 | 35.3 (32.4, 38.2) | 2,092 | 20.2 (17.8, 22.9)* |
| Males | 1,013 | 53.9 (43.5, 64.0) | 923 | 39.5 (28.9, 51.1) | 1,013 | 32.0 (27.9, 36.5) | 923 | 18.6 (15.1, 22.6)* |
| Females | 1,245 | 54.5 (43.1, 65.6) | 1,169 | 28.8 (19.6, 40.2)* | 1,245 | 38.2 (34.4, 42.1) | 1,169 | 21.7 (18.4, 25.3)* |
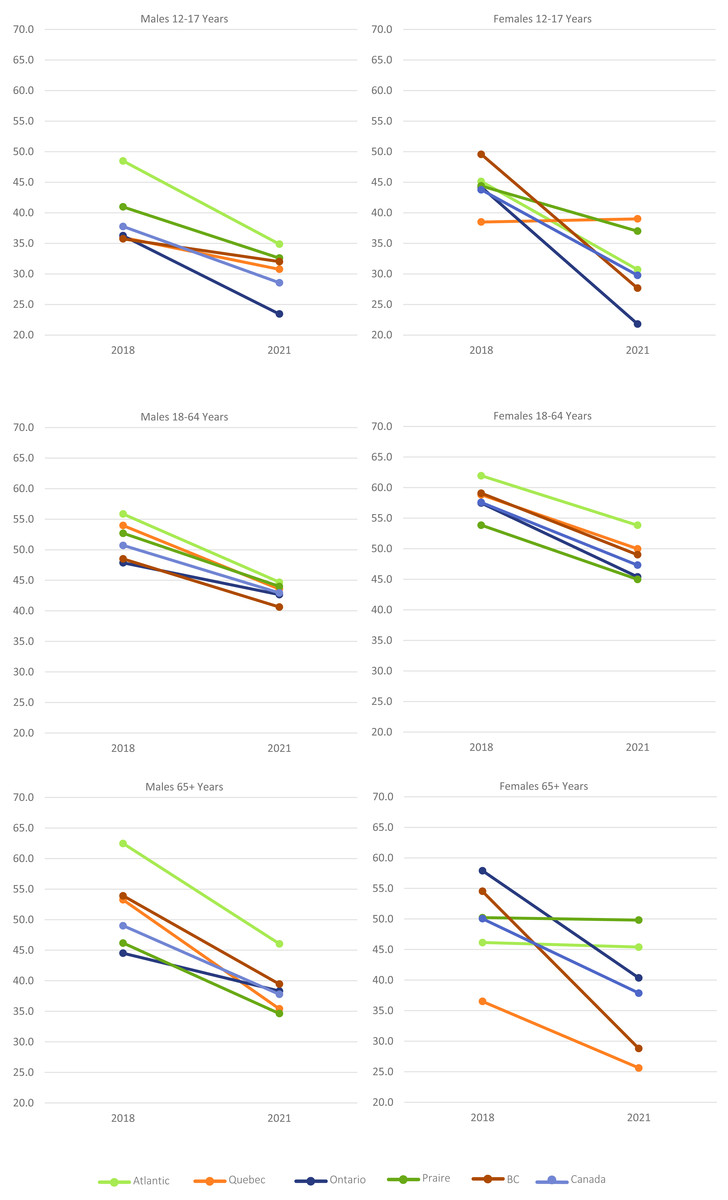
Figure 2: Proportion of Canadians accumulating ≤ 2 h per day of recreational screen use on work/school days across ages and regions.
Among adults aged 18–64 years, the proportion of individuals accumulating ≤2 hours/day of recreational screen use on workdays and non-workdays decreased for all groups (all p < 0.05). Among adults 65+ years, work-day decreases were seen among males in Atlantic Canada, Québec, the Prairies, and among females in Ontario and BC. On non-workdays, decreases were seen among all groups except females in Atlantic Canada and males in Ontario. (all p < 0.05).
Discussion
The purpose of this article was to describe age- and gender-specific regional trends in MVPA and screen time for Canadians aged 12+ years from 2018 to 2021. Our results suggest substantial regional and age-related variations in how MVPA levels were impacted by the COVID-19 pandemic across Canada. For recreational screen time, although the magnitude of changes varied across regions, a significant reduction in the proportion of individuals accumulating ≤2 h per day was seen in the majority of regions and age groups. The present study extends the previous reports of Colley & Watt (2022) and Colley and Saunders (Colley & Saunders, 2023a; Colley & Saunders, 2023b), all of which examined changes in MVPA and recreational screen time at the national level only.
When comparing all forms of MVPA, several trends become apparent. Among youth, Atlantic Canada and BC did not see a reduction in overall MVPA or active transportation levels in the fall of 2020 or 2021. Atlantic Canada was the only region which did not see a reduction in school-related MVPA in either 2020 or 2021, while BC was the only region which did not see a change in recreational MVPA levels when both genders were combined. There are a variety of potential explanations for the resilience of MVPA levels on the East and West coasts, including policy approaches (e.g., the “Atlantic Bubble” which limited the spread of COVID-19 early in the pandemic and allowed for less restrictions Patil, 2020; Bignami, 2021) and a relatively warm climate in BC which may make active transportation more feasible than other provinces. As noted earlier, Atlantic Canada and BC also experienced relatively lower levels of community transmission when compared to other parts of the country, which allowed for a greater level of “normalcy” in Atlantic Canada in particular, when compared to Québec, Ontario, and the Prairies in 2020. Limiting initial community spread in future pandemics may be one of the best ways to avoid disruptions to activity levels for residents within any given region.
Another trend identified in the data was that Ontario, Canada’s largest province, stood out as following a trend consistently worse than other regions. Ontario was the only province where the proportion of youth meeting MVPA recommendations and the amount of daily recreational MVPA remained depressed in the fall of 2021, when compared to 2018. Ontario was also one of two regions which did not observe an increase in adults aged 65+ years meeting the MVPA recommendation in 2021. As noted above, these trends may have been due to a number of factors, including rates of community transmission, the number and duration of restrictions, and the clarity of public health messaging. In particular, the low recreational MVPA, school-related MVPA and active transportation observed in Ontario among youth in 2021 may be partially due to relatively higher level of stringency of restrictions in Ontario at this time, when compared to other regions (Cameron-Blake et al., 2021). These restrictions included closing schools and both indoor and outdoor recreational facilities in April of 2021 (Canadian Institute for Health Information, 2023), greatly limiting opportunities for activity among youth. Future research should further investigate the relationship between specific policy approaches in each region and movement behaviours, to identify which decisions may have helped to support MVPA in Atlantic Canada and BC in 2020 and 2021.
The trajectory of MVPA from 2018 to 2021 differed markedly across age groups. While the proportion of youth meeting the MVPA recommendation decreased by 12 percentage points in the fall of 2020 and by 6 percentage points in 2021, it was relatively stable throughout the pandemic among adults aged 18–64 years and increased by 3 percentage points in the fall of 2021 among adults aged 65+ years. This is a remarkable difference that highlights the importance of considering the way that public health policies may have inequitable impacts on different age groups in future pandemics. Although there were clear differences in the trajectories of males and females at the national level, these were not as apparent at the regional level. Nationally, activity levels of female youth remained depressed in 2021, when compared to 2018, which was not observed in males of the same age. However, males and females in this age group followed similar trajectories in every individual region for both overall and recreational MVPA. This may be due to lack of sample size at the regional level, when compared to the national sample. It is also worth highlighting that while there were few obvious gender-related differences in the trajectories themselves, there remain clear differences in the total amount of MVPA and sedentary behaviour accumulated by males and females, respectively.
Although MVPA was more resilient in some regions and age groups than others, with very limited exceptions the sustained increases in recreational screen time were seen in all regions and age groups. This is concerning, given the links between high levels of recreational screen time and both physical and mental health (Carson et al., 2016; Ekelund et al., 2016; Saunders et al., 2020). These findings highlight the need for policy approaches to help limit the impacts of recreational screen time, as well as research to investigate the intended and unintended consequences of any such policies.
Strengths and limitations
The current study has several strengths and limitations. The CCHS is a large annual health survey, representative at national and sub-national levels, which has used consistent questions to ascertain MVPA and sedentary behaviour for Canadians aged 12+ years since 2015. To our knowledge this is the first such study to examine trajectories of MVPA and screen time across regions of Canada before and after the onset of the COVID-19 pandemic. This study was limited by its reliance on self-reported MVPA and recreational screen time, both of which have are known to have potential sources of error and bias (Prince et al., 2008; Prince et al., 2020; Adamo et al., 2009). Due to sample size constraints at the regional level, we were not able to examine whether our findings differed across sociodemographic groups, different cultural groups, or levels of physical ability. The questionnaires used in this study did not ask about the types or timing of recreational screen time, both of which may influence the health impacts of screen use (Saunders et al., 2022a). Further, the psychometric properties of the questions used to assess MVPA and screen time in the CCHS have not been evaluated. Finally, we did not assess school- or work-related screen time, which likely increased during the pandemic as many schools and offices transitioned to schooling and working from home and may have different impacts on health and well-being (Kuzik et al., 2022; Saunders et al., 2022b).
Conclusions
Our findings suggest that the MVPA levels of Canadian youth dropped significantly after the onset of the pandemic, and these changes varied greatly across regions. Although some regional variation remained, activity levels of adults aged 18–64 were relatively stable in the fall of 2020 and 2021 and increased for adults aged 65+ years. Recreational screen use increased across all regions and age groups with very limited exceptions. These results highlight the differences and similarities in activity and screen time trajectories across the Canadian population and suggest the need for additional research to identify best practices for promoting healthy movement behaviours during future pandemics.