
Six-minute rowing test: a valid and reliable method for assessing power output in amateur male rowers
- Published
- Accepted
- Received
- Academic Editor
- Amador García-Ramos
- Subject Areas
- Kinesiology, Sports Medicine
- Keywords
- Rowing, Amateur rowers, Power output, Validity, Reliability
- Copyright
- © 2022 Huerta Ojeda et al.
- Licence
- This is an open access article distributed under the terms of the Creative Commons Attribution License, which permits unrestricted use, distribution, reproduction and adaptation in any medium and for any purpose provided that it is properly attributed. For attribution, the original author(s), title, publication source (PeerJ) and either DOI or URL of the article must be cited.
- Cite this article
- 2022. Six-minute rowing test: a valid and reliable method for assessing power output in amateur male rowers. PeerJ 10:e14060 https://doi.org/10.7717/peerj.14060
Abstract
Background
Standardized tests are currently available to assess power output in elite rowers. However, there are no valid and reliable tests to assess power output in amateur rowers.
Objective
This study aimed to determine the validity and reliability of a 6-min rowing ergometer test (6-minRT) as a predictor of power output (PO) in amateur male rowers.
Methods
Twelve male amateur rowers were part of the study. All participants were instructed to perform an incremental test (IT), a 6-minRT test, and a retest. The validity of the 6-minRT was determined by comparing maximum oxygen uptake (VO2max) and power output (PO) between the IT and 6-minRT. Reliability included the coefficient of variation (CV), intra-class correlation coefficient (ICC), and mean standard error between the 6-minRT test and retest. The significance level was p < 0.05.
Results
There was no significant difference in VO2max in both IT and 6-minRT (p = 0.18), while the mean power output (Pmean) generated in the 6-minRT equaled 91.96% of the maximal aerobic power (MAP) generated in the IT (p = 0.004). Reliability analysis for the 6-minRT showed a CV = 0.50% and ICC = 0.97 for distance, a CV = 1.85% and ICC = 0.96 for Pmean.
Conclusion
From a ventilatory and mechanical point of view, the 6-minRT is a maximally valid test for establishing MAP in amateur rowers. Also, the 6-minRT evidences a high degree of agreement between days. Therefore, the 6-minRT is a valid and reliable test for assessing PO in amateur male rowers.
Introduction
Several factors determine optimal performance in competitive rowing (Huntsman, Drury & Miller, 2011; Muniesa & Díaz, 2010; Rich, Pottratz & Leaf, 2020). Among them were high fitness and technical development (Huntsman, Drury & Miller, 2011), good boat stabilization (Muniesa & Díaz, 2010), and correct synchronization between all the boat members (Rich, Pottratz & Leaf, 2020). Furthermore, as measured on water, the performance depends on external factors, including environmental conditions (Ingham et al., 2002). Also, considering that in competitive rowing, the contribution of aerobic metabolism ranges between 70–88% and the contribution of anaerobic metabolism fluctuates between 12–30% (Hagerman et al., 1978; Pripstein et al., 1999; Secher, 1993), most research has focused on the aerobic component, mainly maximum oxygen uptake (VO2max) (Das et al., 2019; Klusiewicz et al., 2016). For example, elite rowers can exceed 6 LO2·min−1 in a maximum intensity test (Hagerman et al., 1978). Similarly, it has been observed that elite rowers reach VO2max between 330–360 s (Secher, 1993). Indeed, this high aerobic level and other conditioning components allow elite rowers to go under 360 s in an individual test—the 2,000 m time trial (2,000mTT) performance (Silva, 2016).
Currently, the most widely used physical test to determine sports performance in rowers is the 2,000mTT (Silva, 2016; Turnes et al., 2020). The reason for using the 2,000mTT is that the advent of rowing ergometers has facilitated training and provided a controllable and repeatable tool to assess rowing performance (Ingham et al., 2002). Moreover, the usefulness of 2,000mTT as an assessment of rowing performance increases if the gas analysis has been used (gold standard) (Wagner, 1996). In parallel, another variable that conditions rowing performance is the power output (PO) (Bourdin et al., 2017; Bourdin, Messonnier & Lacour, 2004). The PO on the rowing ergometer is the result between the stroke rate and the force exerted by the rower in each stroke. Indeed, maximal power output (Pmax) presents the advantage of being obtained with a simple ergometer test without biological measurements (Bourdin et al., 2017). Likewise, the most commonly used test to determine PO in rowers is the 2,000mTT (Silva, 2016; Turnes et al., 2020). In this test, PO corresponding to VO2max (PO at VO2max) has been evaluated over 400 watts (W) in elite rowers, surpassing 450 W in heavyweight rowers (Bourdin, Messonnier & Lacour, 2004).
Both PO and VO2max have shown a high correlation in the 2,000mTT in high-level rowers (r2 = 0.88, p < 0.01) (Turnes et al., 2020). However, this correlation decreases when the rowers lever is lower (VO2max vs 2,000mTT: r = −0.55, p < 0.012; PO vs 2,000mTT: r = −0.63, p < 0.004) (Kendall et al., 2011). In this sense, Klusiewicz et al. (2016) showed a high total error rate when the athletes’ capacity was lower. Likewise, those rowers who take around 360 s to complete the 2,000mTT (Bourdin, Messonnier & Lacour, 2004) can perform this test at a mean power output (Pmean) higher and closer to VO2max during the entire test. On the other hand, those who take more than 420 s to complete the 2,000mTT must perform this test at submaximal intensities, which is reflected in lower Pmean values (Turnes et al., 2020; Bourdin et al., 2017; Huerta Ojeda et al., 2022). Indeed, in a recent study developed by our research group, it was evidenced that during the 2,000mTT, amateur rowers reach a Pmean of 276.2 ± 23.9 W and 269.5 ± 31.3 W at VO2max. These values correspond to 80.5% and 82.6% of the maximal aerobic power (MAP) evaluated in that Incremental Test (IT), respectively (Huerta Ojeda et al., 2022). If the training loads of amateur rowers are based on the Pmean obtained in the 2,000mTT (without gas analysis) (Wagner, 1996), this 20 percentage point difference between the IT and the 2,000mTT could lead to inaccuracies. In the latter case, amateur rowers should explore a test that allows evaluating, in the field, a close Pmean to VO2max, without the presence of fatigue in the last part of the test (6-min rowing test (6-minRT)) (Huerta Ojeda et al., 2022).
As evident, ventilatory and mechanical parameters play a predominant role in rowers of all categories (Hagerman et al., 1978; Wagner, 1996). Likewise, it was proven that the 2,000mTT is an accurate test to determine PO in elite rowers, demonstrating a high concordance with VO2max (Turnes et al., 2020). However, the lower fitness level of amateur rowers causes a low concordance between the 2,000mTT with VO2max, Pmax, and Pmean, generating low reliability for this category (Huerta Ojeda et al., 2022). Added to the above, due to the high cost of laboratory tests (gas analysis) (Wagner, 1996), most of the training performed by amateur athletes is based on the results of indirect field tests (Metaxas et al., 2005). Despite this evidence, and considering that amateur rowers must complete the 2,000mTT at submaximal intensities—a farther away Pmean from VO2max than elite rowers—this test is still used to evaluate this category, generating impressions in quantifying training loads (Turnes et al., 2020; Bourdin et al., 2017; Huerta Ojeda et al., 2022). Therefore, amateur rowers lack a valid and reliable test, following this category’s aptitude and technical development, for determining PO on the field. Consequently, the main objective of this study was to determine the validity and reliability of the 6-minRT as a predictor of MAP in amateur male rowers.
Materials and Methods
Participants
Twelve male amateur rowers from the Naval Academy “Arturo Prat” participated voluntarily in this study. The main inclusion criterion was the VO2max assessed in the initial test (IT). This initial evaluation made verifying the fitness level of the male amateur rowers possible. In this regard, all participants in the study presented a VO2max ≤ 65 mLO2·kg−1·min−1. Also, it was found that the rowers trained less than 6 h per week. All these antecedents allowed defining the participants as amateur rowers. In contrast, those who could not perform the IT and the 6-minRT correctly were eliminated during the study. Statistical software (G*Power, v3.1.9.7; Heinrich-Heine-Universität, Düsseldorf, Germany) was used to calculate the sample (Faul, 2020). The combination of tests used in the statistical software to calculate the sample size was as follows: (a) t-test, (b) Linear bivariate regression: One group, size of the slope, and (c) A priori: Compute required size – given α, power, and effect size. Tests considered two tails, slope H1 = 0.67, α-error < 0.05 and a desired power (1-β error) = 0.8, slope H0 = 0.00, standard deviation (SD) σ_x = 0, and SD σ_y = 0, the total sample size was 12 participants. All participants were informed of the study’s objective and the possible risks of the experiment. Before applying the protocols, all amateur rowers signed the informed consent form in person. The study and the informed consent were approved by the Scientific Ethical Committee of the Universidad Mayor, Santiago, Chile (registration number: 197_2020) and developed under the ethical standards for exercise and sports sciences (Harriss, Macsween & Atkinson, 2019).
Design
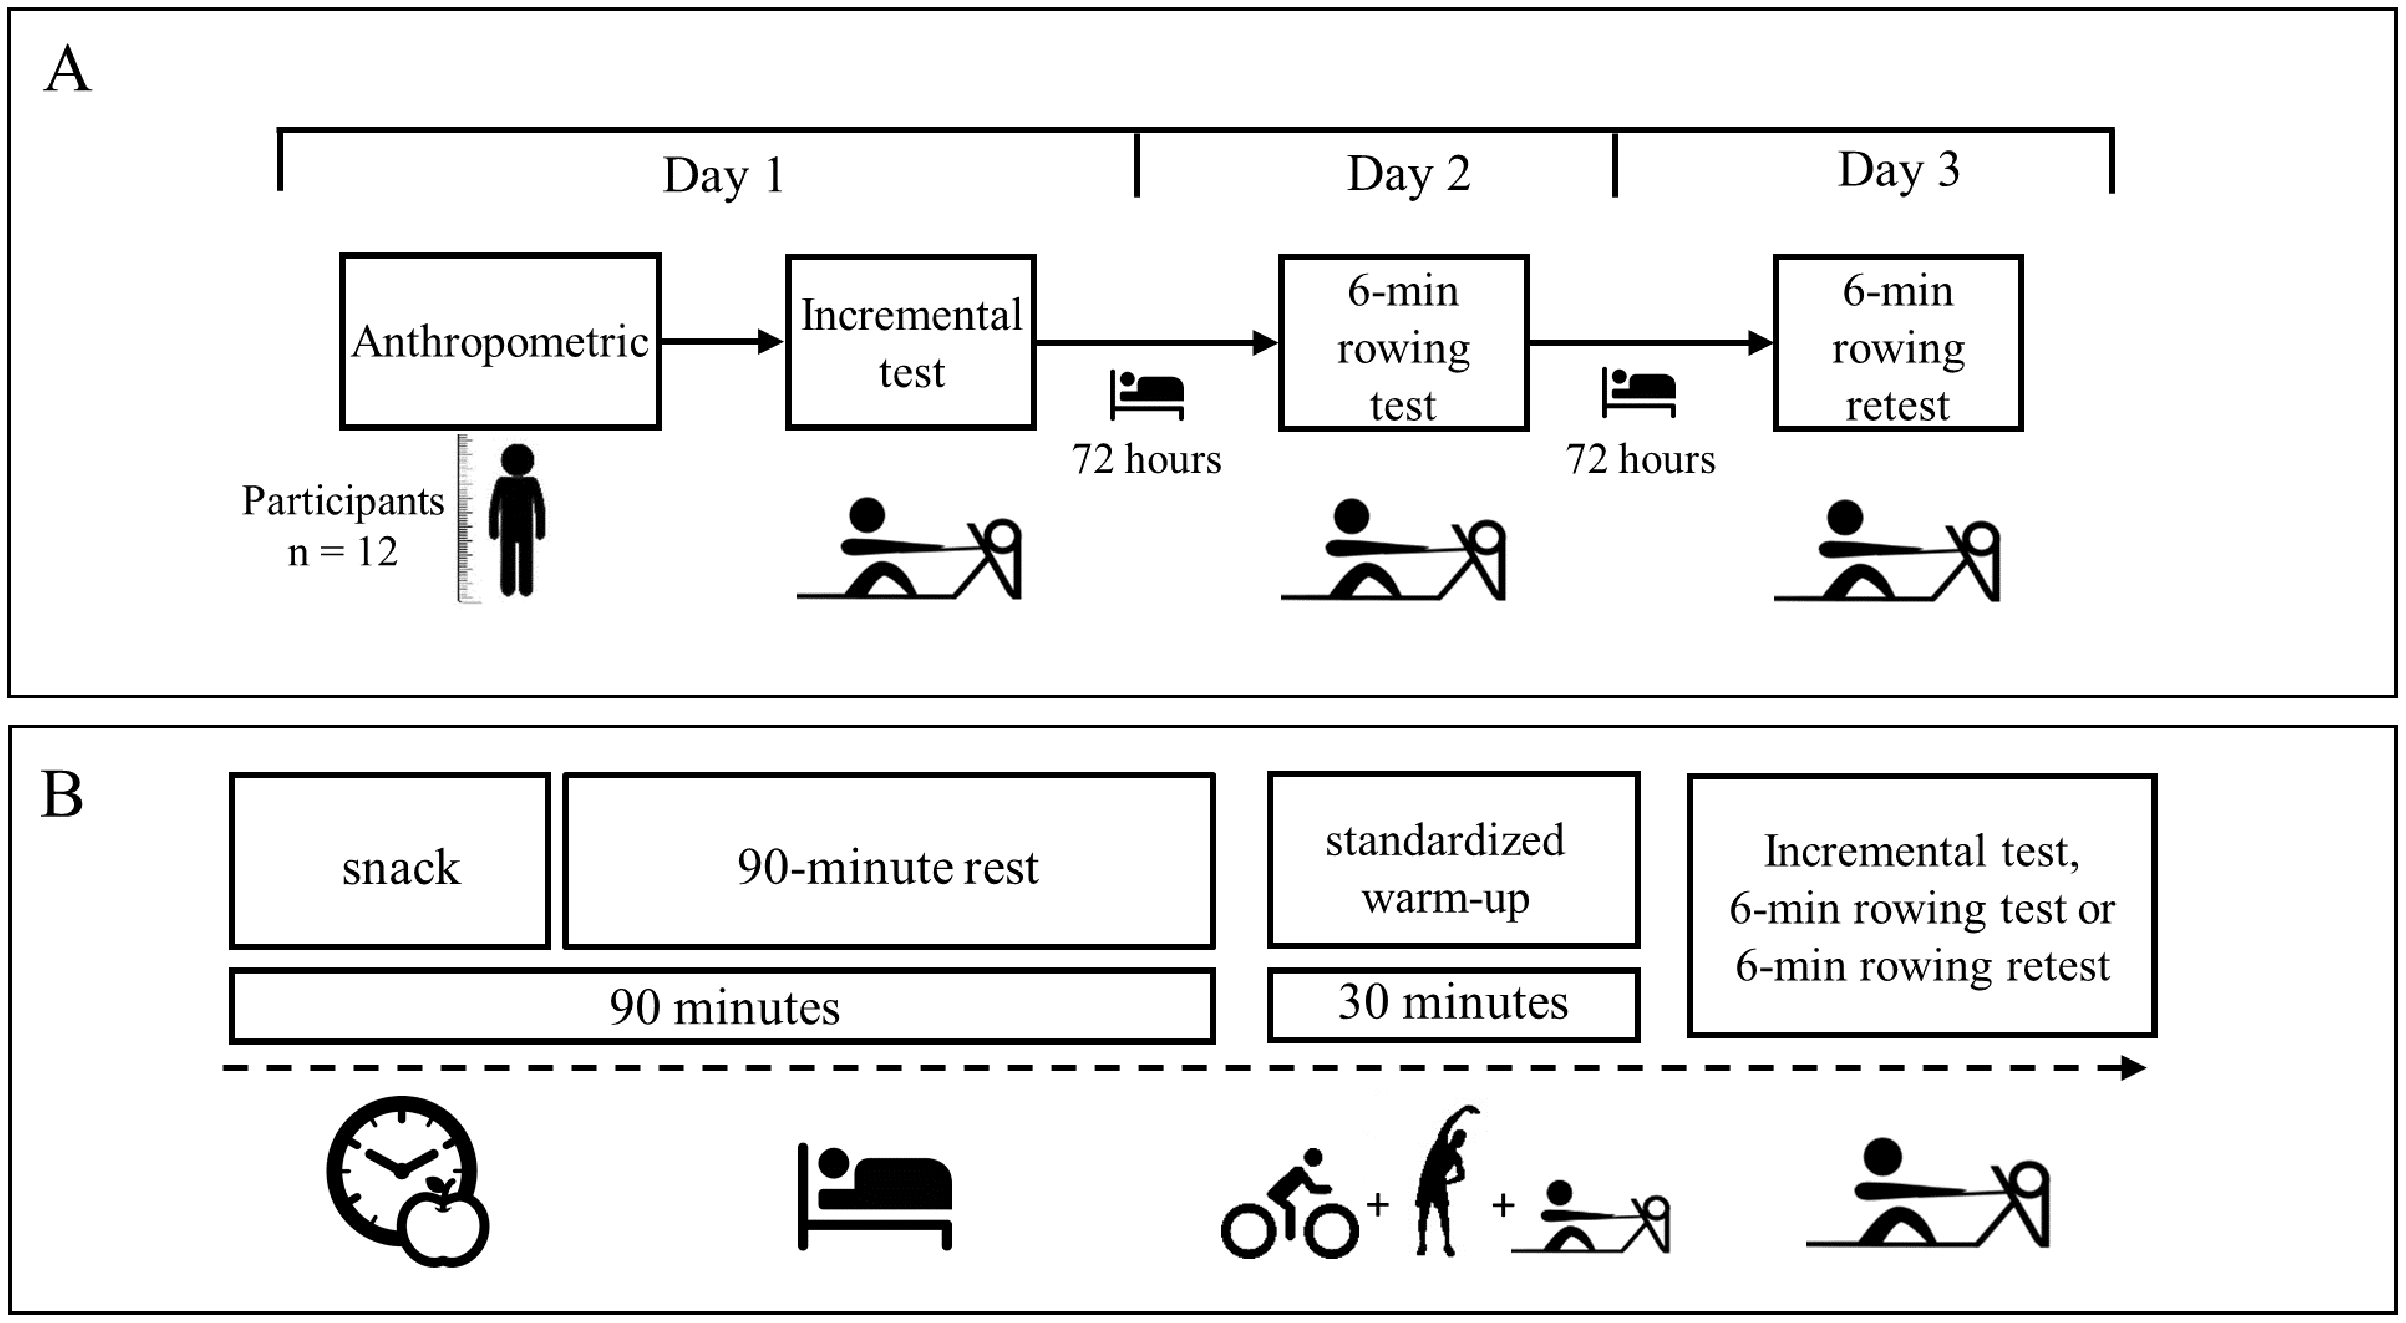
A repeated measures design was used to compare test-retest inter-day reliability for different PO, speed, VO2, and Heart Rate (HR) variables collected during the 6-minRT exercises. All study participants attended the laboratory for 3 days at 72-h intervals. Also, participants did not exercise between assessment days. This time between races ensured the physical recovery of the rowers.
During the first visit, basic anthropometric assessments and the IT were performed. The 6-minRT test and retest were performed on the second and third, respectively. All the tests were performed with a rowing machine (Concept2 Model D, monitor PM5, Morrisville, VT, USA) using a drag factor of 111–114 (Fig. 1A).
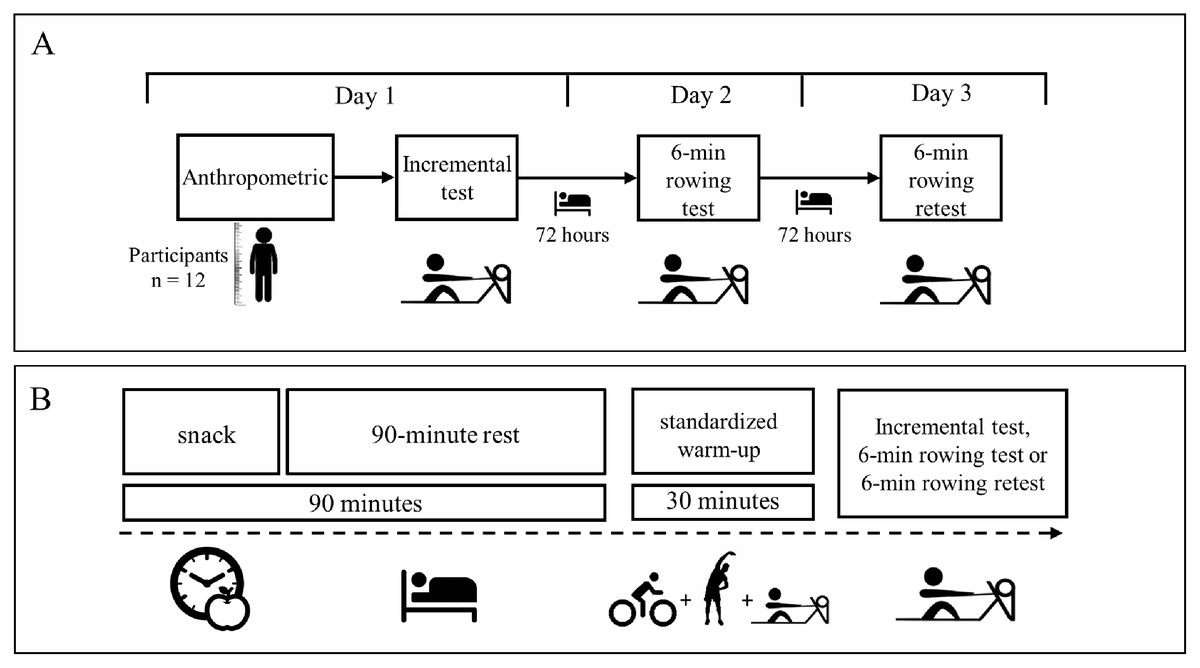
Figure 1: Research design.
Anthropometric measurements
For the characterization of the sample, weight, height, body mass index (BMI), and body fat percentage were evaluated. These evaluations were performed on the day, 30 min after snack intake. This ensured that the participants were evaluated in a euhydrated condition. The body fat percentage was assessed using an impedance meter (Tanita Inner Scan, BC-554® digital scale, Tokyo, Japan).
Snack
The snack is intended to prevent athletes from starting evaluations with a low blood glucose level (Ojeda et al., 2019). It was a carbohydrate load before the IT and 6-minRT test and retest. All participants were available 2 h before the tests in a fasting condition. The snack consisted of 2 g of rapidly absorbed carbohydrates per kg of body weight (Fig. 1B).
Standardized warm-up
The warm-up consisted of 10 min on a bicycle (Airbike Xebex® resistance, ABMG-3, USA). The warm-up intensity was between 60–70% of the theoretical maximum HR, calculated through the formula: 208-(0.7 * age) (Tanaka, Monahan & Seals, 2001). Five minutes of upper and lower extremity ballistic movements were then included. After, athletes rowed for 5 min between 60–70% of the theoretical maximum HR (Tanaka, Monahan & Seals, 2001), and finally, there was a 10-min rest (this time was used to install the mask and HR sensors) (Fig. 1B).
Oxygen uptake
VO2 and other ventilatory parameters were evaluated for all tests with an automatic gas analyzer system (model Quark CPET; Cosmed, Rome, Italy). The analyzer was calibrated strictly according to the manufacturer’s recommendations before testing. The data were processed through a laptop computer that calculated the results using software developed by the manufacturer. All ventilatory parameters were averaged at 15 s intervals. Absolute and relative VO2max (VO2max abs and VO2max rel, respectively) and other ventilatory parameters at VO2max (pulmonary ventilation at VO2max (VE at VO2max) and respiratory exchange ratio (RER) at VO2max (RER at VO2max)) were considered when VO2 kinetics generated a variation of less than 150 mLO2·min−1 between 15 s intervals (Howley, Bassett & Welch, 1995).
Incremental test
This test aims to progressively reach the highest oxygen consumption with an equivalent PO or MAP. During the test, the participants received verbal encouragement from the research team (Neto et al., 2015). VO2max, RER, VE, and carbon dioxide production/oxygen consumption (VCO2/VO2) was performed with an IT in a rower-ergometer. Each step lasted 1 min in this IT, starting with 100 watts (W) and increasing 50 W in each step until exhaustion or the impossibility of maintaining the requested power (Mekhdieva, Zakharova & Timokhina, 2019). The IT was performed on a rowing machine (Concept2 Model D, monitor PM5; Concept2, Morrisville, VT, USA) using a drag factor of 111–114. The latter intensity was also considered as the MAP of each subject. Power data were recorded in the ErgData V1.4.4® app, USA, and downloaded from an account created at https://log.concept2.com/.
6-minute rowing test
This test aims to row for 6 min on a rowing machine and achieve the greatest possible distance. The final distance of the 6-minRT is recorded in meters (m). During the test, the participants received verbal encouragement from the research team (Neto et al., 2015). In this way, it was sought that the participants would achieve the greatest possible distance during the study in both the test and retest. The variables evaluated in this test are described in the following sections. This test aimed to generate a new tool for assessing and programming training loads according to fitness and technical development in amateur rowers.
Power output
The evaluation of the PO for all the tests was performed with a rowing machine (Concept2 Model D, monitor PM5, Morrisville, VT, USA) using a drag factor of 111–114. The PO was recorded stroke to stroke; however, for analysis and synchronization with the VO2 y HR, the PO was averaged at 15-s intervals. Subsequently, the Pmean for both IT and 6-minRT in test and retest was determined. Also, the PO at VO2max was observed. The power data were recorded in the application developed by the manufacturer (ErgData, V1.4.4® app; Concept2 Morrisville, VT, USA) and downloaded from an account created at https://log.concept2.com/.
Heart rate
In the IT and 6-minRT in test and retest, HR was evaluated with a heart rate monitor (model H10®; Polar, Kempele, Finland). This device was synchronized via Bluetooth with the rowing machine. HR was recorded by rowing stroke by stroke. However, for analysis and synchronization with VO2 and PO, HR was averaged at 15 s intervals. Subsequently, the HR mean (HRmean) was determined. Also, HR at VO2max was observed. The HR data were recorded in the application developed by the manufacturer (ErgData, V1.4.4® app, Morrisville, VT, USA) and downloaded from an account created at https://log.concept2.com/.
Data analysis
For all the tests, ventilatory, mechanical, and HR parameters were sorted on a spreadsheet designed for the study. Descriptive data are presented as means and standard deviation (SD). The Shapiro-Wilk test confirmed the normal distribution of the data (p > 0.05). The validity of the 6-minRT was determined by comparing ventilatory, mechanical, and HR parameters between the IT and 6-minRT. Reliability of the 6-minRT was assessed through the coefficient of variation (CV), intra-class correlation coefficient (ICC), standard error of the mean (SEM), and corresponding 95% confidence interval between the 6-minRT test and retest. Acceptable reliability was determined as a CV < 10% and ICC > 0.85 (Cormack et al., 2008). The criteria for interpreting the strength of the r coefficients were as follows: trivial (0.00–0.09), small (0.10–0.29), moderate (0.30–0.49), large (0.50–0.69), very large (0.70–0.89), almost perfect (0.90–0.99) and perfect (1.00) (Hopkins et al., 2009). The t-tests for related samples and the Bland-Altman technique were used to assess concordance between the 6-minRT test and retest (Hopkins et al., 2009). Reliability assessments were performed using a customized spreadsheet (Hopkins, 2000). All other statistical analyses were performed with Prism version 7.00 for Windows® software. The significance level for all statistical analyses was p < 0.05.
Results
The 12 male amateur rowers had the following characteristics: age: 20.3 ± 1.56 years (range: 19–24), weight: 77.5 ± 5.74 kg (range: 66.8–86.2), height: 176 ± 6.80 cm (range: 169–188), BMI: 25.0 ± 2.14 kg/m2 (range: 20.5–27.5), body fat percentage: 12.1 ± 3.37% (range: 6.6–18.0), VO2max: 52.91 ± 3.38 mLO2·kg−1·min−1 (range: 49.36–60.86).
The first analysis shows that the amateur rowers in the present study reached, during IT, a VO2max equivalent to 4,090.9 ± 265.7 mLO2·min−1 (range: 3,412.1–4,362.9), a MAP equivalent to 325.5 ± 39.8 W (range: 229.6–375.2), and an HR at finish equivalent to 196.5 ± 6.39 (range: 185.0–202.3). Similarly, in the 6-minRT, amateur rowers reached a VO2max equivalent to 3,923.0 ± 363.5 mLO2·min−1 (range: 3,305.7–4,437.0), a Pmean equivalent to 289.8 ± 20.9 W (range: 243.1–324.5), and an HR at finish equivalent to 194.6 ± 5.58 (range: 181.4–198.3). When comparing VO2max values between the IT and 6-minRT, both absolute and relative, no significant differences were observed (p = 0.16 and p = 0.18, respectively). When comparing the MAP reached in the IT, and the Pmean reached in the 6-minRT, a significant difference was observed between both tests (p < 0.004). However, only a CV equivalent to 8.04% was obtained between both tests (the Pmean generated in the 6-minRT equivalent to the 91.96% of the MAP generated in IT). When analyzing the HR at finish during the performance of both tests, it is observed that the IT was developed with higher HR values, showing significant differences between both tests (p = 0.032) (Table 1).
| Variables | IT (mean ± SD) | 6-minRT (mean ± SD) |
p | (95% CI) | SEM (95% CI) | CV (95% CI) | ICC (95% CI) |
|---|---|---|---|---|---|---|---|
| VO2max mLO2·min−1 | 4090.7 ± 265.6 | 3923.0 ± 363.5 | 0.16 | −167.75 [−416.99 to 81.49] | 277.38 [196.50–470.96] | 6.92 [4.90–11.75] | 0.27 [−0.34 to 0.71] |
| VO2max mLO2·kg−1·min−1 | 52.91 ± 3.38 | 50.85 ± 5.37 | 0.18 | −2.06 [−5.27 to 1.14] | 3.57 [2.53–6.05] | 6.87 [4.87–11.67] | 0.40 [−0.19 to 0.78] |
| MAP (IT) vs PO at VO2max (6-minRT) W | 325.54 ± 39.82 | 278.13 ± 18.63 | 0.0001 | −47.42 [−65.90 to −28.94] | 20.57 [14.57–34.92] | 6.81 [4.83–11.57] | 0.61 [0.08–0.87] |
| MAP (IT) vs Pmean (6-minRT) W | 325.54 ± 39.82 | 289.83 ± 20.91 | 0.004 | −35.71 [−57.92 to −13.49] | 24.72 [17.51–41.98] | 8.04 [5.69–13.64] | 0.43 [−0.16 to 0.80] |
| HR at finish bpm | 196.58 ± 6.39 | 194.67 ± 5.58 | 0.032 | −1.92 [−3.64 to −0.19] | 1.92 [1.36–3.26] | 0.98 [0.69–1.66] | 0.92 [−0.74 to 0.98] |
| VE at VO2max L·min−1 | 166.09 ± 22.89 | 154.13 ± 16.24 | 0.047 | −11.97 [−23.80 to −0.14] | 13.16 [9.33–22.35] | 8.22 [5.82–13.96] | 0.60 [−0.07 to 0.87] |
| RER at VO2max VCO2/VO2 | 1.28 ± 0.07 | 1.24 ± 0.06 | 0.045 | −0.05 [−0.09 to 0.00] | 0.05 [0.04–0.09] | 4.02 [2.85–6.82] | 0.40 [−0.19 to 0.87] |
Note:
bpm, beat per minute; CI, confidence interval; HR, heart rate; ICC, intra-class correlation coefficient; IT, incremental test; CV, coefficient of variation; L·min−1, liters per minute; MAP, maximum aerobic power; mLO2·min−1, milliliters of oxygen per minute; mLO2·kg−1·min−1, milliliters of oxygen per kilogram per minute; Pmean, mean power output; PO, power output; RER, respiratory exchange ratio; SD, standard deviation; SEM, standard error of the mean; VE, minute ventilation; VCO2/VO2, carbon dioxide production/maximal oxygen uptake; VO2max, maximal oxygen uptake; W, watts; 6-minRT, 6-minute rowing test; , variation delta; p, alpha value.
When assessing the concordance between the 6-minRT test and retest, the distance did not show significant differences between the two tests (test: 1,692.5 ± 42.8 m vs 1,696.3 ± 46.8 m, p = 0.28, CV = 0.50%, ICC = 0.97), Pmean showed no significant differences between the two tests (test: 289.7 ± 21.0 W vs 290.8 ± 24.1 W, p = 0.62, CV = 1.85%, ICC = 0.96), and HR at the finish did not show significant differences between the two tests (test: 194.7 ± 5.6 bpm vs 195.8 ± 6.5 bpm, p = 0.08, CV = 0.72%, ICC = 0.96) (Table 2).
| Variables | Test (mean ± SD) | Retest (mean ± SD) | p | (95% CI) | SEM (95% CI) | CV (95% CI) | ICC (95% CI) |
|---|---|---|---|---|---|---|---|
| Distance m | 1,692.5 ± 42.8 | 1,696.3 ± 46.8 | 0.28 | 3.83 [−3.7 to 11.4] | 8.42 [5.9–14.3] | 0.50% [0.35–0.84] | 0.97 [0.90–0.99] |
| Intensity m·s−1 | 4.70 ± 0.12 | 4.71 ± 0.13 | 0.24 | 0.01 [−0.01 to 0.03] | 0.02 [0.02–0.04] | 0.50% [0.35–0.84] | 0.97 [0.90–0.99] |
| Pmean W | 289.7 ± 21.0 | 290.8 ± 24.1 | 0.62 | 1.10 [−3.72 to 5.91] | 5.36 [3.80–9.10] | 1.85% [1.31–3.14] | 0.96 [0.85–0.99] |
| HRmean bpm | 182.9 ± 4.9 | 184.7 ± 5.0 | 0.07 | 1.72 [−0.18 to 3.62] | 2.11 [1.50–3.58] | 1.15% [0.81–1.95] | 0.85 [0.56–0.95] |
| HR at finish bpm | 194.7 ± 5.6 | 195.8 ± 6.5 | 0.08 | 1.08 [−0.17 to 2.34] | 1.40 [0.99–2.27] | 0.72% [0.51–1.21] | 0.96 [0.86–0.99] |
Note:
bpm, beat per minute; CI, confidence interval; HRmean, mean heart rate; CV, coefficient of variation; ICC, intra-class correlation coefficient; m, meters; Pmean, mean power output; SD, standard deviation; SEM, standard error of the mean; W, watts; 6-minRT: 6-minute rowing test; , variation delta; p, alpha value.
Regression analysis evidenced that the distance (m), intensity (m·s−1) and Pmean between the 6-minRT test and retest had an almost perfect r coefficient (r2 = 0.93, r2 = 0.93 and r2 = 0.90, respectively) (Fig. 2).
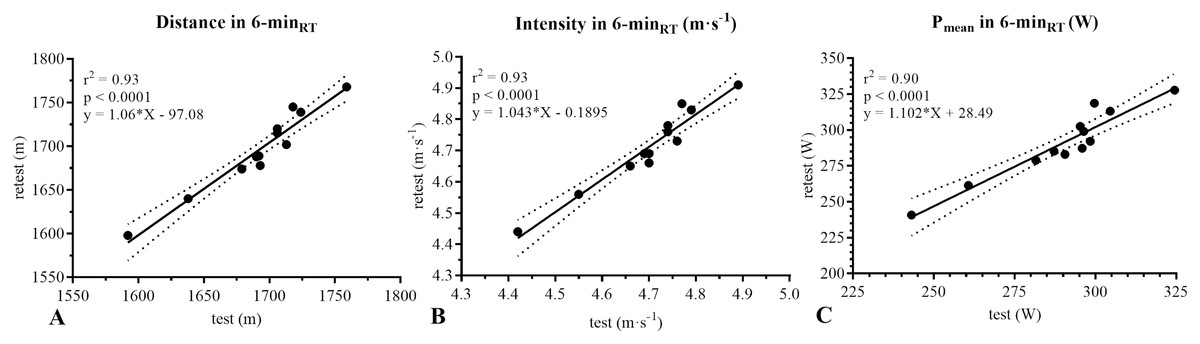
Figure 2: Regression analysis between test and retest of the 6-minRT.
m, meters; m·s−1, meters per seconds; Pmean, mean power output; W, watts; 6-minRT: 6-minute rowing test; p, alpha value.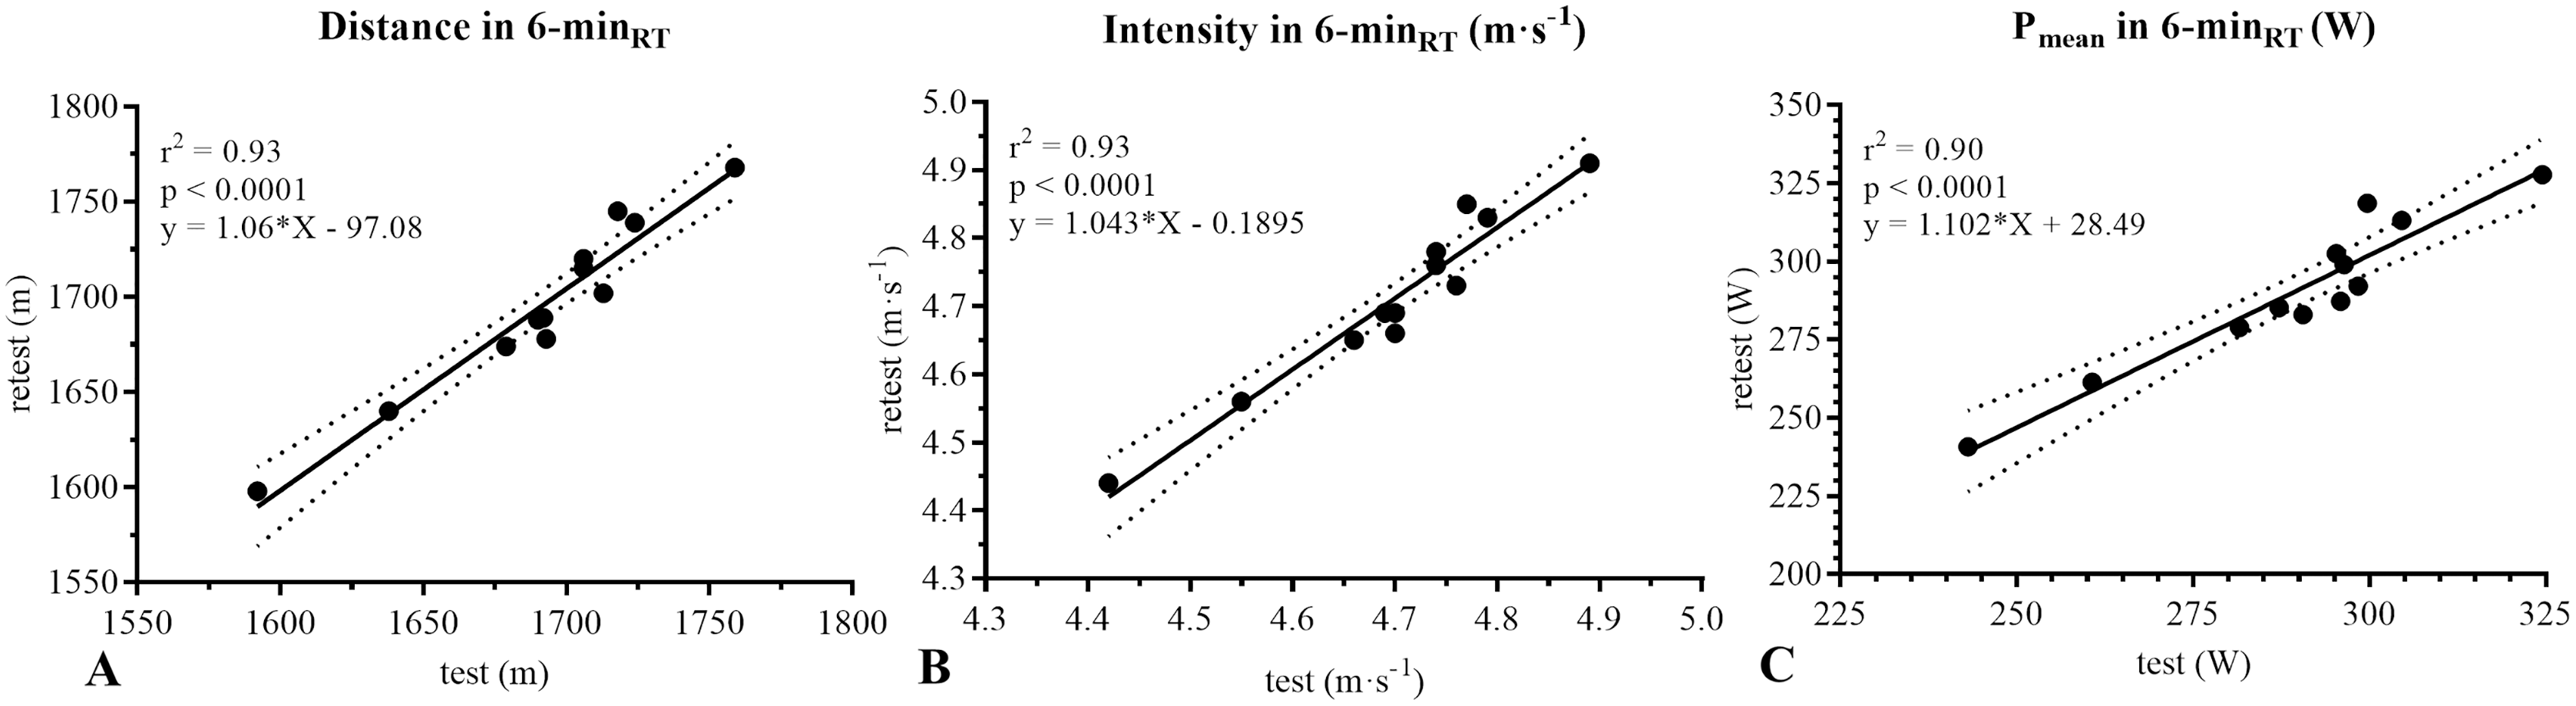
Upon comparing the mean values and the differences in the distance (m) in the test and retest, Bland-Altman’s analysis showed a common bias of 3.83 ± 11.91 m (95% limits of agreement from −19.51 to 27.17). For the intensity (m·s−1), the bias was 0.01 ± 0.03 m·s−1 (95% limits of agreement from −0.05 to 0.07), while for the Pmean (W), it was 1.025 ± 7.86 W (95% limits of agreement −14.39 to 16.44) (Fig. 3).
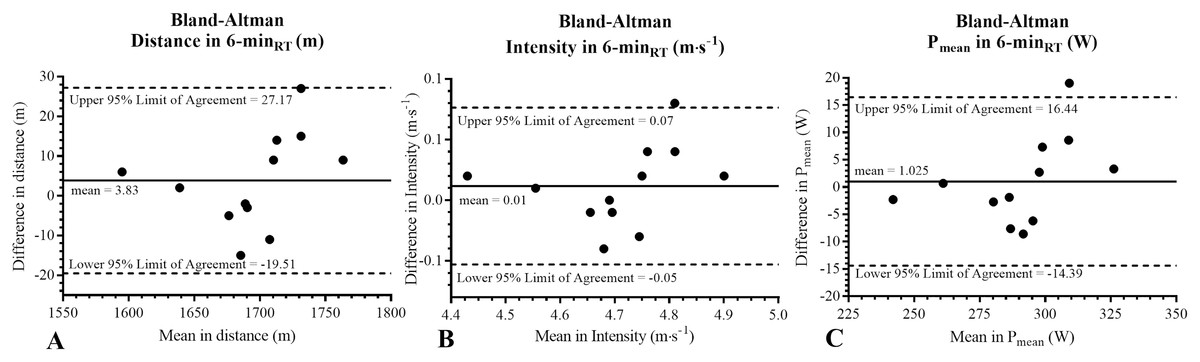
Figure 3: Bland-Altman analysis.
The solid line represents the average of the differences between variables evaluated through a 6-min rowing test. The segmented lines represent 95% of the upper and lower confidence limits. m, meters; m·s−1, meters per seconds; Pmean, mean power output; W, watts; 6-minRT: 6-minute rowing test; p, alpha value.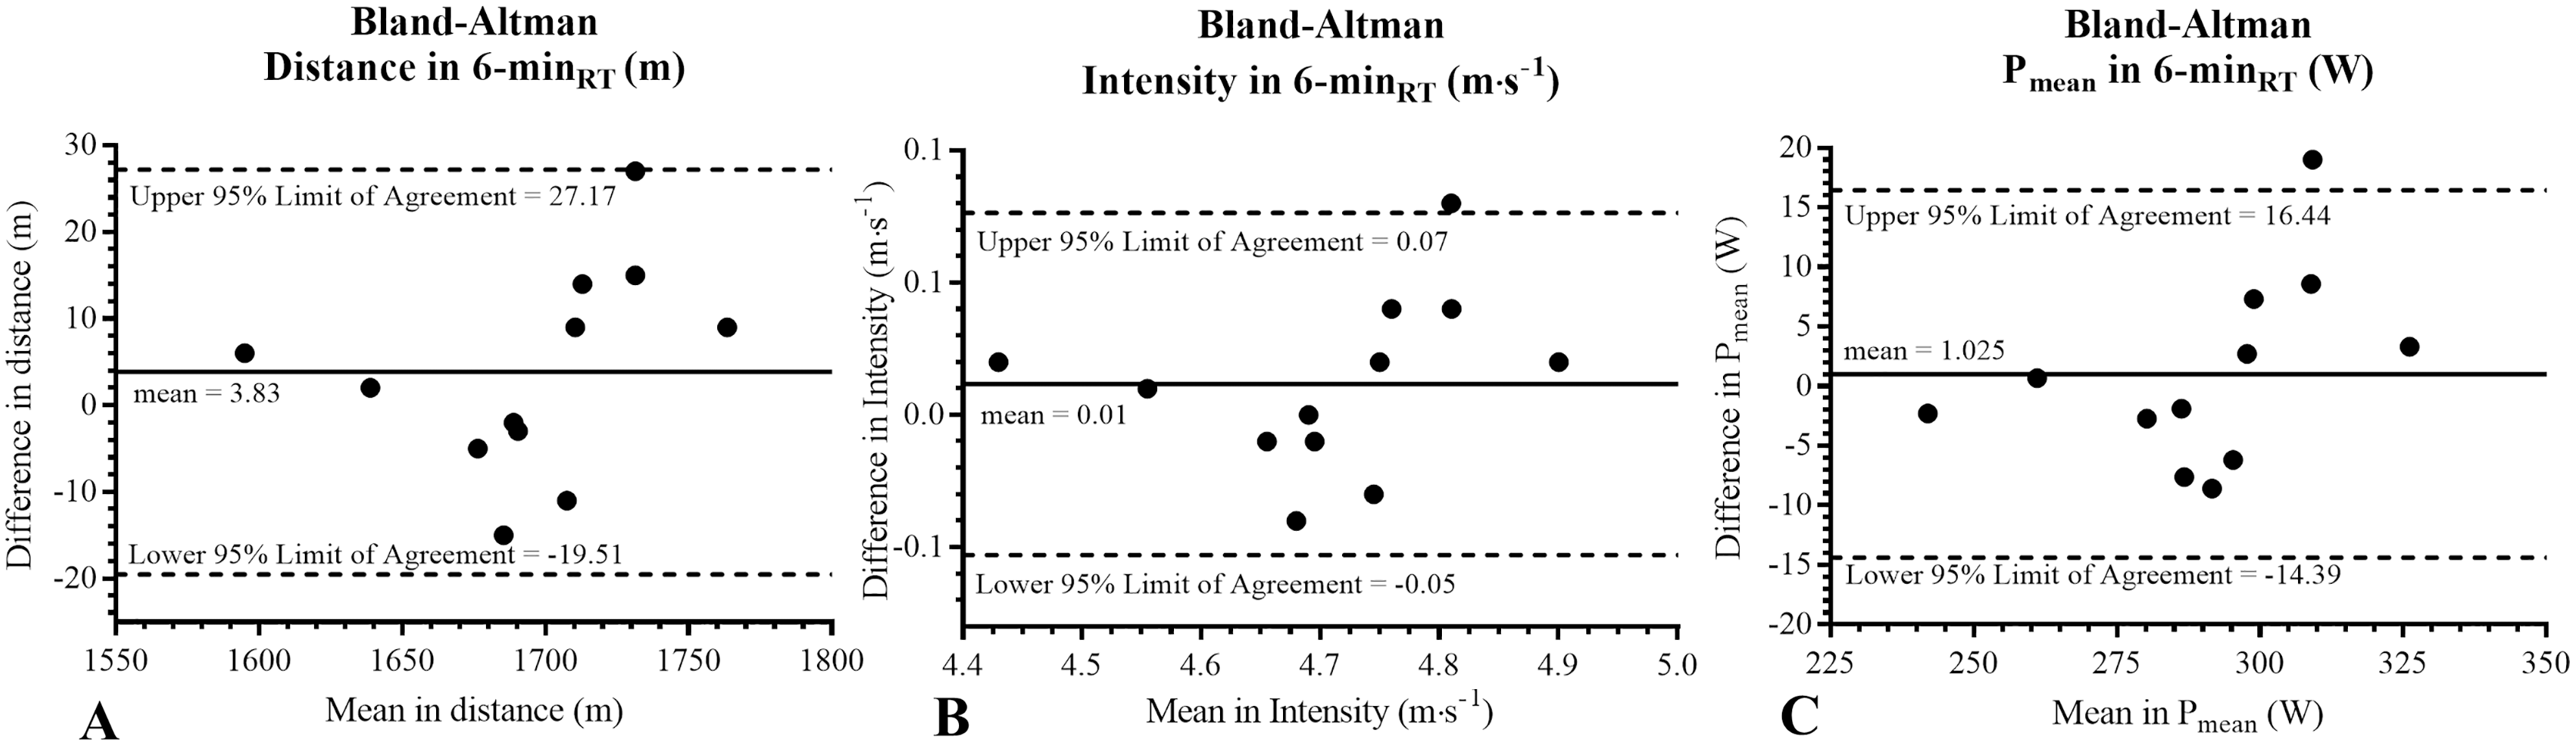
Discussion
This study was designed to determine the validity and reliability of the 6-minRT in amateur rowers. When comparing the VO2 between the IT and 6-minRT, similar VO2max were observed in both tests (p > 0.05). When comparing the MAP (IT) with Pmean (6-minRT), significant differences were observed between both tests (p < 0.05). However, these differences are smaller than those observed between the IT MAP and the 2,000mTT Pmean in amateur rowers (Huerta Ojeda et al., 2022). This finding confirms that, from a ventilatory perspective, amateur rowers perform both tests at maximum intensity. Likewise, it was observed that the Pmean generated in the 6-minRT is closer to VO2max than the Pmean generated in the 2,000mTT (Huerta Ojeda et al., 2022). In parallel, the concordance results for distance, intensity, HR, and Pmean between the 6-minRT test and retest show a high reproducibility of this test when applied on different days (Hopkins et al., 2009). These findings suggest that the 6-minRT is valid and reliable for assessing PO in amateur male rowers (Huerta Ojeda et al., 2022).
Oxygen uptake
Concerning VO2 values during the 6-minRT in amateur rowers, our findings showed that the present study participants showed an “excellent” VO2max (52.91 ± 3.38 mLO2·kg−1·min−1) when compared to healthy and physically active individuals (Herdy & Caixeta, 2016). Although these VO2 values are qualified as “excellent,” they are lower than those observed in elite rowers (Hagerman et al., 1978; Huntsman et al., 2011). Despite this, the evidence of amateur rowers is scarce (Kendall et al., 2011; Huerta Ojeda et al., 2022). In this sense, Huerta Ojeda et al. (2022) showed that amateur rowers reach 55.9 ± 3.4 mlO2·kg−1·min−1 during the 2,000mTT. Specifically, the researchers reported that VO2max was reached 345 s after the start of the 2,000mTT, after which time VO2 began to decline (Huerta Ojeda et al., 2022), possibly due to low fitness and technical development of the amateur rowers (Huntsman, Drury & Miller, 2011). Likewise, Kendall et al. (2011) showed that, during the 2,000mTT, amateur female rowers reached a VO2max equivalent to 2.88 LO2·min−1, while they took 485.8 ± 10.3 s to complete the test. The same researchers reported an r = −0.55 between el VO2max value and time in the 2,000mTT (Kendall et al., 2011). Likewise, there is evidence that the 2,000mTT induces a high blood oxidative stress in rowers with high training status (Kyparos et al., 2009), which allows inferring higher blood oxidative stress in amateur rowers. However, this issue needs further exploration.
Concerning VO2max and rowing performance, there is a big difference between elite and amateur rowers. While elite rowers can complete the 2,000mTT in less than 360 s (Silva, 2016), reaching VO2max (Hagerman et al., 1978; Mahler, Andrea & Andresen, 1984), amateur rowers can only cover 1,696.3 ± 46.8 m in the 6-minRT (360 s). Consequently, the 6-minRT is a test that allows amateur rowers to reach VO2max without experiencing a decrease in this parameter at the end of the race. However, this last issue also requires further exploration.
Power output
A significantly lower value was observed when comparing the MAP in the IT and Pmean performed in the 6-minRT by amateur rowers (p = 0.004). However, this CV was only 8.04% between both tests (91.96% of the MAP generated in the TI). Indeed, this is the most relevant background to affirm that shorter tests in amateur rowers (6-minRT) allow for measuring Pmean close to the PO at VO2max (Huerta Ojeda et al., 2022). On the other hand, the PO kinetics observed in the present study is similar to those described by Mahler, Andrea & Andresen (1984). Specifically, higher PO is observed in the first minutes of the test and a gradual decrease until the last minute. However, it should be noted that the PO generated by amateur rowers is lower than that generated by elite rowers in the 6-minRT. The latter far exceeds the 289.8 ± 20.9 generated by amateur rowers in this study (Mahler, Andrea & Andresen, 1984). These differences between categories are conditioned by amateur rowers’ low fitness and technical development compared to higher-level rowers (Huntsman, Drury & Miller, 2011). In this sense, it has been observed that the PO (Pmean and Pmax) presents the advantage of being obtained with a simple ergometer test without biological measurements (Bourdin et al., 2017). In this context, based on the results of the present study, the 6-minRT is performed with a Pmean close to VO2max and, therefore, allows establishing the MAP in amateur rowers. In fact, it has been shown that those rowers who can maintain a MAP for a longer time have a higher performance; the MAP was the most important predictor of performance in rowers (Turnes et al., 2020). Consequently, the measurement and PO use have an additional advantage since most existing rowing meters provide this information in the field (Bourdin et al., 2017). Only tests according to each rower’s physical and technical level should be applied (in the case of amateur rowers, the 6-minRT).
Reliability of 6-minRT
Finally, the results show that the 6-minRT has a high degree of reliability for distance (CV = 0.50%; ICC = 0.97), Pmean (CV = 1.85%; ICC = 0.96) and HRmean (CV = 0.85%; ICC = 1.15). In this regard, other reliable tests evaluate physical parameters in rowers (Ingham et al., 2002; Otter et al., 2015; Cheng et al., 2012). However, none of the consulted studies allows the evaluation of Pmean in amateur male rowers.
Limitations
The lack of descriptive information on ventilatory kinetics, PO (Pmean and Pmax), and HR in amateur rowers made it challenging to compare our findings. Also, the non-inclusion of women in the study limits the conclusions only to study participants and male amateur rowers. We also believe that future research with amateur rowers should analyze in-depth the kinetics of VO2, both the slow and fast components. Finally, future studies should include randomization of participants between tests, thus eliminating any cumulative physiological effects affecting the reliability of the results.
Conclusions
At the end of the study, it could be observed that the 6-minRT allows amateur rowers to reach VO2max. Likewise, the Pmean generated during the 6-minRT equals 91.96% of the MAP generated in the IT. For this reason, from a ventilatory and mechanical point of view, the 6-minRT is a maximally valid test for establishing MAP in amateur rowers. Also, the 6-minRT evidences a high degree of agreement between days. Therefore, the 6-minRT is a valid and reliable test for assessing PO in amateur male rowers.