
Transcriptome analysis reveals gene expression differences in Liriomyza trifolii exposed to combined heat and abamectin exposure
- Published
- Accepted
- Received
- Academic Editor
- Ilaria Negri
- Subject Areas
- Agricultural Science, Entomology, Molecular Biology, Climate Change Biology
- Keywords
- Liriomyza trifolii, High temperature, Insecticide tolerance, Transcriptome
- Copyright
- © 2021 Wang et al.
- Licence
- This is an open access article distributed under the terms of the Creative Commons Attribution License, which permits using, remixing, and building upon the work non-commercially, as long as it is properly attributed. For attribution, the original author(s), title, publication source (PeerJ) and either DOI or URL of the article must be cited.
- Cite this article
- 2021. Transcriptome analysis reveals gene expression differences in Liriomyza trifolii exposed to combined heat and abamectin exposure. PeerJ 9:e12064 https://doi.org/10.7717/peerj.12064
Abstract
Liriomyza trifolii is an invasive pest of horticultural and vegetable crops that possesses robust competitive advantages that enable it to replace closely-related species. High temperatures often occur concomitantly with insecticide usage during L. trifolii outbreaks. In this study, we compared the transcriptomes of L. trifolii exposed to high temperature (40 °C T40), insecticide (LC50 of technical grade abamectin, I50) and combined high temperature and abamectin exposure (IT5040, I50 followed by T40; and TI4050, T40 followed by I50). RNA-seq generated and revealed 44,633 unigenes with annotation data; these were compared with COG and KEGG databases for functional classification and enrichment analysis. Compared with the I50 treatment, COG classification indicated that ‘post-translational modification, protein turnover, chaperones’ was enriched in the IT5040 treatment. In the TI4050 treatment, ‘carbohydrate transport and metabolism’ was the most abundant group. The most enriched KEGG pathways in the TI4050 and IT5040 treatments were ‘longevity regulating pathway - multiple species’ and ‘protein processing in endoplasmic reticulum’, respectively. Subsequent annotation and enrichment analyses indicated that stress-related genes such as CYP450s and HSPs were differentially expressed in the I50 vs. TI4050 or I50 vs. IT5040 treatment groups. Three commercial insecticide formulations were also used to further verify the expression of selected differentially-expressed genes. This study will be conductive to consider the temperature effect on insecticide tolerance in L. trifolii, and provides a framework for improving the application efficiency of insecticides in hot weather, which will ultimately reduce the overuse of pesticides.
Introduction
Liriomyza trifolii (Burgess) (Diptera: Agromyzidae) occurs worldwide and is an economically-significant, agricultural pest of both vegetables and horticultural plants (Spencer, 1973; Kang, 1996; Gao et al., 2017a). It is extremely polyphagous and has a wide range of hosts (Gao et al., 2017a). Adults land on leaves for feeding and puncturing leaves with their ovipositior, and female fly lays an egg in a puncture wound, which will provide entry points for pathogens (Zitter & Tsai, 1977; Parrella et al., 1985; Motteoni & Broadbent, 1988; Reitz et al., 1999). After eggs hatch into larvae, they begin to tunnel mesophyll tissue in a twisting or serpentine pattern and widden the tunnel as the larvae mature, reducing photosynthetic capacity and leading to withering, necrosis and abscission of leaves, resulting in reduced yields (Chandler & Gilstrap, 1987; Chang et al., 2020a). Just before pupation, the larvae bited out of the tunnel and drop to the ground to pupate (Gao & Reitz, 2017b). L. trifolii originated in the Americas (Scheffer & Lewis, 2006) and invaded the Guangdong area in 2005 (Lei, Zhu & Zhang, 2007; Wang, Guan & Chen, 2007; Gao et al., 2017a). It then spread rapidly throughout the country and gradually displaced the related species, L. sativae and L. huidobrensis, to become a dominant invasive pest of vegetables in China (Wen, Wang & Lei, 1996; Wen, Lei & Wang, 1998; Wang, Guan & Chen, 2007; Kang et al., 2009; Xiang, Lei & Wang, 2012; Gao et al., 2017a). According to the investigation of occurrence situations in Hainan Province in recent years, L. trifolii mainly damaged cowpea and luffa and the damaged rate almost reached 100% (Wang et al., 2013).
Although they share similar biological characteristics, the closely-related Liriomyza spp. exhibit complex interspecific interactions and different competitive advantages (Xiang, Lei & Wang, 2012; Wan & Yang, 2016; Chang et al., 2017b; Chang et al., 2020b). In the context of global warming, temperature tolerance determines whether insects can complete their life cycle, overwinter and successfully expand their habitat (Hill, Sinars & Lodge, 1993; Cerdá, Retana & Manzaneda, 1998; Bale et al., 2002; Savage et al., 2004; Frazier, Huey & Berrigan, 2006; Fox, Fox & Archer, 2010; Mandrioli, 2012). Previous studies have demonstrated that L. trifolii is more tolerant of high temperatures than other related species, and this has led to its emergence as the dominant, competitive species in the genus Liriomyza (Zehnder & Trumble, 1984; Palumbo, Mullis & Reyes, 1994; Reitz & Trumble, 2002; Abe & Tokumaru, 2008; Xiang, Lei & Wang, 2012; Wang et al., 2020). Furthermore, insecticide tolerance may also contribute to the predominance of L. trifolii during interspecies competition and substitution (Gao et al., 2012; Xiang, Lei & Wang, 2012; Chang et al., 2017b; Gao & Reitz, 2017b). Although several approaches have been explored as part of the management system for L. trifolii, chemical control currently remains the most common and efficient approach (Gong et al., 2013). But extensive use of insecticides usually resulted in enhanced insecticide resistance, environmental pollution, destruction of ecosystems and pest resurgence (Abe & Tokumaru, 2008; Gao et al., 2011; Gao et al., 2012; Gao & Reitz, 2017b). Abamectin, which is multiple foliar applied to manage L. trifolii throughout the growing season during periods of temperature fluctuation and changing environmental conditions, functions as a neuromodulator that interferes with neural transmission and disrupts the insect digestive tract, especially in the midgut (Leibee, 1988; ScottFerguson, 2004; Aljedani & Musleh, 2017; Arfan et al., 2020; Wang et al., 2020; Devkota et al., 2016; Wang, Chang & Du, 2021).
High temperatures and insecticides can occur simultaneously during L. trifolii outbreaks, but previous studies have largely ignored the synergistic effects that can accompany these two forms of stress. Climate change, especially global warming, can always increase the frequency of extreme weather events and impact the development, reproduction and survival of insects (Bale et al., 2002; Savage et al., 2004; Frazier, Huey & Berrigan, 2006) and may also induce a heat shock response in insects (Huang, Wang & Kang, 2009; Feng et al., 2010; Sun et al., 2014; An et al., 2020). High temperatures have been becoming a vital menace to the volatility, stability, degradation and metabolism of insecticides when extreme high temperature climate appears frequently, which makes global warming a pivotal factor influencing insect survival and adaption (Goel et al., 1987; Johnson, 1990; Scott, 1995; Bale et al., 2002; Gordon, 2005; An et al., 2020). Furthermore, the thermal stress caused by global warming likely induces cascading effects on other functions such as the immune response to insecticides (Travers et al., 2009) and the target sites of insecticides and detoxification mechanisms in insects can be altered by heat stress (Scott & Georghiou, 1984; Weston et al., 2009; Laetz et al., 2014). The heat shock response in insects has also resulted in adaptive responses to insecticide stress (Henle, 1987; Gusev, Bogatcheva & Marston, 2002; Franck et al., 2004; Haslbeck et al., 2005). ‘Adaptive cross-tolerance’ is a phenomenon where insects pre-exposed to warmer temperatures show increased tolerance to insecticides, which may have downstream effects on other functions such as the immune mechanism of heat stress (Hurlbut, 1973; Watts et al., 1987; Patil, Lole & Deobagkar, 1996).
In our previous analysis of the L. trifolii transcriptome in response to temperature stress (Chang et al., 2020a), we noted the induction of many detoxification pathways. These findings suggested that adaptive cross-tolerance to high temperature and insecticides helps L. trifolii cope with environmental stress and may determine the outcome of interspecific competition and substitution among Liriomyza spp. However, it remains unclear exactly how insects balance the stress response between high temperatures and insecticide exposure.
The objective of this study was to evaluate the combined effects of heat and abamectin exposure on global gene expression in L. trifolii. A comparative transcriptome analysis was performed in L. trifolii exposed to 40 °C and technical grade abamectin and differentially expressed genes were identified. The results of this study help elucidate the underlying mechanisms and pathways that operate in L. trifolii exposed to multiple sources of stress and provide a foundation for more effective use of insecticides.
Materials and methods
Insects
The L. trifolii adults used in this study were collected from celery (Apium graveolens) cultivated in Yangzhou (32.39°N, 119.42°E) in 2015. Insect colonies were established in the laboratory at 25 ± 1 °C with a 16:8 h light: dark photoperiod as described (Chen & Kang, 2005) without prior exposure to insecticides. Leaves exhibiting tunnels with larvae were collected for pupation, and adults were reared on celery for mating and oviposition.
Insecticide and high temperature treatments
The insecticides used in this study included the following: technical grade abamectin 95% w/w active ingredient (Hebei Veyong BioChemical Co., Ltd.); commercial grade 3% w/w abamectin (AB) (Anhui Sida Pesticide Chemical Co., Ltd.), commercial grade 80% w/w monosultap (MO) (Anhui Huaxing Chemical Industry Co., Ltd.), and a commercial 20% w/w microemulsion of 0.2% abamectin + 19.8% monosultap active ingredient (AM) (‘Banqianjing’, Beijing Green Agricultural Science and Technology Group Co., Ltd.). The bioassay of L. trifolii conducted by a residual film method was similar to the method described by Wang et al. (2021). For each insecticide, the formulated solution was diluted with ddH2O to generate five appropriate serial dilutions. Glass tubes (3 × 10 cm) containing diluted solutions (3 mL) were turned upside down and allowed to completely dry, meanwhile generating a uniform film of insecticide residue on the inner surface of the glass tube (Plapp Jr et al., 1990), ddH2O as controls. 30 newly-emerged L. trifolii adults (n = 30), which have emerged for 24 h, were aspirated into each treated glass tube and sealed with gauze. To feed the adults, a moist cotton ball was saturated with 10% honey/water solution and placed above gauze covering the tubes. The tubes were held upright in the environmental chamber at the same relative humidity and photoperiod as the colony; mortality was recorded every 12 h. Five techenical repetitions were set for each concentration, and each experiment was seperately repeated three times. SPSS v. 16.0 (SPSS, Chicago, IL, USA) and DPS v. 9.01 software was used to calculate the lethal concentrations (LC50) and 95% confidence intervals (Tang & Zhang, 2013). Data were collected as previously described in the studies of Wang et al. (2021) and Wang, Chang & Du (2021). Specifically, the four insecticides were directly distilled with ddH2O to create insecticide solutions with the following concentrations: 39.19, 7.67, 18.73 and 20.27 mg L−1 (LC50) (Wang et al., 2021a; Wang, Chang & Du, 2021).
In order to investigate the combined effect of exposure to high temperatures and technical grade abamectin on gene expression in L. trifolii adults, four groups of L. trifolii adults, with 30 in each, were treated as follows: the first group of L. trifolii adults was exposed to high temperature (40 °C) inside a temperature controller (DC-3010, Ningbo, China) for 1 h (T40 treatment), which was never been exposed to any insecticide. A second group was exposed to the LC50 dose of technical grade abamectin for 72 h at 25 °C (I50 treatment). The third group was exposed to 40 °C for 1 h and then the survivors were exposed the LC50 dose of technical grade abamectin for 72 h (TI4050 treatment). After exposing to the LC50 dose of technical grade abamectin for 72 h, the survivors of the fourth group were transferred into 40 °C for 1 h (IT5040 treatment). Adults cultured at room temperature without exposure to high temperature and insecticide were used as controls. Each experiment was repeated three times, and each treatment consisted of three biological replicates.
Transcriptome results and potential interacting regulatory pathways were examined by pre-exposing L. trifolii adults to 40 °C for 1 h and the LC50 dose of three commercial insecticides (AB, MO and AM) for 72, 24 and 24 h, respectively (TI4050 treatments). Controls consisted of L. trifolii adults exposed to the LC50 of each commercial insecticide (I50 treatment). Experiments were repeated three times, and three biological replicates were included for each treatment.
RNA extraction and transcriptome sequencing
Total RNA was extracted with the SV total RNA isolation system (Promega, Fitchburg, WI, USA) as recommended by the manufacturer. RNA concentration and quality were assessed by spectrophotometry (Eppendorf BioPhotometer Plus, Hamburg, Germany), and RNA integrity was determined by agarose gel electrophoresis. mRNA preparation and cDNA library construction were performed for three biological replicates. A HiSeq™ 2500 instrument (Illumina, San Diego, CA, USA) at the Biomarker Technologies Co. (Beijing, China) was used for sequencing. RNA-seq data has been deposited in the Sequence Read Archive (SRA) with accessioon number PRJNA718410 and PRJNA719479 at the National Center for Biotechnology Information (NCBI).
Transcriptome assembly and unigene functional annotation
Prior to transcriptome assembly, raw sequence data were filtered to remove low-quality reads and reads with adaptors and unknown nucleotides; the reads were then analyzed for GC content, quality scores (Q20, Q30) and sequence duplication. The clean reads were de novo assembled by Trinity v. 2.1.1 software with the default parameters to obtain a high-quality ungene library (Cui et al., 2018; Grabherr et al., 2011). The assembled unigenes were queried against Swiss-Prot, the NCBI nonredundant database (NR), euKaryotic Orthologous Groups (KOG), Gene Ontology (GO), Clusters of Orthologous Groups (COG), protein family (Pfam), eggNOG, and Kyoto Encyclopedia of Genes and Genomes (KEGG) using BLAST programs available at NCBI (Altschul et al., 1997; Deng et al., 2006), which were used to annotate and classify unigenes (e-value < 10−5). Putative protein functions were calculated based on similar proteins previously annotated in these databases.
Differential gene expression analysis
Fragments per kilobase of transcript sequence per million base pairs sequenced (FPKM) nucleotides were calculated to map read counts. Differentially expressed genes (DEGs) in treated vs. and control groups were analyzed using the DESeq2 R package (Anders & Huber, 2010) as described previously (Varet et al., 2016; Xiong et al., 2019). The Benjamini–Hochberg procedure was used to adjust the resulting P values in multiple testing with calculated false discovery rates (FDR) (Haynes, 2013). Unigenes with a FDR values <0.05 and fold-change —FC— ≥ 2 were defined as significant in differential expression.
Quantitative real-time reverse transcriptase PCR (qRT-PCR)
Sixteen unigenes (10 unigenes for original transcriptome verification and six unigenes for commercial insecticide verification) were selected and validated by quantitative real-time PCR (qRT-PCR) on a CFX-96 Real-Time PCR Detection System (Bio-Rad, Berkeley, CA, USA) with specific primers designed by Primer Premier 5.0 (Table S1). The cDNA template used for RT-qPCR was reverse-transcribed from qualified total RNA using the Prime Script RT Reagent Kit (Bio-Rad, Berkeley, CA, USA). A 20 µL PCR reaction volume contained 10 µL of Bio-Rad iTaq™ Universal SYBR® Green Super mix (2 ×), 1 µL of each gene-specific primer (10 µM), 2 µL of each cDNA template and 6 µL of ddH2O. Actin was used as a reference gene and the 2−ΔΔCt method was employed to estimate relative changes in gene expression (Livak & Schmittgen, 2001; Chang et al., 2017a). Each treatment included four replicates, and each sample was assessed in triplicate. Significant differences among treatments were detected by one-way ANOVA, followed by Tukey’s multiple comparison and analysis with SPSS v. 16.0 (SPSS, Chicago, IL, USA); significant differences were determined at P < 0.05.
Results
mRNA sequencing, assembly, and functional annotation
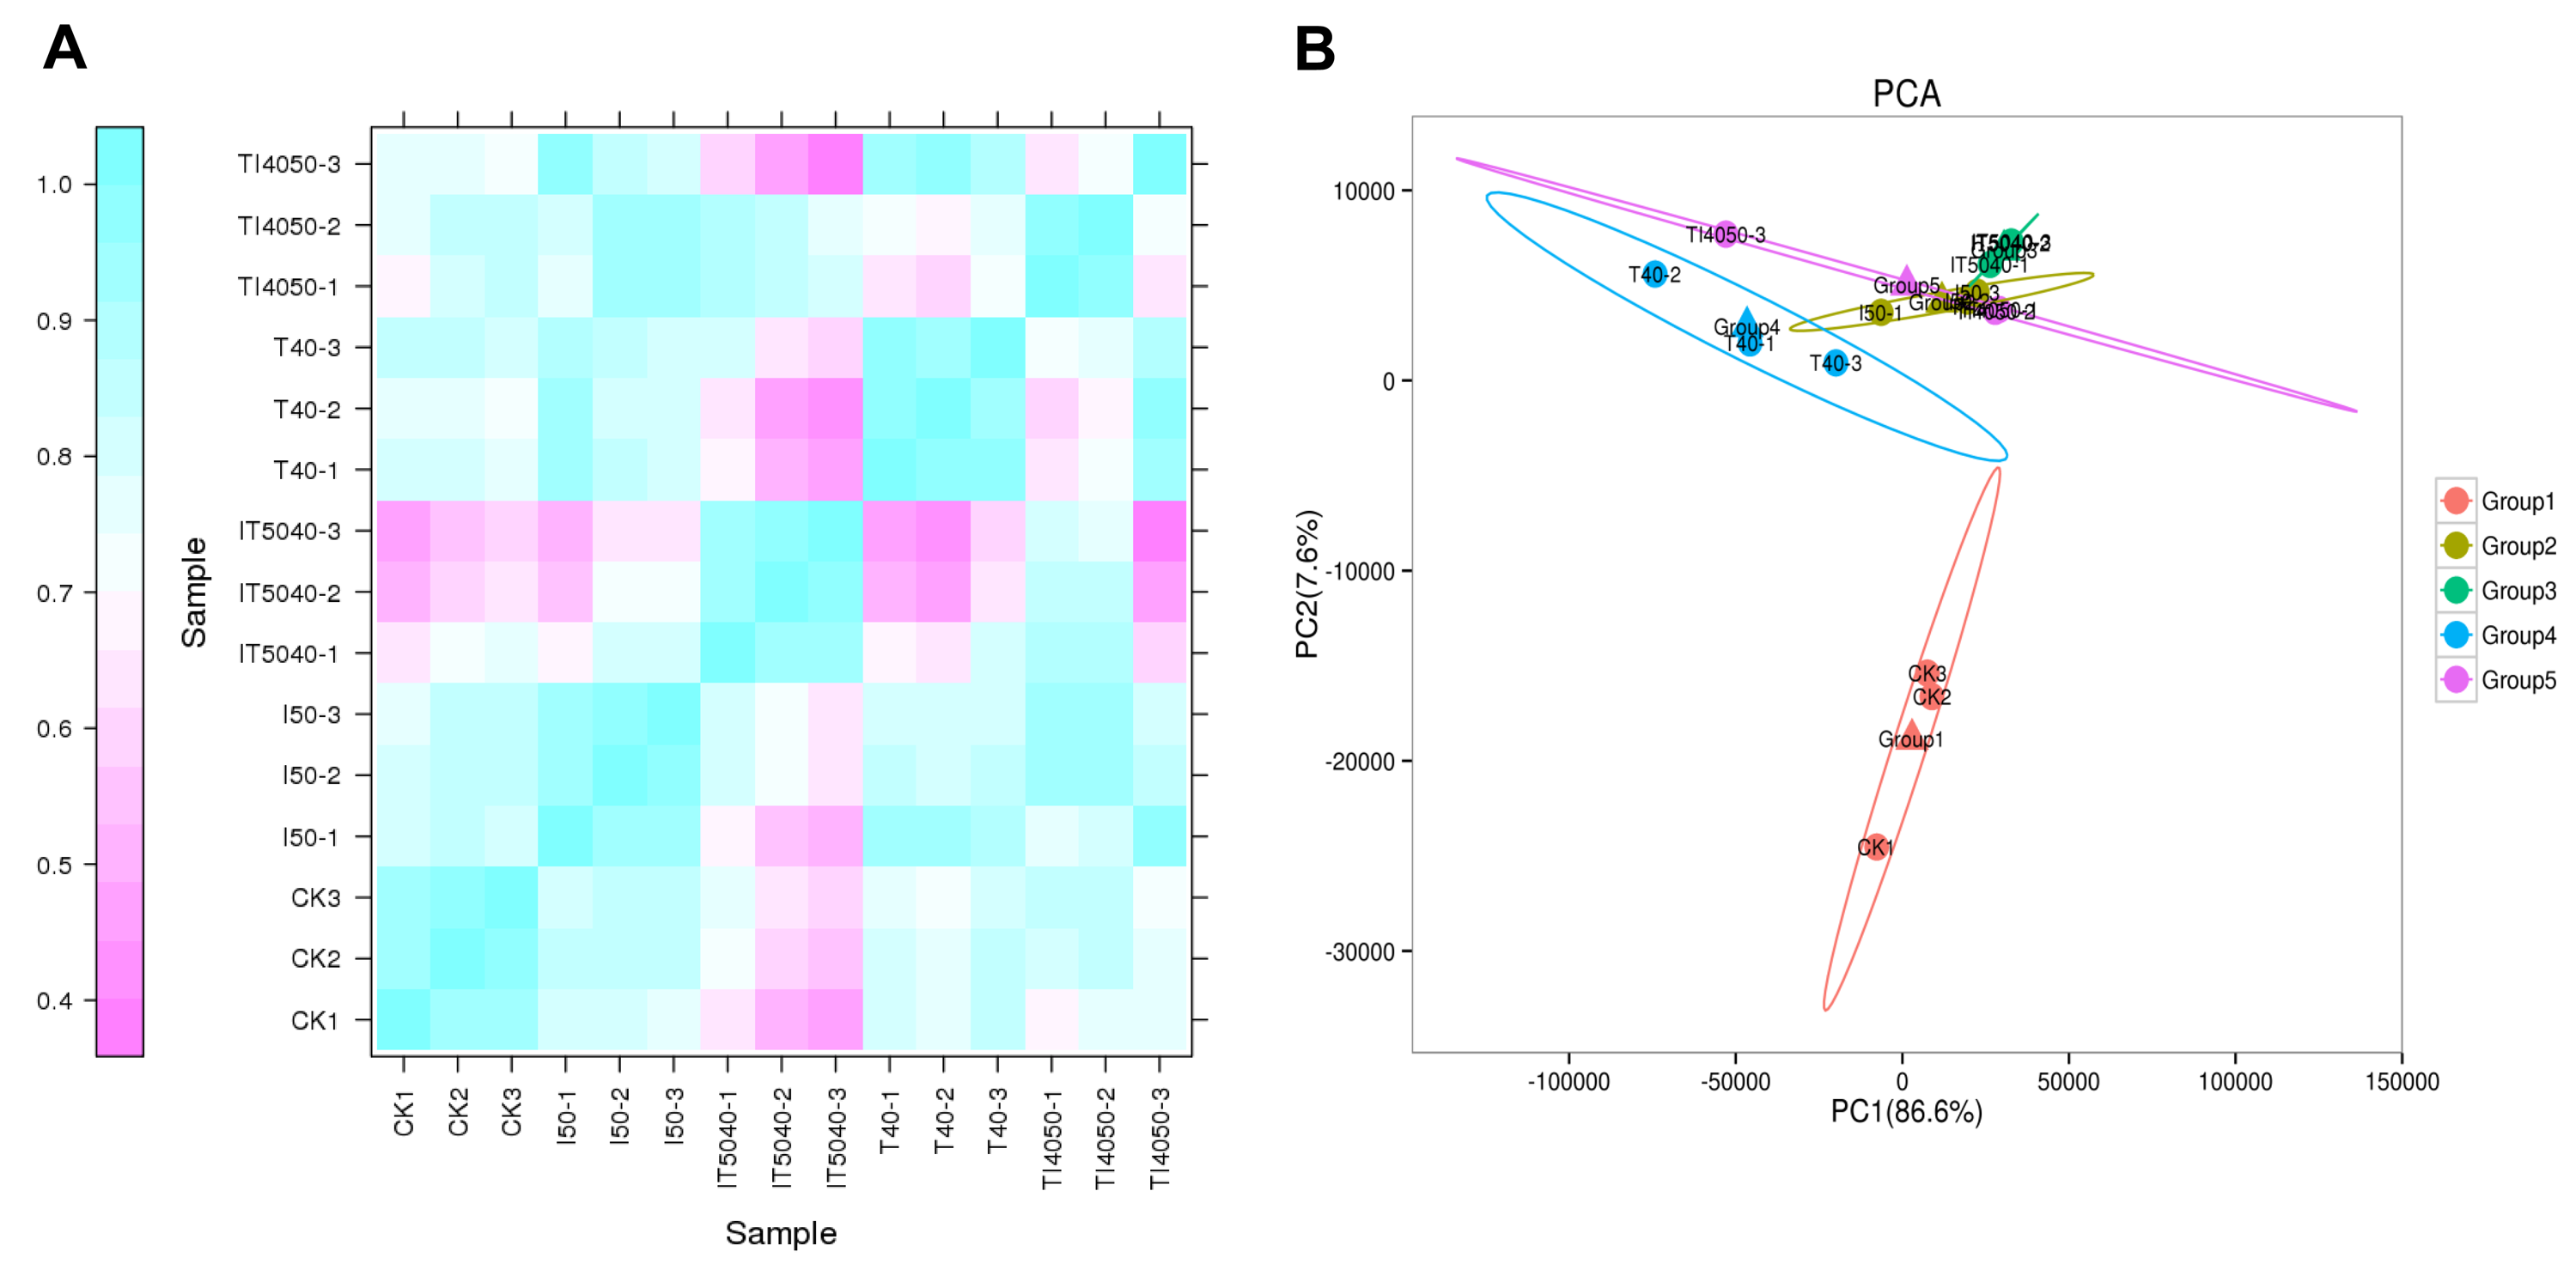
RNA-seq was utilized to quantify gene expression in L. trifolii exposed to high temperature and technical grade abamectin, and a total of 131.75 Gb clean sequence reads were obtained. Data quality assessments showed that the GC content for all samples ranged from 38.16 to 40.22%, and the Q30 values of samples were ≥92.35%, indicating high quality data (Table 1). In total, 120,366 transcripts were generated with a mean length of 1,837.87 bp and a N50 length of 3,248 bp (Table 2). A total of 44,633 unigenes were obtained and the average length and N50 length were 926.89 and 1,953 bp, respectively. To obtain functional information of the assembled unigenes, 5,259, 9,547, 8,232, 11,481, 12,129, 9,813, 16,099, 16,117 unigenes were mapped to seven databases including COG, GO, KEGG, KOG, Pfam, Swiss-Prot, eggNOG and NR for annotation and classification (Table 2). The correlation coefficient of each treatment was very high (Fig. S1A); furthermore, principal component analysis (PCA) with the prcomp function revealed small differences among different treatments (Fig. S1B), indicating that the data were reliable for further analysis.
| Samples | Clean read number | Clean base number | GC content (%) | % ≥Q30 |
|---|---|---|---|---|
| CK-1 | 29,835,217 | 8,946,468,838 | 39.16 | 93.96 |
| CK-2 | 27,827,799 | 8,348,339,700 | 39.03 | 93.69 |
| CK-3 | 27,313,596 | 8,194,078,800 | 39.74 | 93.23 |
| I50-1 | 34,209,580 | 10,248,184,572 | 39.04 | 93.50 |
| I50-2 | 30,759,552 | 9,216,804,292 | 39.74 | 93.78 |
| I50-3 | 33,484,631 | 10,030,303,304 | 39.71 | 93.78 |
| IT5040-1 | 29,132,539 | 8,731,758,270 | 39.67 | 93.69 |
| IT5040-2 | 30,633,036 | 9,160,729,444 | 40.22 | 93.25 |
| IT5040-3 | 27,511,828 | 8,241,322,840 | 40.20 | 93.82 |
| T40-1 | 27,482,085 | 8,231,391,090 | 38.80 | 92.35 |
| T40-2 | 26,830,246 | 8,037,827,870 | 38.19 | 93.52 |
| T40-3 | 27,610,065 | 8,256,723,726 | 39.43 | 93.74 |
| TI4050-1 | 32,497,276 | 9,730,965,446 | 39.84 | 93.55 |
| TI4050-2 | 27,127,828 | 8,125,366,880 | 40.01 | 93.82 |
| TI4050-3 | 27,542,927 | 8,252,081,832 | 38.16 | 93.38 |
Notes:
- CK
-
controls consisting of L. trifolii adults cultured at 25 °C
- I50
-
adults exposed to the LC50 of technical grade abamectin (LC50=39.19 mg L−1)
- IT5040
-
adults exposed to technical grade abamectin followed by 40 °C
- T40
-
adults exposed 40 °C
- TI4050
-
adults exposed to 40 °C followed by technical grade abamectin
| Sequencing/ Annotation | Data summary |
|---|---|
| Total number of transcripts | 120,366 |
| Total number of unigenes | 44,633 |
| Mean length of transcripts (bp) | 1,837.87 |
| Mean length of unigenes (bp) | 926.89 |
| N50 length of transcripts (bp) | 3,248 |
| N50 length of unigenes (bp) | 1,953 |
| COG annotated | 5,259 |
| GO annotated | 9,547 |
| KEGG annotated | 8,232 |
| KOG annotated | 11,481 |
| Pfam annotated | 12,129 |
| Swiss-Prot annotated | 9,813 |
| eggNOG annotated | 16,099 |
| NR annotated | 16,117 |
| All annotated | 17,647 |
Differential gene expression
Pairwise comparison of transcriptomes between treatment and control groups indicated that 2,607, 2,725, 3,714 and 2,020 unigenes were differentially expressed after exposure to the LC50 of technical grade abamectin (CK vs. I50), technical grade abamectin followed by 40 °C (CK vs. IT5040), 40 °C (CK vs. T40), and 40 °C followed by technical grade abamectin (CK vs. TI4050) (Fig. 1A). Compared with the LC50 of technical grade abamectin (I50), the number of differentially expressed genes in the IT5040 and TI4050 treatment were 404 and 77, respectively (Fig. 1B).
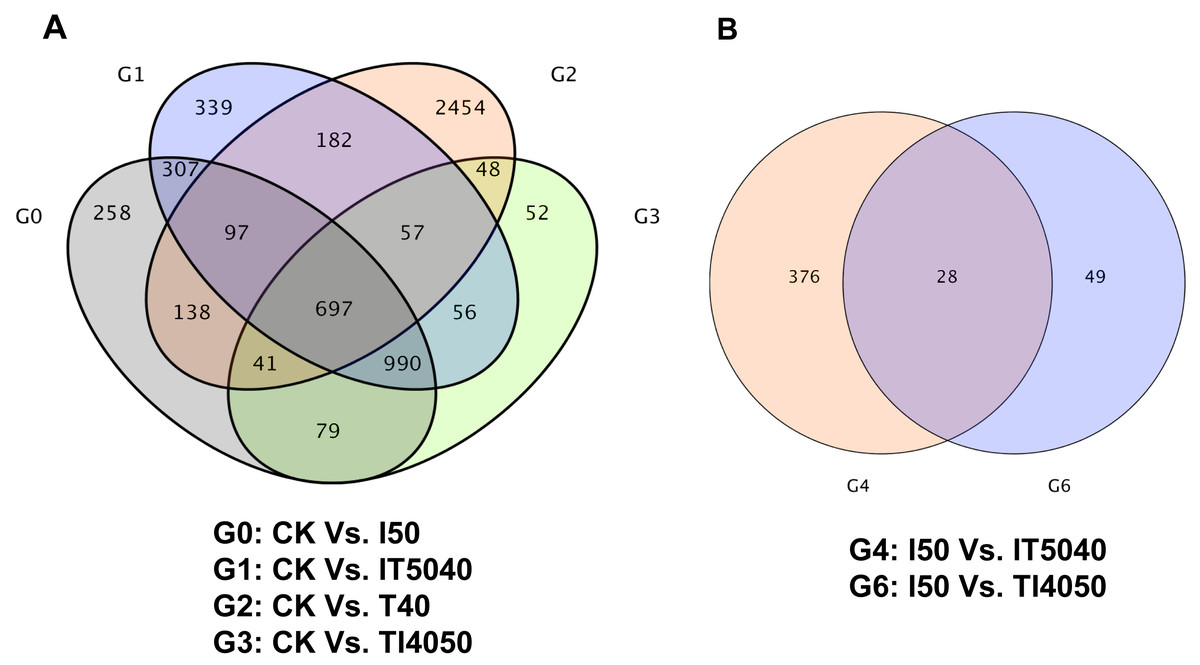
Figure 1: Venn plot of DEGs associated with high temperature and insecticide exposure.
(A) Venn plot of DEGs in CK, I50, IT5040, T40 and TI4050 treatments. (B) Venn plot of DEGs in I50, IT5040 and TI4050 treatments. Abbreviations: CK, control group consisting of adults cultured at 25 °C; I50, adults exposed to the LCLC50 of technical grade abamectin (LC50 = 39.19 mg L−1); IT5040, adults exposed to technical grade abamectin followed by 40 °C; T40, adults exposed to 40 °C; and TI4050, adults exposed to 40 °C followed by technical grade abamectin.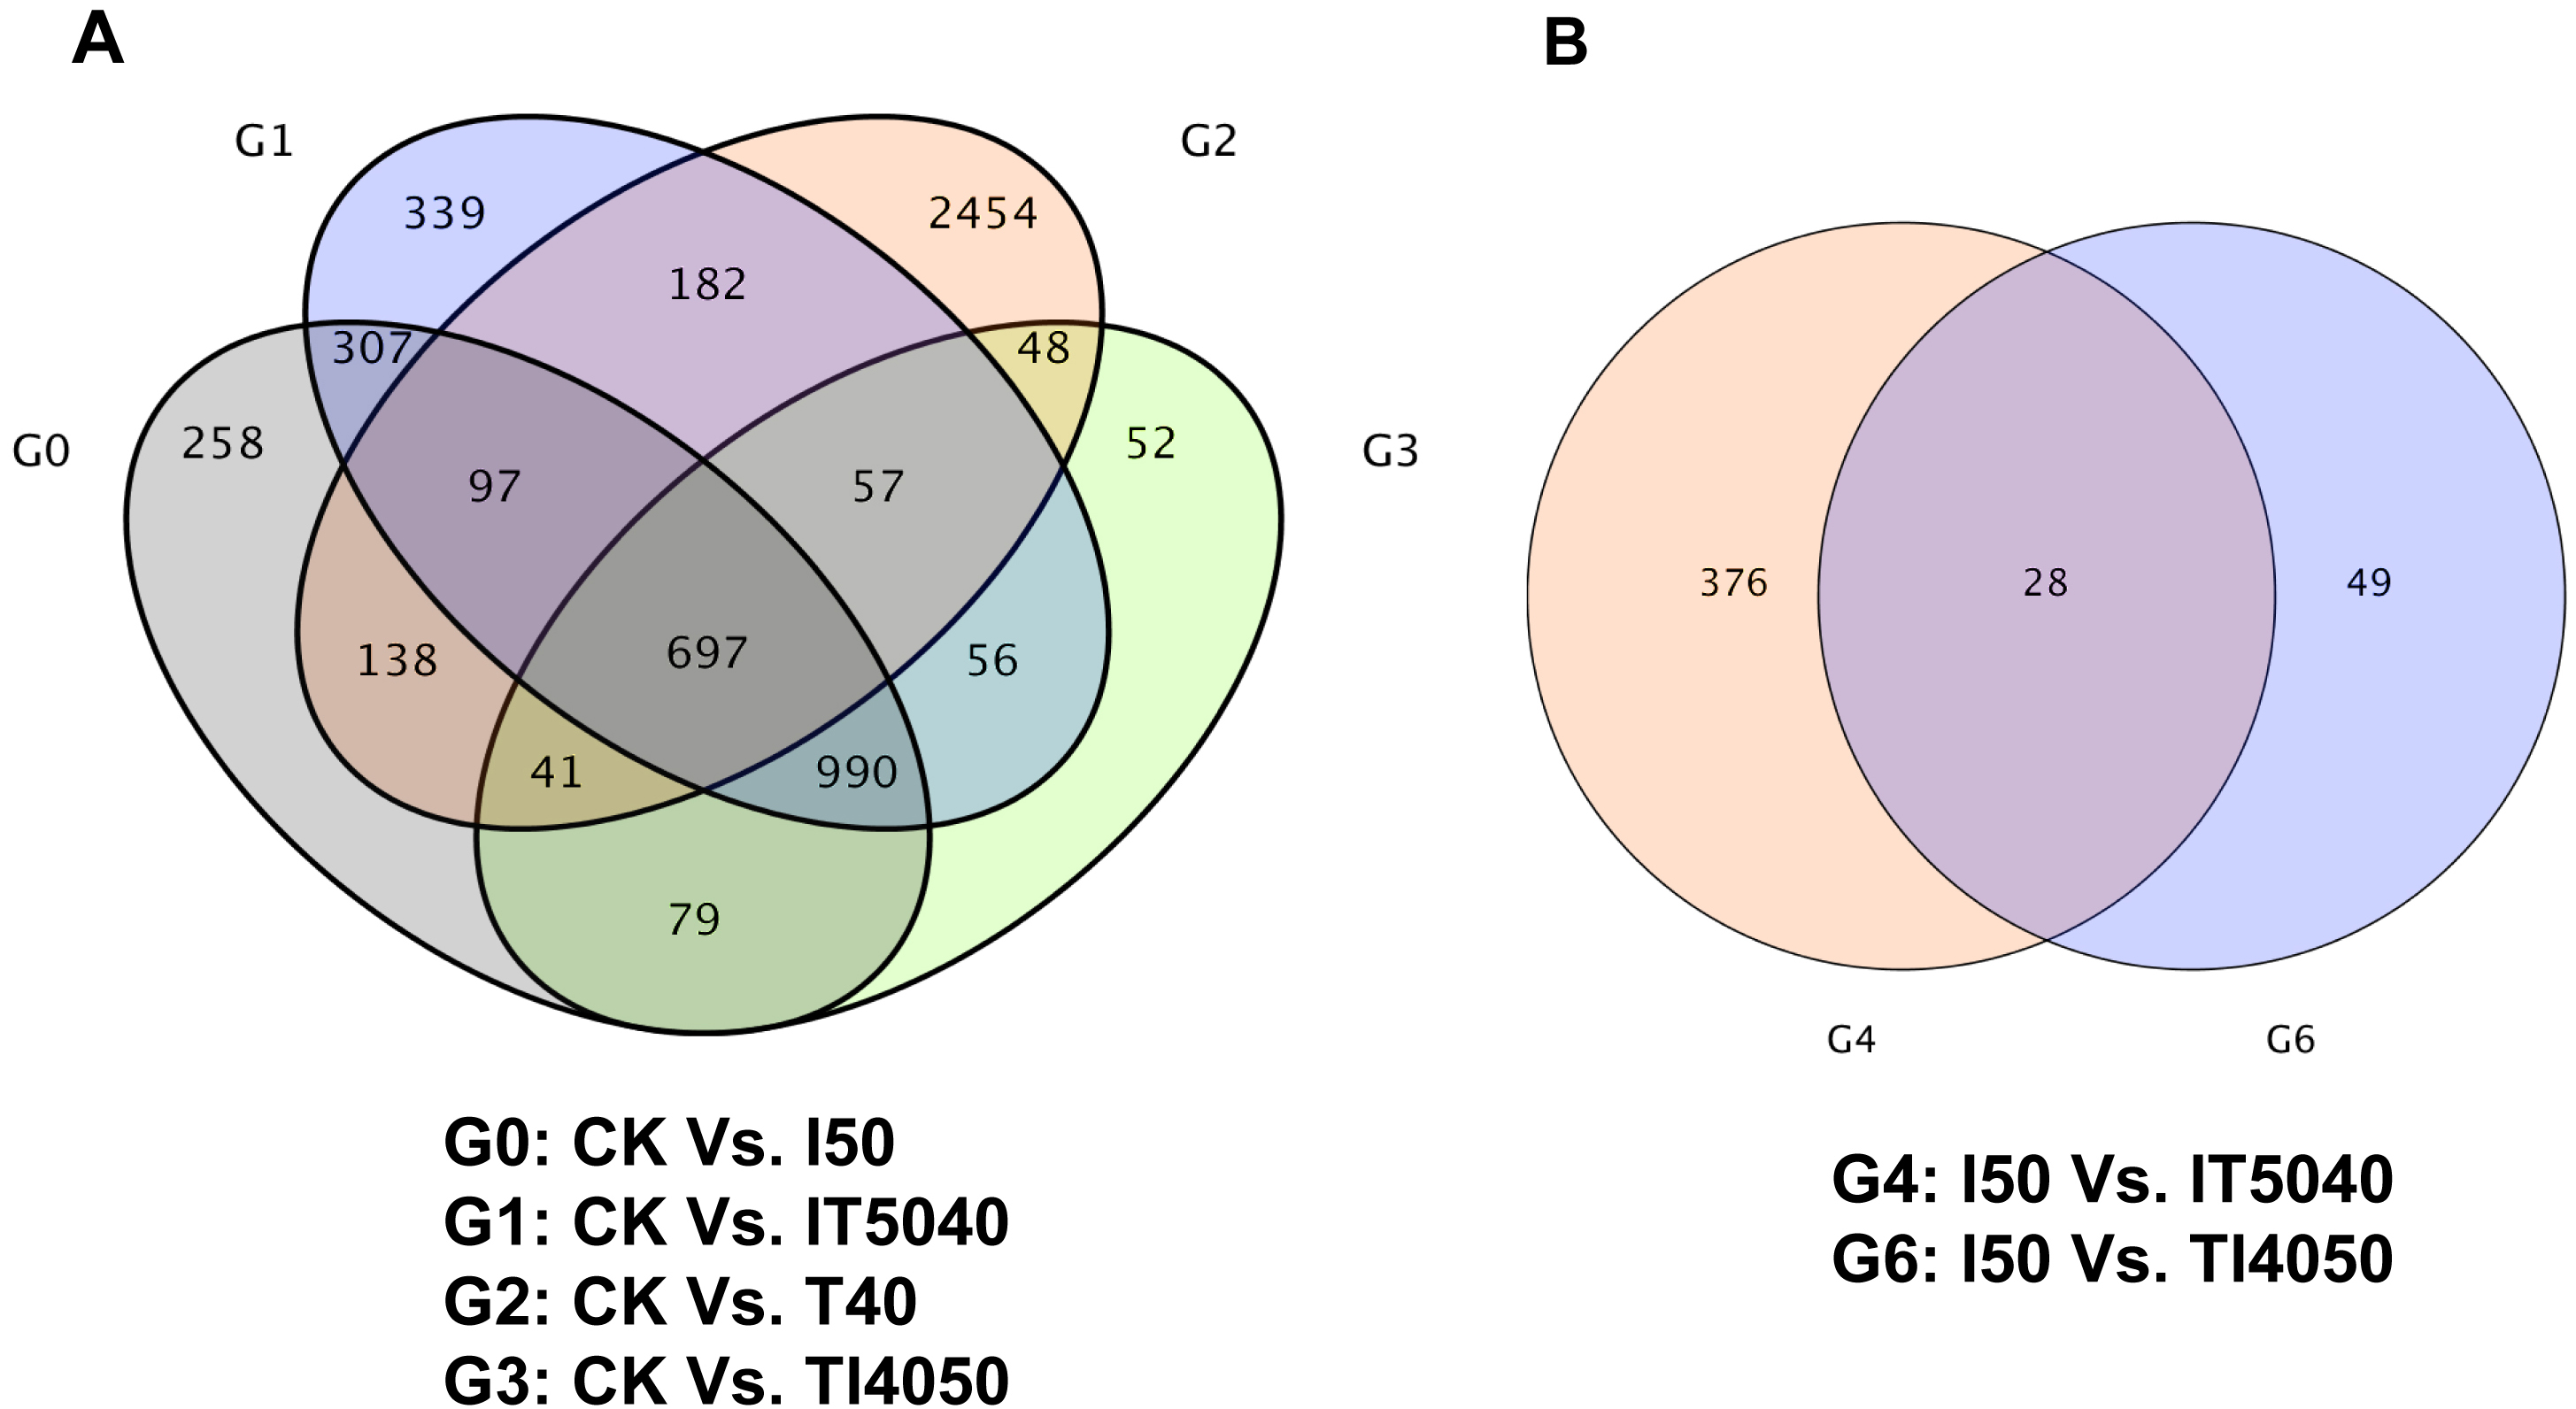
The DEGs were compared to COG and KEGG databases to obtain clues on their physiological roles in the IT5040 and TI4050 treatments compared to the I50 treatment; e.g., I50 vs. IT5040 (Fig. 2) and I50 vs. TI4050 (Fig. 3). In general, the results of the two comparisons were similar in both COG and KEGG databases. The COG classification result showed that ‘post-translational modification, protein turnover, chaperones’ and ‘carbohydrate transport and metabolism’ were the most abundant groups in the 26 categories in pairwise comparisons (Figs. 2A, 3A). Furthermore, DEGs were also involved in ‘general function, prediction only’, ‘energy production and conversion’ and ‘cell wall/membrane/envelope biogenesis’ in the IT5040 treatment (Fig. 2A). In the TI4050 treatment, DEGs were assigned to ‘amino acid transport and metabolism’, ‘lipid transport and metabolism’ and ‘secondary metabolite biosynthesis, transport and catabolism (Fig. 3A). DEGs were classified by searching the KEGG database to further elucidate gene functions (Figs. 2B, 3B). Compared with the I50 treatment, the most enriched KEGG pathway in IT5040 and TI4050 treatments were ‘longevity regulating pathway - multiple species’ and ‘protein processing in endoplasmic reticulum’, respectively.
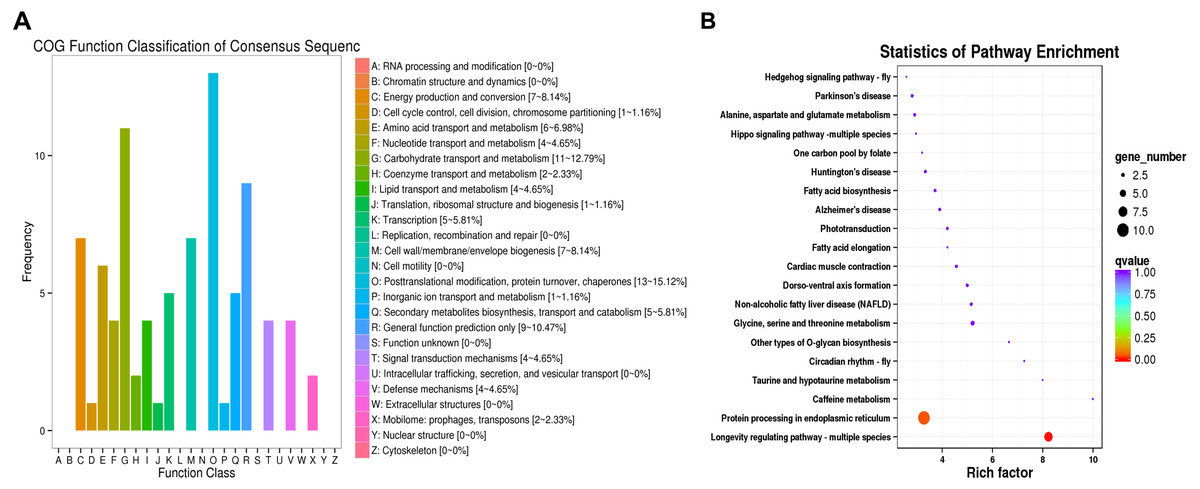
Figure 2: COG functional classifications of DEGs and KEGG enrichment pathways in the comparison of L. trifolii I50 and IT5040 treatments.
(A) The DEGs involved in different COG classifications. The x-axis represents the names of 26 groups, and the y-axis corresponds to the number of unigenes in each group. (B) The top 20 significantly enriched KEGG pathways shown with their q-value (color), enrichment factor (x-axis) and number of DEGs involved (size of circles). Abbreviations: I50, adults exposed to the LC50 of technical grade abamectin (LC50 =39.19 mg L−1); IT5040, adults exposed to technical grade abamectin followed by 40 °C.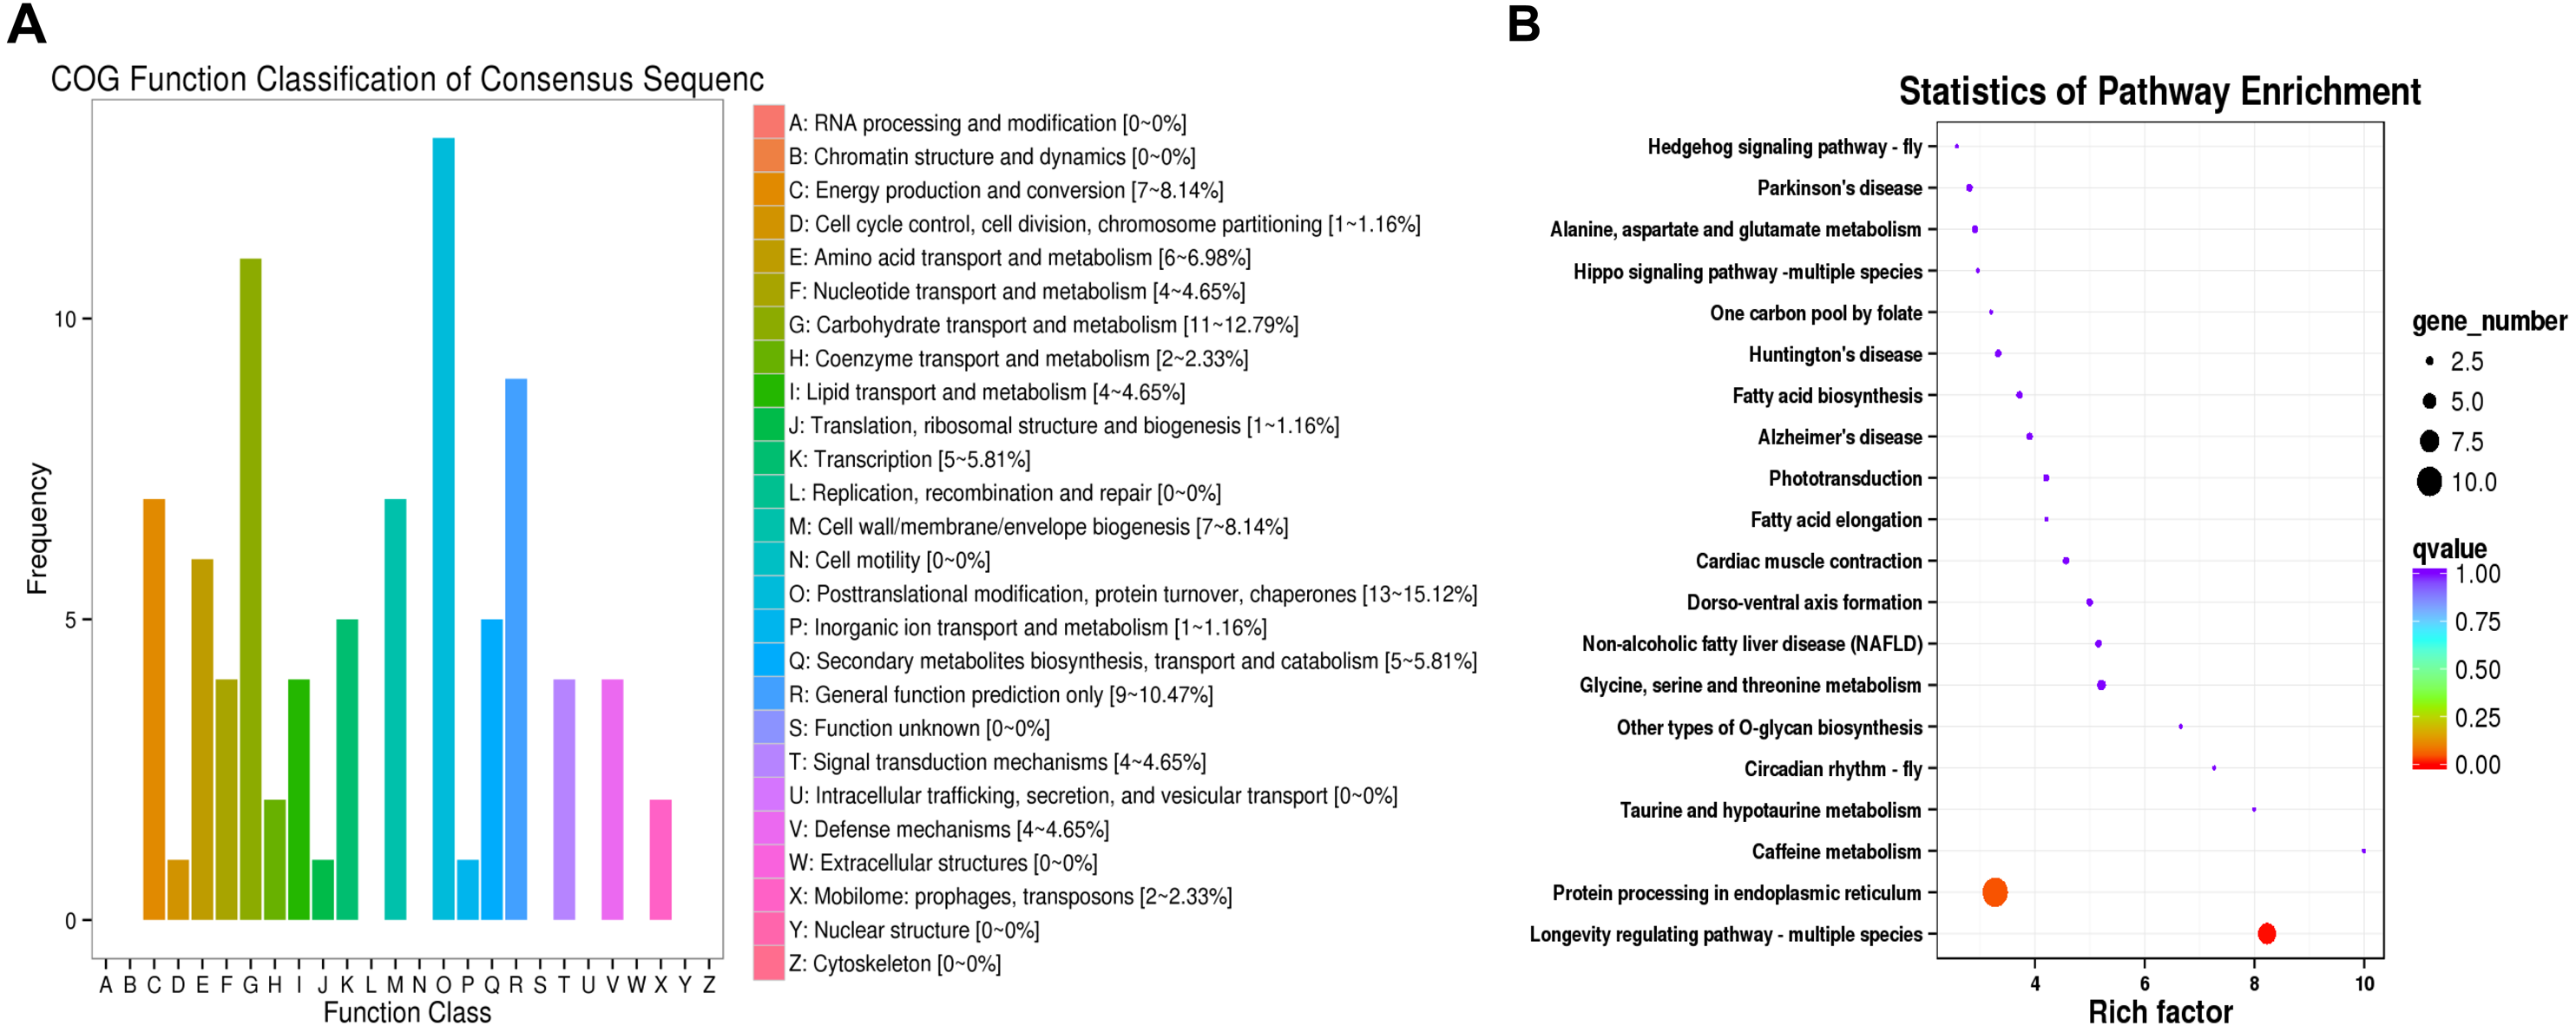
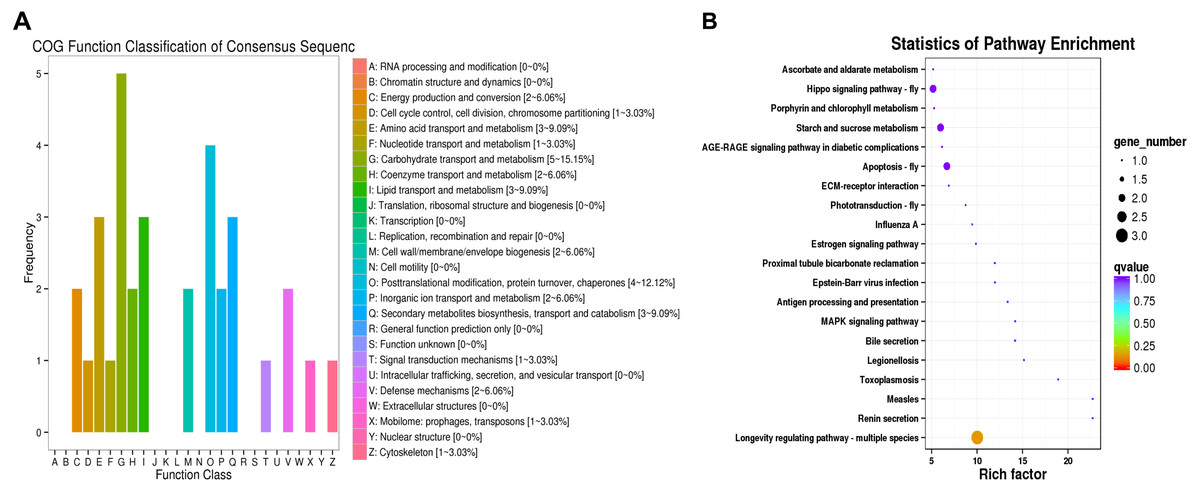
Figure 3: COG functional classifications of DEGs and KEGG enrichment pathways in the comparison of L. trifolii I50 and TI4050 treatments.
(A) The DEGs involved in different COG classifications. The x-axis represents the names of 26 groups, and the y-axis corresponds to the number of unigenes in each group. (B) The top 20 significantly enriched KEGG pathways are shown with their q-value (color), enrichment factor (x-axis) and number of involved DEGs (size of circles). Abbreviations: I50, adults exposed to the LC50 of technical grade abamectin (LC50 =39.19 mg L−1); TI4050, adults exposed to 40 °C followed by technical grade abamectin.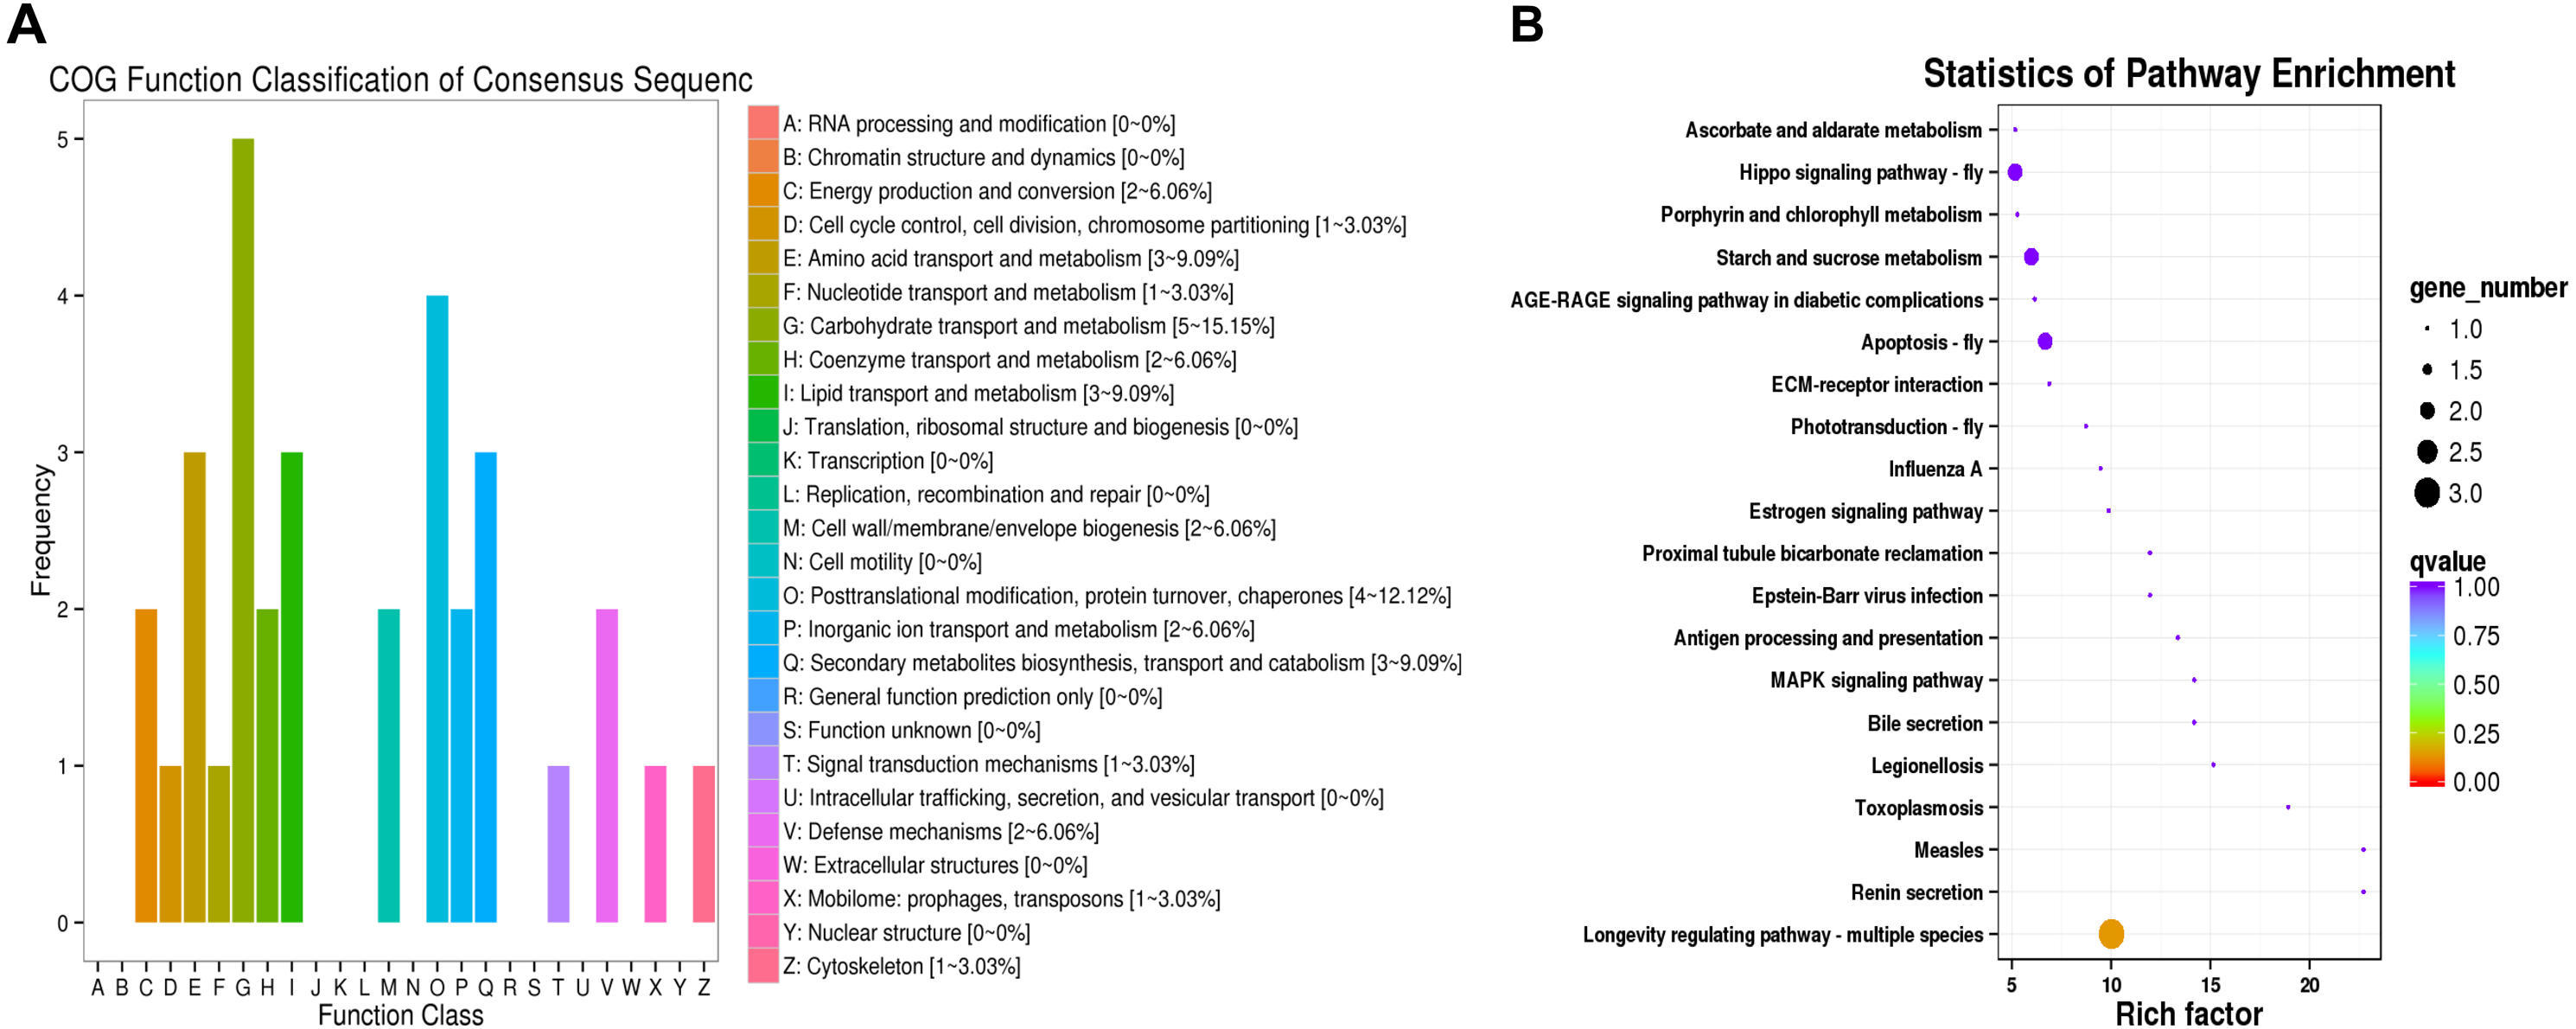
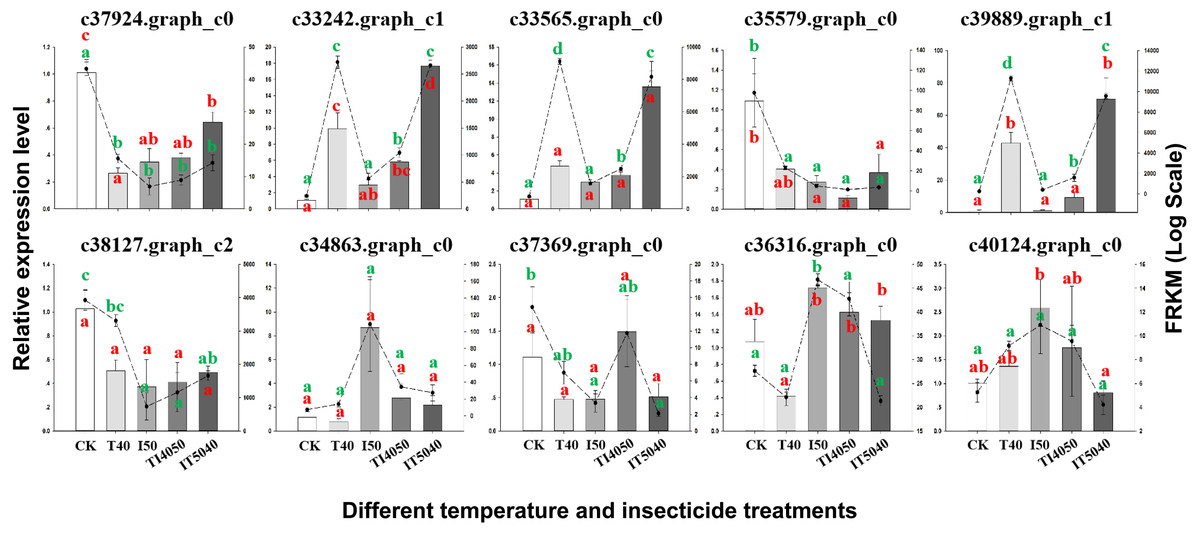
Figure 4: Validation of transcriptome data by RT-qPCR. Histograms indicate relative expression levels of 10 genes by RT-qPCR, and linegraphs indicate expression levels obtained from transcriptome data.
The y-axes indicate log-transformed FPKM values (right) and log-transformed relative expression (left). Means (±SE) were used to determine transcript levels with the 2−ΔΔCt method. One-way analysis of variance (ANOVA) was used to analyze the relative expression levels of DEGs. For ANOVA, data were tested for homogeneity of variances and normality. Green and red lowercase letters indicate significant differences for transcriptome data and RT-qPCR results, respectively. Tukey’s multiple range test was used for pairwise comparison for mean separation (P < 0.05). Abbreviations: CK, controls consisting of adults maintained at 25 °C; I50, exposure to the LC50 of technical grade abamectin (LC50 =39.19 mg L−1); IT5040, exposure to technical grade abamectin followed by 40 °C; T40, exposure to 40 °C; and TI4050, exposure to 40 °C followed by technical grade abamectin.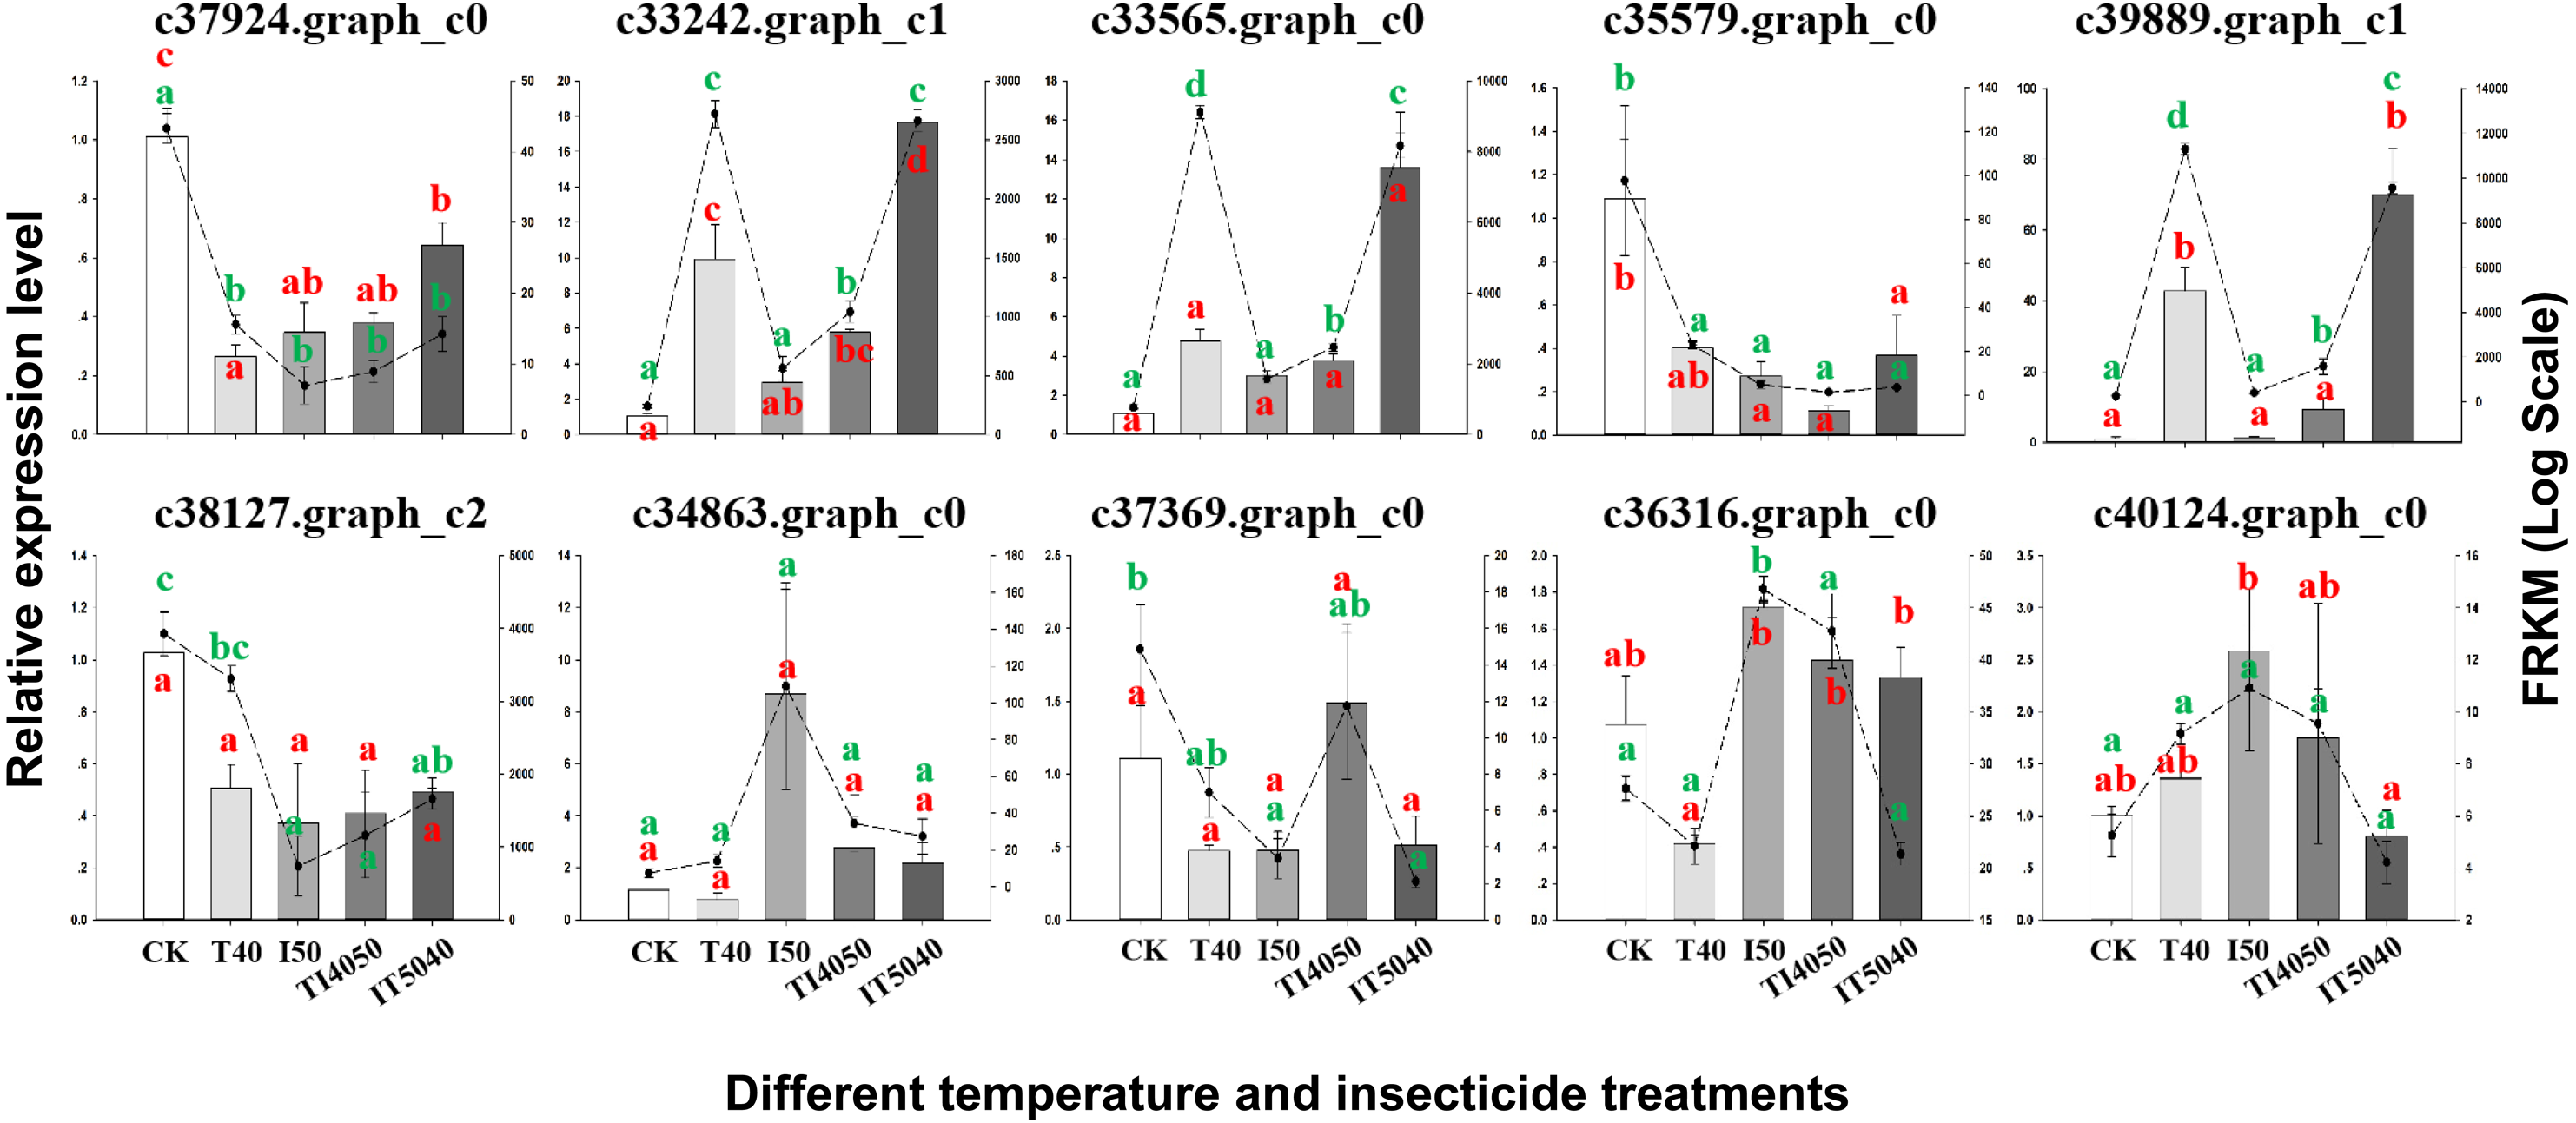
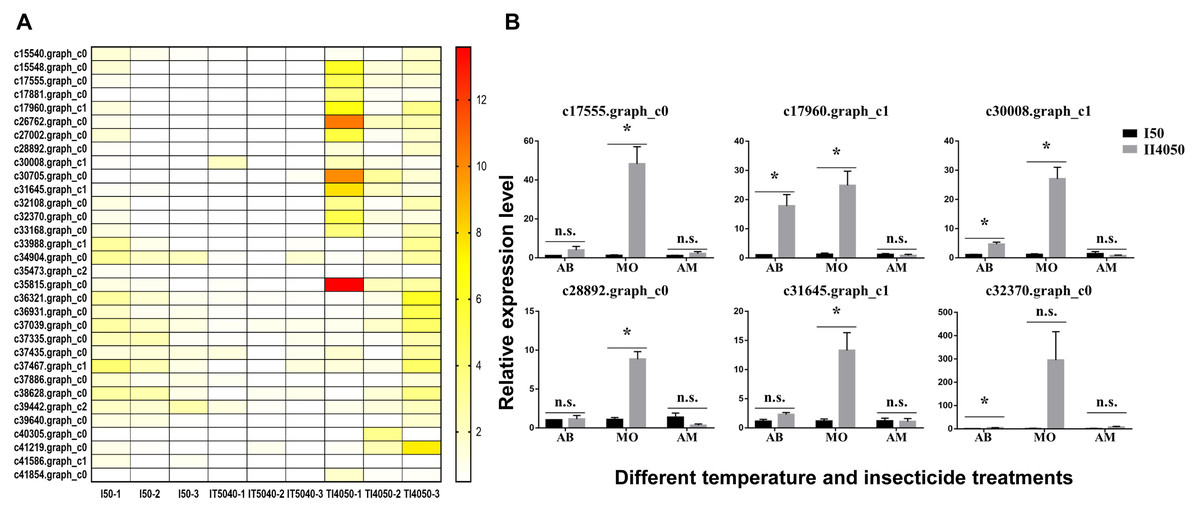
Figure 5: Heat map and expression levels of DEGs with high expression levels in the T14050 treatment.
(A) Heat map of 32 DEGs with higher expression levels in the TI4050 treatment as compared to I50 and IT5040. The color scale from yellow to red indicates log2 transcription ratios from 2 to 12, respectively. Abbreviations: T40, exposure to 40 °C; I50, exposure to the LC50 of technical grade abamectin (LC50 = 39.19 mg L−1); TI4050, exposure to 40 °C followed by technical grade abamectin; and IT5040, exposure to technical grade abamectin followed by 40 °C. (B) Relative expression of six randomly-selected DEGs from Table 3. L. trifolii adults pre-exposed to 40 °C for 1 h were subjected to the LC50 dose of commercial insecticides AB, MO and AM for 72, 24 and 24 h, which were 7.67, 18.73 and 20.27 mg L−1, respectively. Controls consisted of L. trifolii adults exposed to the LC50 of commercial insecticide without temperature exposure. For the ANOVA, data were tested for homogeneity of variances and normality. Asterisk indicates significant difference and n.s. indicates no significant difference among different treatments of each gene. Tukey’s multiple range test was used for pairwise comparison for mean separation (P < 0.05). Abbreviations: I50, exposure to the LC50 of insecticide; IT5040, exposure to insecticide followed by 40 °C; IT4050, exposure to 40 °C followed by insecticide; AB, commercial 3% w/w abamectin; MO, commercial 80% w/w monosultap; AM, commercial 20% w/w microemulsion of 0.2% abamectin + 19.8% monosultap active ingredient.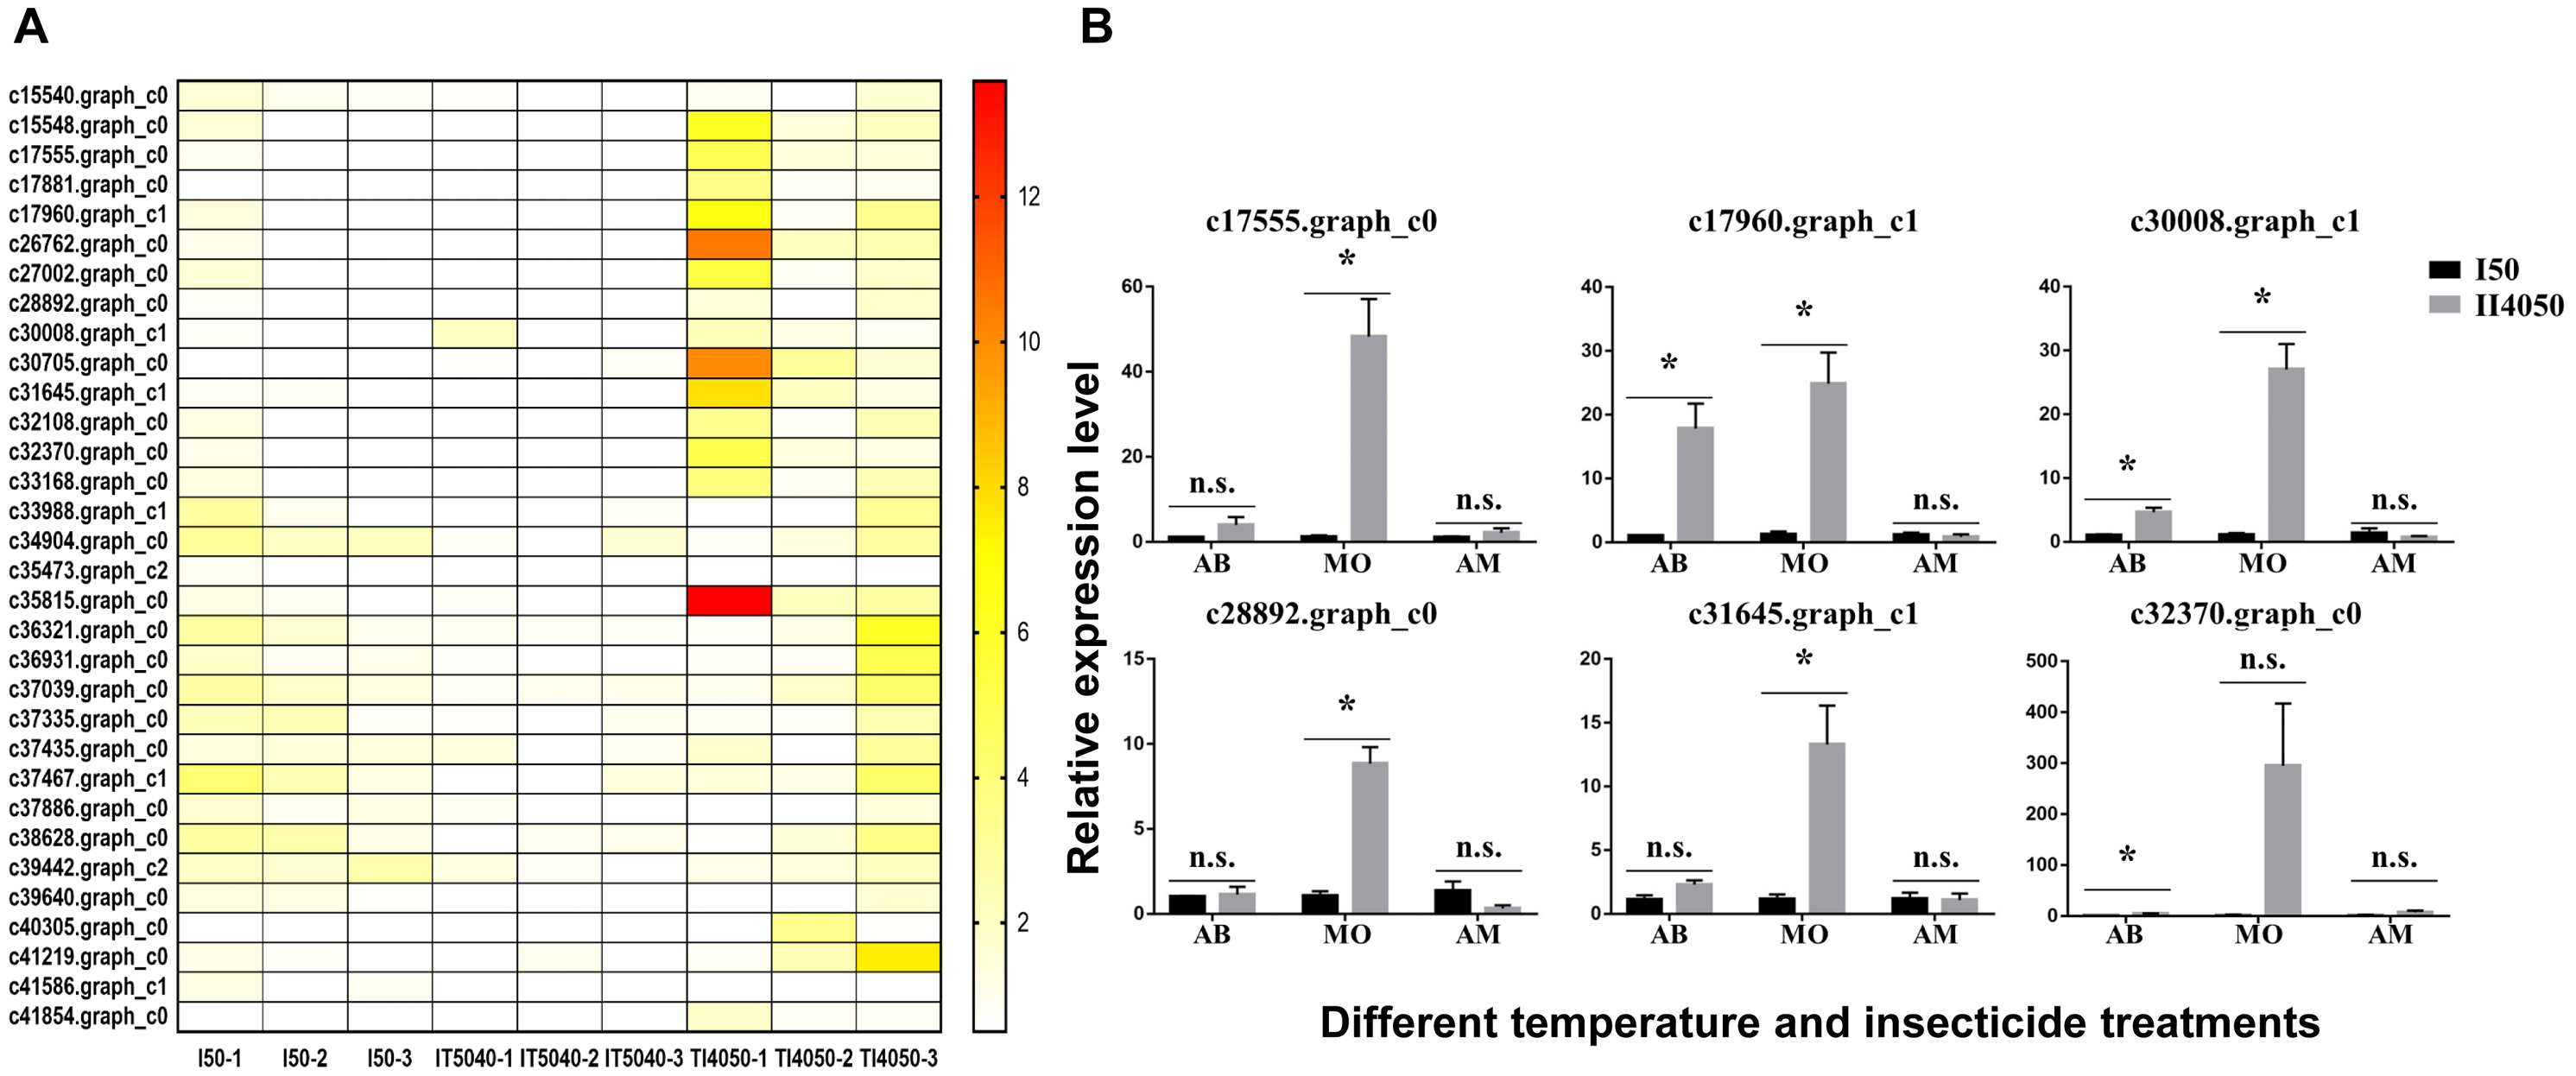
Data validation by RT-qPCR
To confirm the reliability of transcriptome data, 10 DEGs with distinct patterns of expression were selected for validation by RT-qPCR (Fig. 4). After exposure to the IT5040 treatment, expression levels of three DEGs annotated as heat shock proteins (c33242.graph_c1, c33565.graph_c0 and c39889.graph_c1) were significantly up-regulated and more highly expressed than in the T40 treatment. In contrast, there were no significant difference in I50 and TI4050 treatments when compared to the control group. Four treatments (T40, I50, TI4050 and IT5040) caused a significant downregulation in the expression level of DEGs c37924.graph_c0, c35579.graph_c0 and c38127.graph_c2 when compared to the control. DEGs c34863.graph_c0 and c40124.graph_c0 were only induced by the I50 treatment. DEG c37369.graph_c0 only responded to the TI4050 treatment, while other treatments (T40, I50 and IT5040) resulted in lower expression levels than the control. DEG c36316.graph_c0 was slightly down-regulated at 40 ° C but weakly expressed in other treatments (I50, TI4050 and IT5040). In general, the expression patterns of the ten unigenes were similar in both transcriptome and RT-qPCR analyses, which validated the transcriptome data and indicated a high level of congruity in the two different approaches.
Gene expression patterns in response to high temperature and insecticide exposure
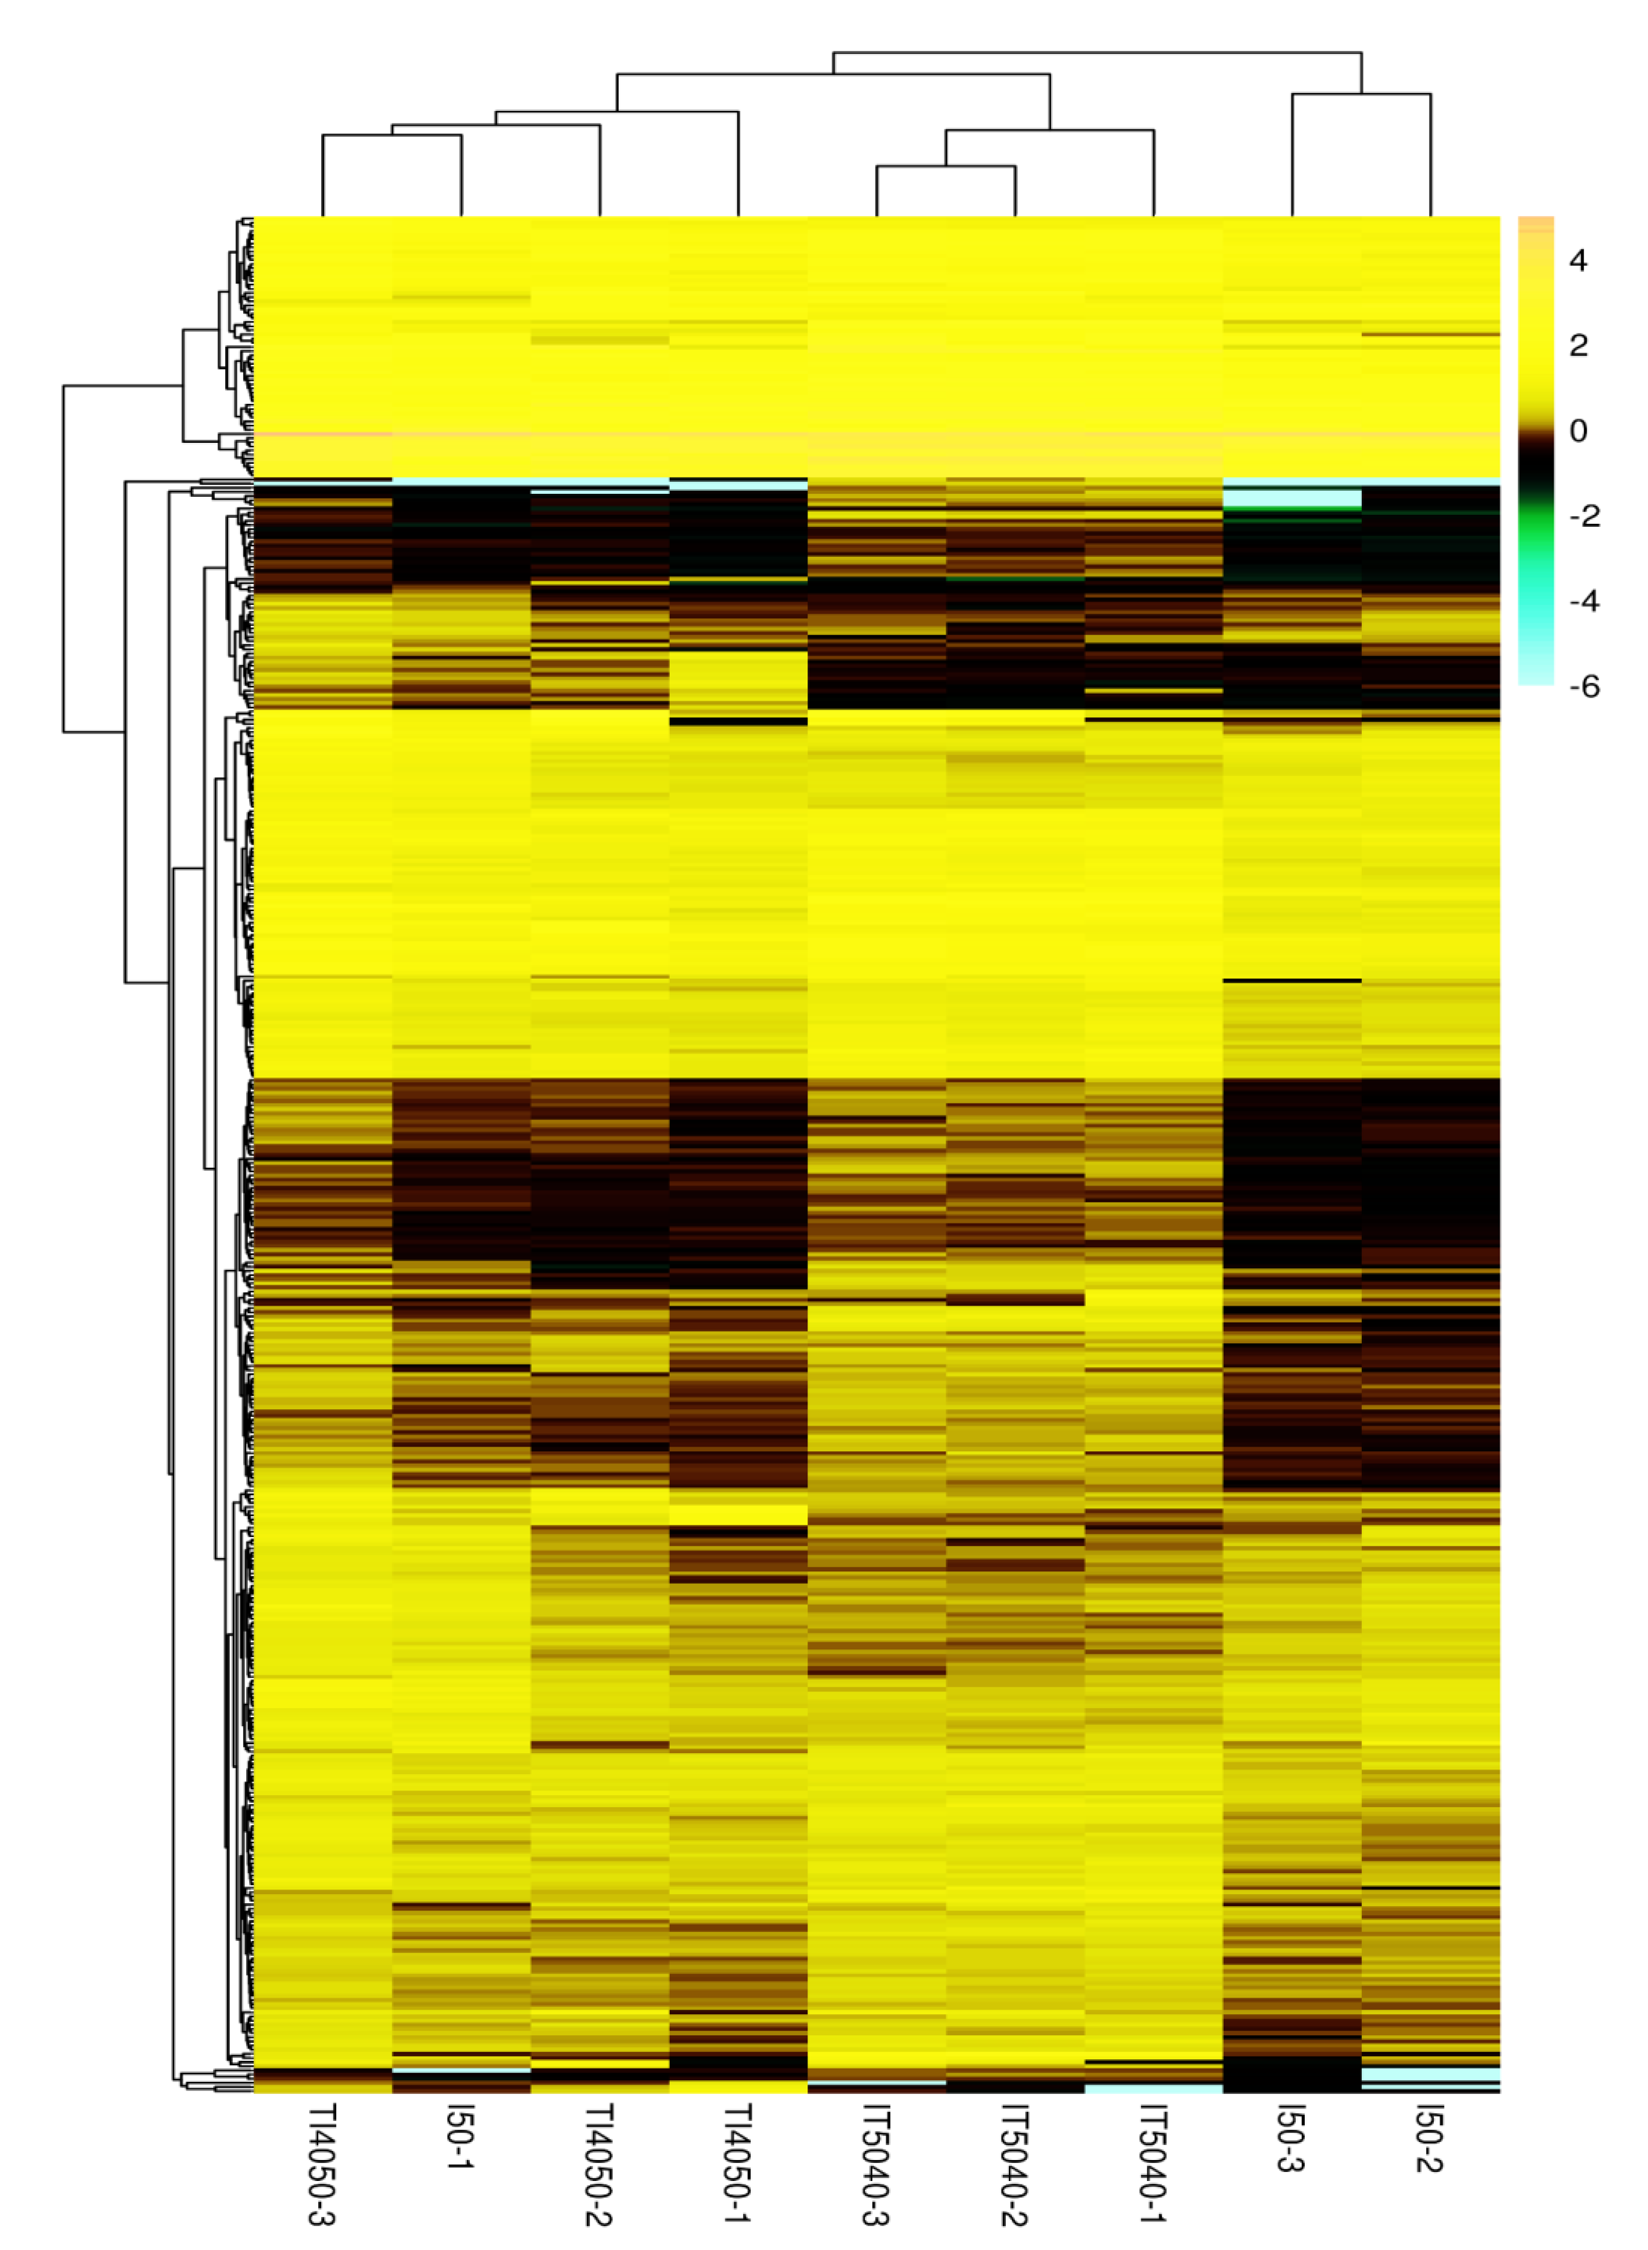
Based on the heat map of differentially expressed genes in the I50, IT5040 and TI4050 treatments (Fig. S2), 32 annotated DEGs were identified in the TI4050 treatment where expression levels were significantly higher than in the I50 and IT5040 treatments (Fig. 5A). The top 20 upregulated (log2) DEGs included genes encoding cytochrome P450 (CYP450), heat shock proteins (HSPs), aquaporin (AQP), and catalase (CAT); these genes likely function in response to insecticide after exposure to 40 °C (Table 3).
| #ID | FDR | log2 FC | Swissprot annotation | |
|---|---|---|---|---|
| 1 | c30705.graph_c0 | – | 4.14 | – |
| 2 | c26762.graph_c0 | 0.000313060525333403 | 3.43 | – |
| 3 | c41854.graph_c0 | 0.000316597070596674 | 3.28 | Succinate dehydrogenase [ubiquinone] flavoprotein subunit, mitochondrial |
| 4 | c17881.graph_c0 | 0.000368938000096681 | 3.19 | – |
| 5 | c35815.graph_c0 | 0.000576310862935545 | 3.06 | – |
| 6 | c31645.graph_c1 | 0.00226572843069555 | 2.80 | Aquaporin-5 |
| 7 | c40305.graph_c0 | 0.0313154343493962 | 2.55 | Arylphorin subunit C223 |
| 8 | c32370.graph_c0 | 0.0104207090308188 | 2.46 | Catalase-2 |
| 9 | c30008.graph_c1 | 0.0042381031720795 | 2.43 | Heat shock 70 kDa protein cognate 4 |
| 10 | c41219.graph_c0 | 0.0049303884497016 | 2.34 | Muscle M-line assembly protein unc-89 |
| 11 | c17960.graph_c1 | 0.0123386975545771 | 2.31 | Probable cytochrome P450 508A1 |
| 12 | c17555.graph_c0 | 0.00610986309976063 | 2.28 | Putative cytochrome P450 CYP13A8 |
| 13 | c32108.graph_c0 | 0.0281592104313728 | 2.20 | – |
| 14 | c27002.graph_c0 | 0.0290644126259409 | 2.13 | 40S ribosomal protein S3 |
| 15 | c28892.graph_c0 | 0.0245049334296851 | 2.07 | 5-methyltetrahydropteroyltriglutamate–homocysteine methyltransferase |
| 16 | c33168.graph_c0 | 0.0251593463381544 | 2.02 | S-adenosylmethionine synthase |
| 17 | c15548.graph_c0 | 0.0188095359703062 | 2.00 | Probable 4-coumarate–CoA ligase 1 |
| 18 | c36931.graph_c0 | – | 0.77 | – |
| 19 | c36321.graph_c0 | – | 0.50 | – |
| 20 | c37039.graph_c0 | – | 0.25 | Glycoprotein 3-alpha-L-fucosyltransferase A |
To further explore insecticide tolerance in L. trifolii adults pre-exposed to 40 °C, six genes were randomly-selected from Table 3 and expression levels were measured in response to I50 and TI4050 treatments with three commercial insecticides used for Liriomyza control (AB, MO and AM) (Fig. 5B). In L. trifolii adults exposed to the TI4050 treatment with commercial 3% w/w abamectin, expression levels of the six genes were slightly up-regulated when compared to the I50 treatment, but the difference was only significant for DEGs c17960.graph_c1, c30008.graph_c1 and c32370.graph_c0. After exposure to 40 °C, expression levels of all six DEGs c17555.graph_c0, c17960.graph_c1, c30008.graph_c1, c28892.graph_c0, c31645.graph_c1 and c32370.graph_c0 in response to the LC50 dose of MO showed significant increases, which were 42.69-, 20.4-, 24.8-, 8.26-, 11.56- and 183.45-fold higher than the control (TI4050 vs. I50), respectively. For AM treatments, there were no significant differences in the expression levels of the six genes in I50 and TI4050 treatments, although the TI4050 treatment resulted in a slight increase in the expression levels of DEGs c17555.graph_c0 and c32370.graph_c0 and decreased expression levels for the other four genes relative to the I50 treatment.
Discussion
L. trifolii, an exotic pest that had now spread rapidly throughout the country, often causes outbreaks under high temperature in summer (Lei, Zhu & Zhang, 2007; Xiang, Lei & Wang, 2012; Gao et al., 2017a) and has become difficult to control due to the continuous use of insecticides (Keil, Parrella & Morse, 1985; Leibee, 1988; Devkota et al., 2016). Temperature and insecticide are two of the most important factors affecting distribution, competition and substitution of L. trifolii (Zhou et al., 2001; Kang et al., 2009; Gao et al., 2011; Xiang, Lei & Wang, 2012; Chang et al., 2016). To explore the interaction and synergistic effects of high temperature and insecticide use for L. trifolii, gene expression patterns induced by 40 °C and abamectin were evaluated by a global RNA-seq transcriptomic approach.
In this study, comparative analysis of the transcriptomes obtained from the four treatments and control resulted in 120,366 transcripts and 44,633 unigenes with annotation data; 10 DEGs were randomly selected for validation by RT-qPCR (Fig. 4). Their similar patterns of expression in both transcriptome and RT-qPCR analyses indicated a high level of congruity in the two different approaches and confirmed the reliability of transcriptome data.
The latter were compared with COG and KEGG databases for functional classification and enrichment analysis. COG classification indicated that most of the DEGs were involved in ‘post-translational modification, protein turnover, chaperones’ and ‘carbohydrate transport and metabolism’ in the TI4050 and IT5040 treatments (Figs. 2A, 3A). The results indicated that the regulated pathways in insects differed depending on the sequence of high temperature and insecticide treatment. In the IT5040 treatment, the most abundant pathway was ‘post-translational modification, protein turnover, chaperones’, which works to ensure protein functionality during stressful conditions (Meng et al., 2019). This result is consistent with the abundance of genes encoding HSPs in the L. trifolii transcriptome, which act as molecular chaperones to cope with thermal stress, insecticide exposure and other adverse conditions (Craig, Weissman & Horwich, 1994; Gusev, Bogatcheva & Marston, 2002; Franck et al., 2004; Haslbeck et al., 2005; Jin et al., 2020). In the TI4050 treatment, DEGs were predominantly enriched in ‘carbohydrate transport and metabolism’, which provides energy and substrates for multiple physiological reactions and processes inside cells (Meng et al., 2019). Previous studies demonstrated the inducing effect of insecticides on carbohydrate transport and metabolisms in insects. For example, comparative transcriptome analysis showed that carbohydrate transport and metabolism was significantly enriched in Sitophilus zeamais after fumigation with terpinen-4-ol (Huang et al., 2018; Huang et al., 2019). In addition to promoting insecticide metabolism, carbohydrate transport and metabolism could also maintain osmotic balance during extreme temperatures (Reid et al., 2018; Chang et al., 2020a). Other metabolic pathways induced in the T15040 and TI4050 treatments included ‘amino acid transport and metabolism’, ‘lipid transport and metabolism’ and ‘secondary metabolite biosynthesis, transport and catabolism’; these pathways function to provide energy, maintain fecundity and balance the generation of some proton in organism, which further confer tolerance or resistance to toxic compounds (Ziegler & Van Antwerpen, 2006; Song et al., 2013; Huang et al., 2016; Meng et al., 2019). We speculate that the high temperature pre-exposure in the TI4050 treatment might function to activate detoxification pathways that enabled L. trifolii to cope with insecticide exposure; furthermore, we hypothesize that these detoxification pathways were not fully activated during insecticide exposure in the IT5040 treatment. Similarly, adaptive cross-tolerance to propoxur in larve was also induced by pre-exposing to sublethal tempereture (39 °C) when compared wtih controls (Patil, Lole & Deobagkar, 1996). Mosquitoes reared in warmer insectaries were found to be more competent in tolerating higher virus load (Hurlbut, 1973). These results suggested that high temperature tolerance has a sustained effectiveness in insects. In other words, the pathways associated with insecticide tolerance in L. trifolii were activated by pre-exposure to high temperature and ready to overcome the next insecticide exposure.
Analysis of KEGG pathways showed that DEGs were significantly enriched in the ‘protein processing in endoplasmic reticulum’ category when L. trifolii was exposed to technical grade abamectin followed by 40 °C (IT5040). Endoplasmic reticulum (ER) is a major compartment in biological cell, which is responsible for maintaining protein homeostasis by activating ER stress pathways when organisms were under stress (Wang & Kaufman, 2016; Frakes & Dillin, 2017). Protein processing in endoplasmic reticulum is mainly involved in assisting protein folding or assembly, including Sec23 protein and molecular chaperones HSPs (Wang et al., 2018). Compared with the I50 treatment, the most enriched KEGG pathway in TI4050 treatment was ‘longevity regulating pathway - multiple species’. Regulation of longevity depends on both genetic and environmental factors. Mitochondria are key players in insect lifespan regulation, since they supply the energy (ATP) needed for growth and development (Antebi, 2007; Wang et al., 2019). Moreover, adverse conditions may promote cellular fitness and ultimately longevity via activation of stress defense mechanisms and survival pathways (Chen et al., 2019).
In our previous study, pre-exposure to different high temperatures (35 °C, 37.5 °C, or 40 °C) enhanced insecticide tolerance in L. trifolii adults when compared with the control (25 °C) by reducing insect mortality, increasing NCR activity and stimulating CYP450 gene expression, especially at 40 °C (Wang et al., 2021). Therefore, 32 DEGs with the highest expression level in the TI4050 treatment were identified based on the heat maps of three treatments containing technical grade abamectin, e.g., I50, IT5040 and TI4050 treatments (Fig. 4). The top 20 out of 32 DEGs were mainly stress-responsive and included genes encoding cytochrome P450s, HSPs, aquaporins and catalase; these upregulated genes likely function in response to insecticide after exposure to 40 °C (Table 3). Furthermore, our results suggested that pretreatment with high temperature greatly improved the insecticide tolerance of L. trifolii. This hypothesis was tested by evaluating the expression of six randomly-selected genes in L. trifolii in response to 40 °C and three commercial insecticides (Fig. 5B). Expression of the six genes was slightly up-regulated when insects were exposed to 40 °C followed by treatment with commercial 3% w/w abamectin as compared to the LC50 treatments, but the difference was only significant for three DEGs. After exposure to 40 °C followed by the LC50 dose of 80% w/w monosultap (MO), there was a significant increase in the expression of all six genes relative to the LC50 dose of MO alone. For AM treatments, the expression levels of six genes in 4050 treatment were not significantly different from the control (50 treatment), although the expression levels of DEGs c17555.graph_c0 and c32370.graph_c0 were slightly up-regulated. Our data suggest that insecticide tolerance might be primed by prior exposure to high temperature, which is in keeping with our earlier conclusion (Wang et al., 2021). Previously, Guo et al. (2018) showed that elevated temperatures, especially a moderately-high temperature (31 °C), were responsible for enhancing the tolerance of thiamethoxam in Bemisia tabaci by inducing or the specific activities of detoxication enzyme genes, which is consistent with our results. Similar results with high temperatures and insecticide tolerance were reported in Apolygus lucorum (Meyer-Dur) (An et al., 2020), Agasicles hygrophila (Zhang et al., 2018), and Musca domestica (Scott & Georghiou, 1984).
Evaluation of L. trifolii transcriptomes in the present study supports the contention that high temperatures can enhance tolerance to selected insecticides in L. trifolii. This phenomenon is likely to be a strong competitive advantage of L. trifolii when exposure to complex environment. Therefore, it is important for growers to fully consider the temperature effect on insecticide tolerance in the context of L. trifolii control (Goel et al., 1987; Johnson, 1990; Scott, 1995; Gordon, 2005), and we suggest that applications be avoided during hot afternoon temperatures. Our findings provide a framework for selecting the most effective temperature for insecticide application in managing L. trifolii, which will ultimately reduce the overuse of pesticides.
Conclusion
In this study, we identified and annotated a number of unigenes expressed in L. trifolii undergoing high temperature, insecticide and combined high temperature and abamectin exposure. COG functional classification indicated that DEGs related to ‘post-translational modification, protein turnover, chaperones’ and ‘carbohydrate transport and metabolism’ in the IT5040 and TI4050 treatments were the most abundant groups, respectively. The most enriched KEGG pathways in the TI4050 and IT5040 treatments were ‘longevity regulating pathway - multiple species’ and ‘protein processing in endoplasmic reticulum’, respectively. Stress-related genes such as CYP450s and HSPs were modulated in response to the combined high temperature and insecticide exposure, which warrants further investigation. Our findings furnish supportive evidence for the assumption that elevated temperatures actually inspired the enhancement of insecticide tolerance in L. trifolii by inducing the activities of detoxification genes and pathways and provide a useful information for considering the temperature effect on insecticide tolerance in L. trifolii and improving the application efficiency of insecticides in hot weather, which will ultimately reduce the abuse of pesticides by overuse.
Supplemental Information
Correlation between samples
(A) Pearson correlation coefficients of transcript levels. (B) Clustering of different treatments based on transcriptome profiles by principal component analysis (PCA). Abbreviations: CK, controls where adults were cultured at 25 °C; I50, exposure to the LC50 of technical grade abamectin (LC50 =39.19 mg L−1); IT5040, exposure to technical grade abamectin followed by 40 °C; T40, exposure to 40 °C; TI4050, exposure to 40 °C followed by technical grade abamectin.