Oxygen transport and release of adenosine triphosphate in micro-channels and arterioles in the human microcirculation
- Published
- Accepted
- Subject Areas
- Bioengineering, Biophysics, Biotechnology, Computational Biology, Mathematical Biology
- Keywords
- Oxygen transport, Oxygen transport ATP, viscosity, Hill equation, hemoglobin, cell-free region, cell-rich region, time-dependent, Heme concentration, COMSOL, Maple
- Copyright
- © 2014 Moschandreou
- Licence
- This is an open access article distributed under the terms of the Creative Commons Attribution License, which permits unrestricted use, distribution, reproduction and adaptation in any medium and for any purpose provided that it is properly attributed. For attribution, the original author(s), title, publication source (PeerJ PrePrints) and either DOI or URL of the article must be cited.
- Cite this article
- 2014. Oxygen transport and release of adenosine triphosphate in micro-channels and arterioles in the human microcirculation. PeerJ PrePrints 2:e443v3 https://doi.org/10.7287/peerj.preprints.443v3
Abstract
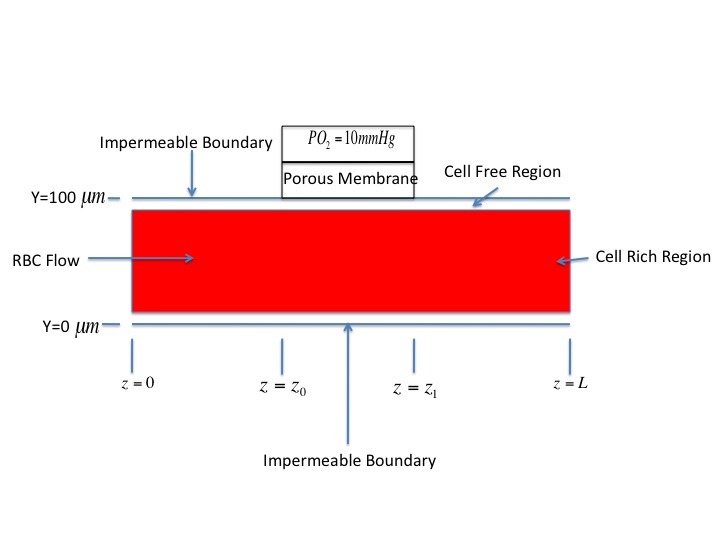
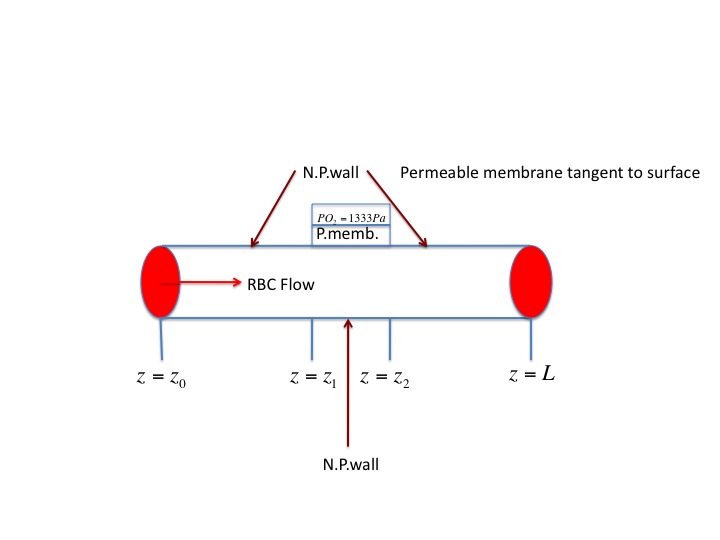
The governing nonlinear equations for oxygen transport and ATP concentration in a microfluidic channel and tube are solved with the aid of Maple and COMSOL Multiphysics simulation software. Considering a cell-rich and cell free region with RBCs and blood plasma, we obtain results showing clearly that there is a significant decrease in oxygen tension in the vicinity of an oxygen permeable membrane placed midway on the upper channel/tube wall and to the right side of it in the downstream field. The purpose of the membrane is to cause a rapid change in oxygen saturation as RBC’s flow through channel/tube. To the right of the membrane downstream the greatest amount of ATP is released. Finally the corresponding time-dependent oxygen transport problem for plug flow in a channel, which has not been simulated in previous models in the literature, is analyzed and different starting times are shown for ATP release at different points in the channel. The FE modelling is very accurate: The time evolution problem is modelled and solved in it`s entirety with exact parameters used in the literature for blood flow and oxygen transport in the microcirculation. A comparison is made between the steady state and time dependent solutions in order to validate the results. The implications of the time dependent model for biological systems such as the human microcirculation requires exact information on release of energy as ATP is released from blood cells and the present work is important in providing this information.
Author Comment
This submission is intended to replace previous submission to PeerJ preprints and also includes comments (as supplementary file upload) from reviewers as paper was submitted to PeerJ and was not accepted for publication. The reviewers comments have now been taken into consideration and changes have been made to make the present submission suitable for publication in PeerJ preprints if approved. New results are now included as new figures have been uploaded.
Supplemental Information
Figure 1
Geometry of mathematical model used for channel flow.
Figure 2B
Geometry of model used for tube flow with membrane
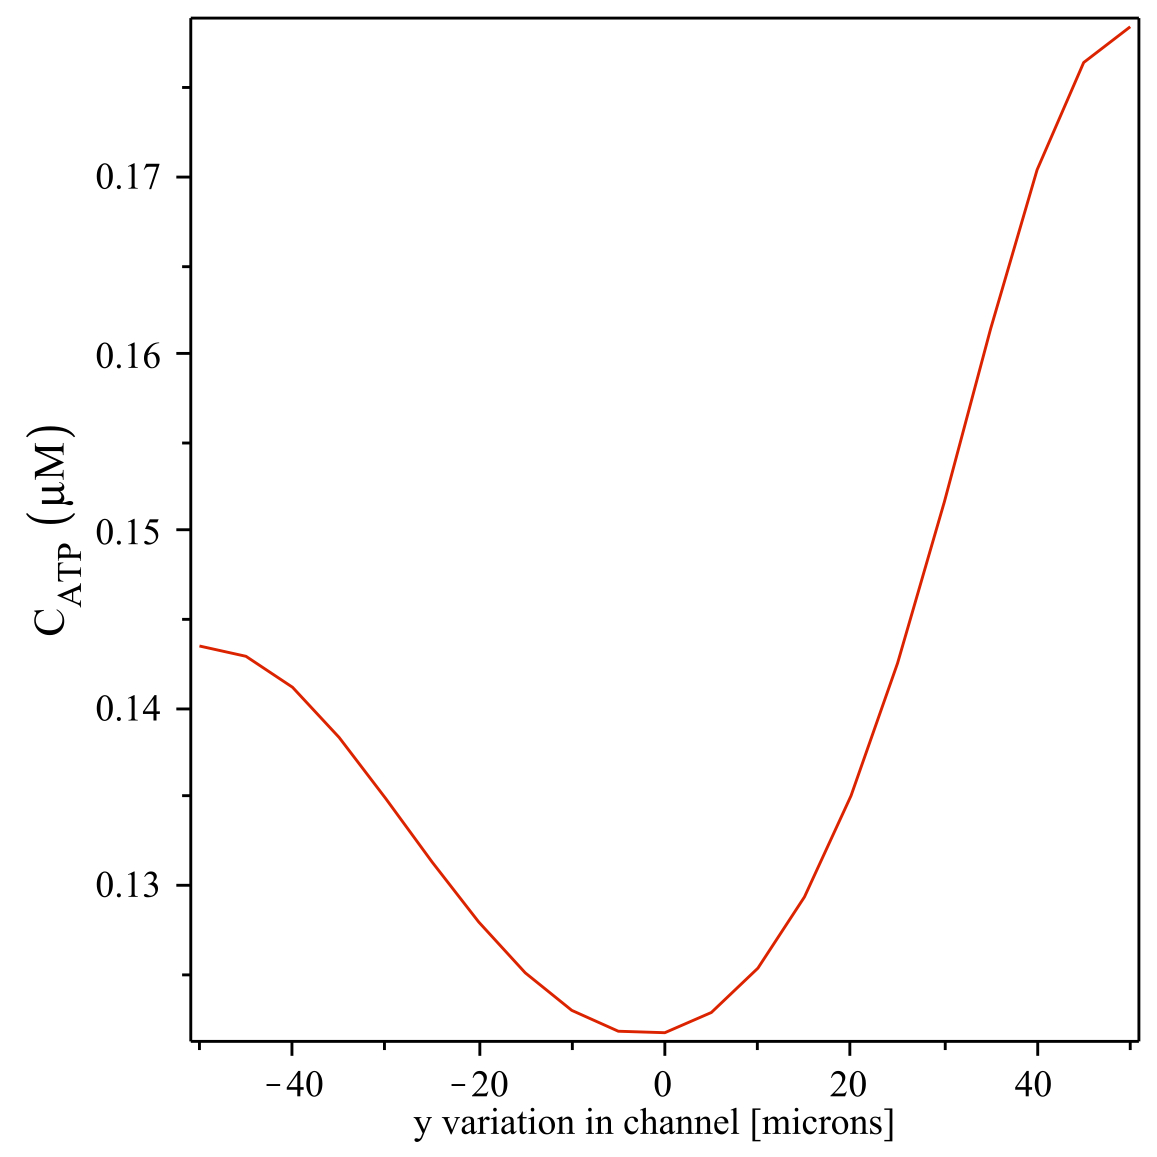
Figure 3-A-1
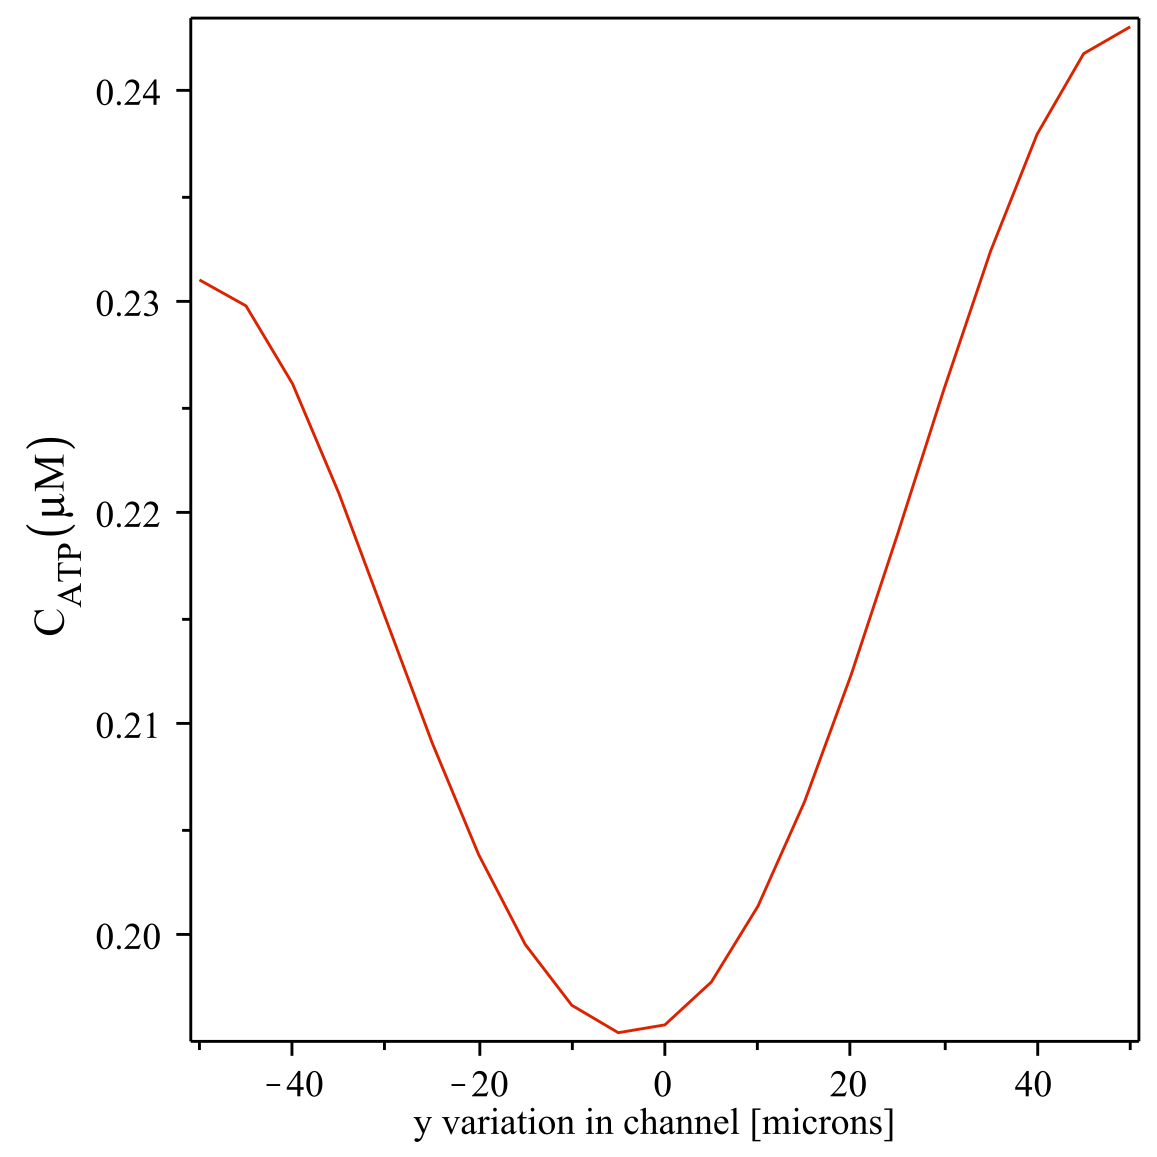
ATP concentration versus y variation in channel at right end of permeable membrane.
Figure 3-A-2
ATP concentration versus y variation in channel, 3mm right and downstream of the end of permeable membrane.
Figure 3-A-3
ATP concentration versus y variation in channel, 6mm right and downstream of the end of permeable membrane
Figure 3-B
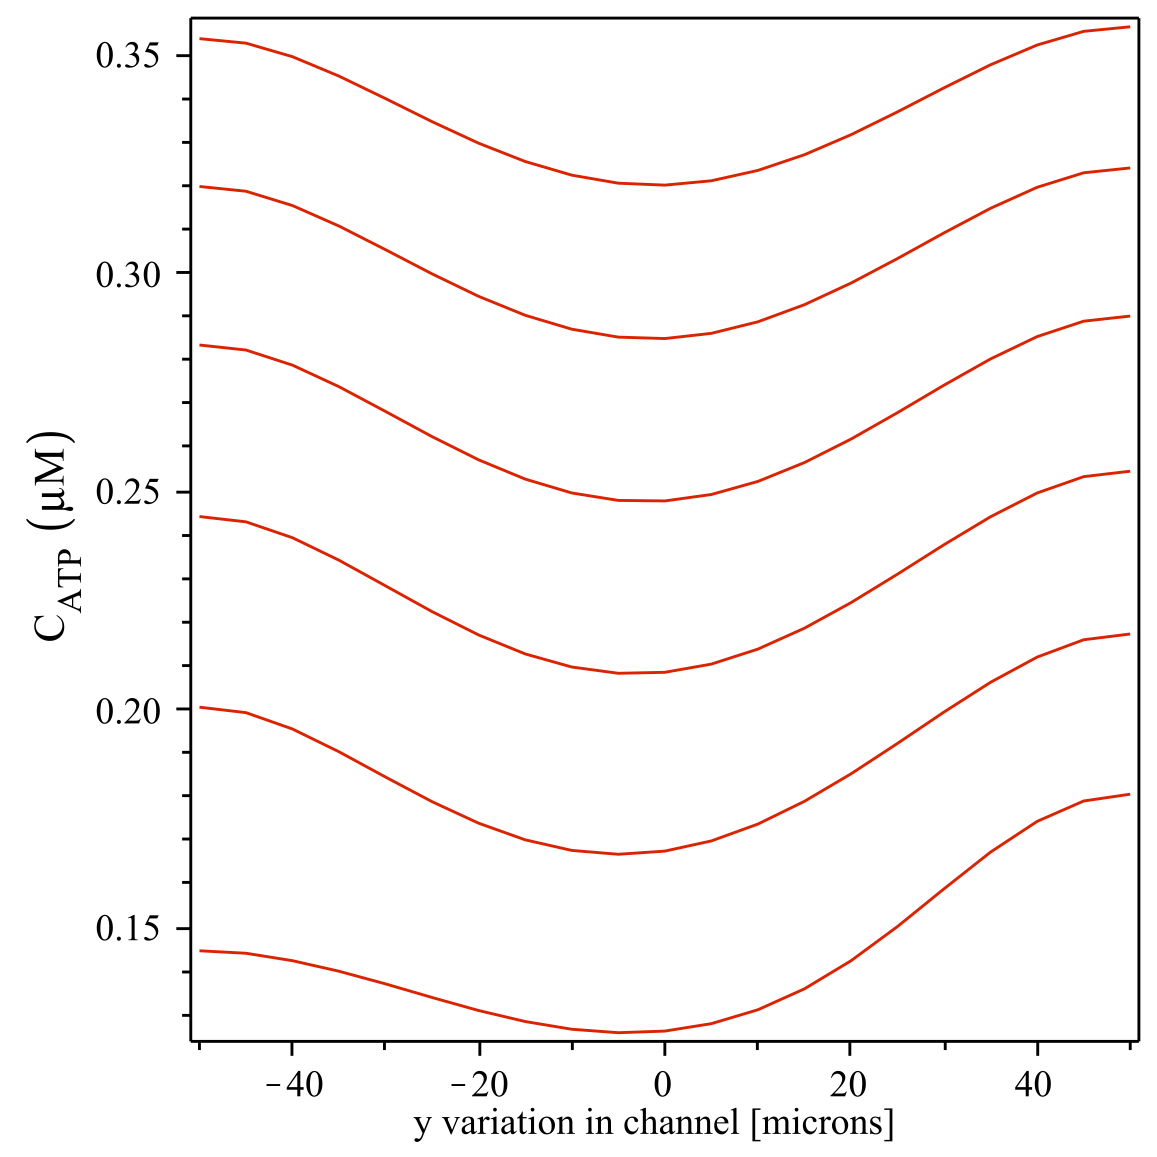
ATP concentration versus y variation in channel from membrane to far downstream from right end of membrane.
Figure 3-C
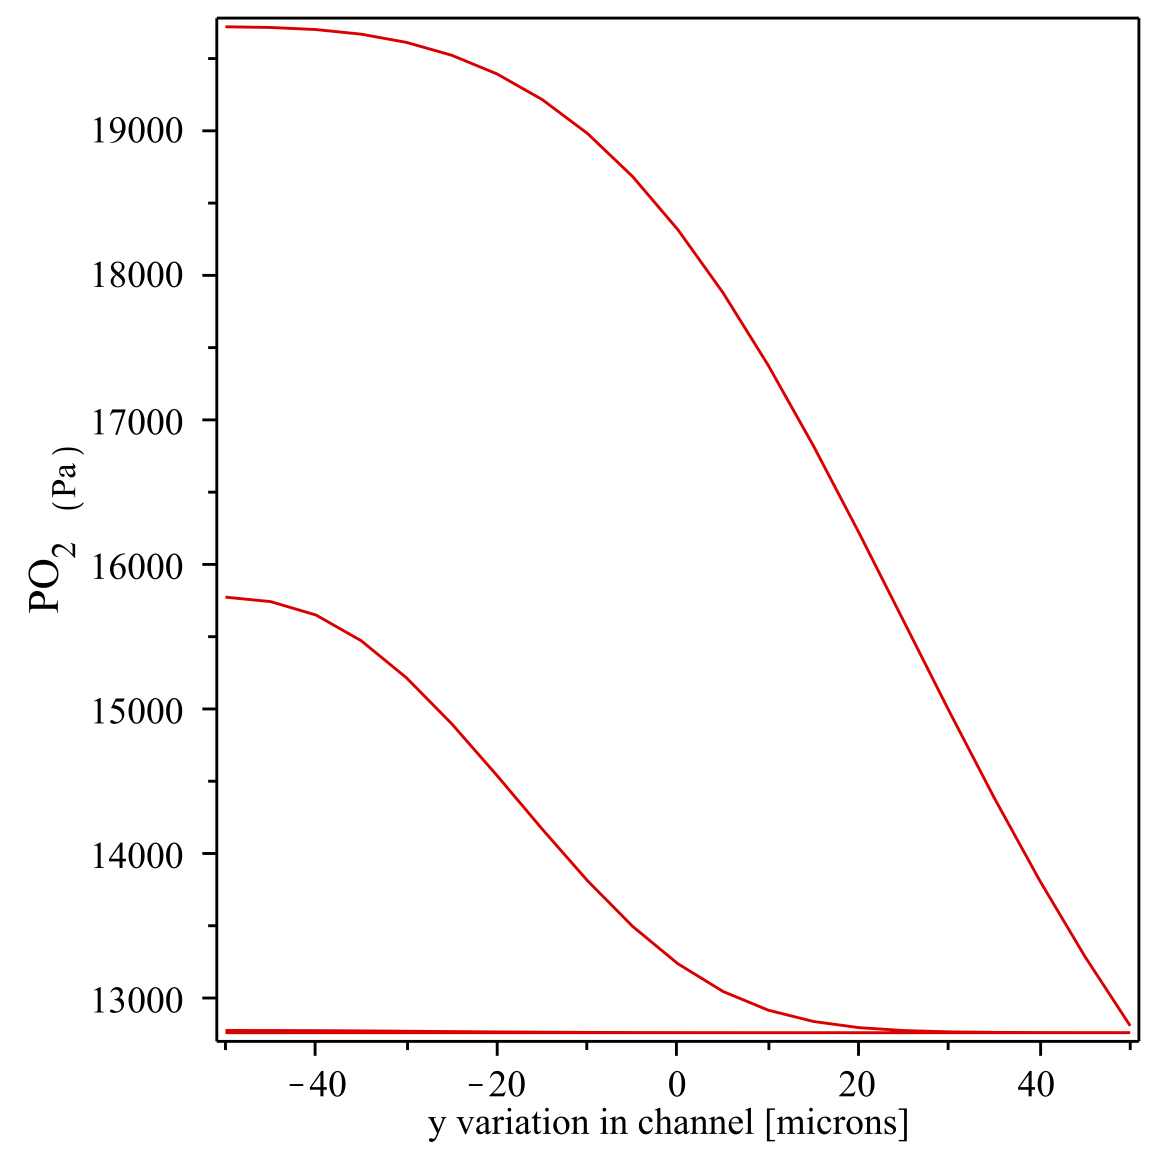
Oxygen tension versus y variation from membrane to downstream location in channel.
Figure 4
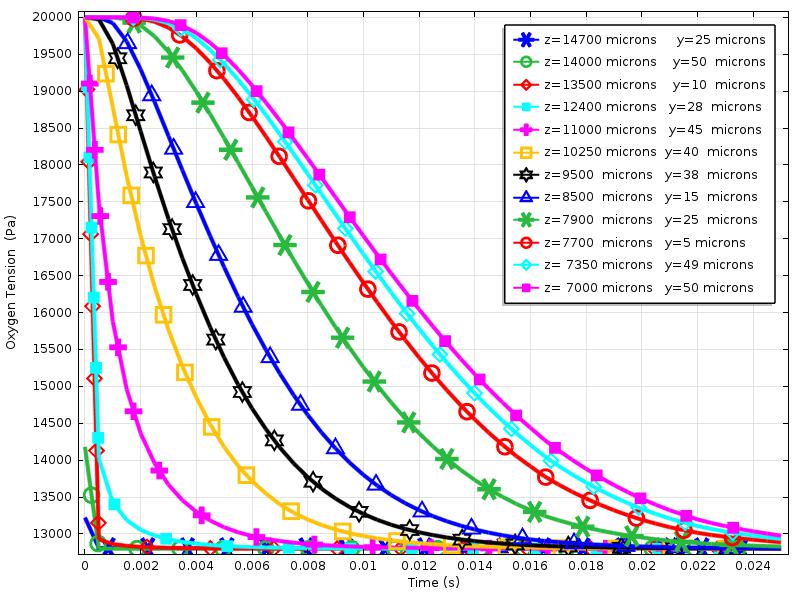
Oxygen tension versus time in seconds near permeable membrane and downstream from right end of membrane. t various locations downstream.
Figure 5
Oxygen tension distribution in channel for present study, at time t=5e-5 seconds.
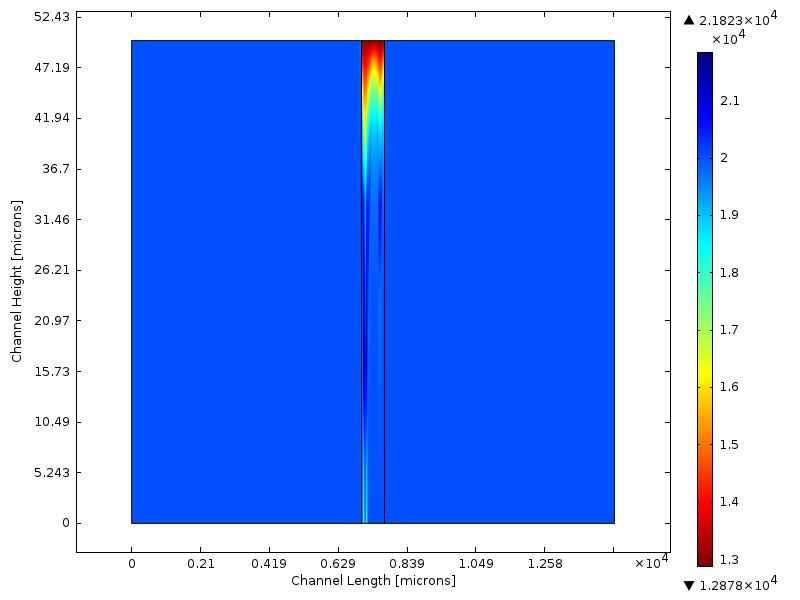
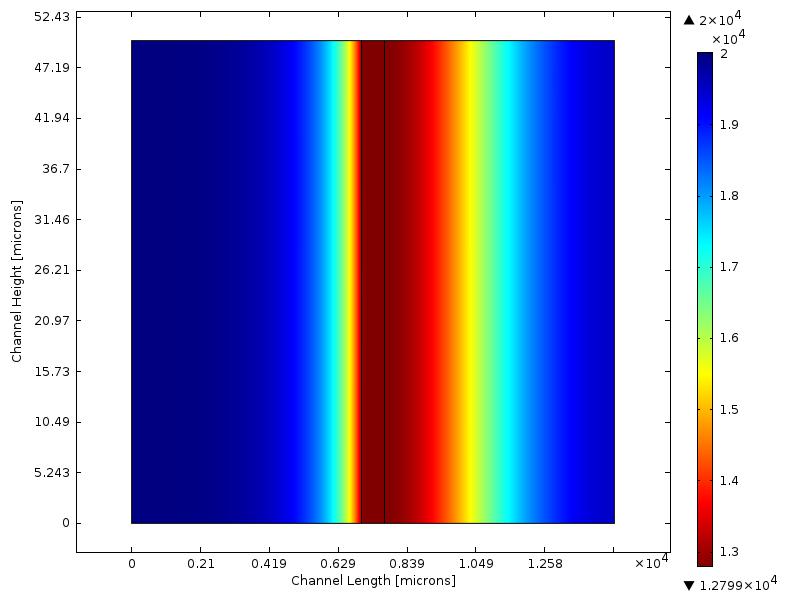
Figure 6
Oxygen tension distribution in channel for present study, at time t=0.005 seconds.
Figure 7
Oxygen tension distribution in channel for present study, at time t=0.01 seconds.
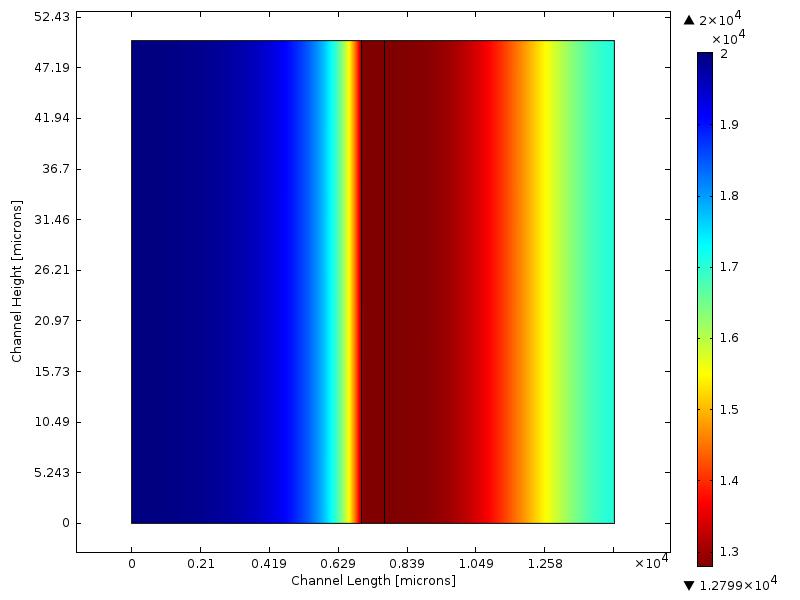
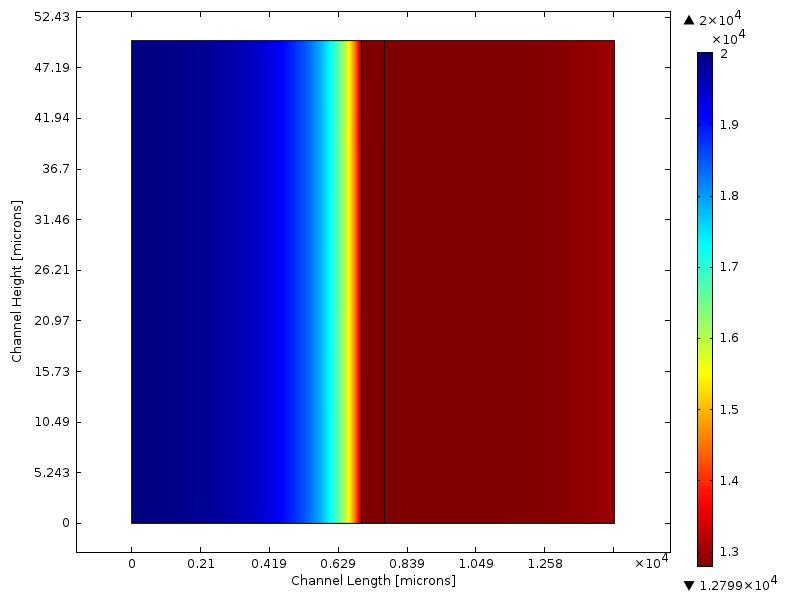
Figure 8
Oxygen tension distribution in channel for present study, at time t=0.025 seconds.