Behavior and biocompatibility of rabbit bone marrow mesenchymal stem cells with bacterial cellulosic membrane
- Published
- Accepted
- Subject Areas
- Bioengineering, Biotechnology, Cell Biology
- Keywords
- Stem Cells, Tissue Engineering, Culture Techniques, Biocompatible Materials, Cellulose
- Copyright
- © 2018 Alencar et al.
- Licence
- This is an open access article distributed under the terms of the Creative Commons Attribution License, which permits unrestricted use, distribution, reproduction and adaptation in any medium and for any purpose provided that it is properly attributed. For attribution, the original author(s), title, publication source (PeerJ Preprints) and either DOI or URL of the article must be cited.
- Cite this article
- 2018. Behavior and biocompatibility of rabbit bone marrow mesenchymal stem cells with bacterial cellulosic membrane. PeerJ Preprints 6:e3329v3 https://doi.org/10.7287/peerj.preprints.3329v3
Abstract
Background. Tissue engineering has been shown to exhibit great potential for the creation of biomaterials capable of developing into functional tissues. Cellular expansion and integration depends on the quality and surface-determinant factors of the scaffold, which are required for successful biological implants. The objective of this research was to characterize and evaluate the in vitro characteristics of rabbit bone marrow mesenchymal stem cells (BM-MSCs) associated with a bacterial cellulose membrane (BCM). We assessed the adhesion, expansion, and integration of the biomaterial as well as its ability to induce macrophage activation. Finally, we evaluated the cytotoxicity and toxicity of the BCM.
Methods. Samples of rabbit bone marrow were collected. Mesenchymal stem cells were isolated from medullary aspirates to establish fibroblast colony-forming unit assays. Osteogenic, chondrogenic, and adipogenic differentiation was performed. Integration with the BCM was assessed by scanning electron microscopy at 1, 7, and 14 days. Cytotoxicity was assessed via the production of nitric oxide, and BCM toxicity was assessed with the MTT assay; phagocytic activity was also determined.
Results. The fibroblastoid colony-forming unit (CFU-F) assay showed cells with a fibroblastoid morphology organized into colonies, and distributed across the culture area surface. In the growth curve, two distinct phases, lag and log phase, were observed at 15 days. Multipotentiality of the cells was evident after induction of osteogenic, chondrogenic, and adipogenic lineages. Regarding the BM-MSCs’ bioelectrical integration with the BCM, BM-MSCs were anchored in the BCM in the first 24 h. On day 7 of culture, the cytoplasm was scattered, and on day 14, the cells were fully integrated with the biomaterial. We also observed significant macrophage activation; analysis of the MTT assay and the concentration of nitric oxide revealed no cytotoxicity of the biomaterial.
Conclusion. The BCM allowed the expansion and biointegration of bone marrow progenitor cells with a stable cytotoxic profile, thus presenting itself as a biomaterial with potential for tissue engineering.
Author Comment
Was added an author in the manuscript
Supplemental Information
Bone marrow mesenchymal stem cell (BM-MSC) culture and expansion photomicrography
2 Bone marrow mesenchymal stem cell (BM-MSC) culture and expansion photomicrography. (A) Rabbit cells newly isolated from the bone marrow in 12-well plates (objective 4×, bar: 50 μm), (B) cells in the adhesion process on day 5 of cell culture performed in 12-well plates (objective 20×, bar: 25 μm), (C) cells arranged in parallel with fibroblastoid morphology at 80% confluency on day 10 of cell culture in 12-well plates (objective 10×, bar: 50 μm), (D) and (E) cytoplasmic adhesion and expansion with 80% confluency in 25 cm2 bottles after trypsinization on day 15 of culture (objective 10×, bar: 50 μm), and (F) cells with fibroblastoid morphology arranged in parallel and in colonies at 80% confluency in 25 cm2 bottles after trypsinization on day 20 of culture (10× objective, bar: 50 μm).
2 Growth curve of stem cells derived from rabbit bone marrow
2 Growth curve of stem cells derived from rabbit bone marrow during 15 days of culture after thawing, at a concentration of 1 × 10⁴ cells/mL. Phases identified: lag (days 1–4), log (days 5–11), and culture decline (days 12–15).
2 CFU-F assay
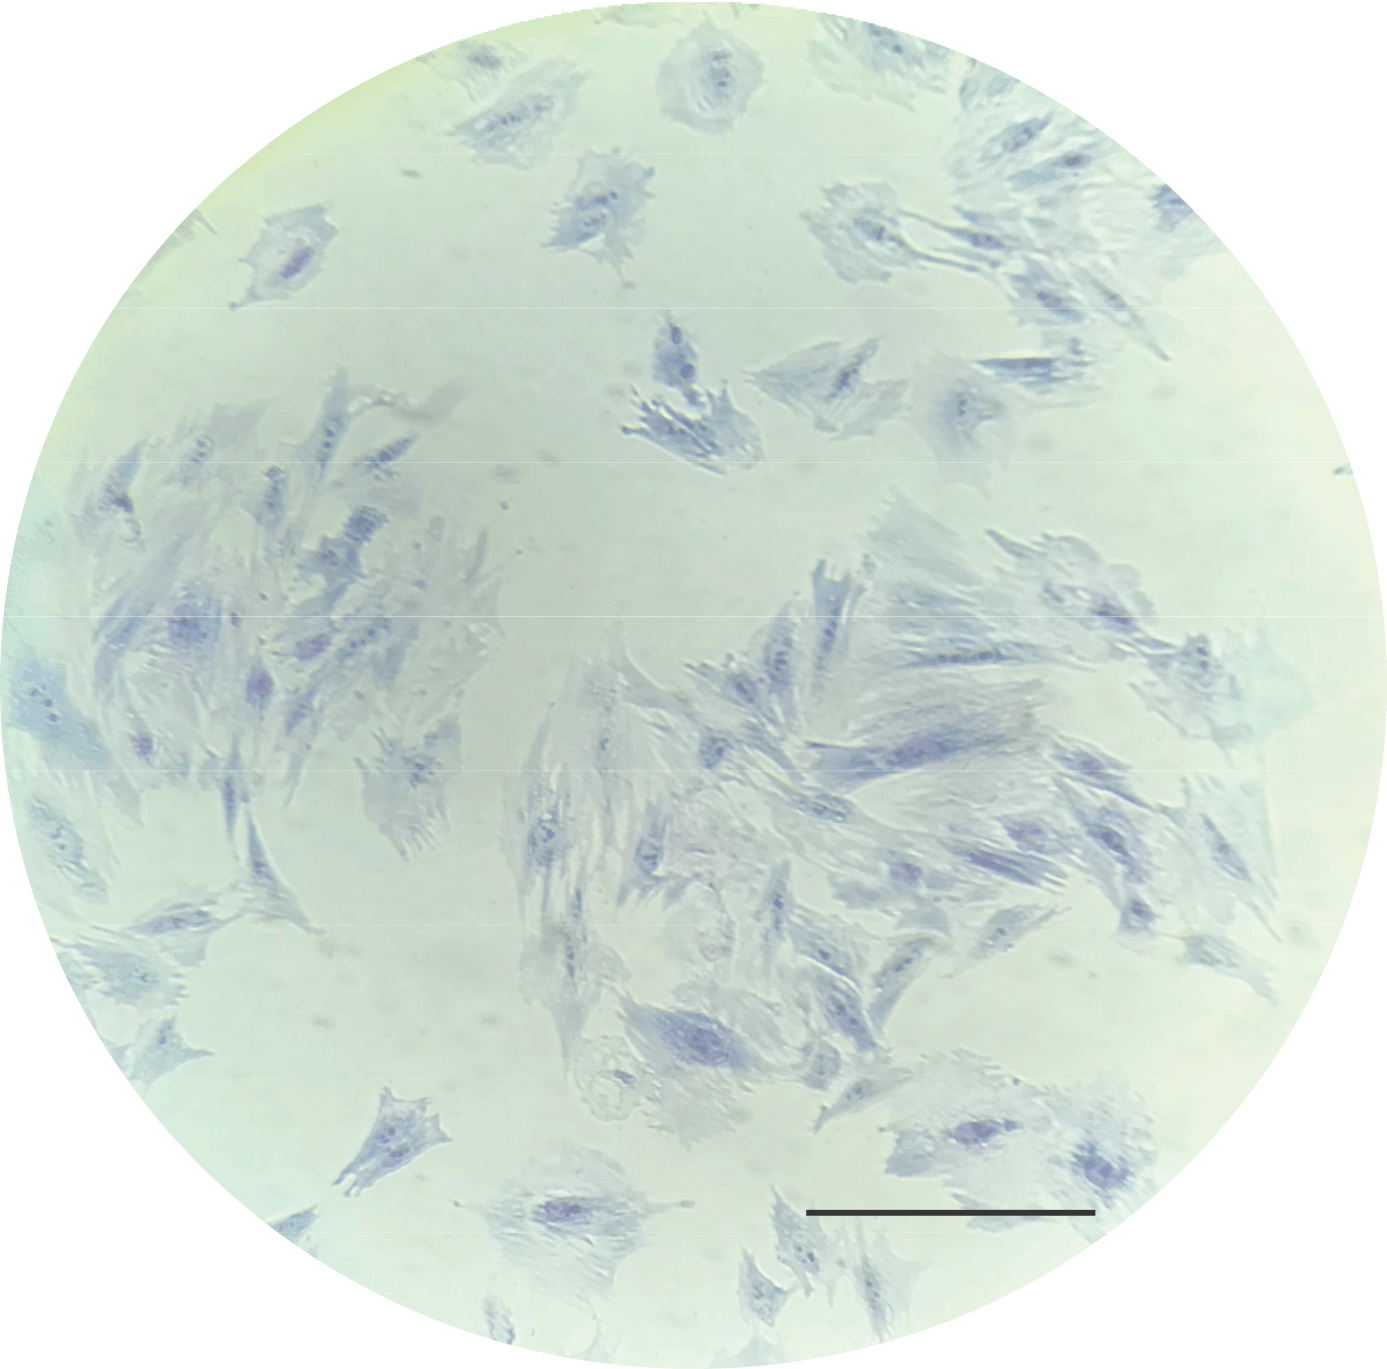
2 CFU-F assay in a 24-well plate: photomicrography of Giemsa-stained BM-MSC colonies after 2 days of cell culture at 80% confluency, and colonies with more than 30 cells per field (objective 20×, bar: 25 μm).
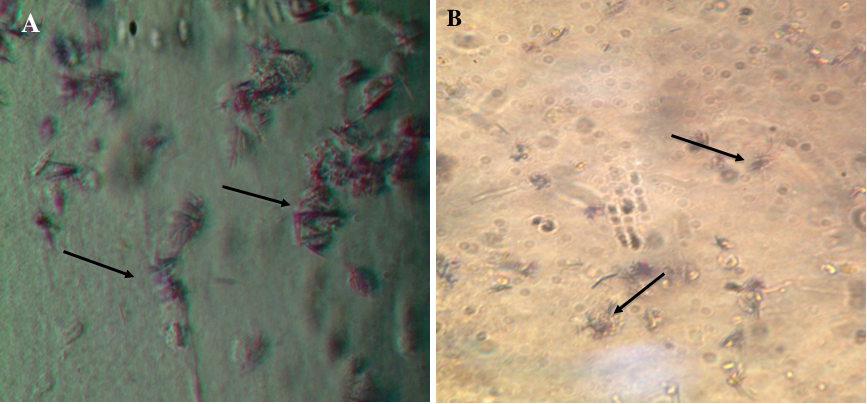
2 Photomicrographs showing BM-MSC differentiation
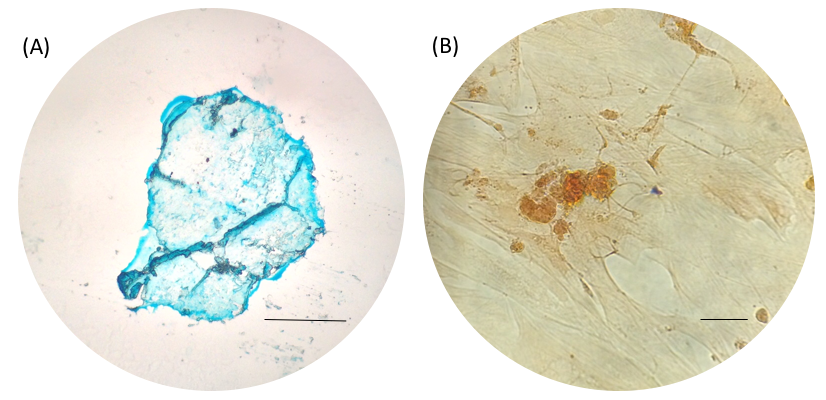
2 Photomicrographs showing BM-MSC differentiation. (A) BM-MSC chondrogenic differentiation (objective 20×, bar: 25 μm), and (B) negative control for 14 days of chondrogenic differentiation (objective 10×, bar: 25 μm).
2 Photomicrographs showing BM-MSC differentiation
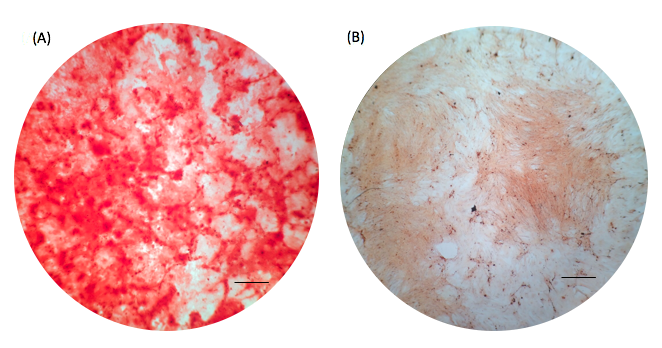
2 Photomicrographs showing BM-MSC differentiation. (A) BM-MSC osteogenic differentiation showing calcium deposits in the extracellular matrix (objective 10×, bar: 25 μm), and (B) negative control for osteogenic differentiation for 21 days (objective 10×, bar: 25 μm).
Adipogenic differentiation
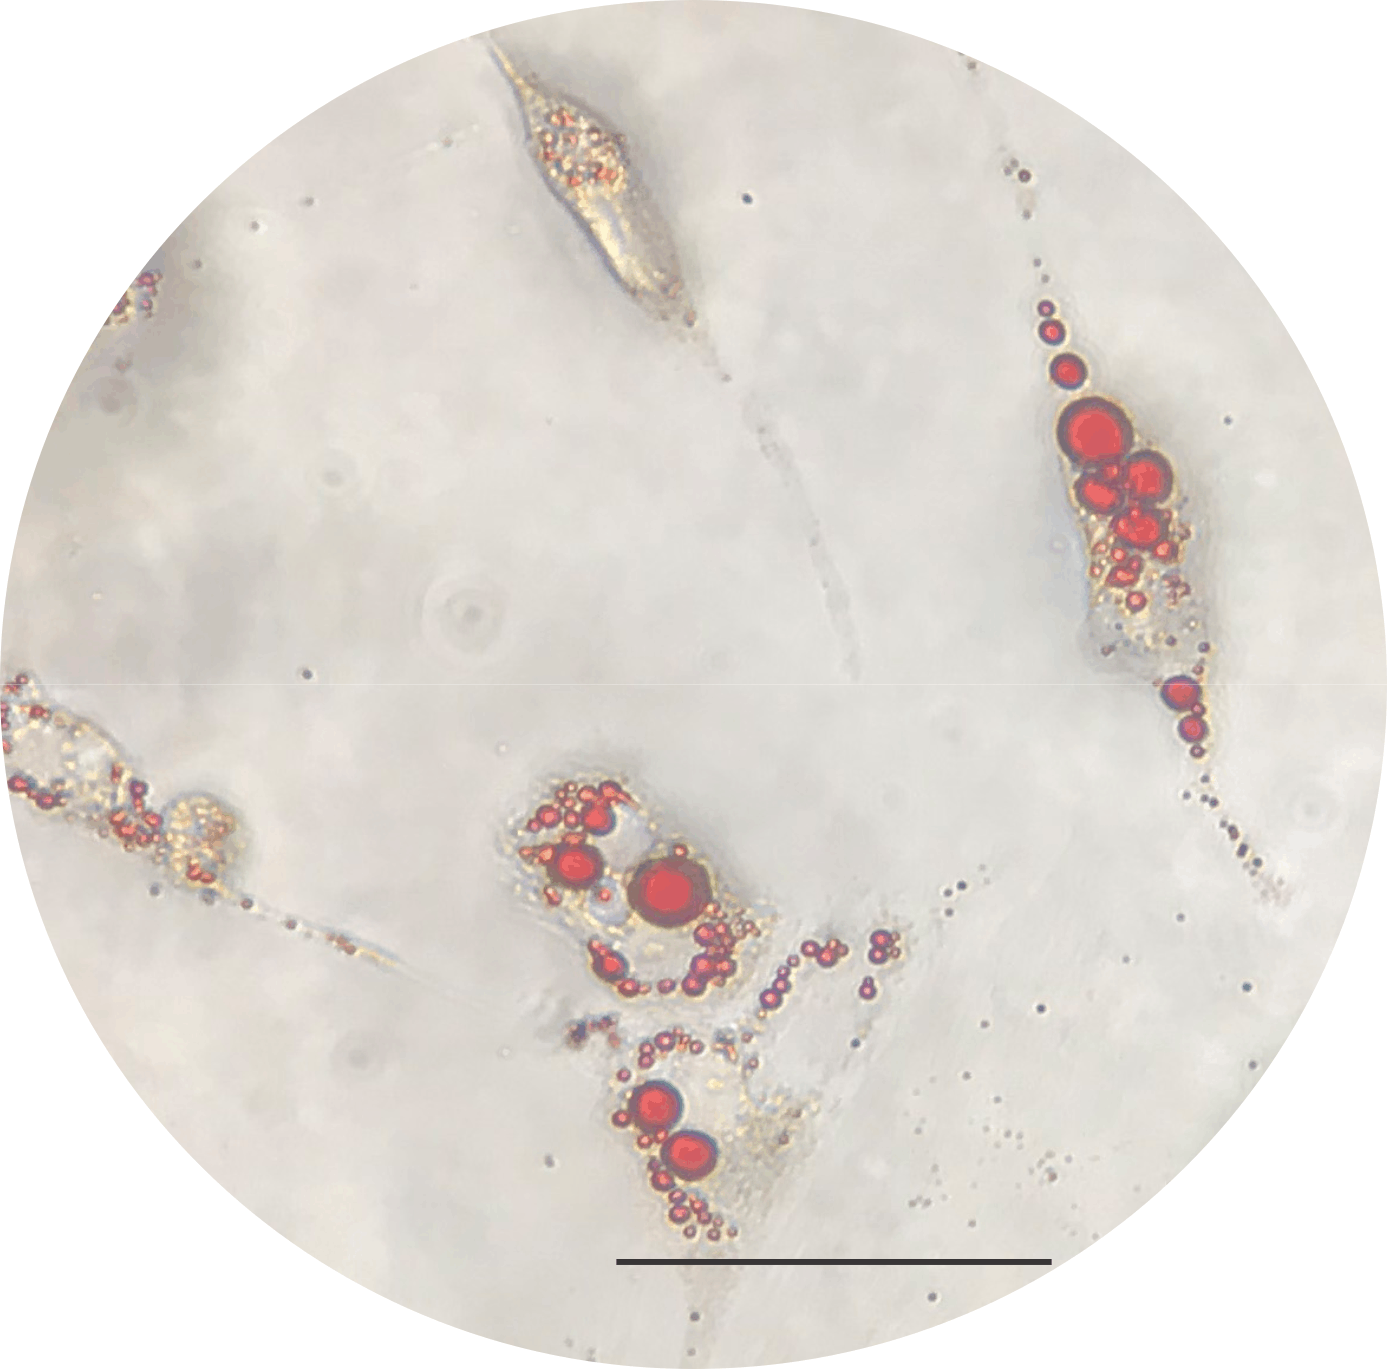
2 Photomicrograph showing the adipogenic differentiation of BM-MSCs, with lipid vacuoles present in the cytoplasm stained red with Oil Red (objective 40×, bar: 25 μm).
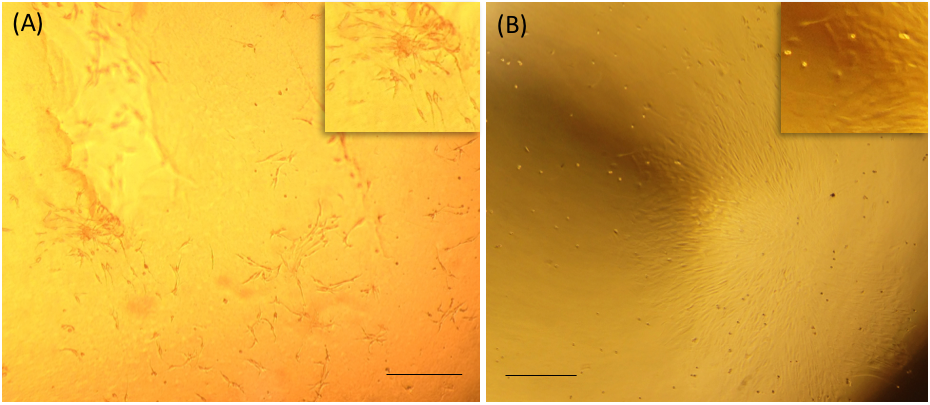
BM-MSCs adhered to the bacterial cellulosic membrane
2 Photomicrographs of BM-MSCs adhered to the bacterial cellulosic membrane (BCM). (A) BM-MSC adhesion after 7 days of cell culture, highlighting the formation of CFU-F on the BCM (objective 20×, bar: 25 μm), and (B) BM-MSC colonies after 14 days of culture (objective 10×, bar: 50 μm).
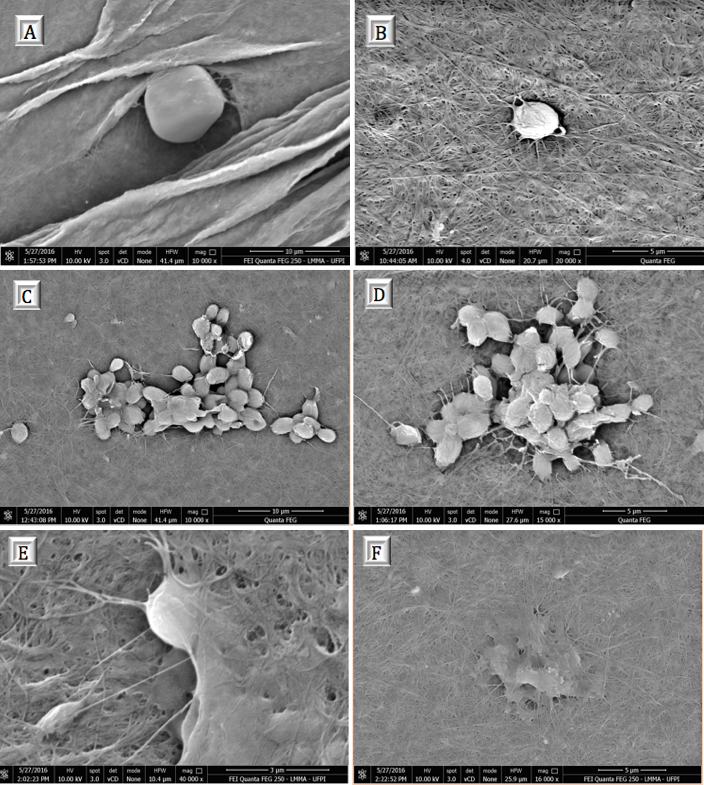
Scanning electron microscopy showing BM-MSC anchorage and biointegration with the BCM
2 Scanning electron microscopy showing BM-MSC anchorage and biointegration with the BCM. (A) and (B) analysis after 24 h of cell culture (10,000× and 20,000×, respectively), and (C) and (D) with after 7 (E) and (F) 14 days of culture (40,000× and 16,000×, respectively).
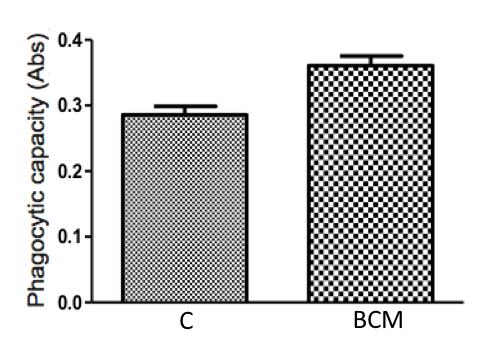
Zymosan particle phagocytosis by macrophages in the presence of the BCM
2 Zymosan particle phagocytosis by macrophages in the presence of the BCM. The graph represents the mean ± standard error of the mean of three independent experiments performed in triplicate (control: mean 0.28567, standard deviation 0.03161; BCM: mean 0.36100, standard deviation 0.03474). ABS: absorbance; C: control; BCM: bacterial cellulosic membrane; *p < 0.05.
Colorimetric nitrite dosage produced by macrophages treated with lipopolysaccharide (LPS) in the presence of the BCM
2 Colorimetric nitrite dosage produced by macrophages treated with lipopolysaccharide (LPS) in the presence of the BCM. The plot represents the mean ± standard error of the average of three independent experiments performed in triplicate (control: mean 100.0000, standard deviation 0.0000; LPS: mean 150.8889, standard deviation 1.0541; BCM: mean 109.6300, standard deviation 11.0047). Student’s t-test was performed for comparison between groups and the control (0.2% dimethyl sulfoxide [DMSO] in RPMI 1640 medium). C: control; LPS: lipopolysaccharide; BCM: bacterial cellulosic membrane; *p < 0.05.
Tetrazole salt (MTT) incubated with cells with full metabolic activity
2 Formazan crystals in BCM cultured with (A) BM-MSCs, and (B) peritoneal macrophages. Increasing view 40×.
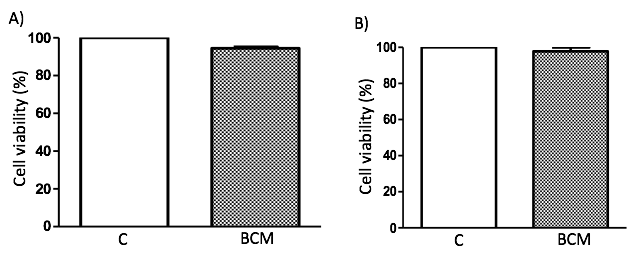
Effect of the BCM on BM-MSCs and mammalian peritoneal macrophage viability
2 Effect of the BCM on BM-MSCs and mammalian peritoneal macrophage viability. (A) BM-MSC viability in the BCM (control: mean 100.0000, standard deviation 0.0000; BCM: mean 94.4533, standard deviation 1.1926), and (B) viability of murine macrophages in the BCM (control: mean 100.0000, standard deviation 0.0000; BCM: mean 97.7867, standard deviation 3.3200). The plot represents the mean ± standard error of the mean of three independent experiments performed in triplicate. Student’s t-test was performed to compare the groups with the control (0.2% DMSO in DMEM/RPMI medium). C: control; BCM: bacterial cellulosic membrane; *p < 0.05.