The influence of metabolic network structures and energy metabolic pattern on E. coli K12 exposed to acoustic field: based on Gene Ontology and KEGG pathway enrichment analysis
- Published
- Accepted
- Subject Areas
- Genomics, Microbiology
- Keywords
- E. coli K12, sound exposure, metabolic network structures, energy metabolic pattern, KEGG analysis
- Copyright
- © 2017 Gu et al.
- Licence
- This is an open access article distributed under the terms of the Creative Commons Attribution License, which permits unrestricted use, distribution, reproduction and adaptation in any medium and for any purpose provided that it is properly attributed. For attribution, the original author(s), title, publication source (PeerJ Preprints) and either DOI or URL of the article must be cited.
- Cite this article
- 2017. The influence of metabolic network structures and energy metabolic pattern on E. coli K12 exposed to acoustic field: based on Gene Ontology and KEGG pathway enrichment analysis. PeerJ Preprints 5:e2821v1 https://doi.org/10.7287/peerj.preprints.2821v1
Abstract
Microorganism is an important part of ecosystems; it is very sensitive to environmental change. In order to study the effects of sound on organisms, it’s meaningful to study mechanism of microbial exposure to sound. In our previous experiments, the effects of different sound intensity and frequency on the growth of E. coli K12 were studied. It was found that in stationary phase the bacteria concentration of sound expose group was higher than control. In this study, we aimed to understand the mechanisms of E. coli underlying sound expose by using Gene Ontology and KEGG Pathway Enrichment Analysis, and established a systematic pathway for the E. coli response to sound expose. At 6 hour, the chemotaxis pathway was significantly up-regulated which responses to the changes of the external environment and leads bacteria to favorable environment. At 12 hour, the glycerophospholipid pathway was significant up-regulated, it is related to the energy metabolism and cell division. At 24 hours, the energy metabolism, nucleotide synthesis and transcriptional translation pathways were significant differences. When bacteria entered the stationary phase (36 hour), in sound exposure group the pathways related to reduce the harmful substances were down-regulated and the pathways about degrade aromatic compounds provides energy were up-regulated, so that the E. coli K12 in sound exposure have a better ability to adapt poor living environment. Comparative transcriptome analysis of sound exposed E. coli K12 can not only reveal the behavior of E. coli K12 response to sound expose, but also lay a foundation for further study the mechanism of prokaryotes response to physical stimulus.
Author Comment
This is a preprint submission to PeerJ Preprints.
Supplemental Information
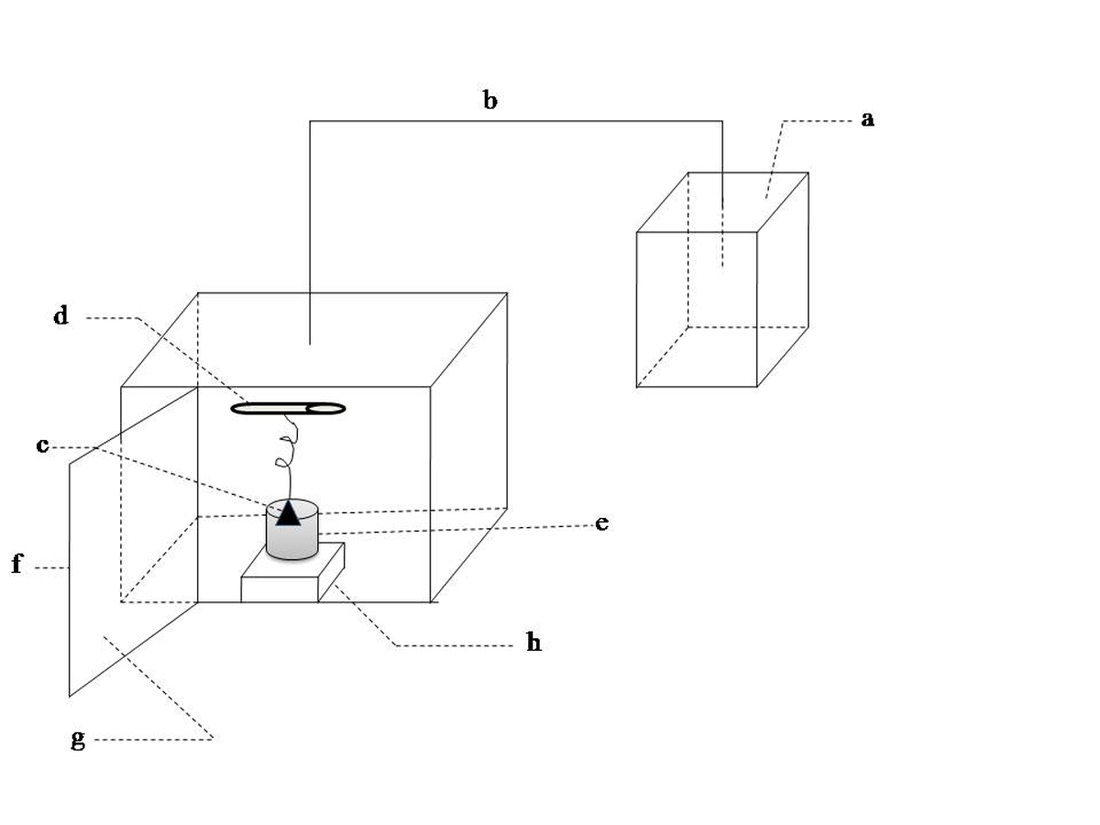
Figure 1. Schematic of sound waves load apparatus
Note: (a) sound waves source; (b) sound waves transmission conductor; (c) speaker; (d) ultraviolet light; (e) beaker; (f) metal case; (g) sound-absorbing material; (h) magnetic stirrer.
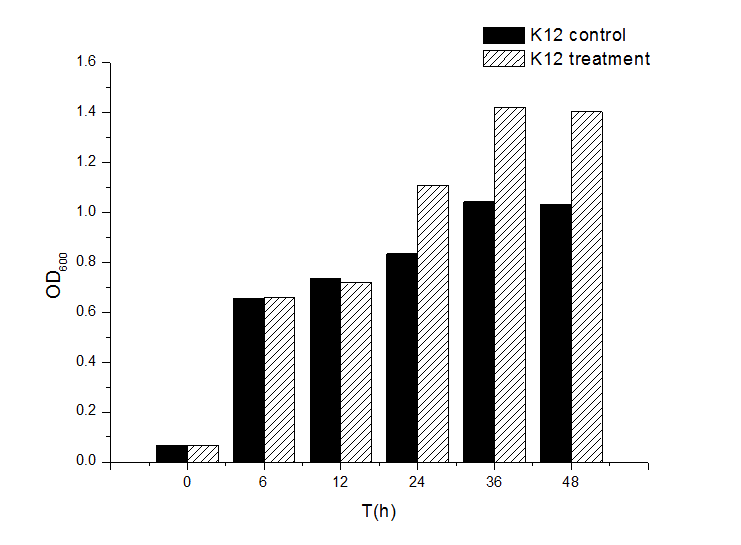
Figure 2. Influence of acoustic exposure on growth of E. coli K12 during different growth stages
Note: E. coli K-12 exposed to acoustic field with 8 kHz frequency and 85 dB intensity level acted as treatment group. Samples without sound exposure served as a control group.
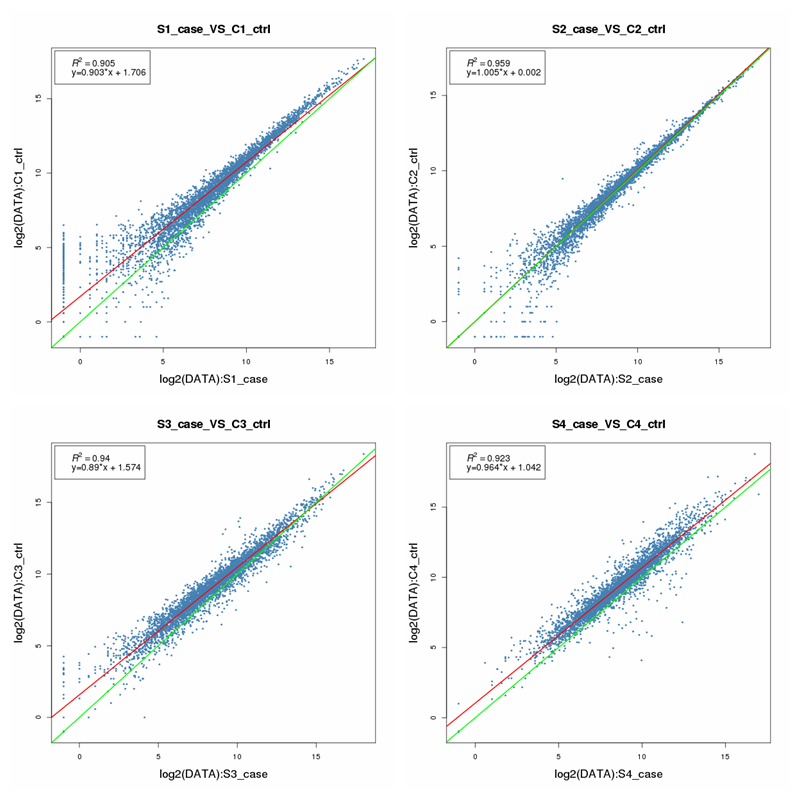
Figure 3. Correlation analysis of two samples’ expressed genes, based on the reads’ number of per gene
Note: the abscissa represents the log2 fold-change of the reads’ number in the treatment group, and the ordinate represents the log2 fold-change of reads’ number in the control group. Correlation coefficients (R2) are 0.905, 0.959, 0.94 and 0.923, respectively.
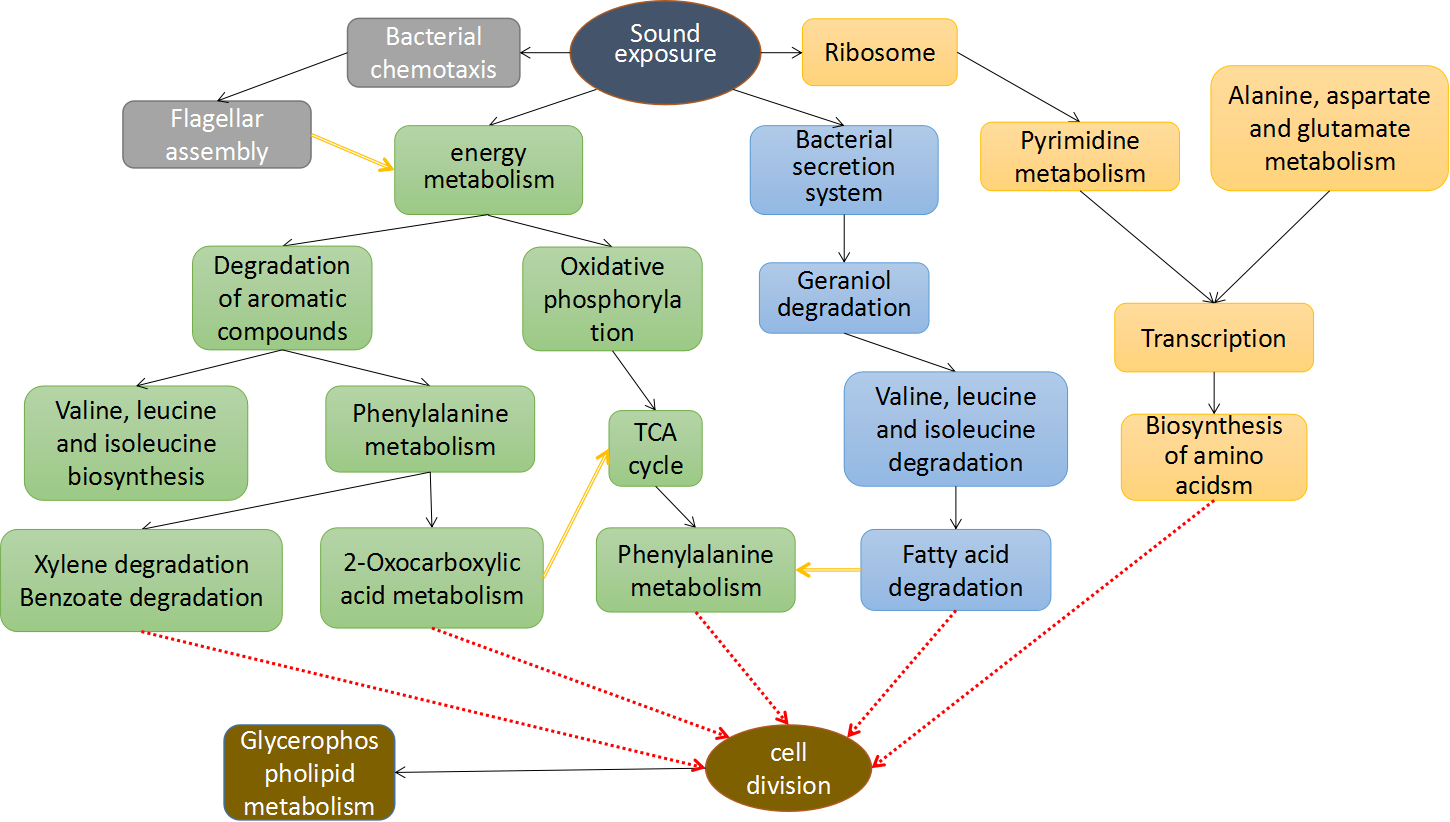
Figure 4. The hypothesis model of acoustic stress response in E. coli based on metabolic networks and energy metabolism
Table 1. The data quality of transcriptome sequencing for gene expression
Note: C1 represents 6 hours sample without acoustic stimulation, C2 represents 12 hours sample without acoustic stimulation, C3 represents 24 hours sample without acoustic stimulation, C4 represents 36 hours sample without acoustic stimulation, S1 represents 6 hours sample exposed to acoustic field with 8 kHz frequency and 85 dB intensity level, S2 represents 12 hours sample exposed to acoustic field, S3 represents 24 hours sample exposed to acoustic field, S4 represents 6 hours sample exposed to acoustic field. Total gene count is the total gene number of this species. Gene_count is the number of genes expressed in the sample and the proportion to the total gene (reads>0, indicating that each gene has at least 1 read support, and so on).
Table 2. The data quality of transcriptome sequencing for mapping
Note: C1 represents 6 hours sample without acoustic stimulation, C2 represents 12 hours sample without acoustic stimulation, C3 represents 24 hours sample without acoustic stimulation, C4 represents 36 hours sample without acoustic stimulation, S1 represents 6 hours sample exposed to acoustic field with 8 kHz frequency and 85 dB intensity level, S2 represents 12 hours sample exposed to acoustic field, S3 represents 24 hours sample exposed to acoustic field, S4 represents 6 hours sample exposed to acoustic field. Input is the number of read. Mapped is the number of Reads match to genome. Multiple_alignments is the Reads number of multiple alignments. Uniq_mapped is the Reads number of uniq mapped.
Table 3. The effects of acoustic exposure on E. coli K12 gene expression during different growth stages
Note: E.coli K-12 exposed to acoustic field with 8 kHz frequency and 85 dB intensity level acted as treatment group. Samples without sound exposure served as a control group.
Table 4. The effects of sound exposure on metabolic network structures in E. coli K12
Note: E.coli K-12 exposed to acoustic field with 8 kHz frequency and 85 dB intensity level acted as treatment group. Samples without sound exposure served as a control group. The metabolic pathway presented in this table arrived to the significantly differences (corrected-Pvalue<0.05) , which below the level is not shown. There are 179 down-regulated genes at 6 hour and 37 down-regulated genes at 12 hour, some of them are found in the pathways without significant differences(corrected-Pvalue>0.05), while others do not involve in these pathways. Term is the functional description of this pathway in KEGG database. ID is the unique number of Pathway in KEGG database.
Table 5. The effects of sound exposure on the energy metabolic pattern in E. coli K12
Note: E.coli K-12 exposed to acoustic field with 8 kHz frequency and 85 dB intensity level acted as treatment group. Samples without sound exposure served as a control group. The metabolic pathway presented in this table arrived to the significantly differences(corrected-Pvalue<0.05) , which below the level is not shown. There are 179 down-regulated genes at 6 hour and 37 down-regulated genes at 12 hour, some of them are found in the pathways without significant differences(corrected-Pvalue>0.05), while others do not involve in these pathways. Term is the functional description of this pathway in KEGG database. ID is the unique number of Pathway in KEGG database.