Illumina MiSeq reveals the influence of blueberry malvidin-3-galactoside on fecal microbial community structure and metabolizes of liver cancer mice
- Published
- Accepted
- Subject Areas
- Agricultural Science, Food Science and Technology, Microbiology
- Keywords
- malvidin-3-galactoside, High-throughput sequencing, Fecal microbiota, gut, liver cancer, blueberry
- Copyright
- © 2018 Cheng et al.
- Licence
- This is an open access article distributed under the terms of the Creative Commons Attribution License, which permits unrestricted use, distribution, reproduction and adaptation in any medium and for any purpose provided that it is properly attributed. For attribution, the original author(s), title, publication source (PeerJ Preprints) and either DOI or URL of the article must be cited.
- Cite this article
- 2018. Illumina MiSeq reveals the influence of blueberry malvidin-3-galactoside on fecal microbial community structure and metabolizes of liver cancer mice. PeerJ Preprints 6:e27429v2 https://doi.org/10.7287/peerj.preprints.27429v2
Abstract
Hepatocellular carcinoma (HCC) is a kind of cancer with high incidence and often accompanied by intestinal flora imbalance. Many studies have shown that probiotics such as anthocyanins can regulate gut microbiome and improve disease. This study was designed to evaluate the influence of blueberry malvidin-3-galactoside (M3G), a blueberry ingredient with several beneficial properties, on gut microorganisms of liver cancer (LC) mice. LC mice were fed M3G diets (LM, 40 mg/kg; HM, 80 mg/kg) or 5-fluorouracil (PC, 20 mg/kg) for three weeks. High-throughput sequencing using the MiSeq platform coupled with freely-available computational tools adopt 16SrRNA and metagenome analyses. There was a greater abundance of Verrucomicrobiaceae (p < 0.05) and Ruminococcus (p < 0.05) in mice in the HM group than in those in the LM group. Anti-inflammatory bacteria such as Akkermansia, Sutterella increase in abundance after fed with M3G for three weeks. A significantly smaller abundance of Proinflammatory bacteria such as Dorea, Coprobacillus, Clostridium, Streptococcus, Oscillospira in HM mice(p<0.01). Both M3G and chemotherapeutic drugs can increase signal transduction, Membrane transport, and Cell Motility. In addition, the ability of cell growth and death increased in HM and PC groups but decreased in LC and LM groups. This study indicates that M3G supplementation for three weeks may not be enough to cure liver cancer. However, M3G-supplementation was associated with significant differences in the structure and metabolic function of gut microbiome compared to liver cancer controls that merit further research.
Author Comment
In the new preprint, figures and figure legends have changed, please note.
Supplemental Information
First batch of sequencing samples
Sequencing raw data of the first 49 stool samples
Second batch of sequencing raw data
Raw data for sequencing the last 13 stool samples
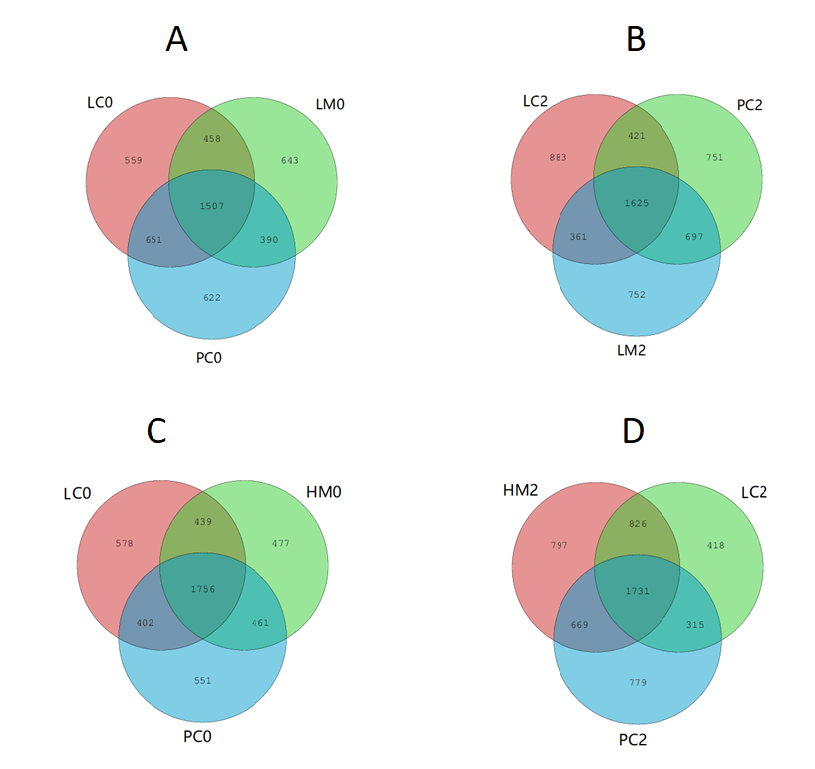
Figure 1 Venn diagram analysis
(A)Number of shared and unique OTUs in LC, LM and PC groups during the first week(B)Number of shared and unique OTUs in LC, LM and PC groups during the third week(C)Number of shared and unique OTUs in LC, HM and PC groups during the first week(D)The number of shared and unique OTUs in LC, HM and PC groups during the third week
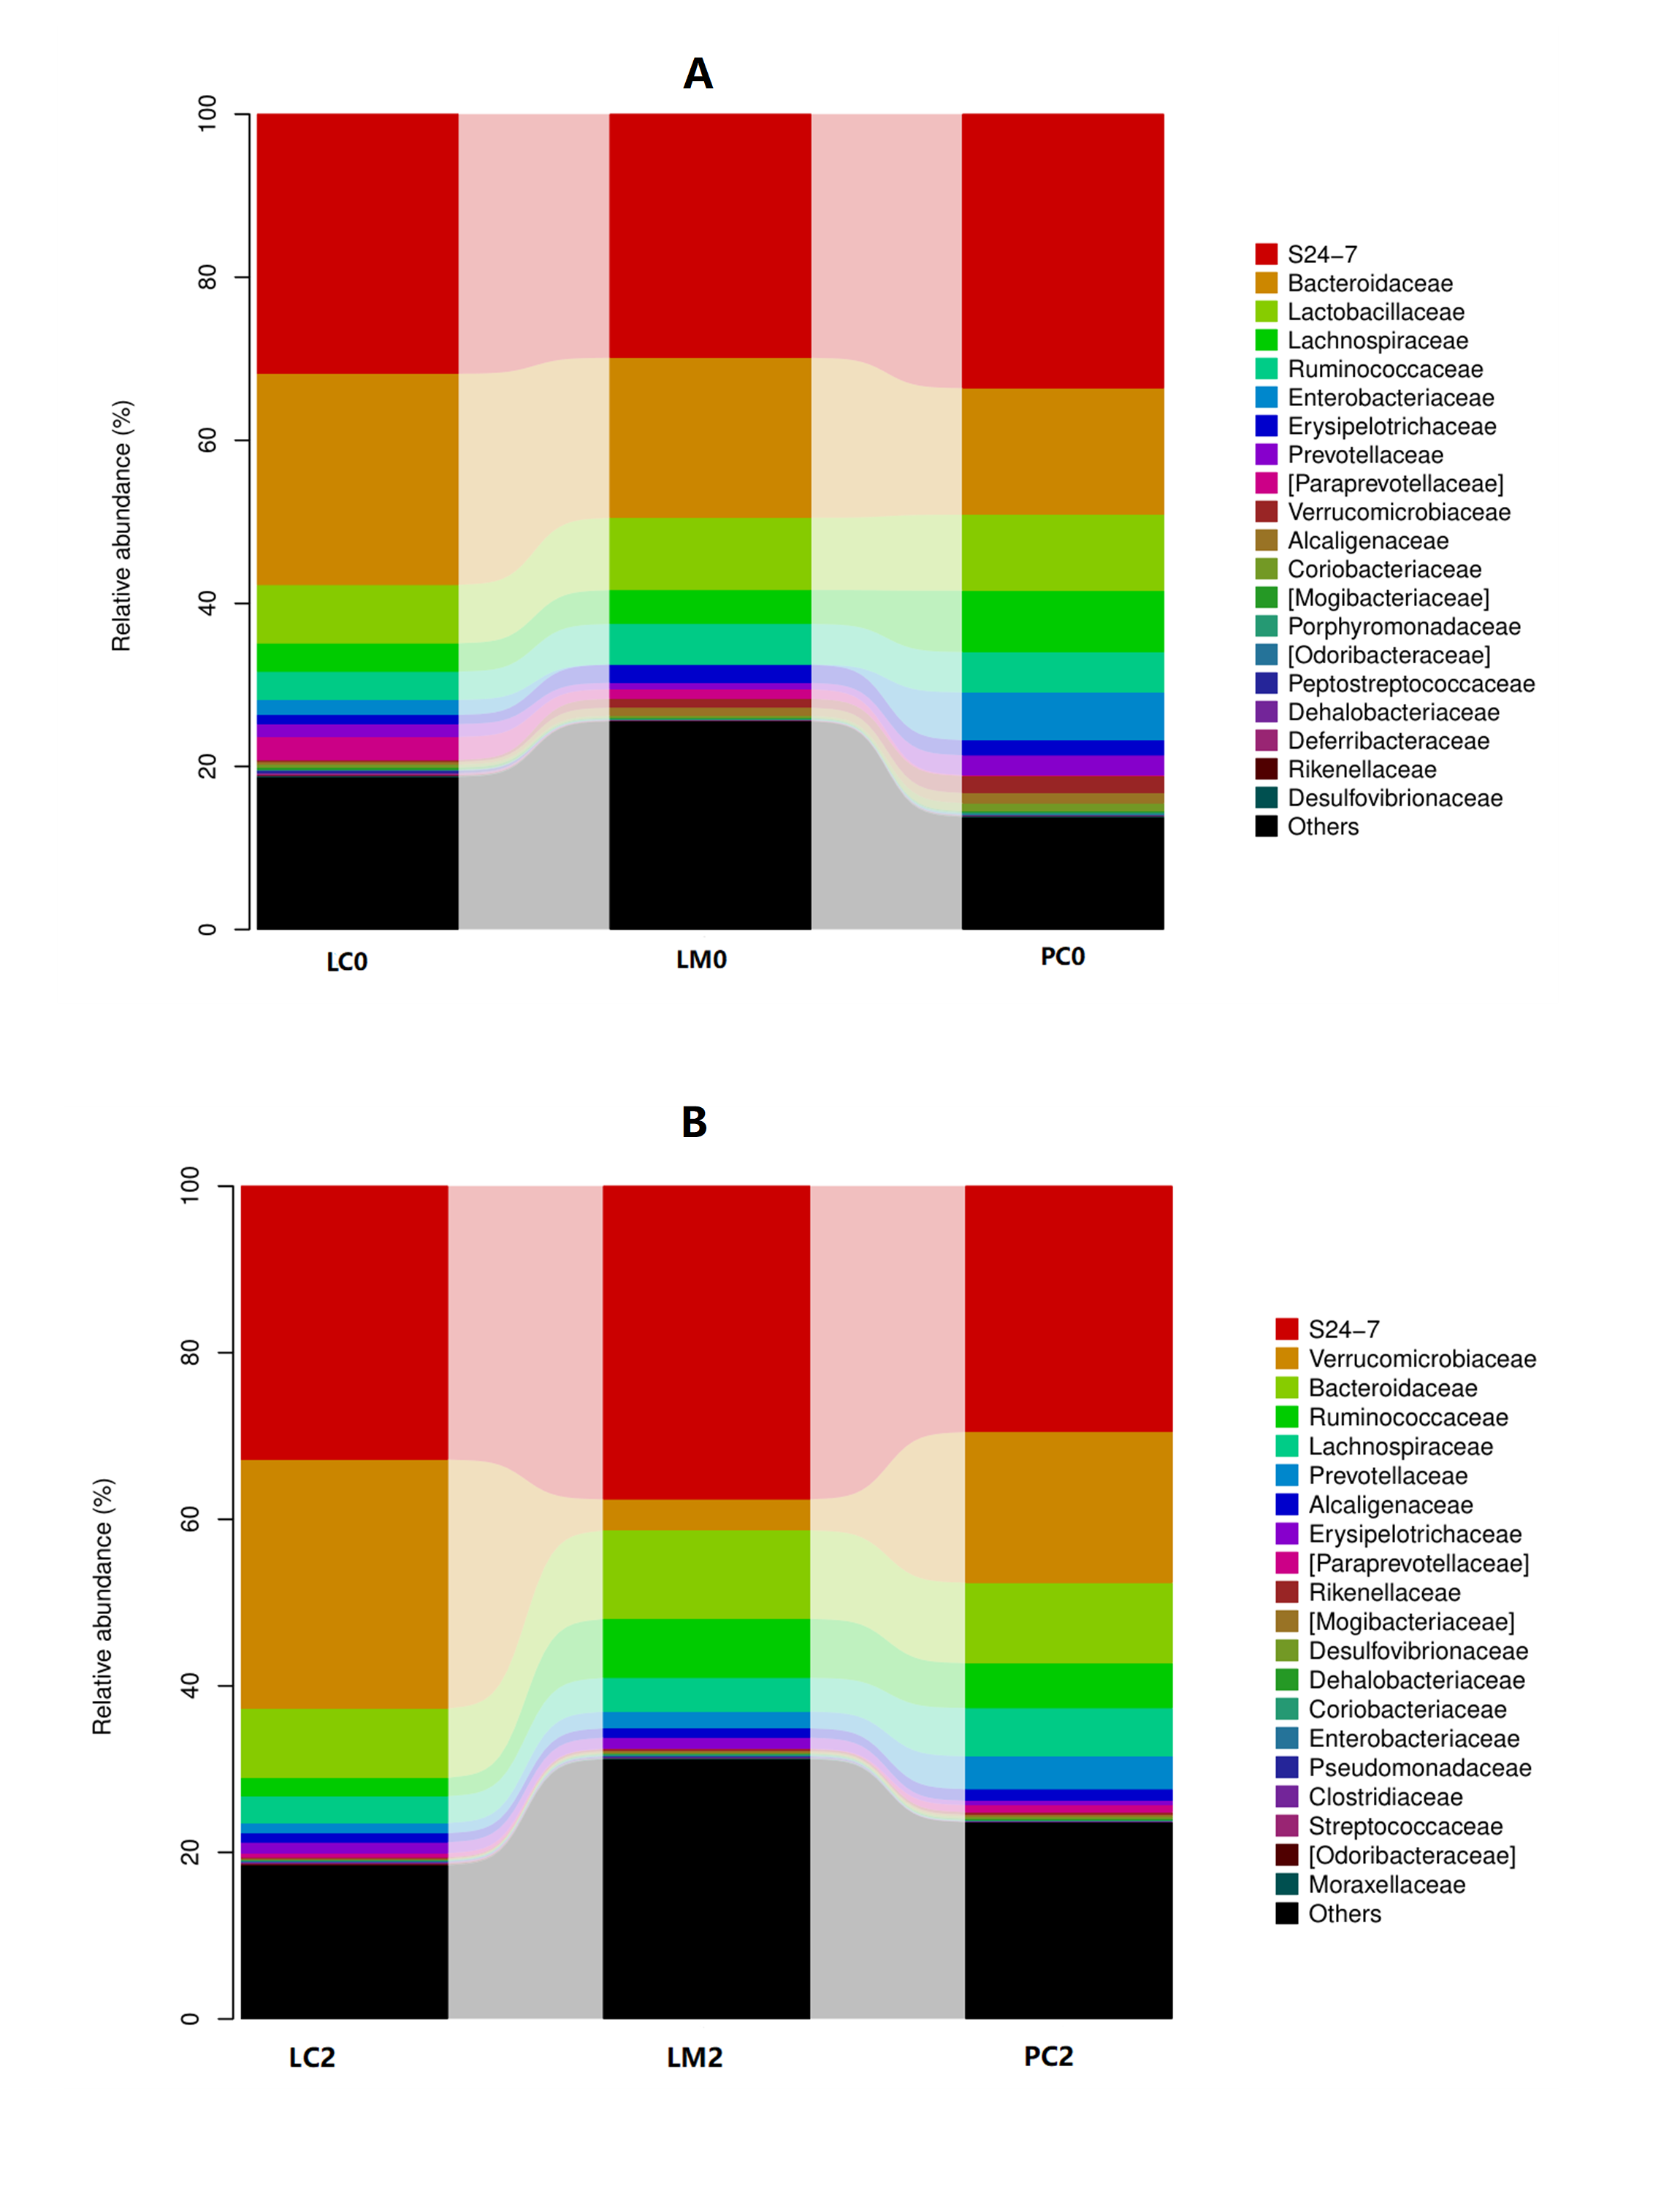
Figure 2 Comparative analysis of family-level colonies in LM group
(A)Comparisons of LM with LC and PC in the first week(B)Comparisons of LM with LC and PC in the third week 3
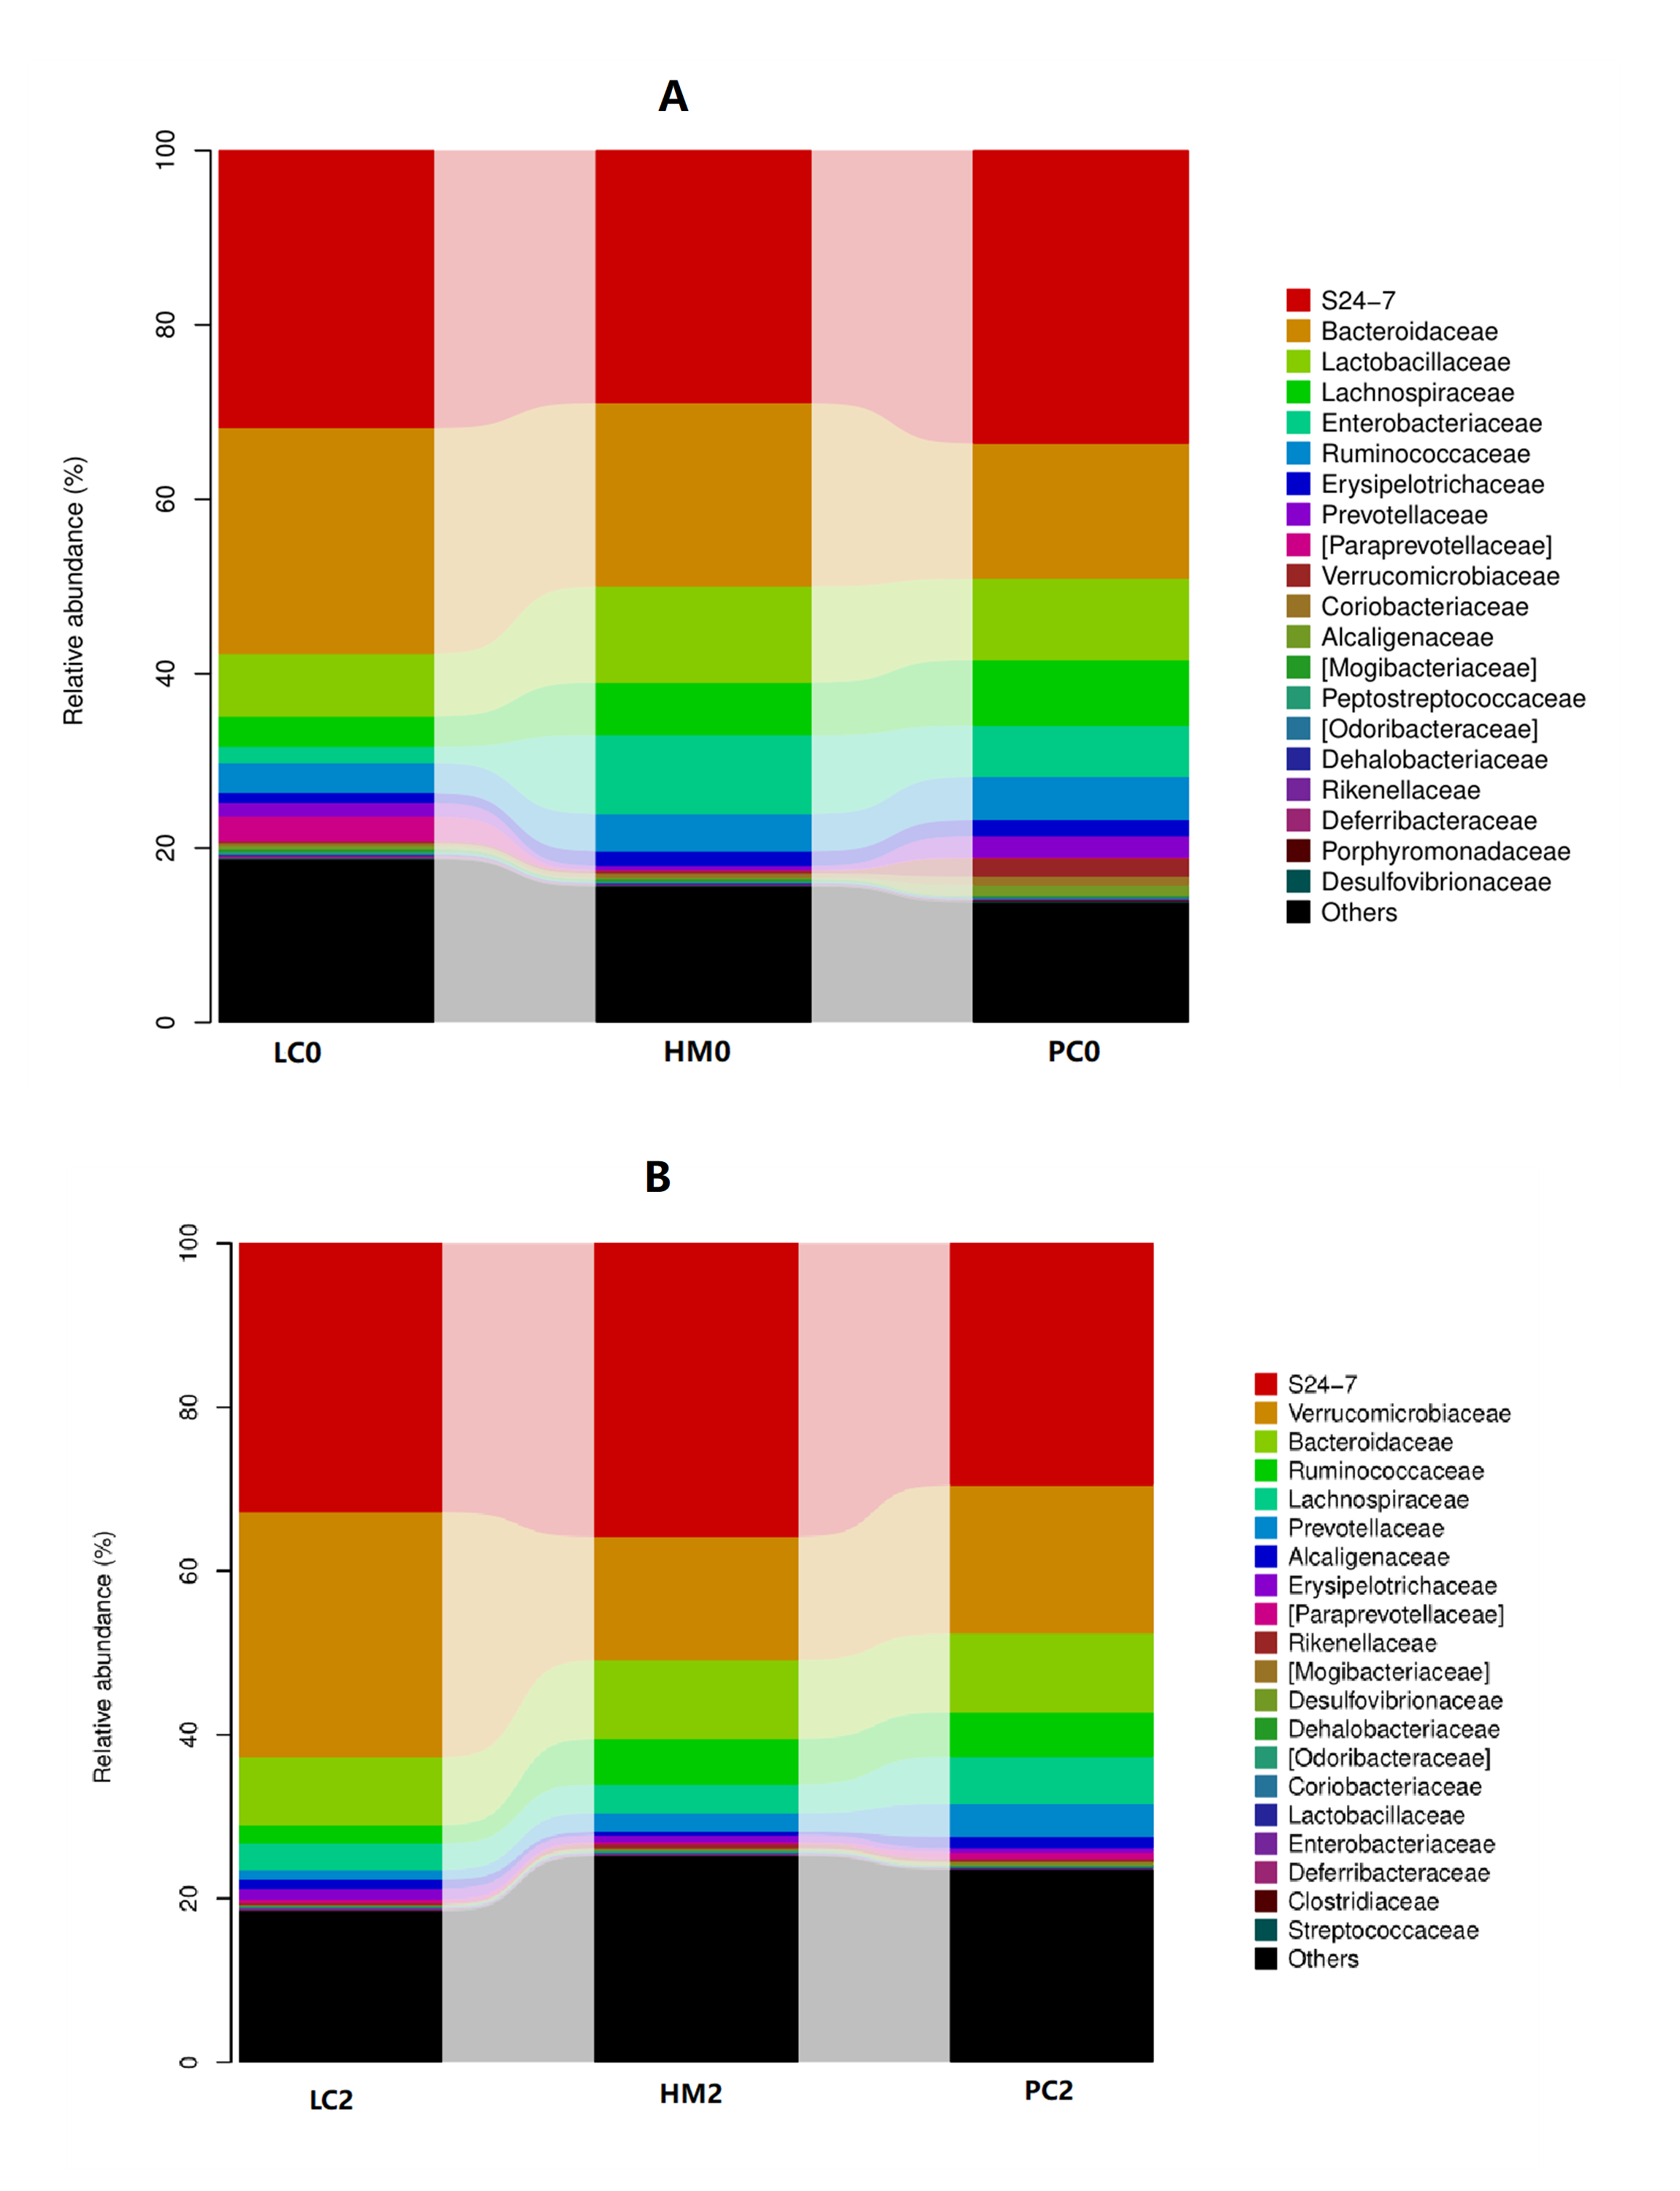
Figure 3 Comparative analysis of family-level colonies in HM group
(A)Comparisons of HM with LC and PC in the first week(B)Comparisons of HM with LC and PC in the third week 3
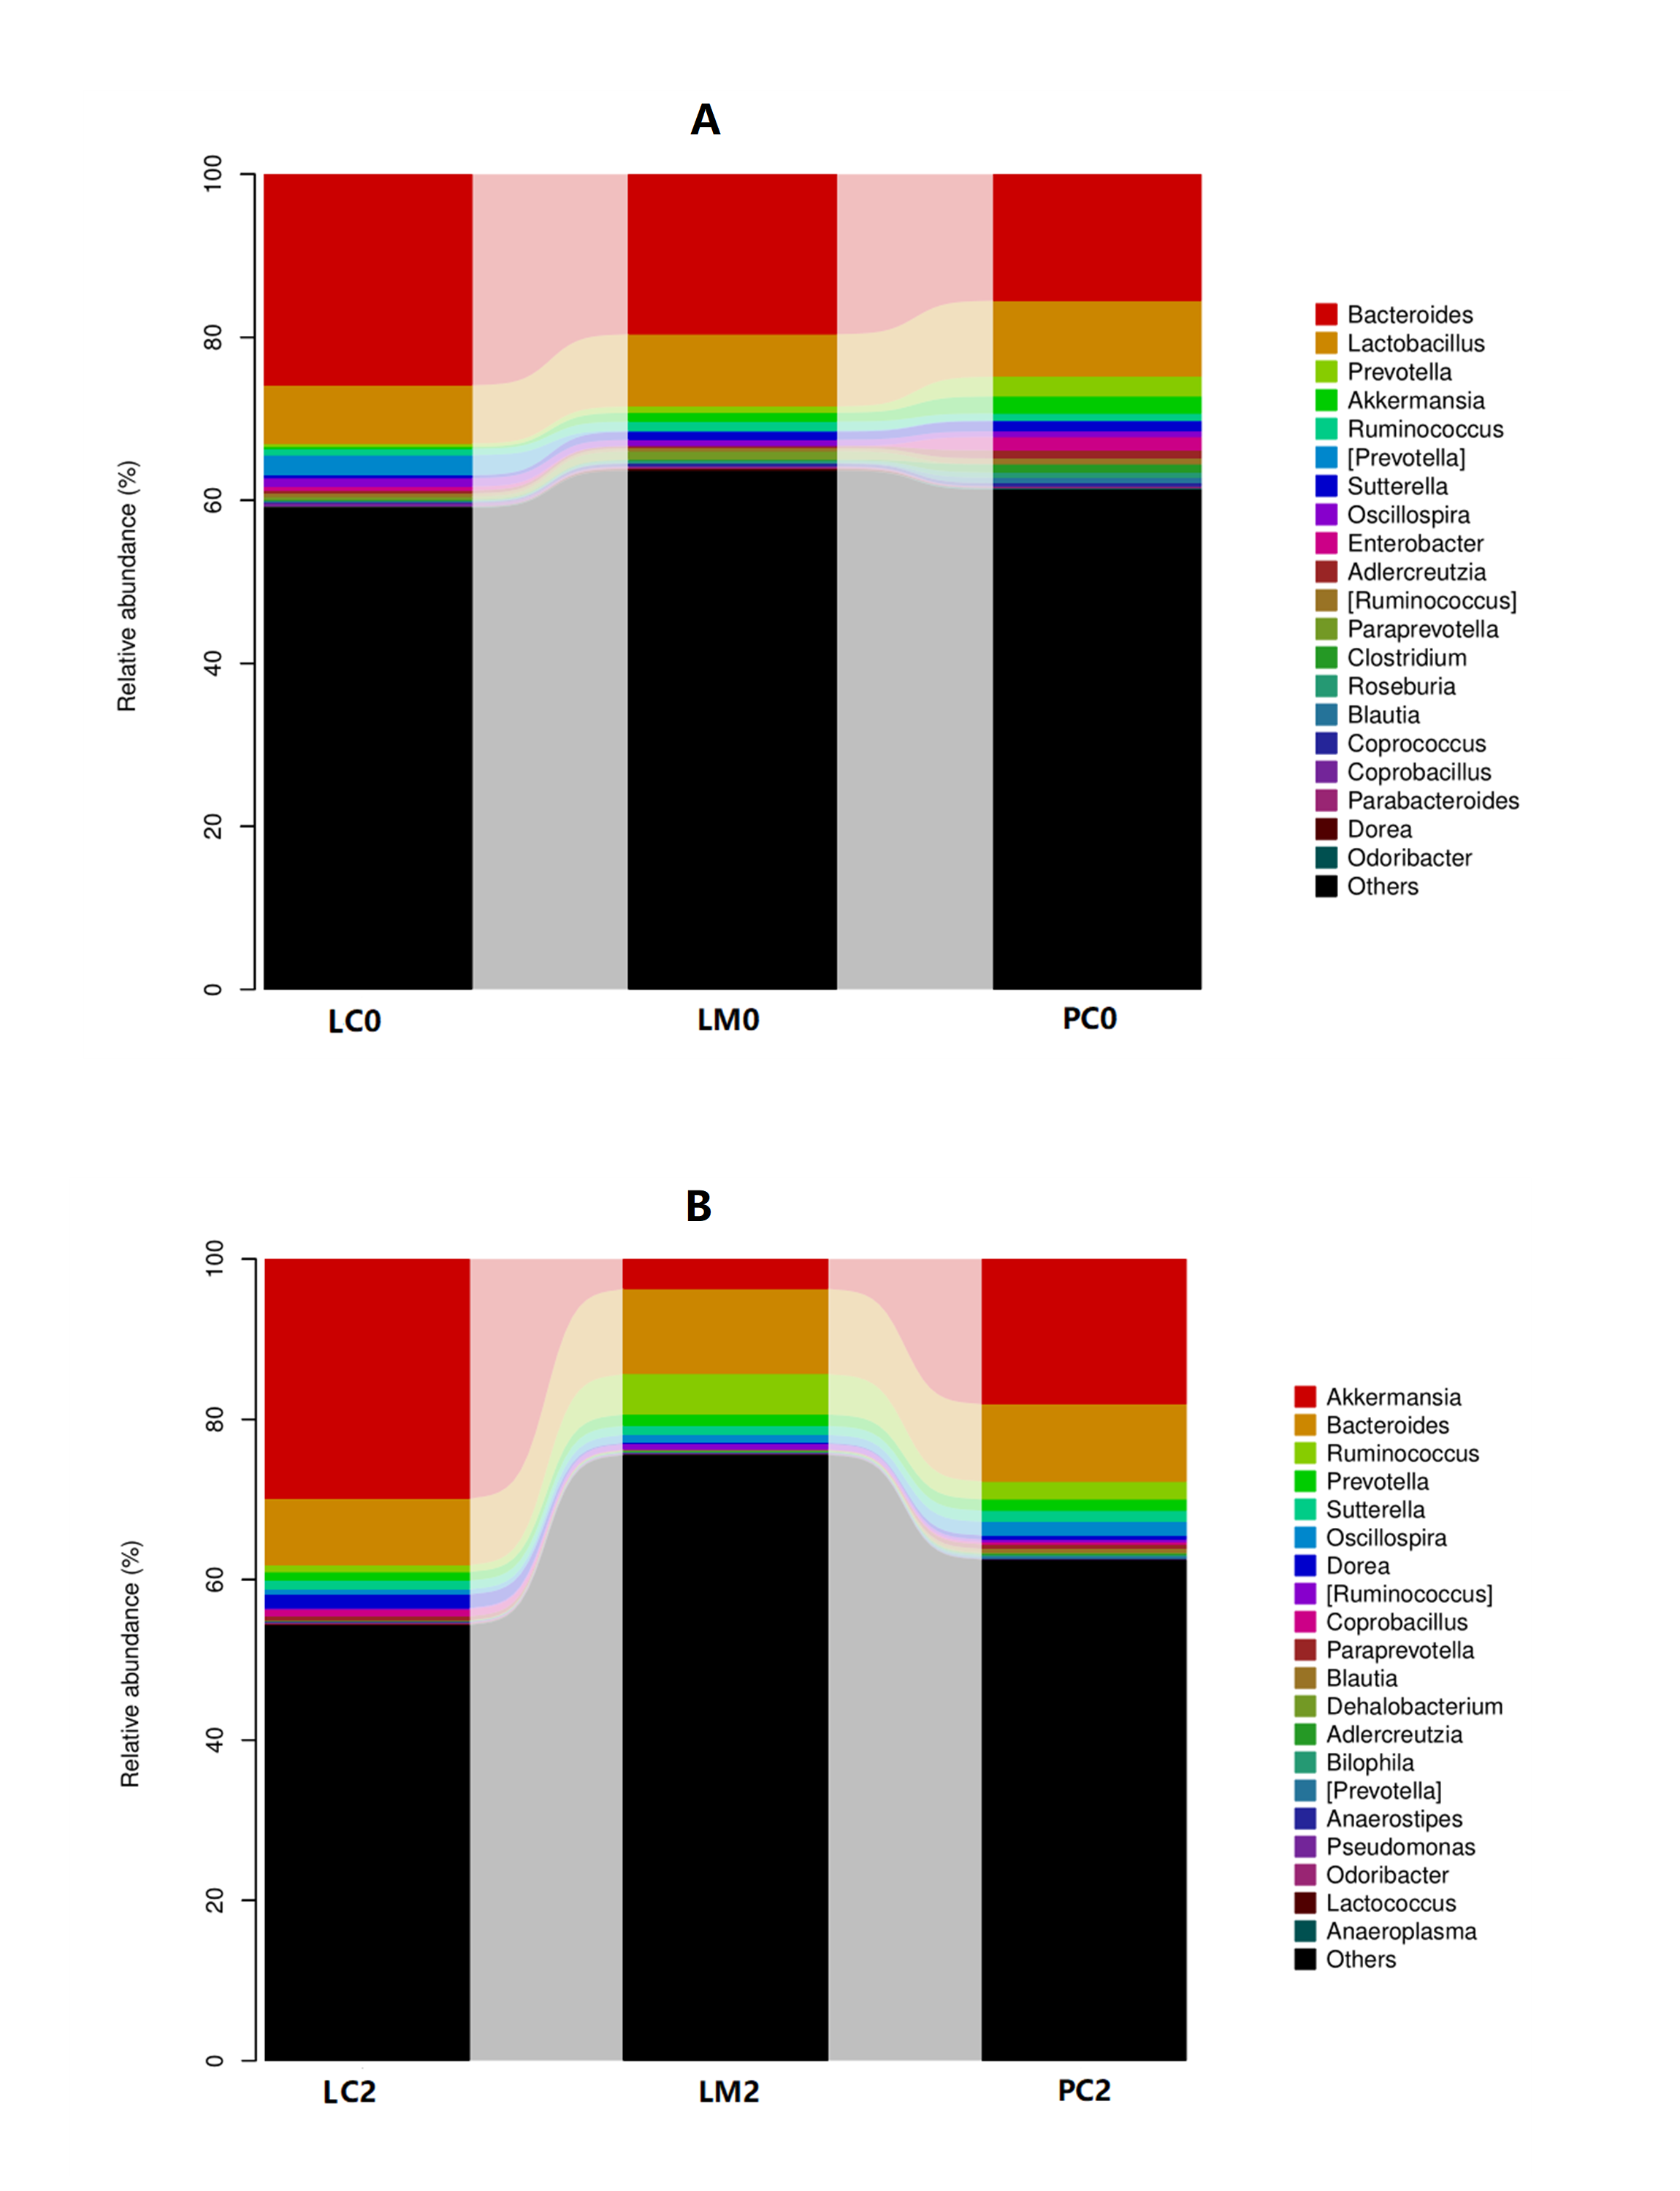
Figure 4 Comparative analysis of genus-level colonies in LM group
(A)Comparisons of LM with LC and PC in the first week(B)Comparisons of LM with LC and PC in the third week
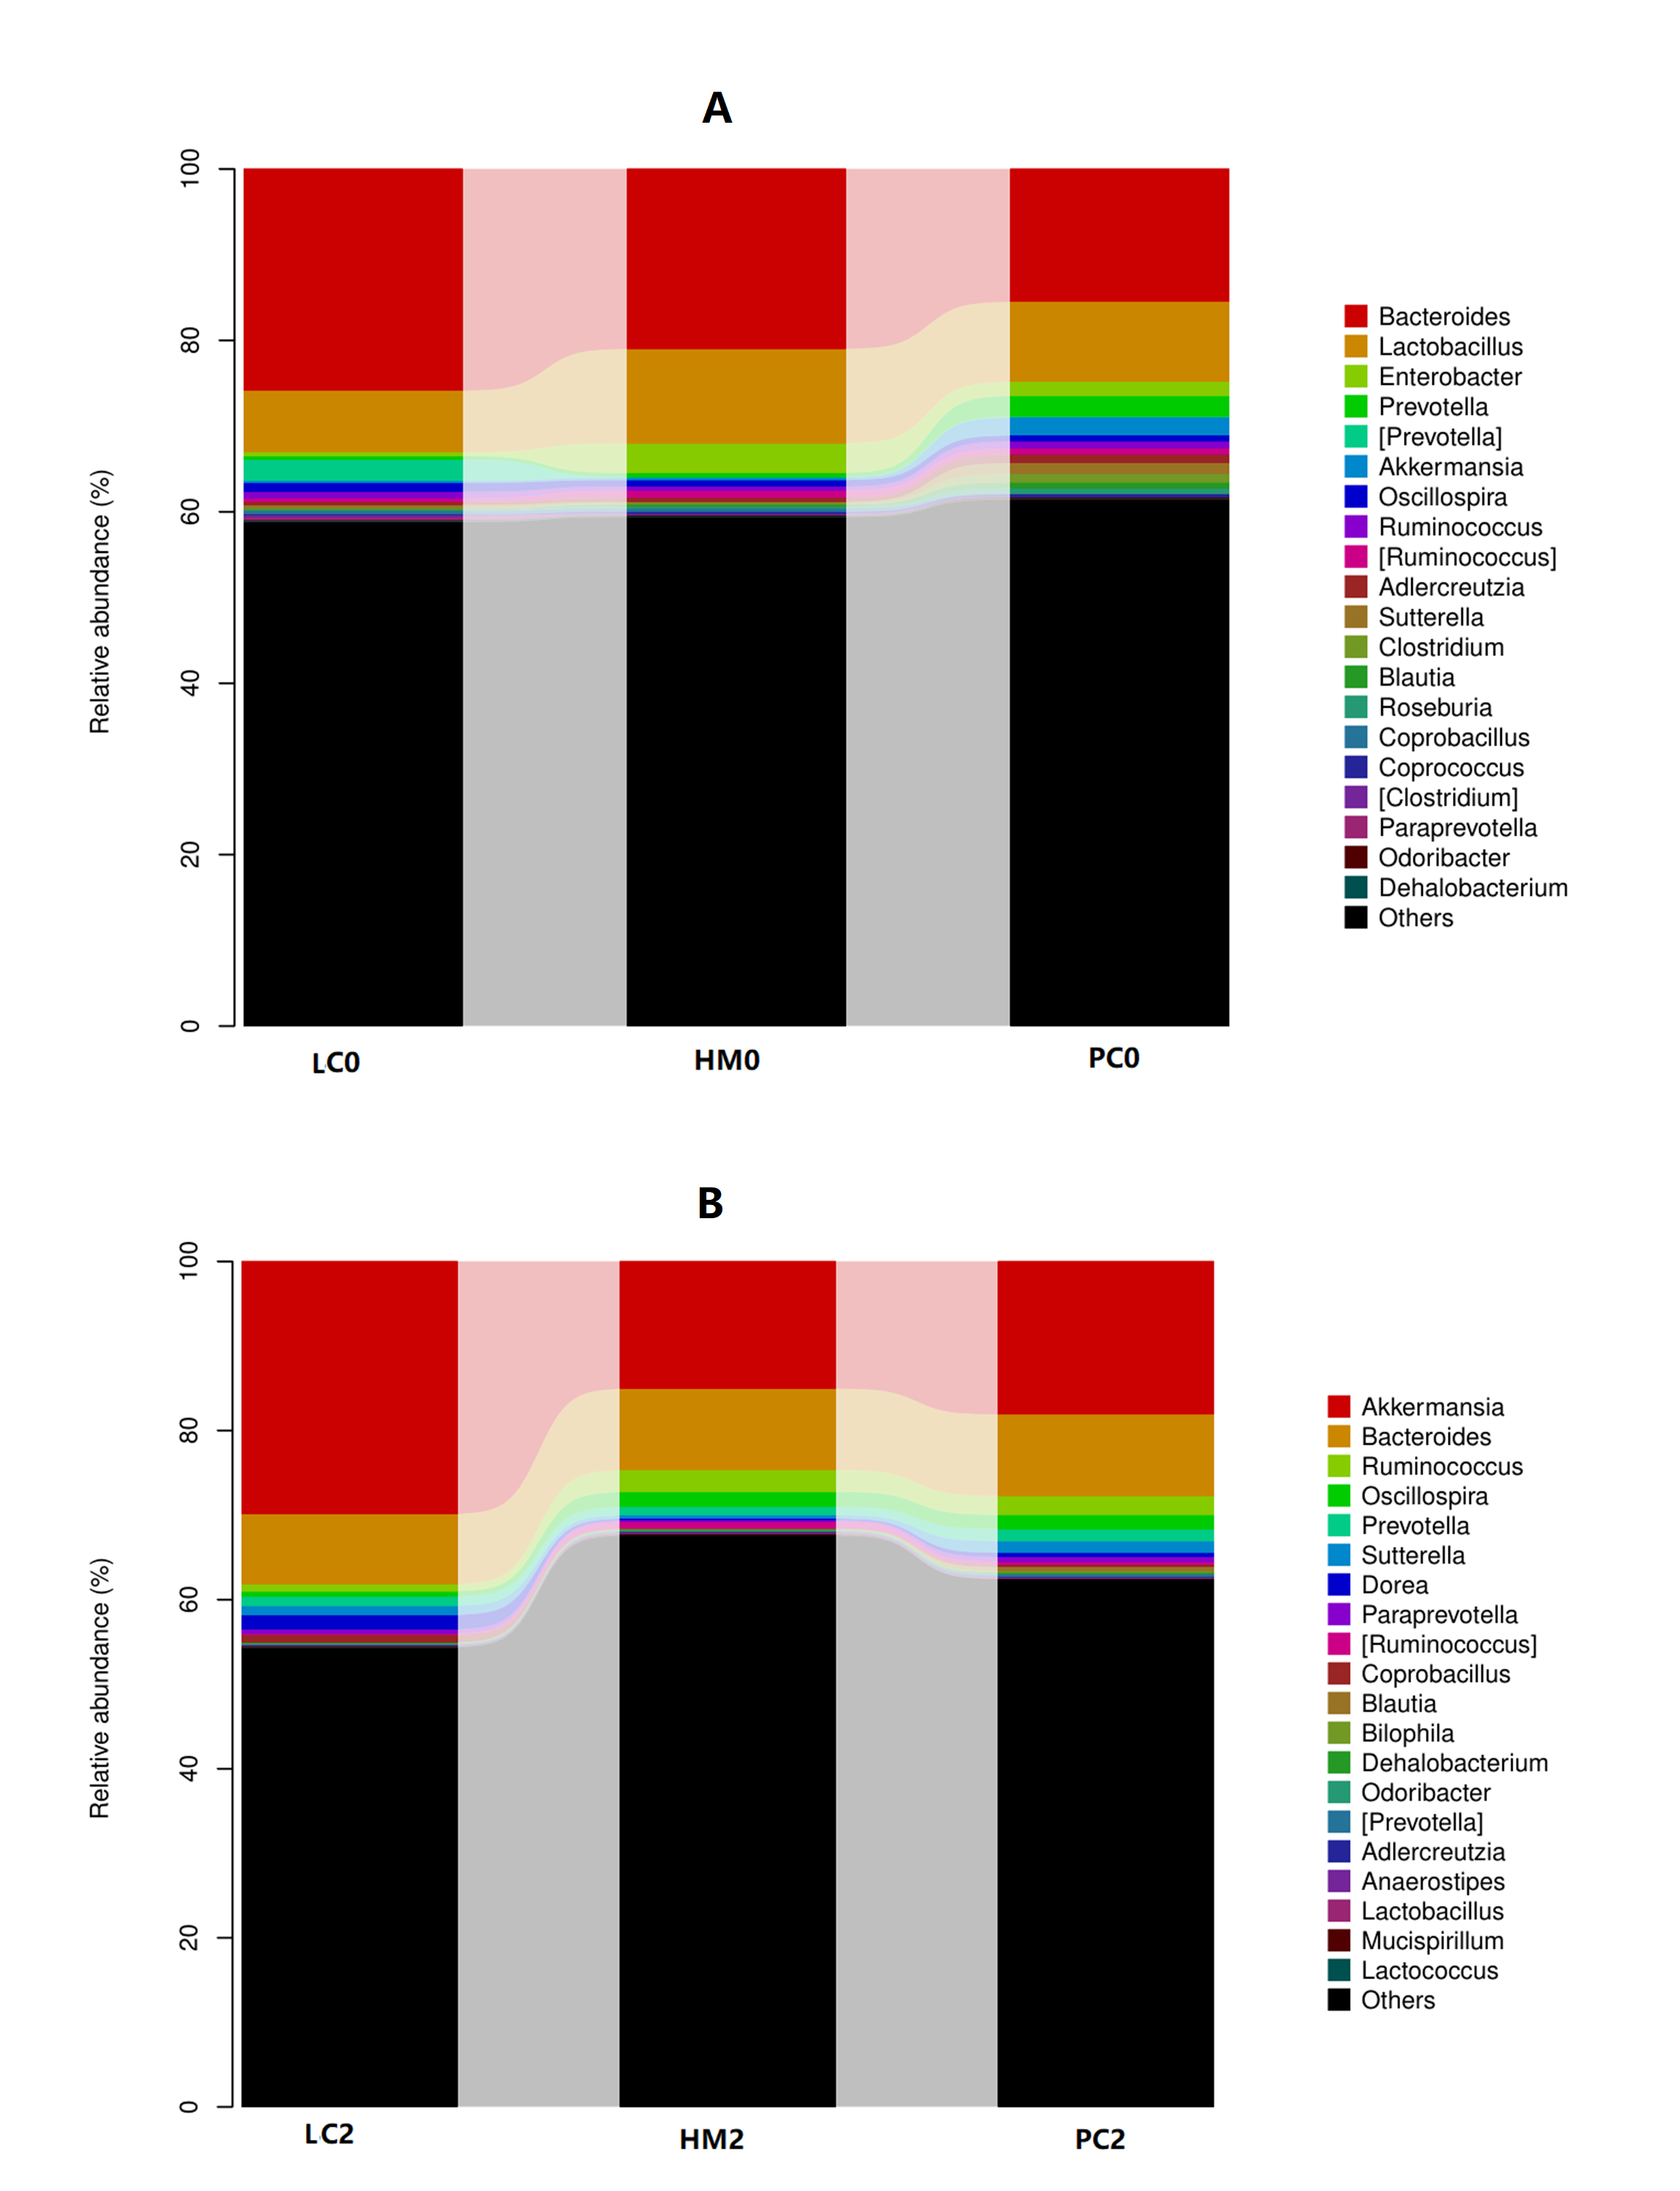
Figure 5 Comparative analysis of genus-level colonies in HM group
(A)Comparisons of HM with LC and PC in the first week(B)Comparisons of HM with LC and PC in the third week
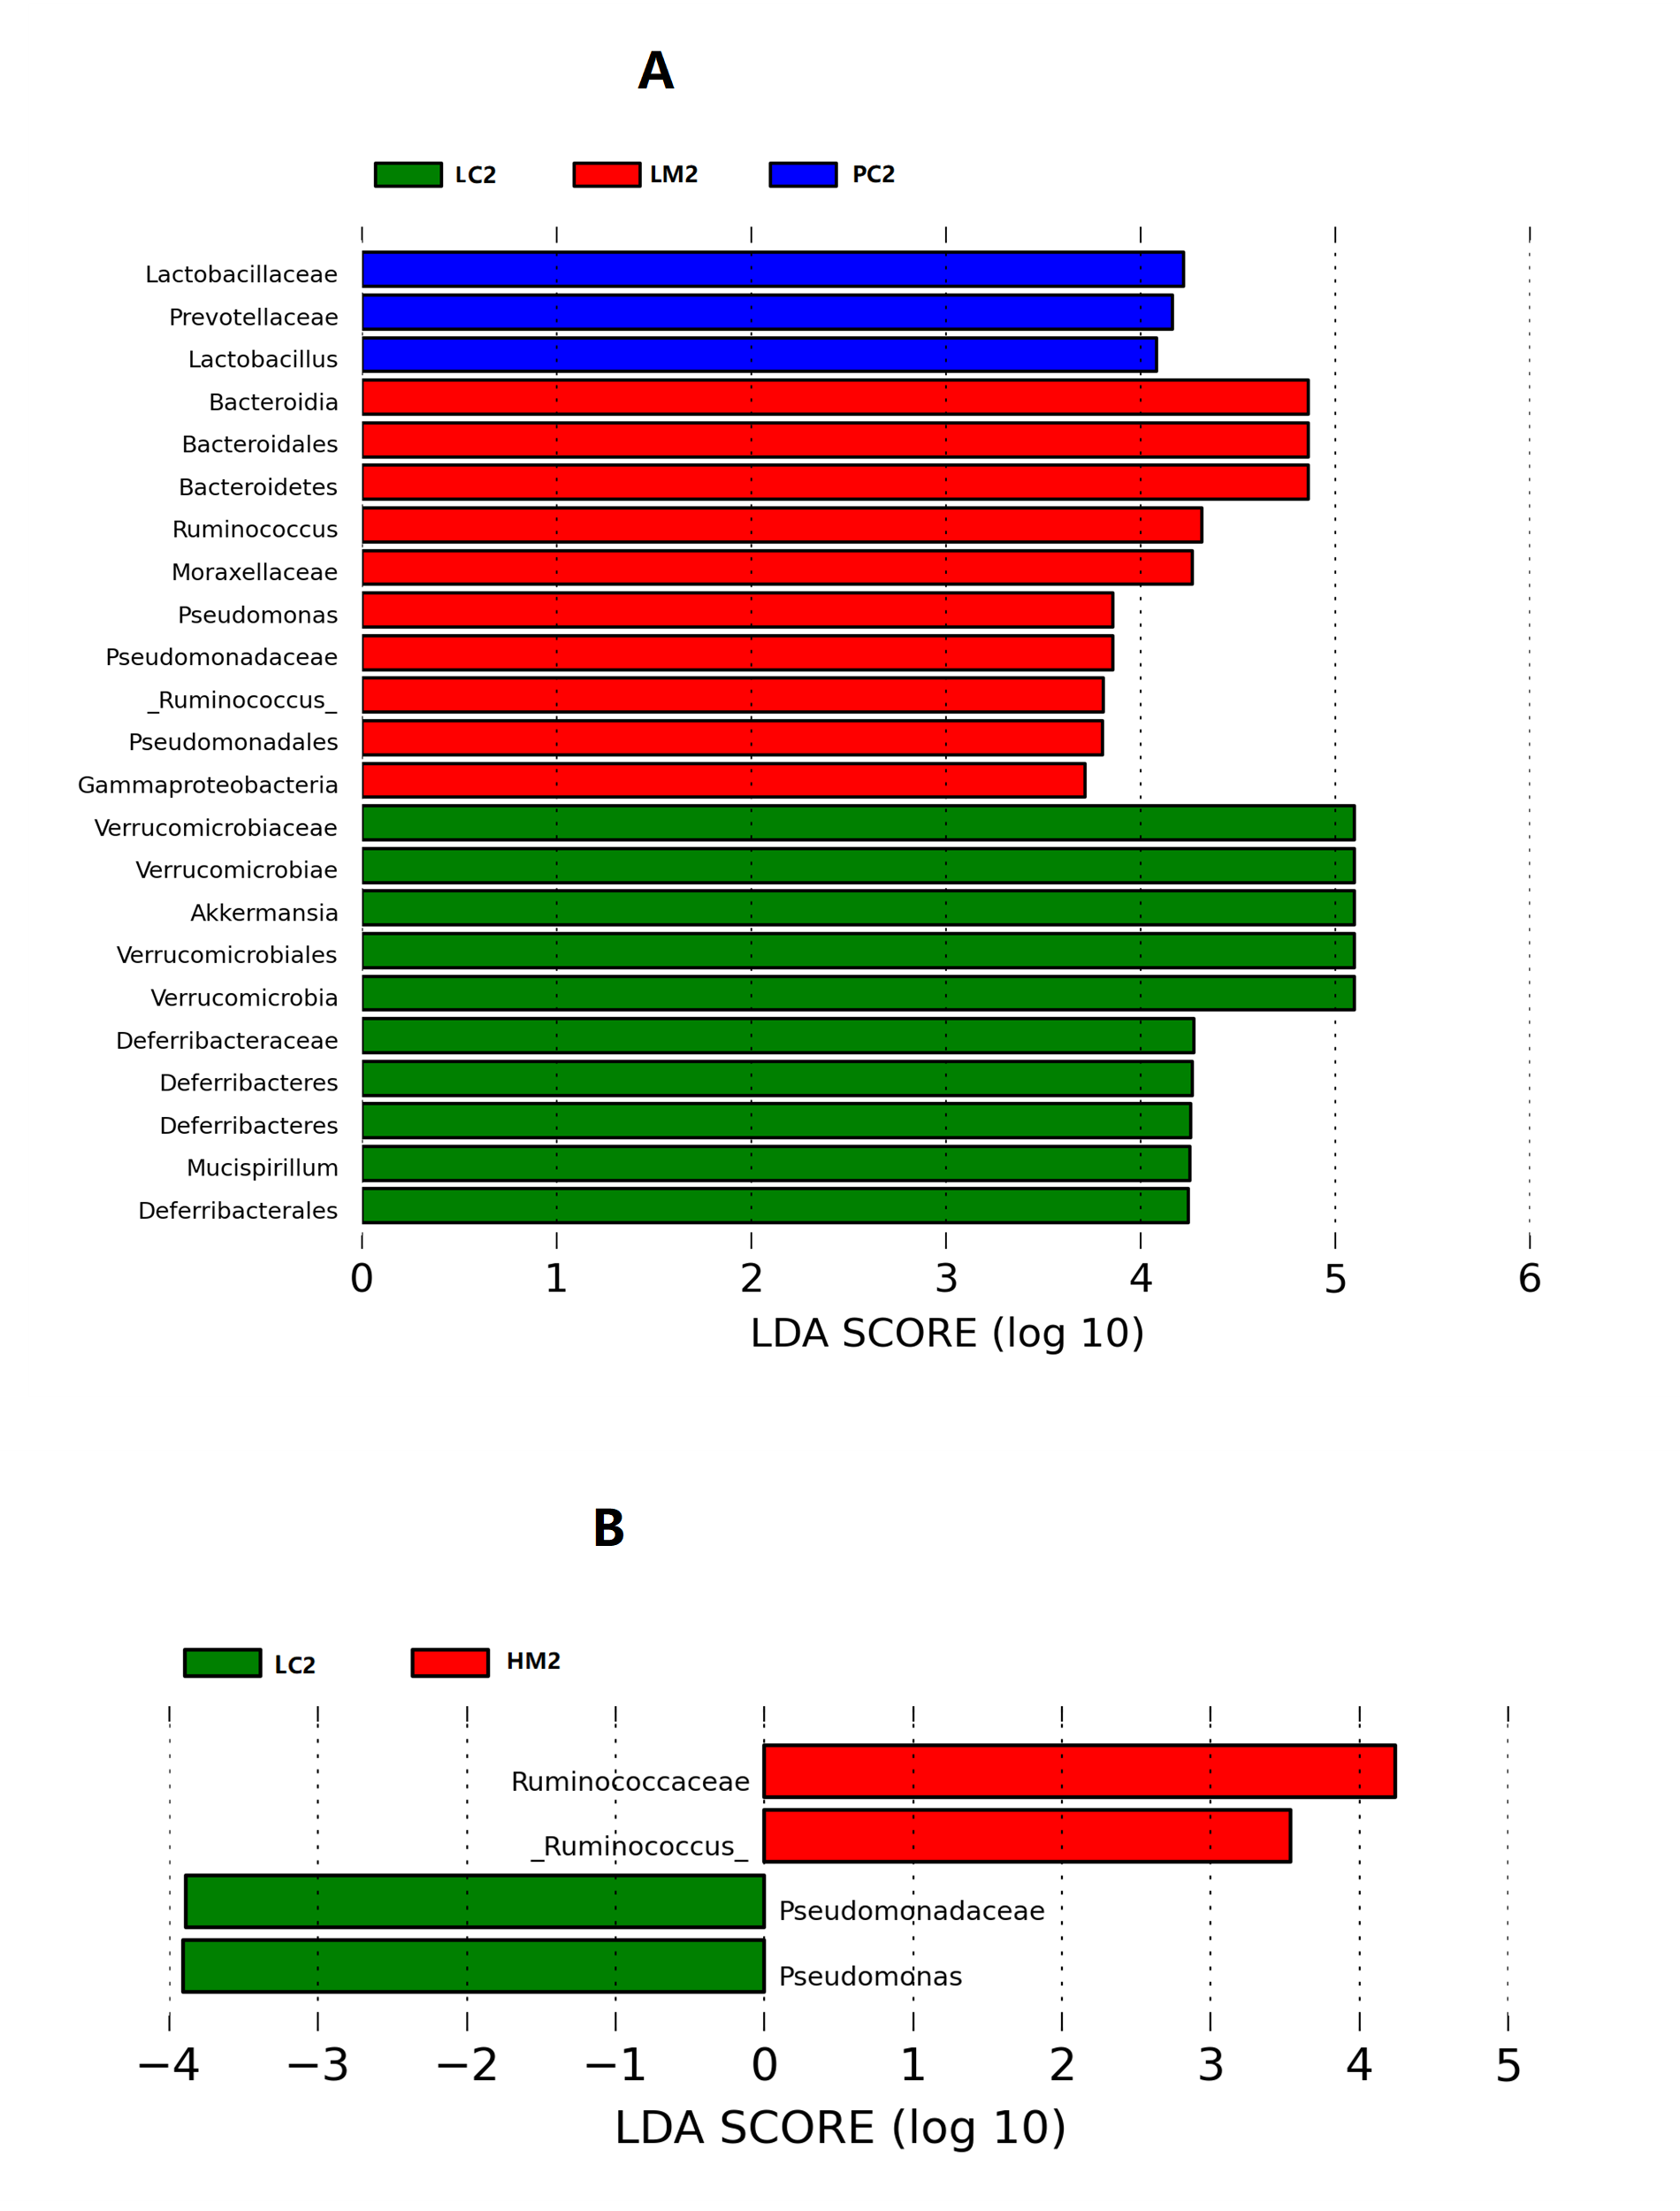
Figure 6 LDA analysis
(A)Comparison of LC, LM and PC(B)Comparison of LC and HM
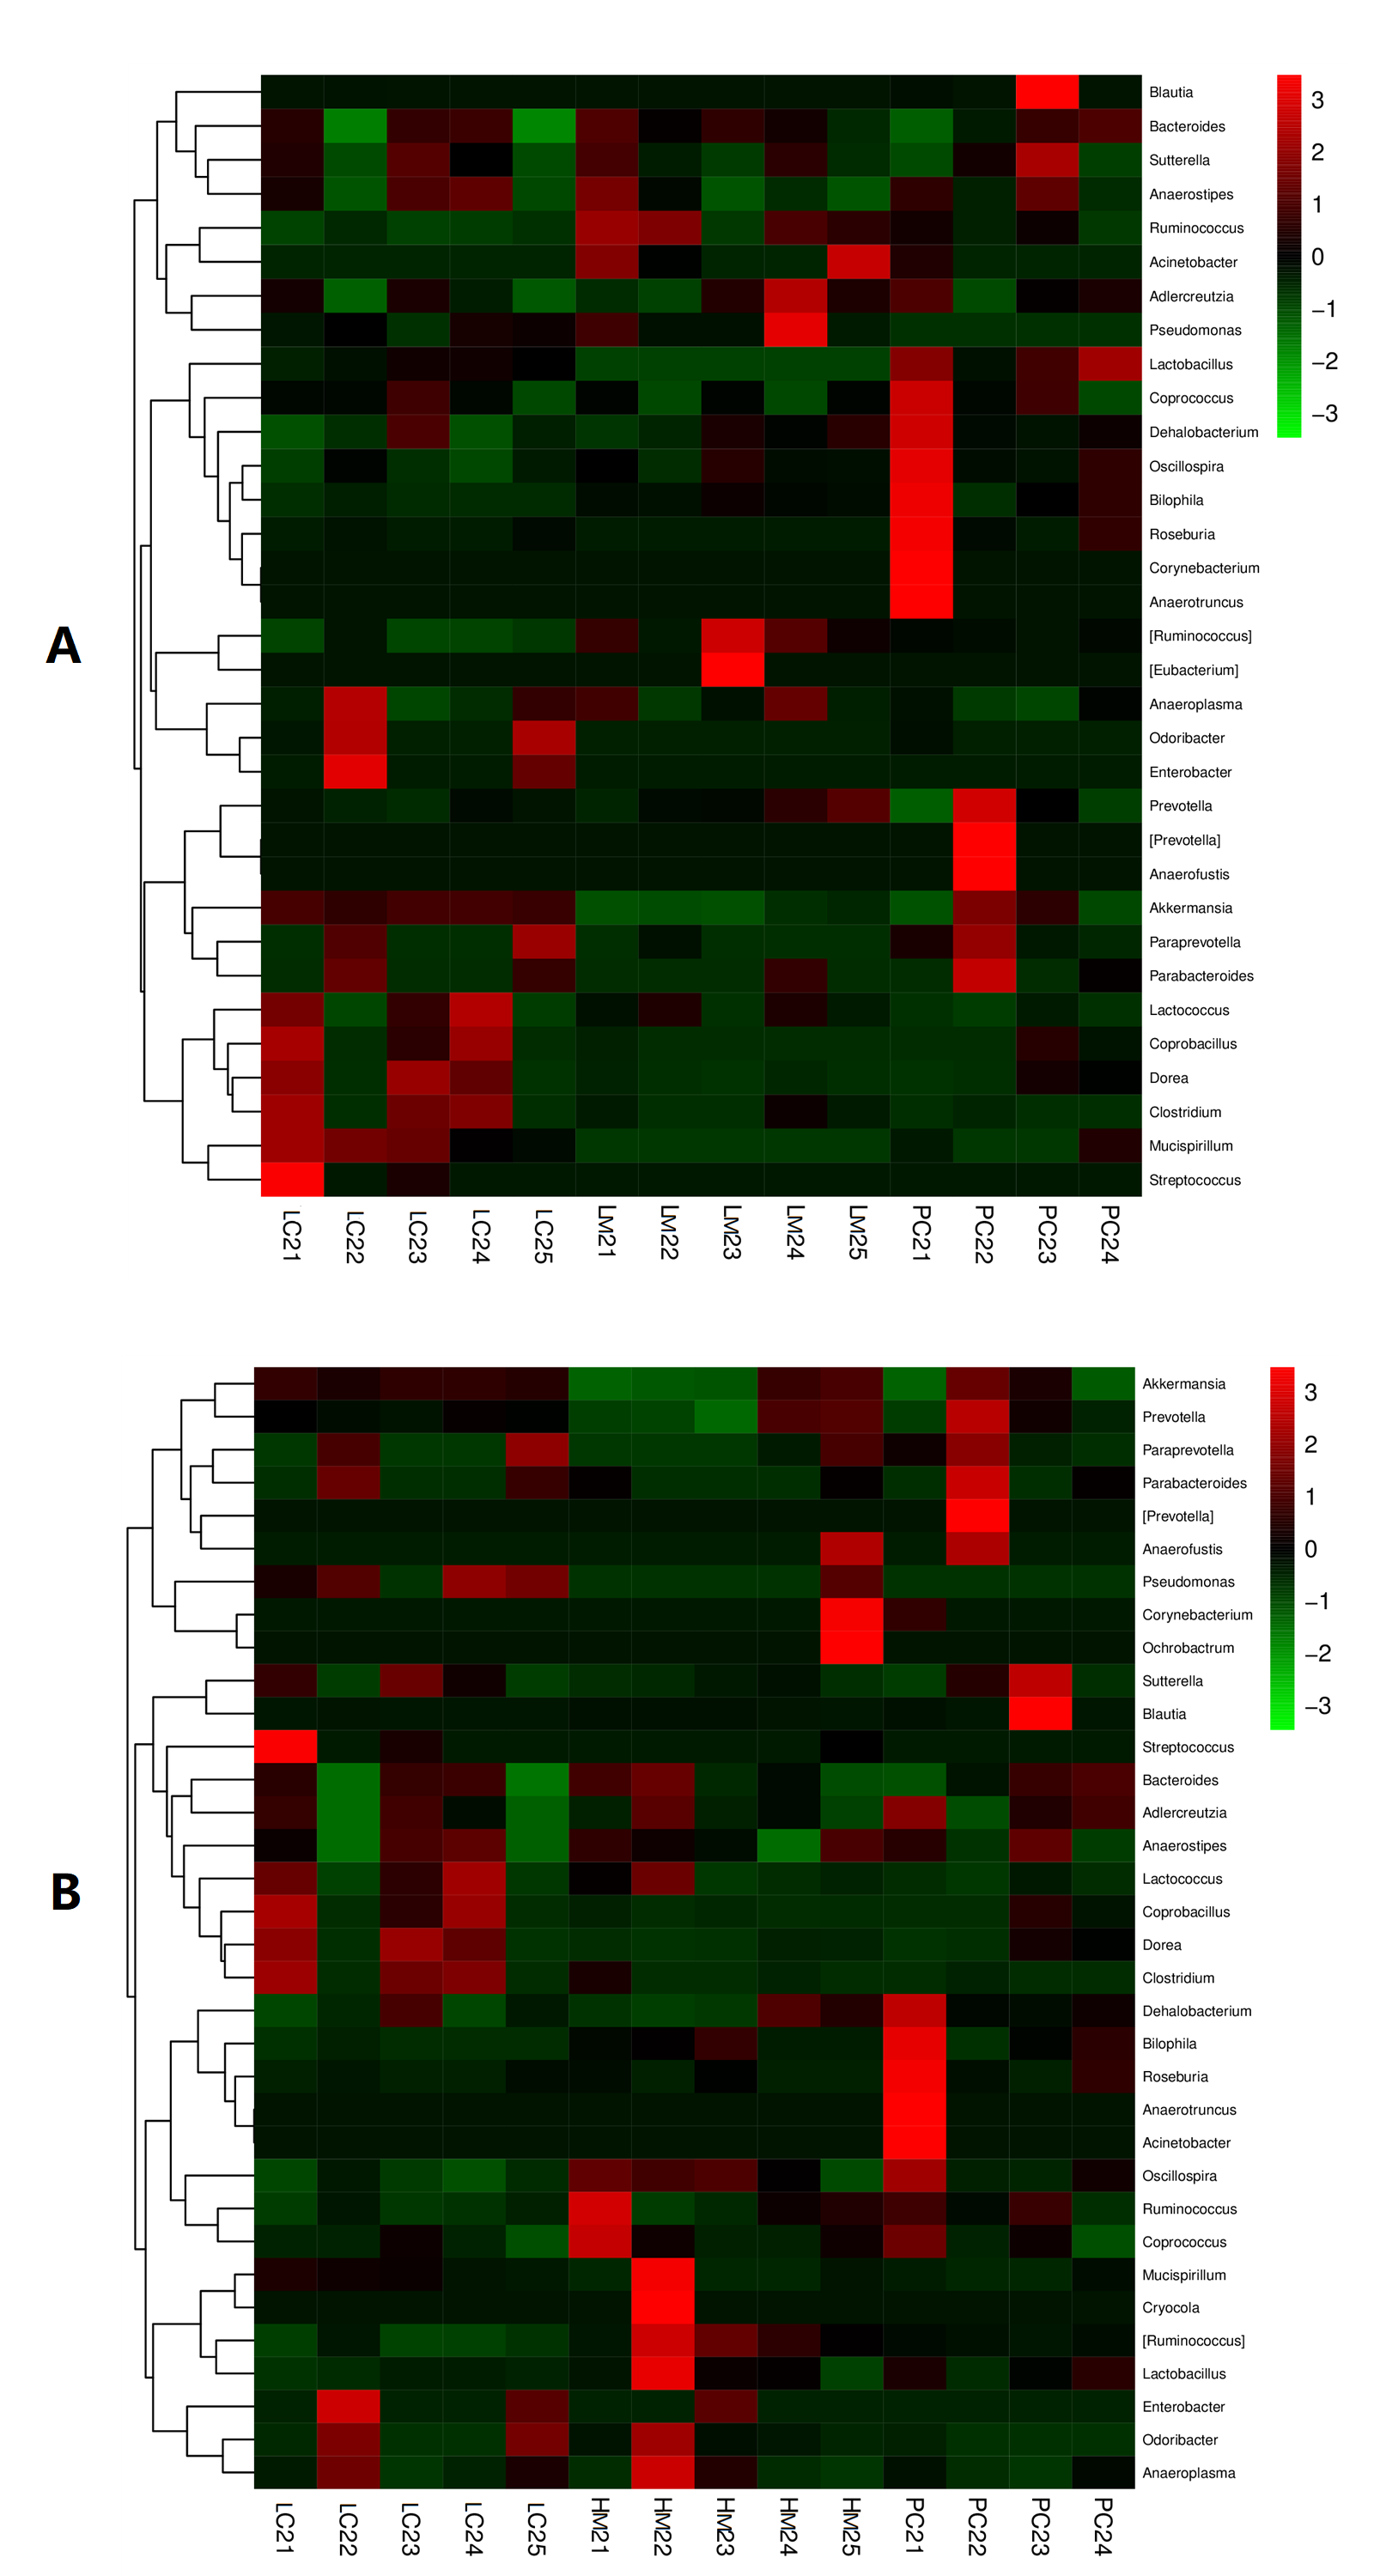
Figure 7 Hot-map analysis
(A)Colony Abundance Clustering of LC, LM and PC at the Third Week(B)Colony Abundance Clustering of LC, HM and PC at the Third Week
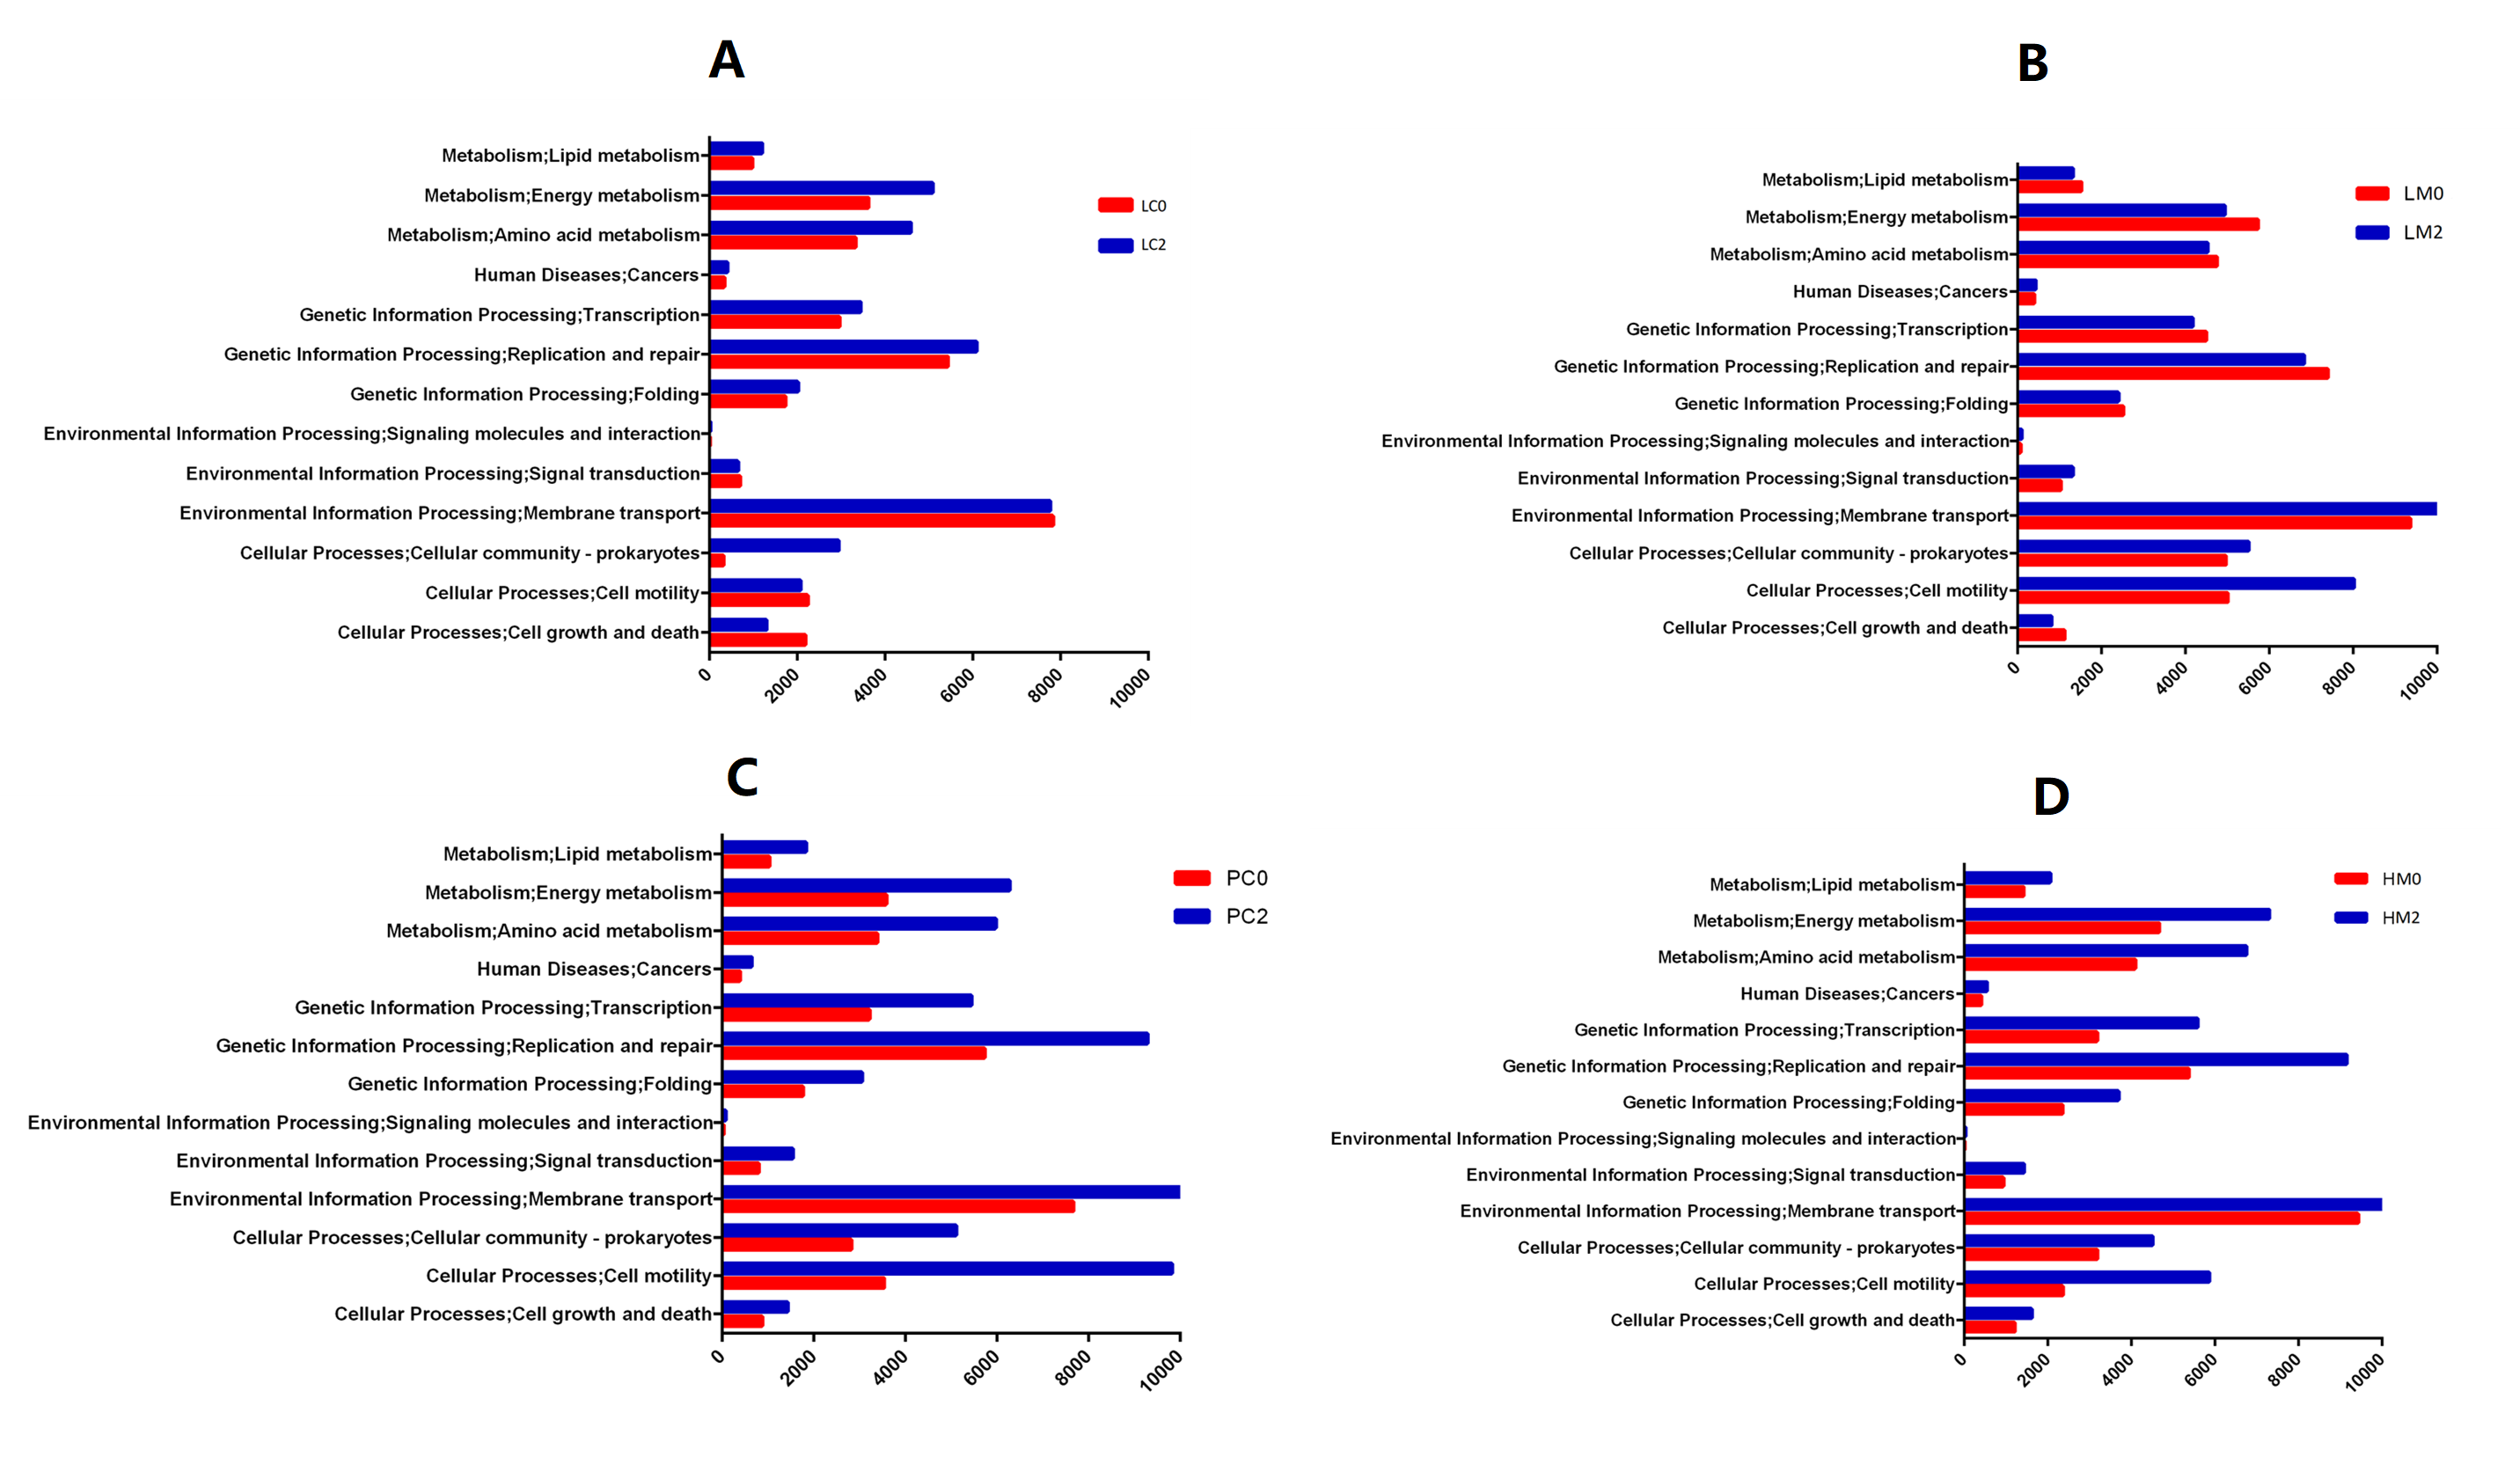
Figure 8 Comparative analysis of functional metabolism of gut microbiome
(A)Microbial metabolism in LC group during the third and first week(B)Microbial metabolism in LM group during the third and first week(C)Microbial metabolism in HM group during the third and first week(D)Microbial metabolism in PC group during the third and first week