Molecular evidence that the Channel Islands populations of the orange-crowned warbler (Oreothlypis celata; Aves: Passeriformes: Parulidae) represent a distinct evolutionary lineage
- Published
- Accepted
- Subject Areas
- Biodiversity, Genetics, Zoology
- Keywords
- mitochondrial DNA, microsatellites, bird, avian, phylogeography, North America
- Copyright
- © 2018 Hanna et al.
- Licence
- This is an open access article distributed under the terms of the Creative Commons Attribution License, which permits unrestricted use, distribution, reproduction and adaptation in any medium and for any purpose provided that it is properly attributed. For attribution, the original author(s), title, publication source (PeerJ Preprints) and either DOI or URL of the article must be cited.
- Cite this article
- 2018. Molecular evidence that the Channel Islands populations of the orange-crowned warbler (Oreothlypis celata; Aves: Passeriformes: Parulidae) represent a distinct evolutionary lineage. PeerJ Preprints 6:e27418v1 https://doi.org/10.7287/peerj.preprints.27418v1
Abstract
We used molecular data to assess the degree of genetic divergence across the breeding range of the orange-crowned warbler (Oreothlypis celata) in western North America with particular focus on characterizing the divergence between O. celata populations on the mainland of southern California and on the Channel Islands. We obtained sequences of the mitochondrial gene ND2 and genotypes at ten microsatellite data for 192 O. celata from populations spanning all four recognized subspecies. We recovered low levels of divergence between O. celata populations and genetic patterns were consistent with isolation by distance. However, populations on the Channel Islands were genetically divergent from those on the mainland. We found evidence for greater gene flow from the Channel Islands population to mainland southern California than from the mainland to the islands. We discuss these data in the context of differentiation in phenotypic and ecological characters.
Author Comment
This is a submission to PeerJ for review.
Supplemental Information
Specimen data
We provide the identifying codes and taxon of each Oreothlypis sample used in this study (including the O. ruficapilla samples used as outgroups). The institution and collection codes that precede the specimen number in each specimen identifier match those of the National Center for Biotechnology Information (NCBI) BioCollections database. We list the collections that archive each sample as well as additional information for each sample, including specific location, county, state, country, and date of collection. For the O. celata samples, we also provide a number to denote the ND2 haplotype in the column “ND2 Hap Num”, which matches the numbers used in the haplotype network figures. We list the subspecies of O. celata in the column “Ssp” and the population designation of the sample within the “8 populations” schema in the column “Population”. We provide the NCBI GenBank Accession numbers for all of the ND2 sequences we produced.
Subspecies pairwise divergence statistics
This table presents divergence statistics for pairwise subspecies comparisons calculated using ND2 mitochondrial DNA sequence (ΦST above diagonal) and microsatellite data (RST below diagonal). Values followed by asterisks are significant after applying a Bonferroni correction (p ≤ 0.008). See Table S1 for the samples included in each population.
Coastal and interior pairwise divergence statistics
This table presents divergence statistics for pairwise coastal and interior population comparisons calculated using ND2 mitochondrial DNA sequence (ΦST above diagonal) and microsatellite data (RST below diagonal). Values followed by asterisks are significant after applying a Bonferroni correction (p ≤ 0.008).
Microsatellite statistics
This table presents the statistics regarding the variability of the microsatellite loci in each population. “N” is the number of individuals genotyped. “A” is the number of alleles in the population followed by the number of private alleles in parentheses. "RS" is allelic richness, "HO" is observed heterozygosity, "HE" is expected heterozygosity, and “p-val” is the p-value resulting from a test of Hardy-Weinberg Equilibrium. P-values followed by asterisks indicate significant difference between the observed and expected heterozygosities after applying a Bonferroni correction (p < 0.005). See Table S1 for the samples included in each population.
Microsatellite genotypes
We present here the genotype values of all successfully genotyped individuals. The first row gives the names of the loci. The first column gives the sample codes of the individuals (see Table S1 for the specimens corresponding to each of these sample codes). There are two rows for each individual with a single column providing the two alleles for each individual at a locus.
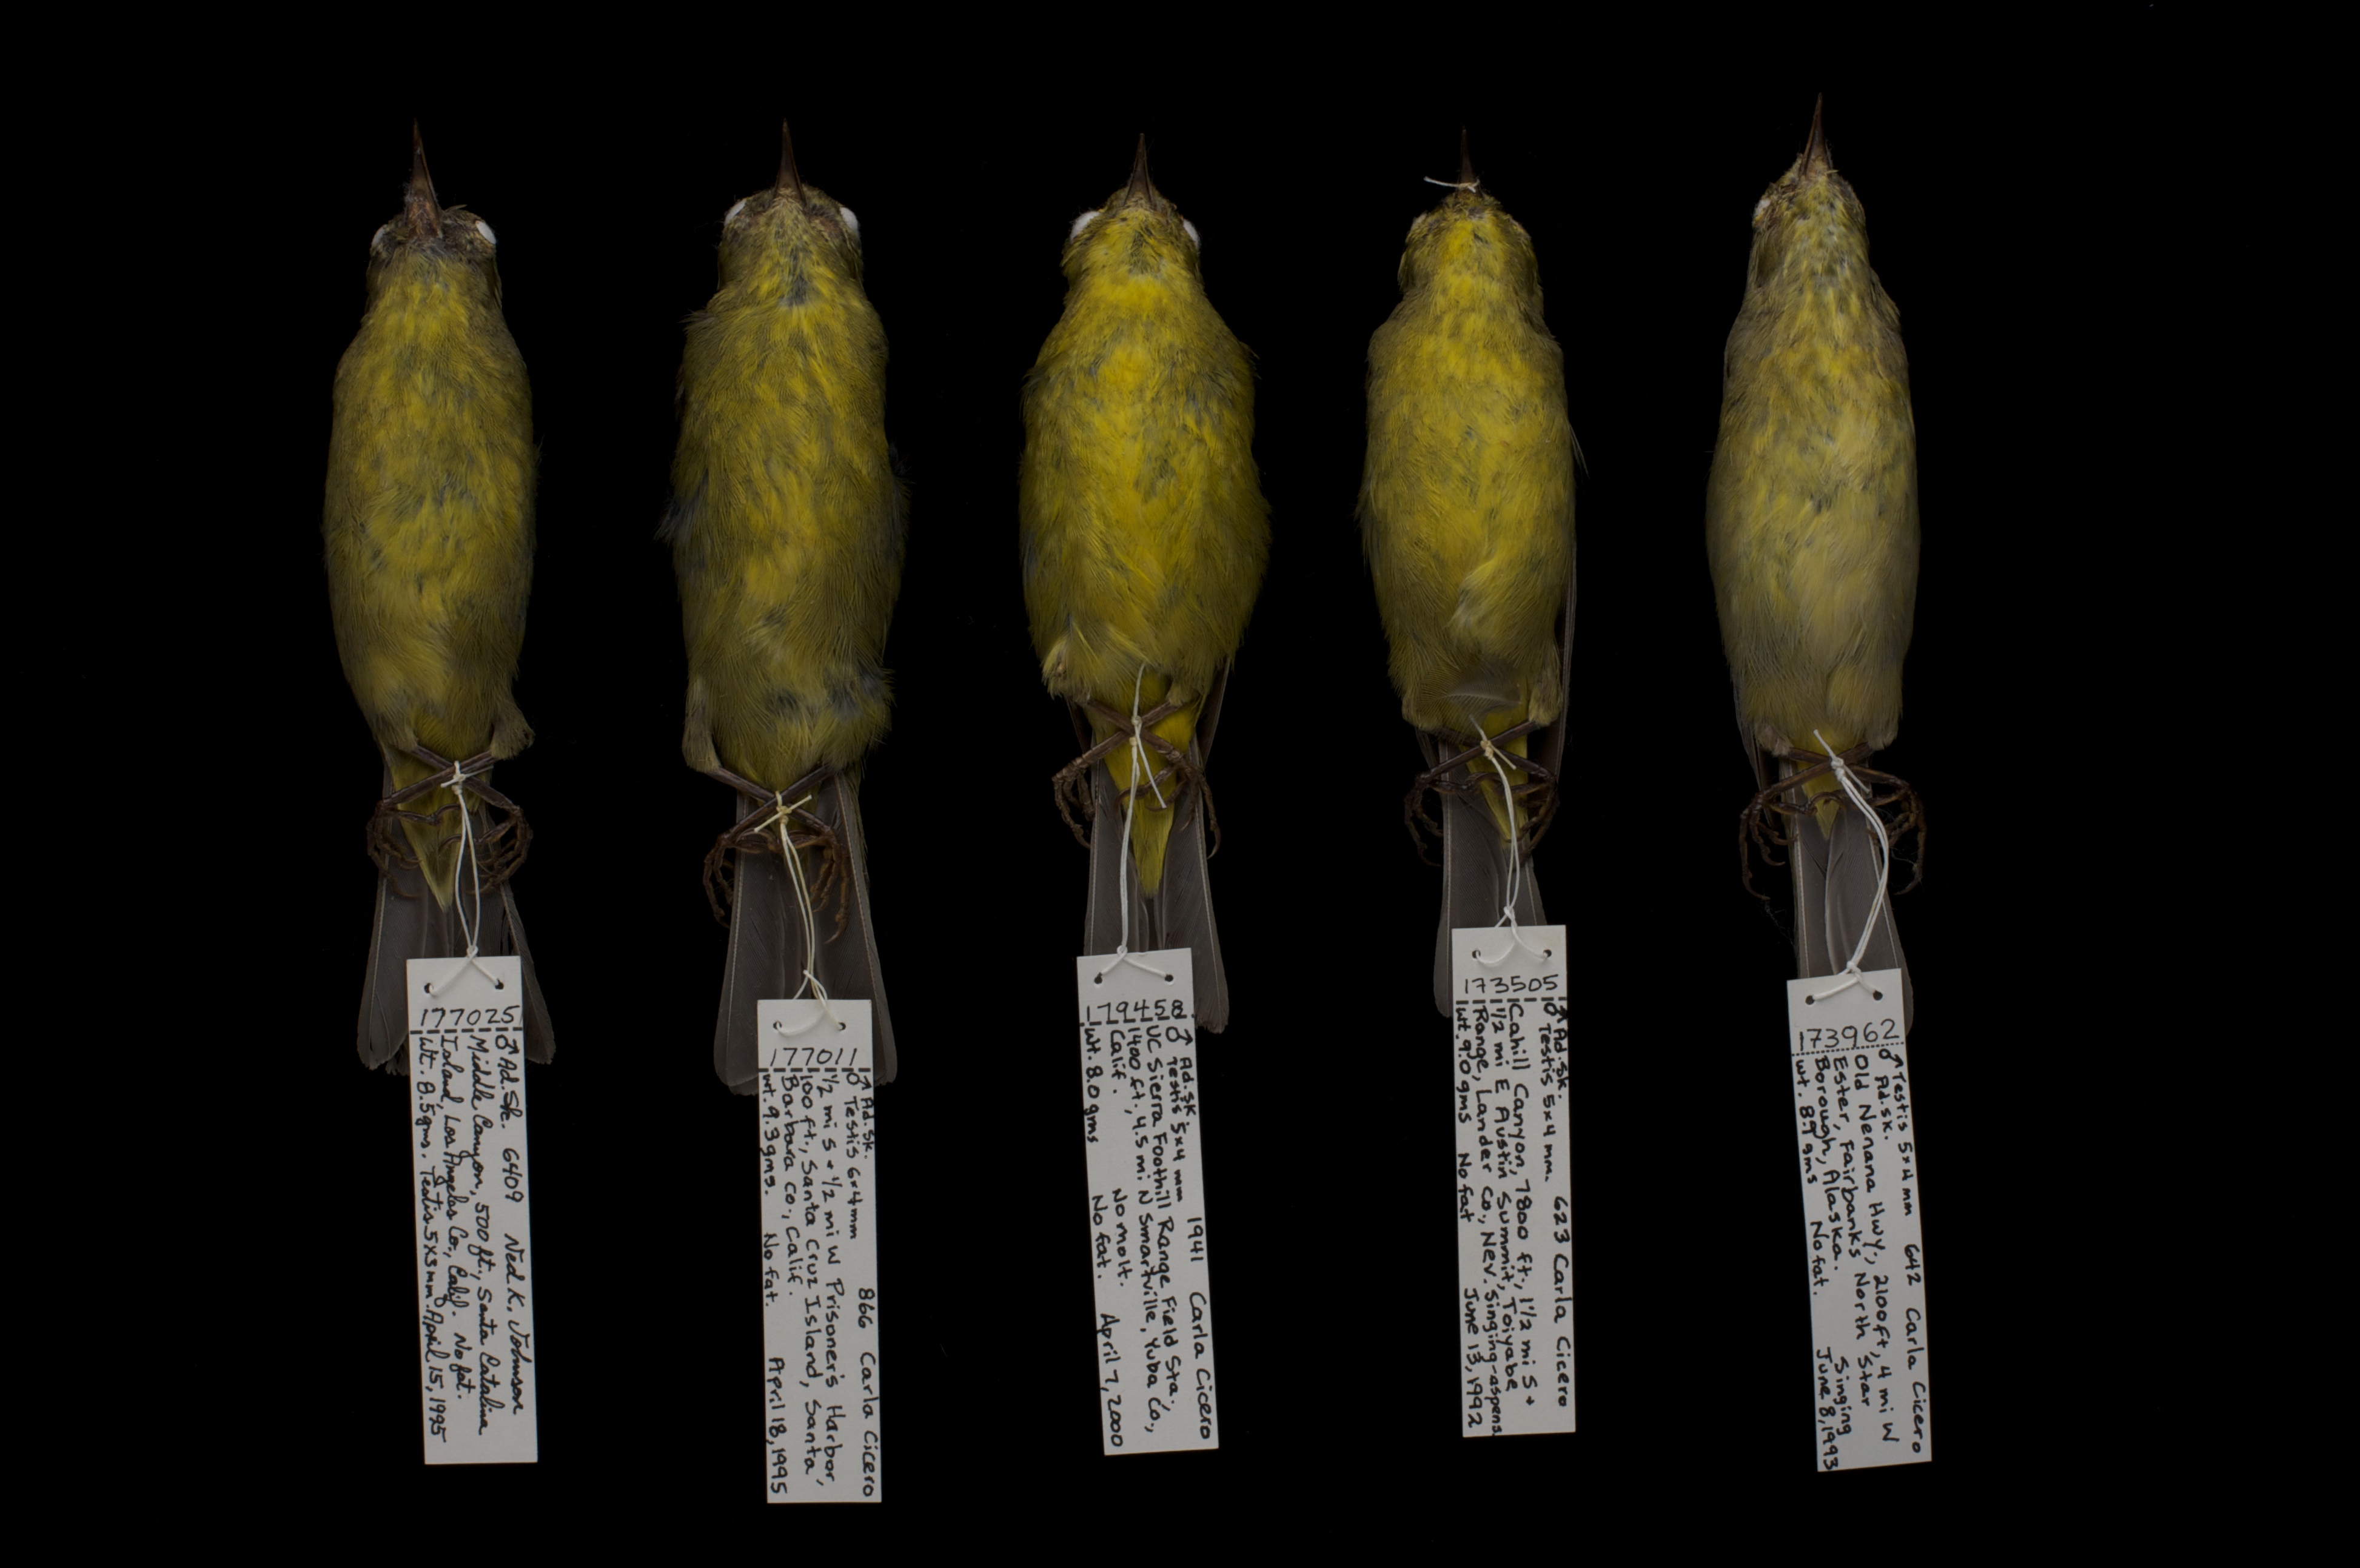
Ventral specimen photos
This is a ventral view of five Oreothlypis celata museum skins. From left to right, the specimens are MVZ:Bird:177025, MVZ:Bird:177011, MVZ:Bird:179458, MVZ:Bird:173505, and MVZ:Bird:173962. These represent the four recognized subspecies with representatives of O. c. sordida from both the southern and northern Channel Islands. From left to right, the specimens are an O. c. sordida from Santa Catalina Island; an O. c. sordida from Santa Cruz Island; an O. c. lutescens from interior northern California; an O. c. orestera from Nevada; and an O. c. celata from Fairbanks, Alaska. Image taken by Anand Varma, reproduced with permission.
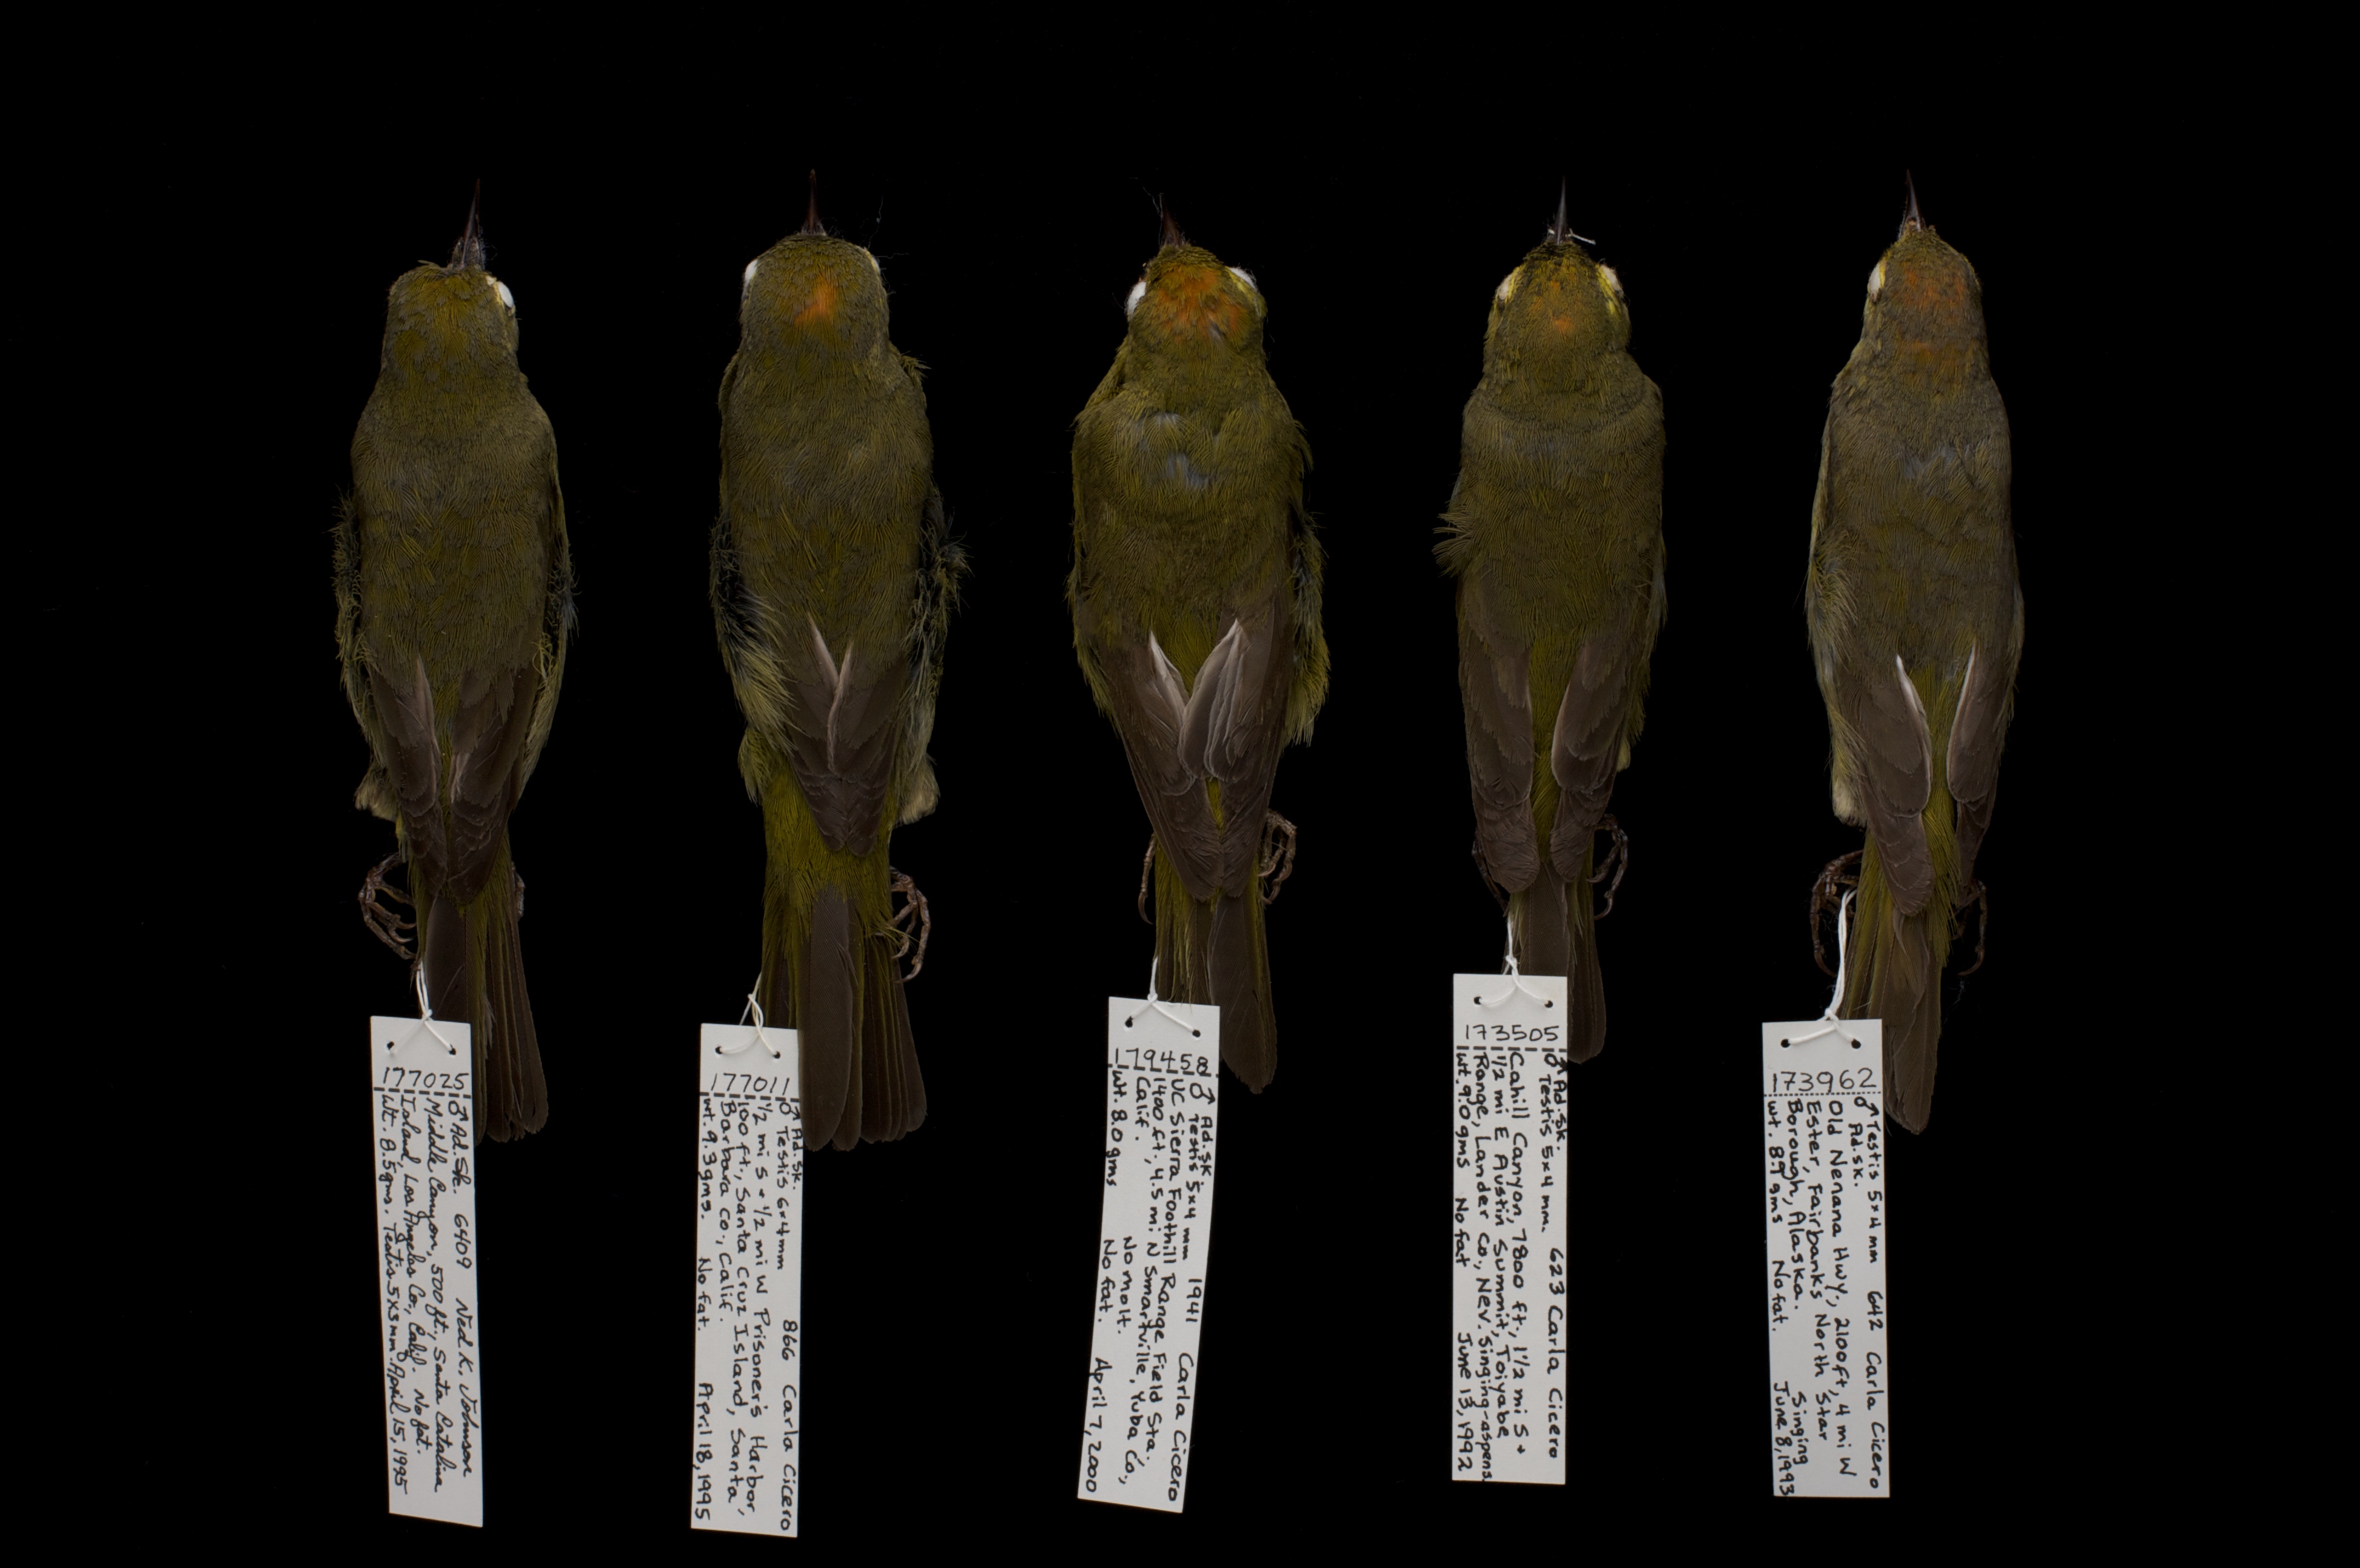
Dorsal specimen photos
This is a dorsal-view of the same five specimens seen in Figure S1. Image taken by Anand Varma, reproduced with permission.
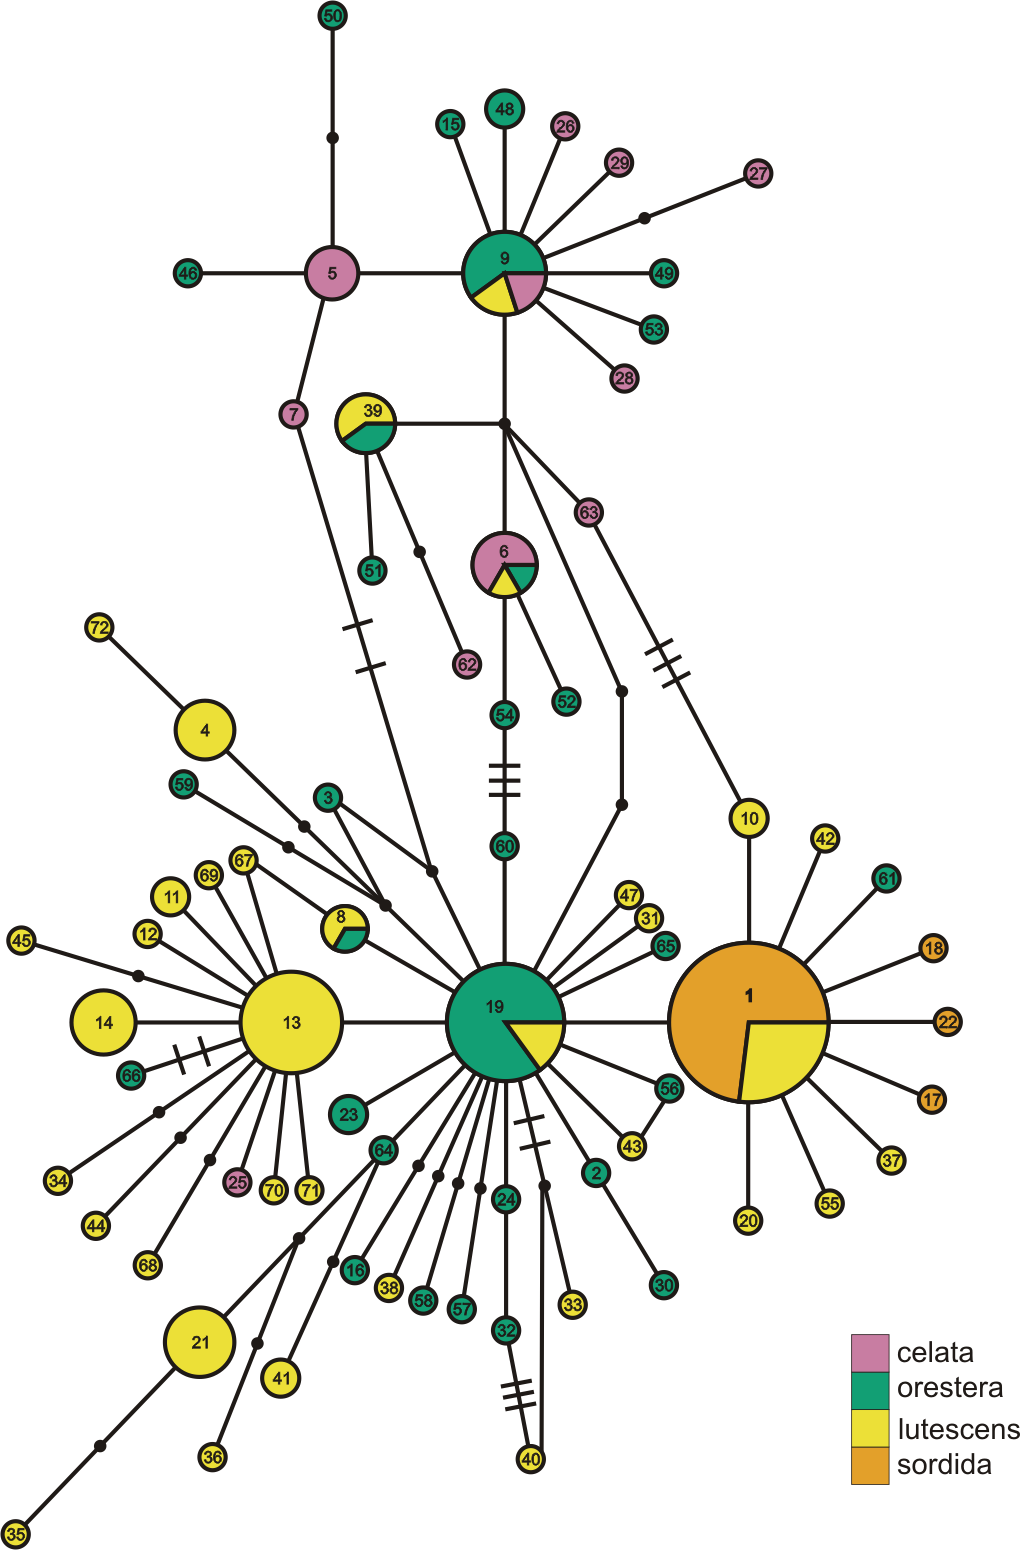
ND2 haplotype network with subspecies population grouping
This is the ND2 haplotype network colored by the subspecies designations of samples. The haplotype numbers correspond with the numbers in Table S1. The size of each circle is proportional to the number of individuals with that haplotype. Lines connect haplotypes that differ by one mutation. Dots represent inferred haplotypes. Hash marks indicate the number of mutations between haplotypes separated by more than one mutation.
ND2 haplotype network with coast-interior population grouping
This is the ND2 haplotype network colored by samples’ grouping into coast and interior populations. See Figure S3 for the haplotype numbers that correspond with the numbers in Table S1. The size of each circle is proportional to the number of individuals with that haplotype. Lines connect haplotypes that differ by one mutation. Dots represent inferred haplotypes. Hash marks indicate the number of mutations between haplotypes separated by more than one mutation.
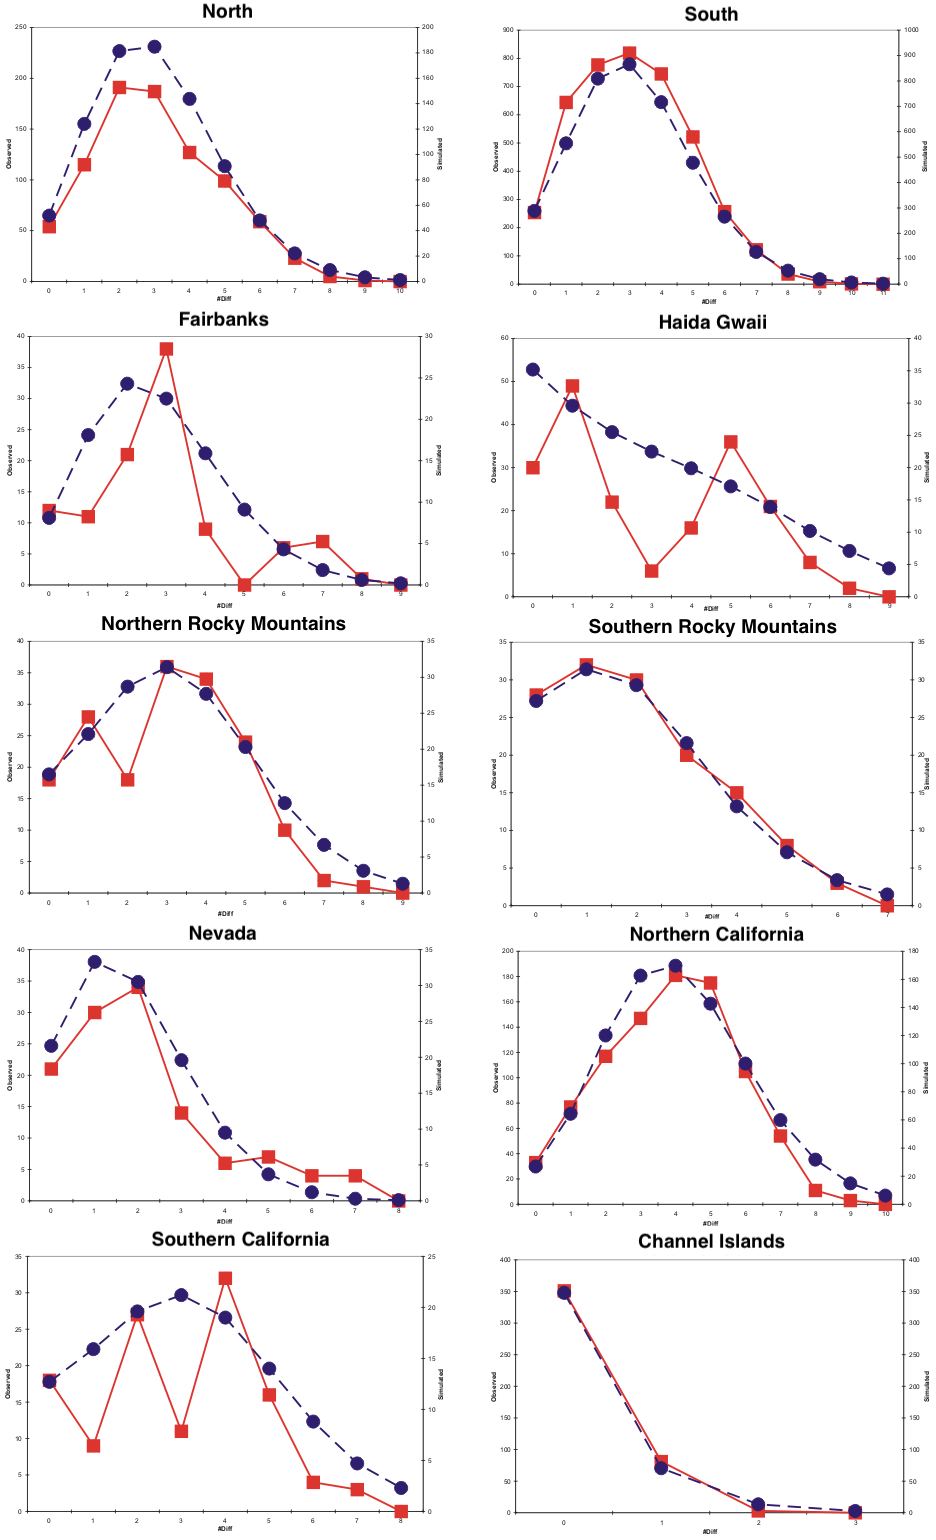
Mismatch distributions
Depicted here are mismatch distributions for ten populations. Square points connected by smooth lines represent observed distributions. Circular points connected by dotted lines represent expected distributions for a growing population with the same mean.
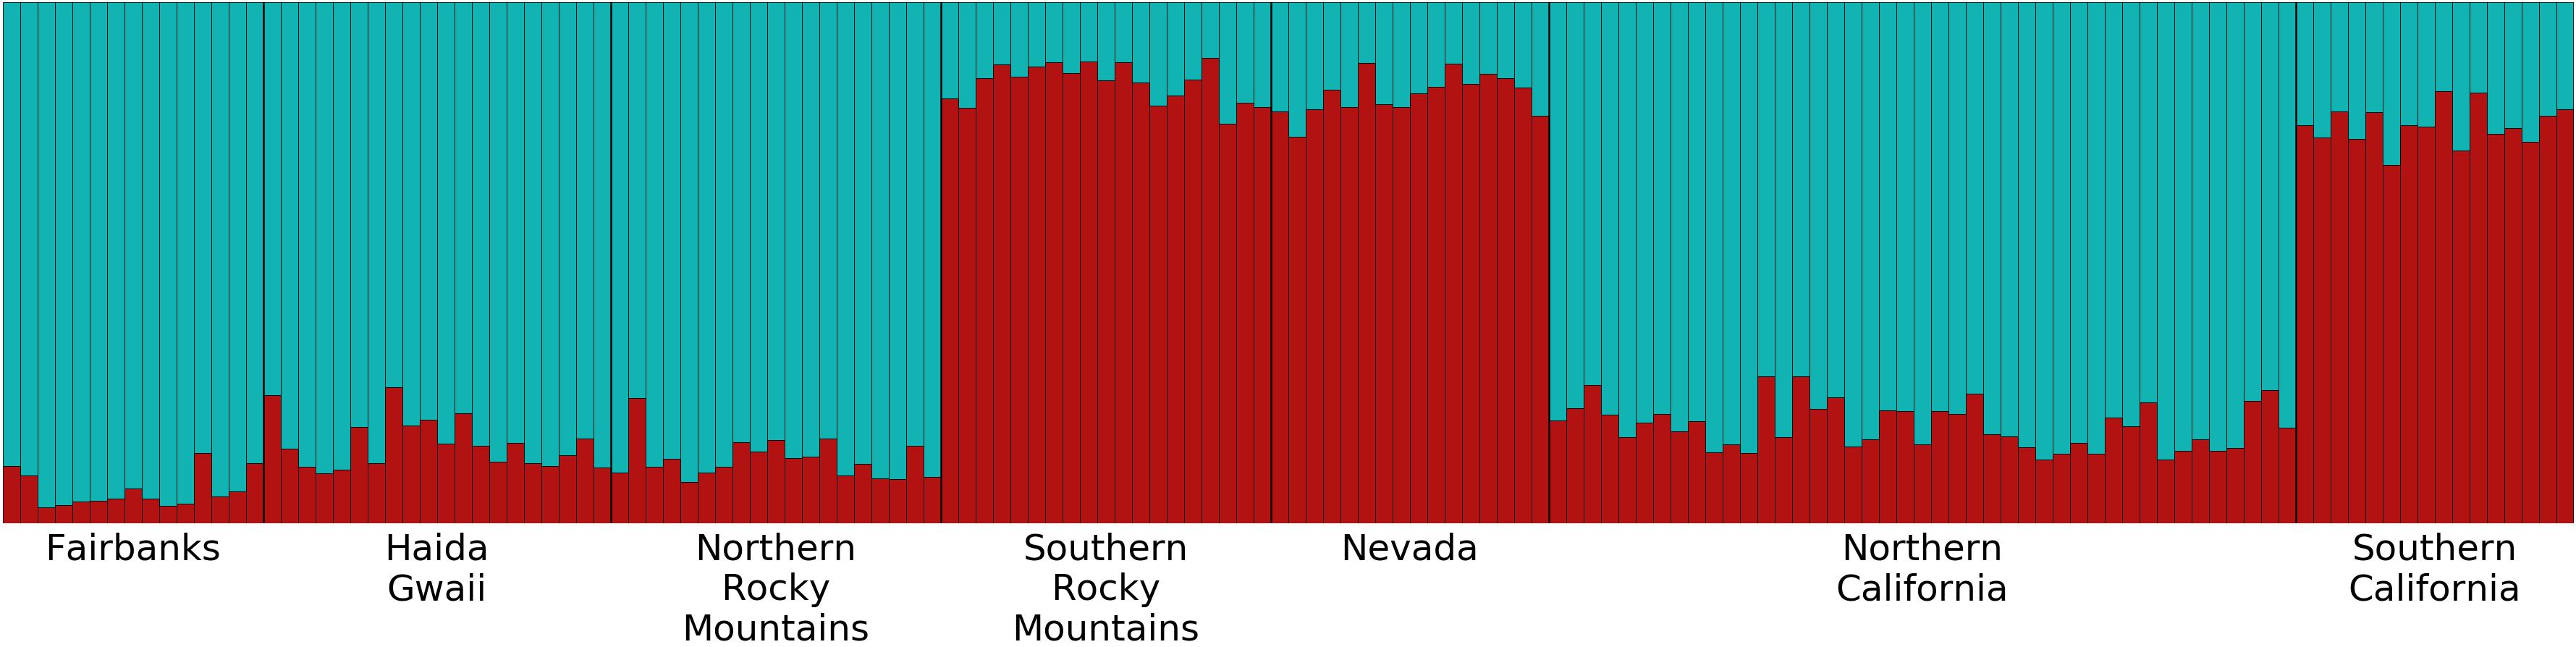
Structure plot for K=2 with Channel Islands population excluded
This figure depicts the ancestry of each individual in the two genetic clusters identified by Structure within the seven labeled populations after we excluded the Channel Islands population. Different colors represent the two genetic clusters identified by Structure. Each vertical bar represents an individual Oreothlypis celata. The height of each color in a given bar illustrates the proportion of ancestry derived from each genetic cluster for that individual.