An example of SAR-derived image segmentation for landslides detection
- Published
- Accepted
- Subject Areas
- Spatial and Geographic Information Systems
- Keywords
- Synthetic Aperture Radar (SAR), Sentinel-1, Backscattering, Change Detection, Image Segmentation, Landslides, Papua New Guinea
- Copyright
- © 2018 Esposito et al.
- Licence
- This is an open access article distributed under the terms of the Creative Commons Attribution License, which permits unrestricted use, distribution, reproduction and adaptation in any medium and for any purpose provided that it is properly attributed. For attribution, the original author(s), title, publication source (PeerJ Preprints) and either DOI or URL of the article must be cited.
- Cite this article
- 2018. An example of SAR-derived image segmentation for landslides detection. PeerJ Preprints 6:e27212v2 https://doi.org/10.7287/peerj.preprints.27212v2
Abstract
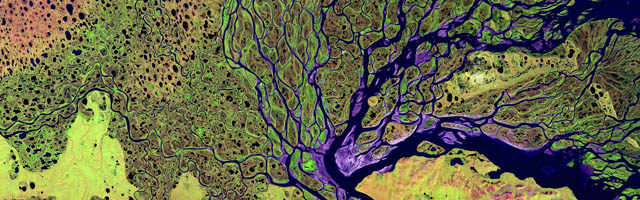
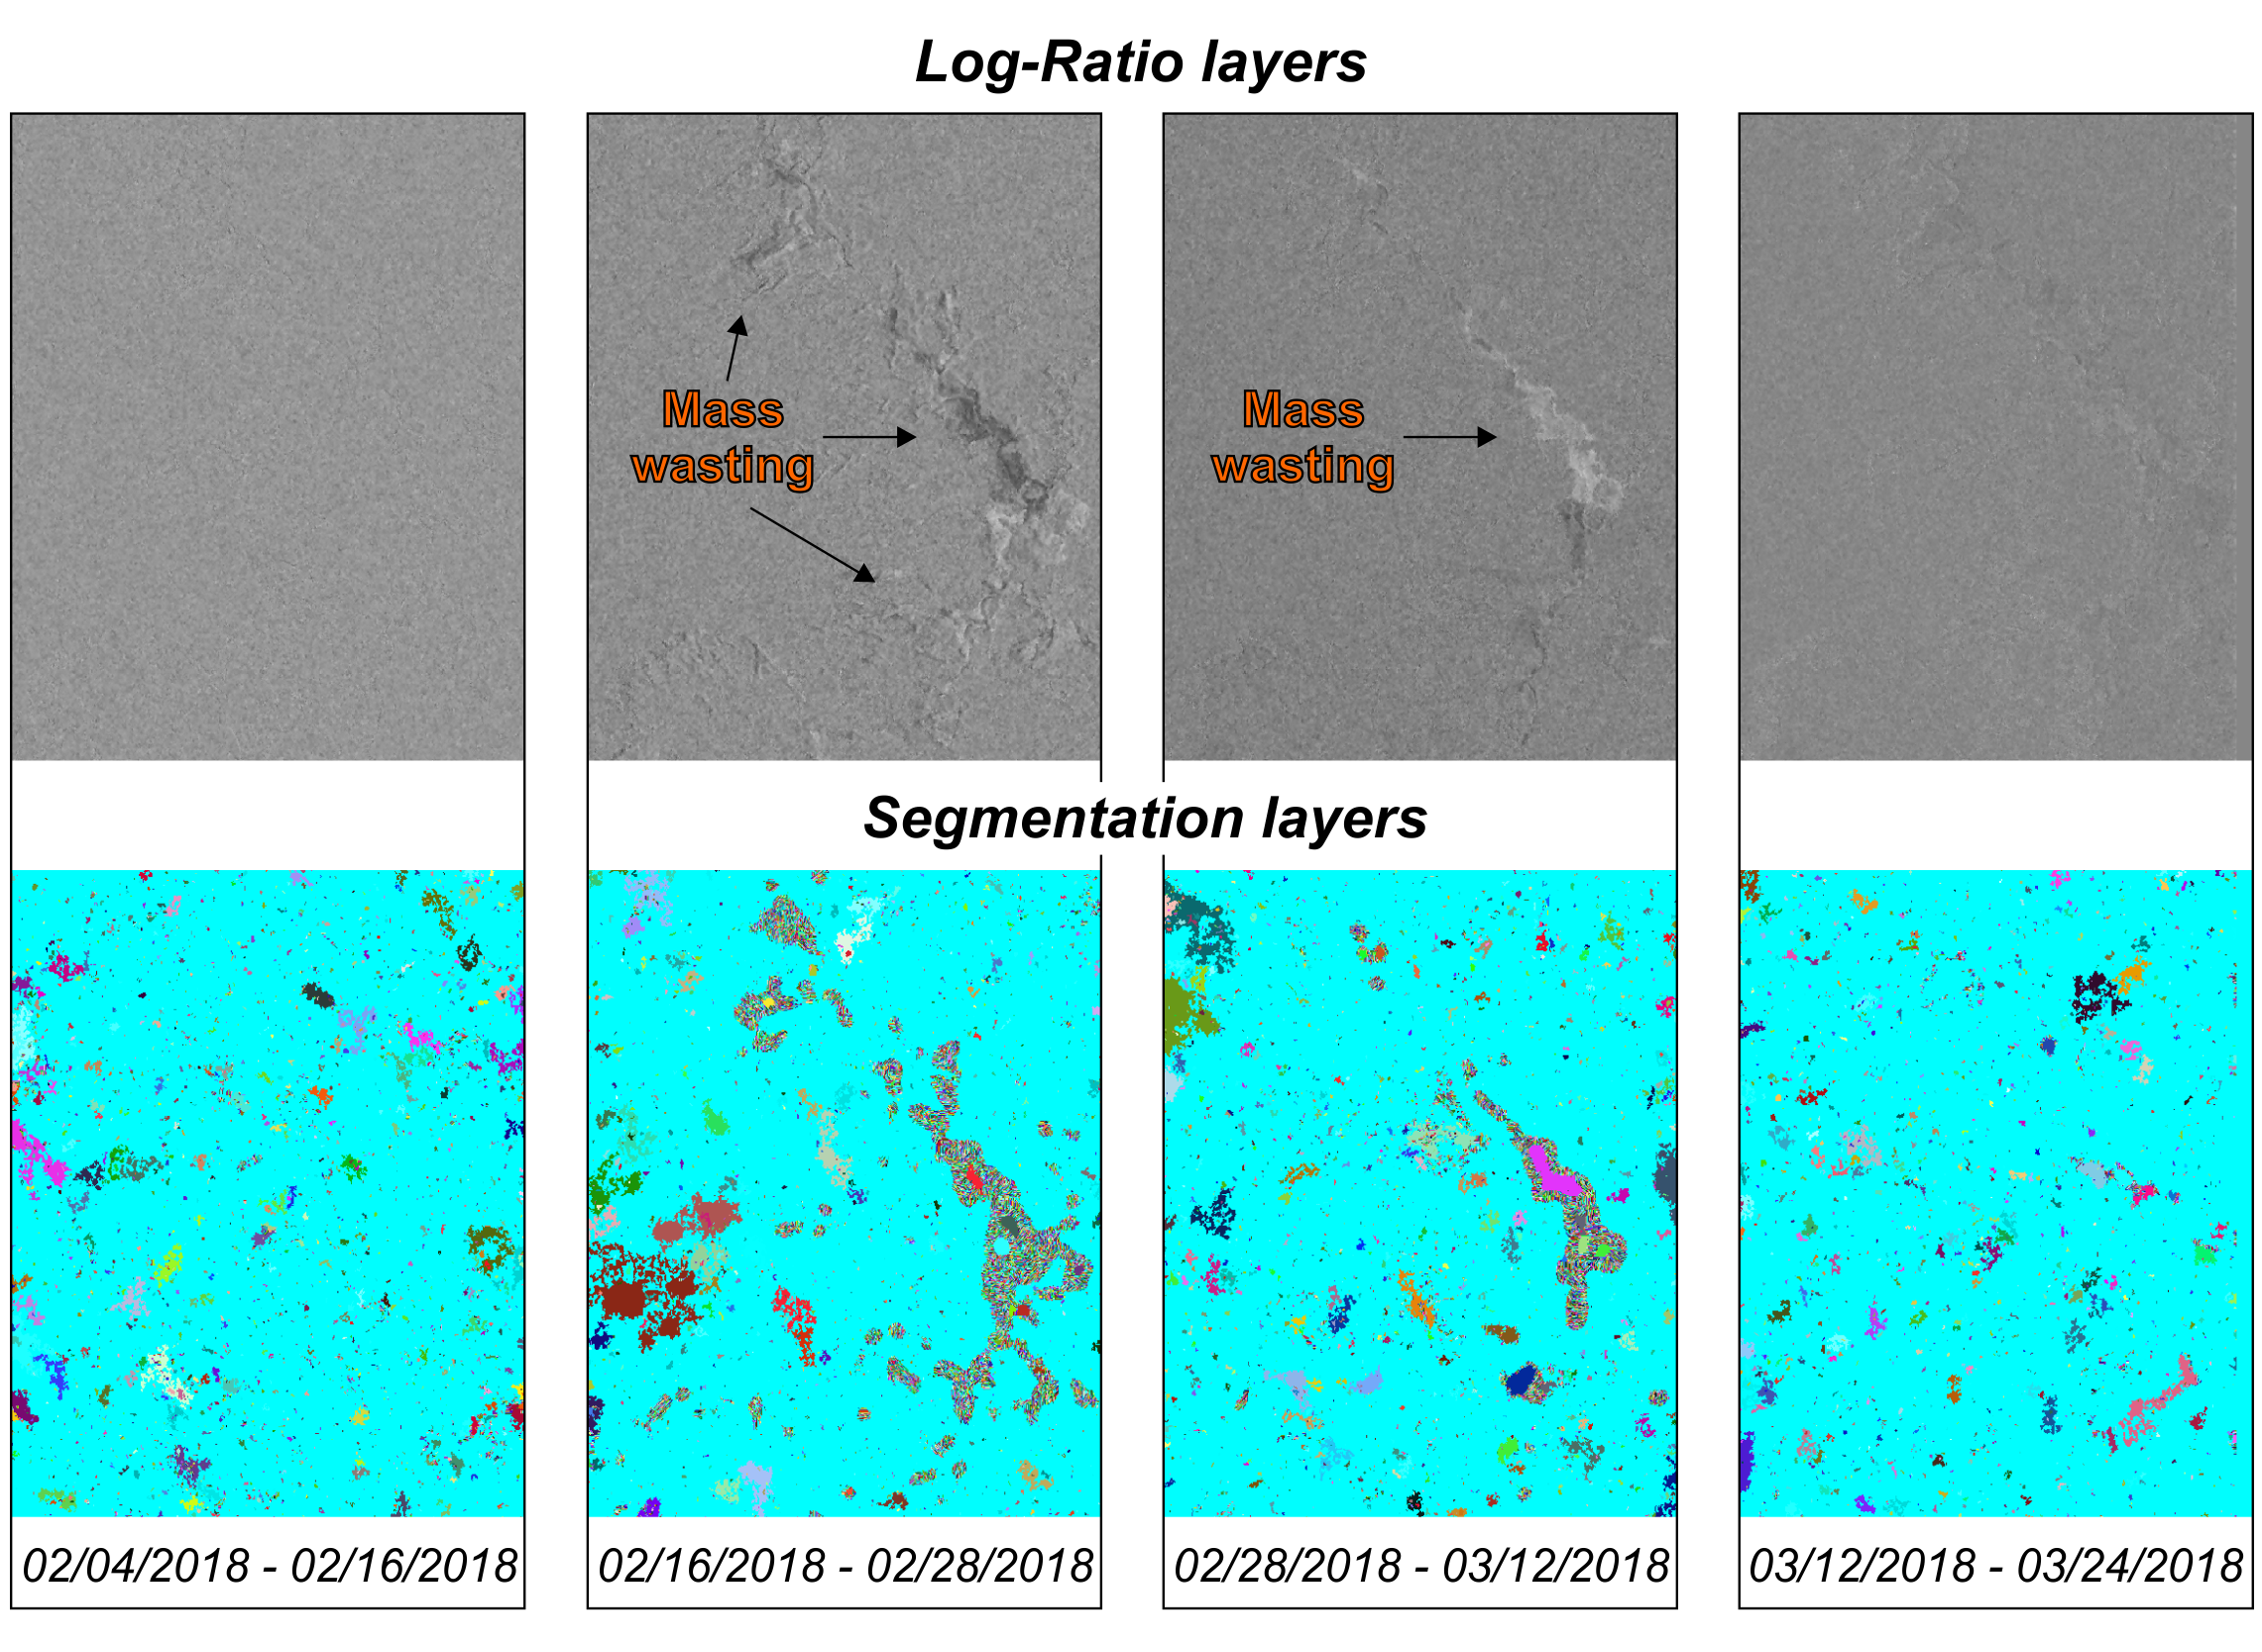
A rapid assessment of the areal extent of landslide disasters is one of the main challenges facing by the scientific community. Satellite radar data represent a powerful tool for the rapid detection of landslides over large spatial scales, even in case of persistent cloud cover. To define landslide locations, radar data need to be firstly pre-processed and then elaborated for the extraction of the required information. Segmentation represents one of the most useful procedures for identifying land cover changes induced by landslides. In this study, we present an application of the i.segment module of GRASS GIS software for segmenting radar-derived data. As study area, we selected the Tagari River valley in Papua New Guinea, where massive landslides were triggered by a M7.5 earthquake on February 25, 2018. A comparison with ground truth data revealed a suitable performance of i.segment. Particular segmentation patterns, in fact, resulted in the areas affected by landslides with respect to the external ones, or to the same areas before the earthquake. These patterns highlighted a relevant contrast of radar backscattering values recorded before and after the landslides. With our procedure, we were able to define the extension of the mass movements that occurred in the study area, just three days after the M7.5 earthquake.
Author Comment
New formatting style
Supplemental Information
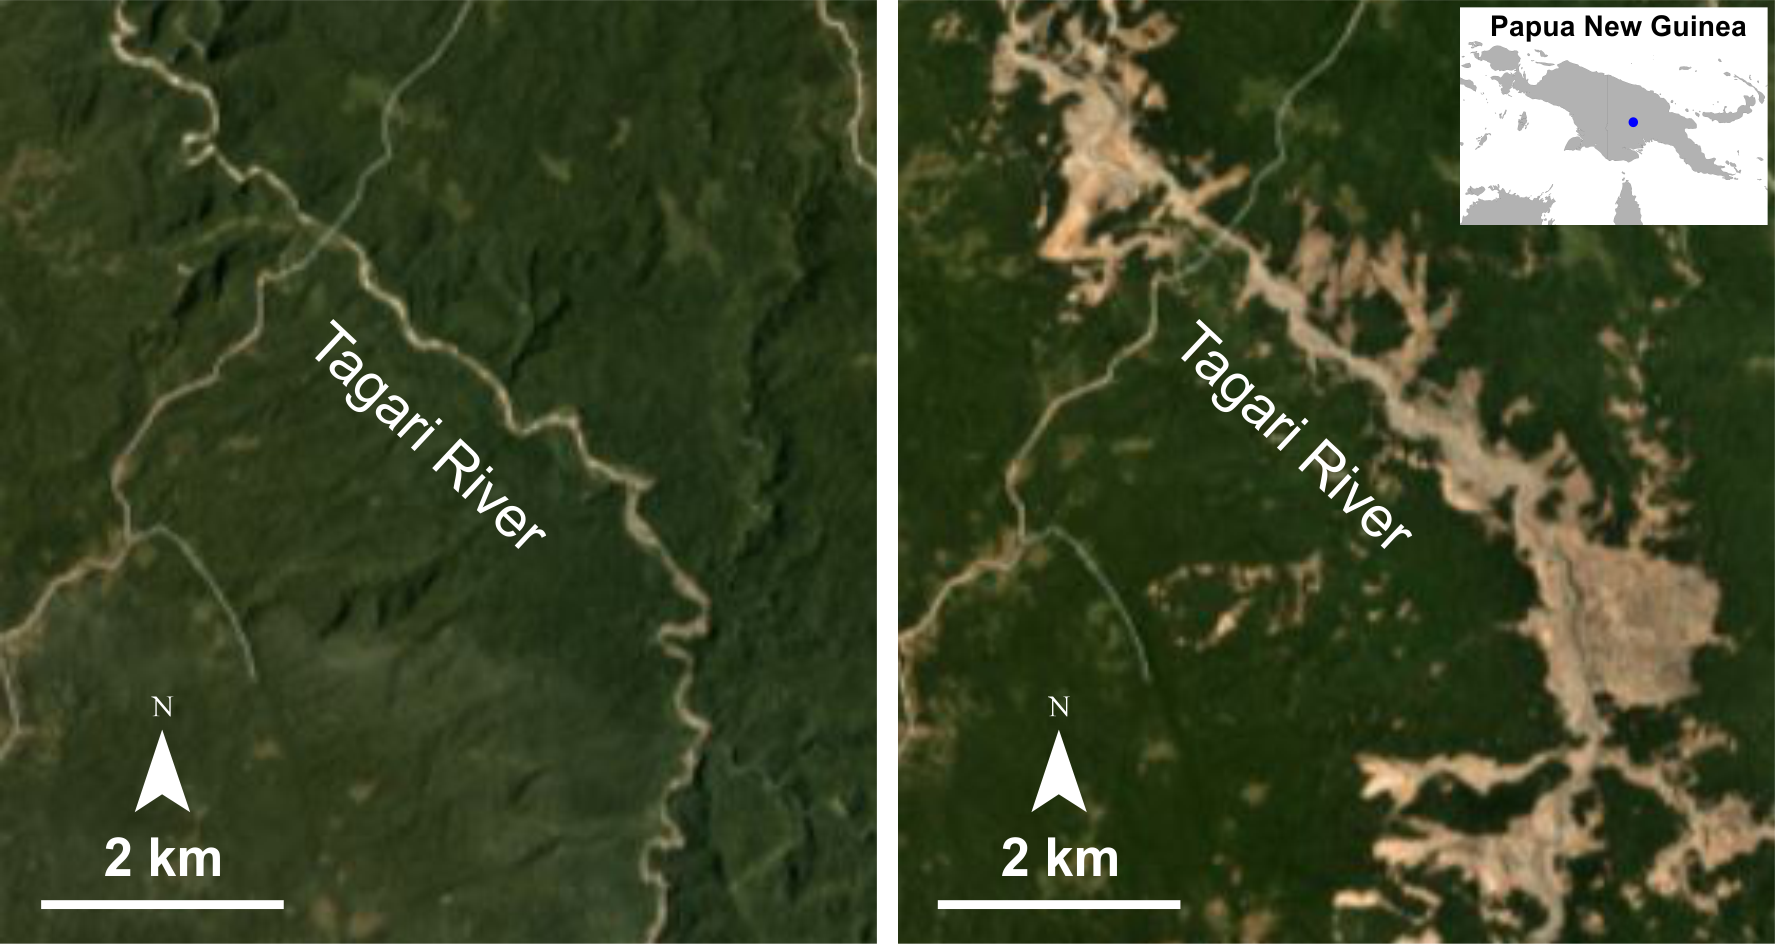
Figure 1: The Tagari River valley (Papua New Guinea). Optical satellite images before (on the left) and after (on the right) the severe earthquake. Images were collected on the Planet explorer application (Planet, 2017).
The blue dot in the inset map indicates the location of the study area.