Functional stabilisation and partner selection during repeated co-culivation in a methanotrophic interactome
- Published
- Accepted
- Subject Areas
- Ecology, Environmental Sciences, Microbiology
- Keywords
- aerobic methanotroph, synthetic ecology, microbial co-cultivation, microbial ecology, microbiology, functional stability
- Copyright
- © 2016 Kerckhof et al.
- Licence
- This is an open access article distributed under the terms of the Creative Commons Attribution License, which permits unrestricted use, distribution, reproduction and adaptation in any medium and for any purpose provided that it is properly attributed. For attribution, the original author(s), title, publication source (PeerJ Preprints) and either DOI or URL of the article must be cited.
- Cite this article
- 2016. Functional stabilisation and partner selection during repeated co-culivation in a methanotrophic interactome. PeerJ Preprints 4:e2014v1 https://doi.org/10.7287/peerj.preprints.2014v1
Abstract
Background
Biological oxidation of methane (CH4) is an essential ecosystem function. Accumulating evidence indicated that this function is mediated by associations of methanotrophic bacteria (MOB) with non-methanotrophic partners; together referred to as a methanotrophic interactome. Given the potency of CH4 as a greenhouse gas, a thorough understanding of how these interactomes exert an effect on methane oxidation is of special interest. Furthermore, MOB - non-MOB associations could be exploited for sustainable biotechnological applications in light of the renewed interest in MOB as natural and cost-efficient biocatalysts. The selectivity of MOB for non-MOB partners, as well as the stimulation of MOB activity (CH4 oxidation rate, MOR) with increasing non-MOB richness have both been recently described for a single batch incubation period. Therefore, we hypothesized that during repeated co-cultivation of MOB with non-MOB, ecological sorting would guide the methanotrophic interactome towards its optimal composition, which could additionally boost functionality (MOR).
Methods
Co-cultures of 8 non-MOB partners with a single alpha- or a single gammaproteobacterial MOB were repeatedly sub-cultivated. In every cycle, the headspace CH4 concentration was measured to over time to determine the MOR, while headspace CO2 concentrations and total protein in the culture were determined to track the fate of CH4-derived carbon (catabolism and assimilation respectively). Finally, the relative abundance of each co-culture partner was assessed using a 16S rRNA gene-targeted denaturing gradient gel electrophoresis (DGGE).
Results and Discussion
While no significant improvement of functionality was observed, the biological variability of MOR was stabilized by co-cultivation with non-MOB partners. Overall, higher biomass yields were obtained when MOB were co-cultivated with non-MOB partners and the alphaproteobacterial MOB appeared to be able to support more non-MOB biomass than the gammaproteobacterial MOB, which could be linked to the proposed life-strategies of these clades. A clear partner selection was observed as only 4 out of 8 initial partners were found to persist during repeated cycles of co-cultivation. While 2 of the persisting partners could coexist with either MOB type, the other two were more restricted to a specific MOB. Differential metabolic potential of non-MOB was resolved by genome mining publicly available genomes; our attempt to find clues for the partner selectivity did not reveal a clear link with the potential for C1-compound metabolism. However, genes for sugar metabolism (fructose, mannose, sucrose) were restricted to the persisting partners while genes encoding an ATP-dependent vitamin B12 importer were restricted to the non-persisting partners, underlining the importance of metabolic exchange in the methanotrophic interactome.
Author Comment
This is a submission to PeerJ for review.
Supplemental Information
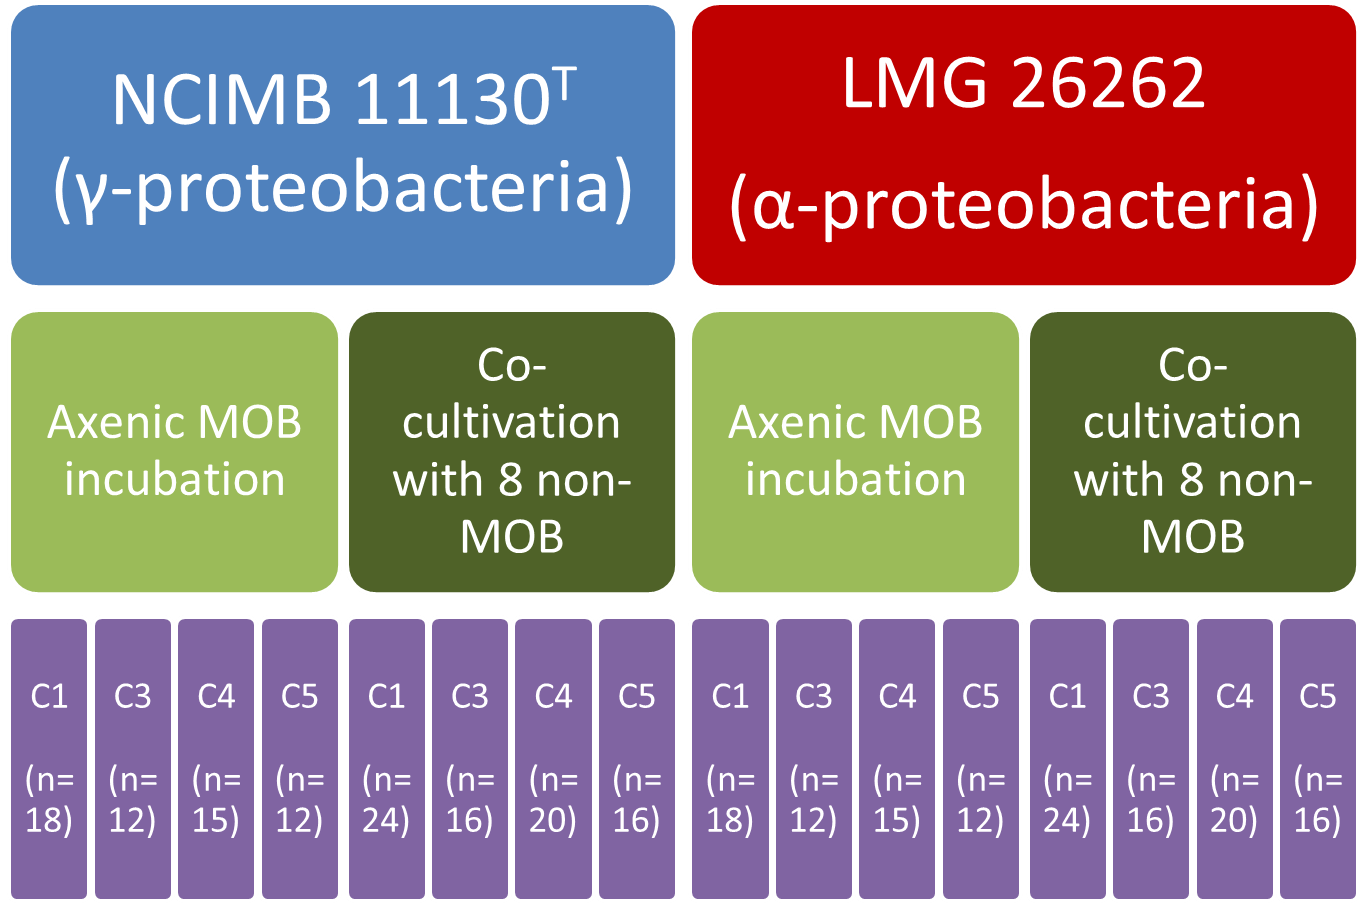
Overview of the experimental design
The design is a split-split plot design with repeated measures. Cx (x=1-5) represents the cycle of (co)-cultivation, where n represents the total amount of headspace measurements available for each cycle.
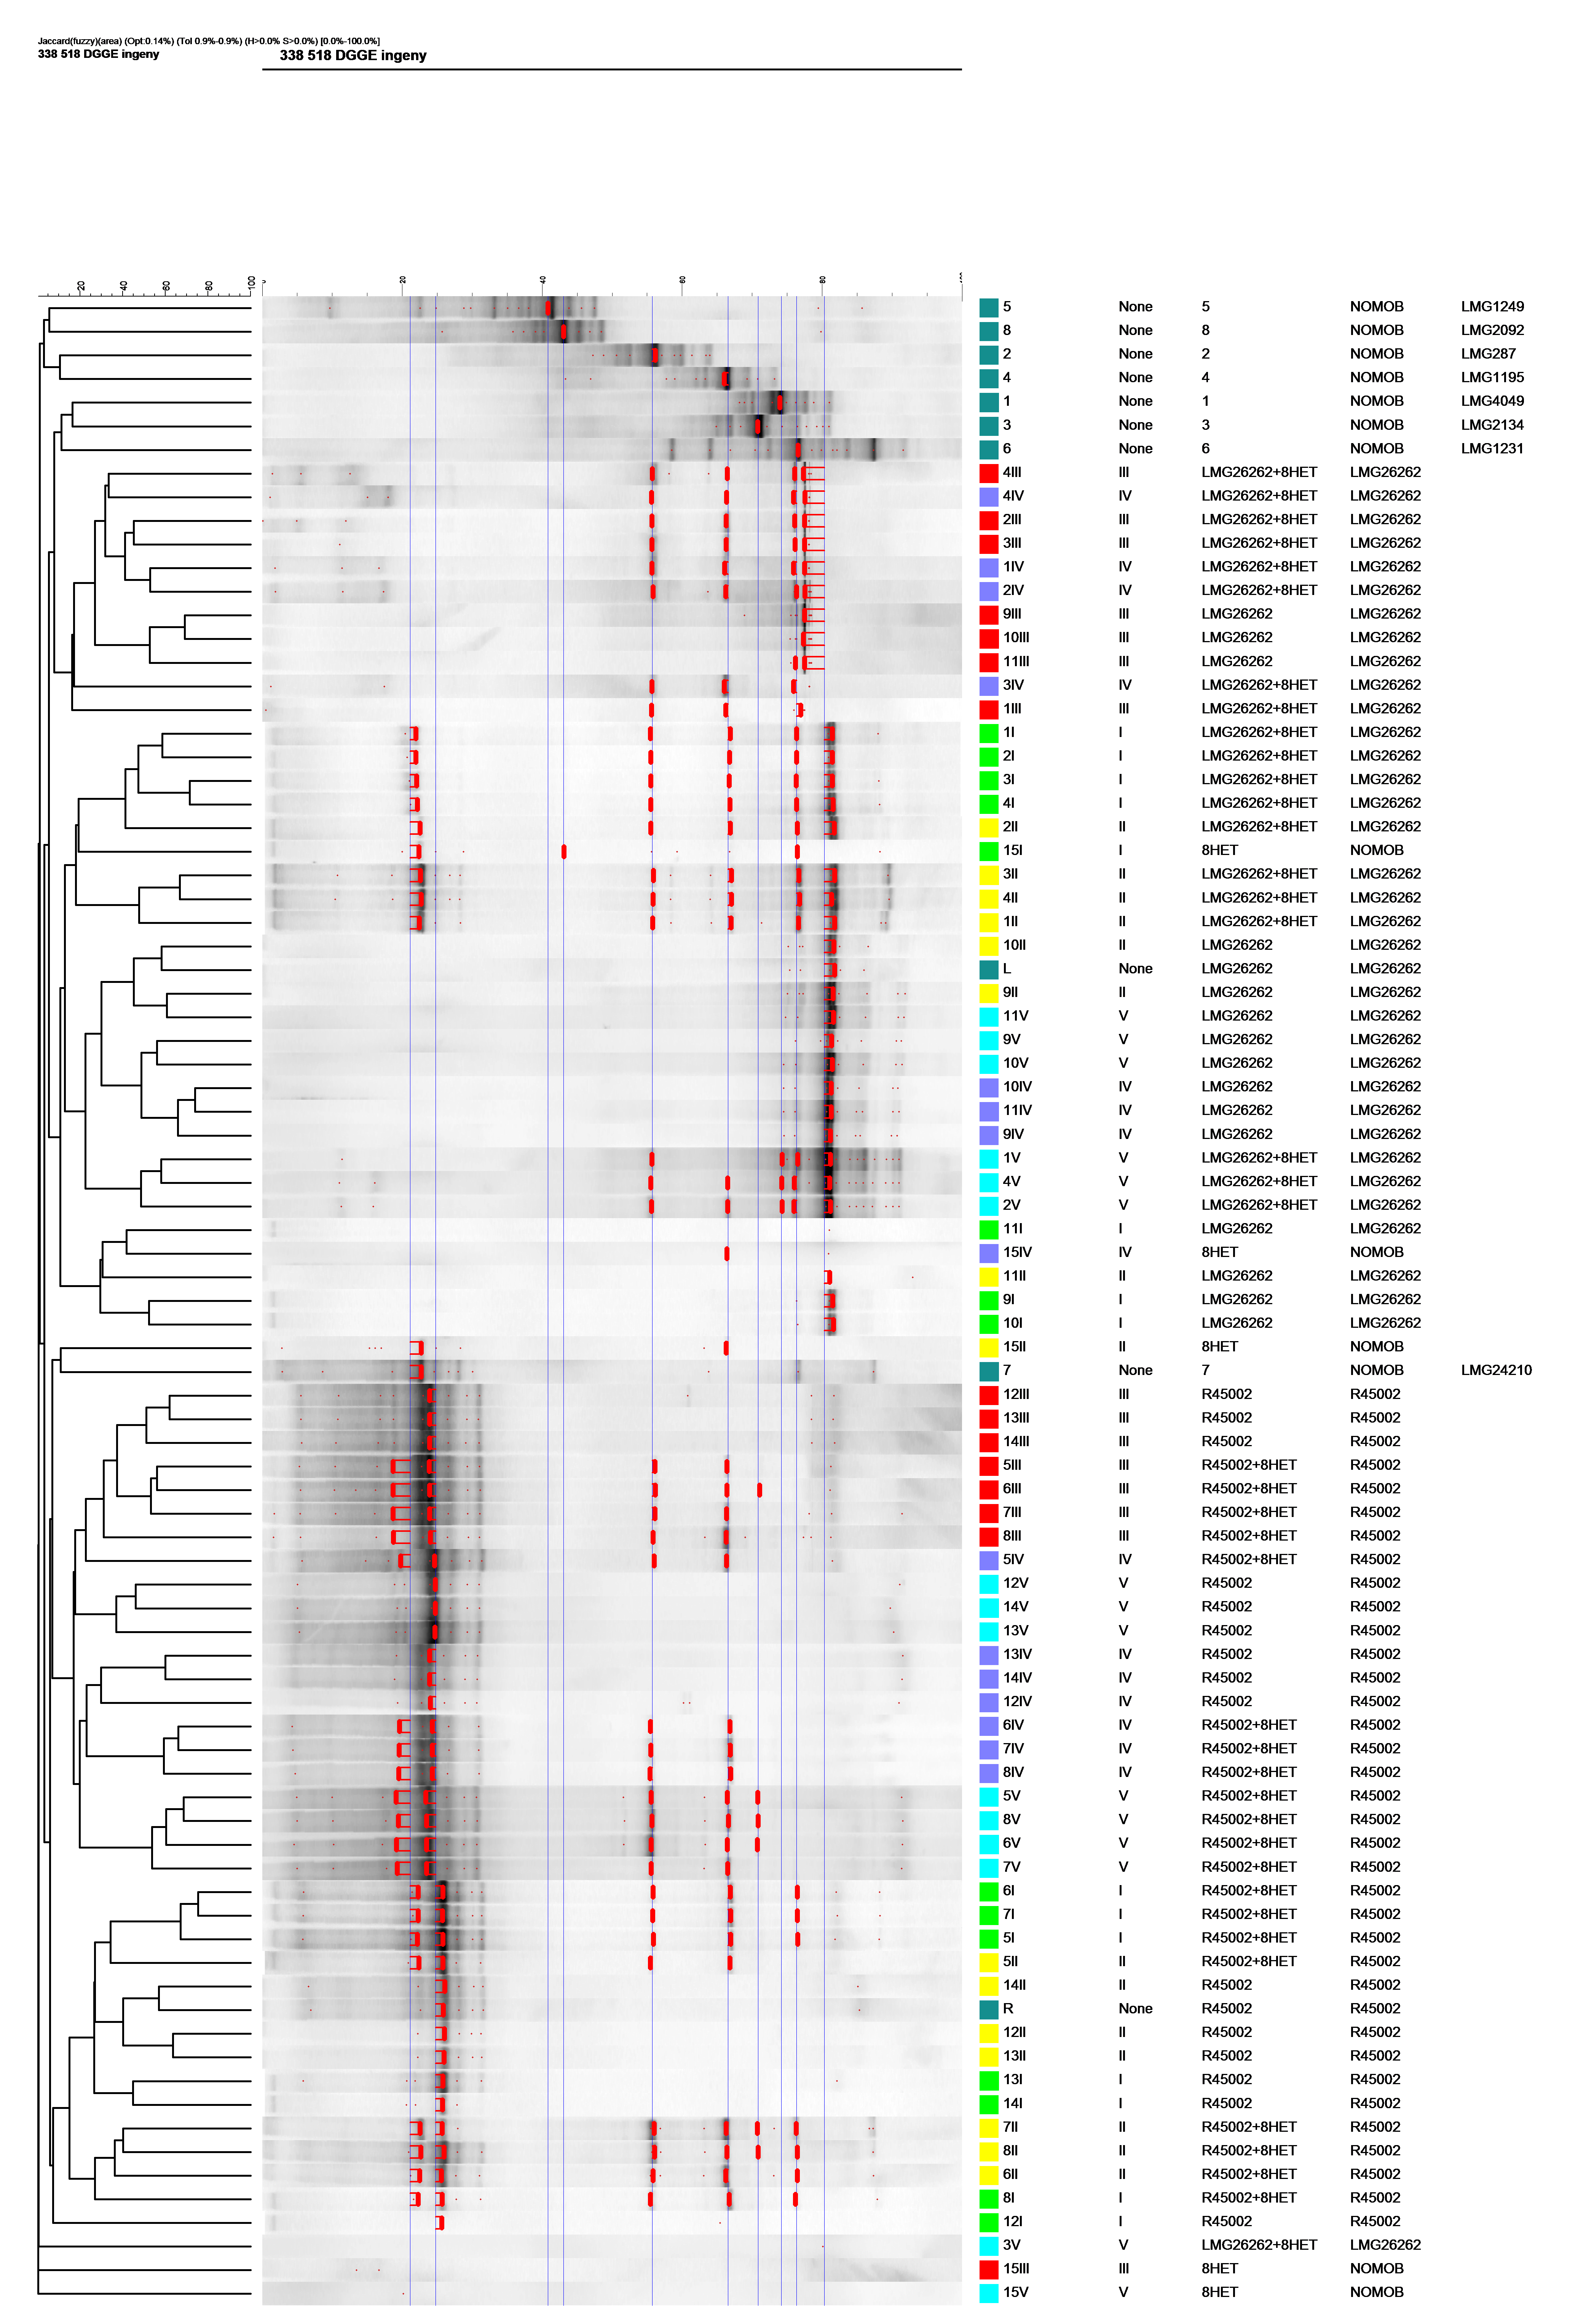
DGGE pattern among the cycles
16S rRNA gene DGGE was performed as described in materials & methods. Using BioNumerics (Applied Maths, version 5.1) band classes were assigned. Only the most abundant band class of a pure strain loaded on the gel was selected as “representative” band class, hence correcting for possible ghost bands. Samples were color-coded according to the cycle they belonged to. R45002 represents Methylomonas methanica NCIMB 11130T. +8HET refers to co-cultivation incubations. 8HET as such are lanes from the negative control of the 8 non-MOB incubated without the MOB. Cycle “none” refers to pure cultures loaded in the lane. Color codes (Column “Code”) are depicting the (co-) incubation cycle (column “Cycle”). In the column MOB “NOMOB” refers to lanes where amplicon of the (pure) cultures of the non-MOB partners were loaded. Fuzzy clustering was performed using the Jaccard distance (aware of band intensity) and UPGMA linkage.
Methane removal profiles
CH4(t=t)/CH4(t=t0) profiles for all experimental conditions and cycles. Observation points represent average CH4(t=t)/CH4(t=t0) of either triplicate (MOB alone) or quadruplicate (MOB with heterotrophs) measurements, except for the heterotroph control incubation without methanotrophs, where only one biological replicate was used. A dashed horizontal red line represents 25% methane removal from the initial concentration. Shaded areas represent 95% confidence intervals on the observations.
Box-and-whisker plots for methane oxidation ratio's (MOR) for each cycle per treatment
MOR is expressed as mmol CH4 oxidized per liter of broth per hour. MOR is corrected for losses during incubation by means of a negative control with only heterotrophs (HET). LMG: pure culture cultivation of Methylosinus sp. LMG 26262. LMG+HET: co-cultivation of Methylosinus sp. LMG26262 with 8 non-MOB partners as described in materials & methods. R: pure culture cultivation of Methylomonas methanica NCIMB 11130T. R+HET: co-cultivation of Methylomonas methanica NCIMB 11130T with 8 non-MOB partners as described in materials & methods. Black dots in the boxplot represent the median MOR.
Yield coefficients
Δ designates increase or removal between beginning (t0) and end (tend) of a cycle, where the amount of protein at t0was calculated based upon the 10% v/v transfer at the end of cycle 3.
Comparative genomics of C1 metabolism
Microsoft Excel spreadsheet of C1 modules compiled from Chistoserdova (2011) and RAST subsystems/scenarios for the metabolic processes. “?” indicates that it is unclear if a certain function is correctly assigned or (in)complete. “Maybe” indicates that a gene was found that could be involved in the functionality though it is not clear if it is enough for the functionality or the correct gene. Individual gene names were given when appropriate.
Raw data of the methane oxidation ratios
Methane oxidation ratios (MOR) were calculated by linear regression as described in material and methods.
Protein and CO2 concentrations dataset
Columns are as follows: 1 - Bottle number = number that was assigned to the bottle during incubation 2 - Cycle = co-cultivation cycle 3 - Content = microbial composition 4 - CycleCont = code incorporating the information on Cycle and Content 5 - proteinmgpermL = mg protein formed per mL of broth 6 - proteinmmolC = mg protein formed per mL of broth converted to mmol carbon (Rouwenhorst et al., (1991) Journal of Biochemical and biophysical methods 22 (2) 119-128) 7 - mmolCO2permL = mmol of CO2 measured per mL of culture at the end of the cycle 8 - CO2protmmolratio = ratio of columns 6 and 7 9 - mmolCO2formed = total amount (mmol) of CO2 formed for the whole culture volume as compared to the start of the cycle 10 - mmolCO2formedpermL = 9 expressed per mL of culture 11 - CO2fdProtmmolratio = ratio of 10 and 6 12 - CO2fdProtmgratio = ratio of 9 and 5