Caribbean Bulimulus revisited: physical moves and molecular traces (Mollusca, Gastropoda, Bulimulidae)
- Published
- Accepted
- Subject Areas
- Biogeography, Molecular Biology, Taxonomy, Zoology
- Keywords
- Orthalicoidea, distribution, Central America, Ecuador, West Indies, Florida, alien species, phylogenetics
- Copyright
- © 2016 Breure
- Licence
- This is an open access article distributed under the terms of the Creative Commons Attribution License, which permits unrestricted use, distribution, reproduction and adaptation in any medium and for any purpose provided that it is properly attributed. For attribution, the original author(s), title, publication source (PeerJ PrePrints) and either DOI or URL of the article must be cited.
- Cite this article
- 2016. Caribbean Bulimulus revisited: physical moves and molecular traces (Mollusca, Gastropoda, Bulimulidae) PeerJ PrePrints 4:e1716v1 https://doi.org/10.7287/peerj.preprints.1716v1
Abstract
Twenty-five samples of Bulimulus species are studied, partly from localities within their known distribution range, partly based on interceptions where the material originates from localities where the species seem to be recently introduced and non-native. Molecular study of cytochrome oxidase 1 (CO1) reveals the origin of some of these introductions, but is less conclusive for others. Four different methods for species delimitation were applied, which did not result in unambiguous species hypotheses. For a rapid identification of morphologically indistinct species, a more comprehensive database of sequences is needed.
Author Comment
This manuscript has been submitted to PeerJ for reviewing.
Supplemental Information
Supplementary information, Figure 1
Neighbour-joining phylogeny for Bulimulus species, based on 654bp cytochrome oxidase I mitochondrila DNA. Bootstrap values of 70 and above are presented to the left of the nodes indicated by black dots. Scale bar in substitutions/site.
Supplementary information, Figure 2
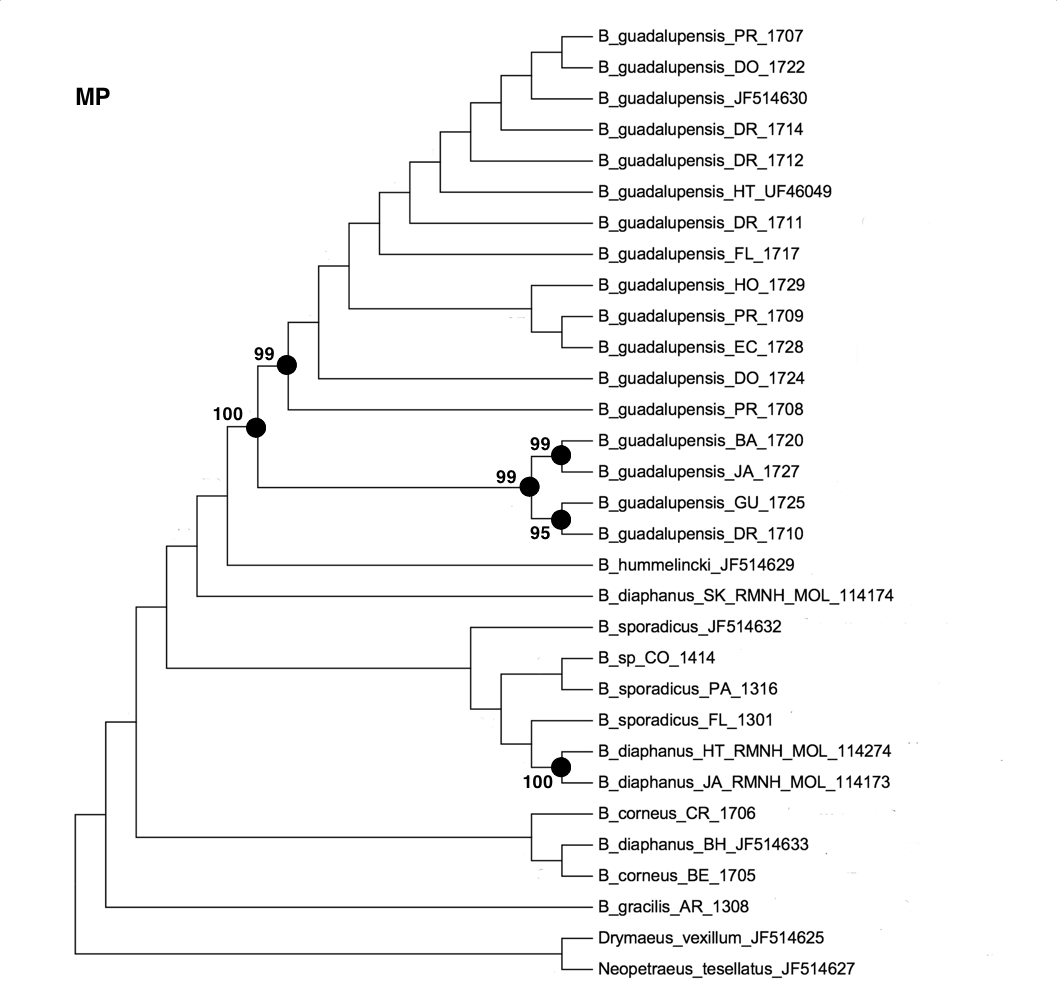
Maximum-parsimony phylogeny for Bulimulus species, based on 654bp cytochrome oxidase I mitochondrila DNA. Bootstrap values of 90 and above are presented to the left of the nodes indicated by black dots.
Supplementary information, Table 1
Delimitation of MOTUs using K2P distances and standard error at 3% threshold. gA and gB, Bulimulus guadalupensis group A respectively B.
Supplementary information, Table 2
Delimitation of MOTUs using K2P distances and standard error at 4% threshold. gA and gB, Bulimulus guadalupensis group A respectively B.
Supplementary information, Table 3
Species delimiting as implemented in Geneious, using ML and BI for both the total dataset and a subgroup of MOTUs. Closest species, Intraspecific distance, Interspecies distance, ratio of Intra/Interspecific, P ID(strict), Rosenberg’s Pab, and Rodrigo’s P(RD) are indicated. Colours code for significance. c, d, g, gr, hu, s, and sp. correspond with the respective taxon names; NA, not applicable.
Supplementary information, Table 4
Mean p-distances between and within (diagonal) the different MOTUs based on the dataset analysed. EDS, Estimates of Evolutionary Divergence between Sequences; NEDGS, Net Evolutionary Divergence between Group of Sequences. c, d, g, gr, hu, s, and sp. correspond with the respective taxon names; n/c, not calculated. Colours code the corresponding groups.
Supplementary information, Table 5
Results for different combinations of MOTUs, using rooted trees of both ML and BI analyses, in terms of genealogical sorting index and corresponding p-values based on a permutation test of 10,000 replicates. Colours code the corresponding groups.