
Adaptive learning rate optimized hybrid model for early identification of children with autism
- Published
- Accepted
- Received
- Academic Editor
- Paulo Jorge Coelho
- Subject Areas
- Artificial Intelligence, Computer Education, Data Mining and Machine Learning, Optimization Theory and Computation
- Keywords
- Autism spectrum disorder, Federated learning, Class imbalance, Hybrid deep learning, Dragonfly optimization
- Copyright
- © 2026 Algahtani and Alzahrani
- Licence
- This is an open access article distributed under the terms of the Creative Commons Attribution License, which permits using, remixing, and building upon the work non-commercially, as long as it is properly attributed. For attribution, the original author(s), title, publication source (PeerJ Computer Science) and either DOI or URL of the article must be cited.
- Cite this article
- 2026. Adaptive learning rate optimized hybrid model for early identification of children with autism. PeerJ Computer Science 12:e3483 https://doi.org/10.7717/peerj-cs.3483
Abstract
Autism spectrum disorder (ASD) in children often leads to academic and social challenges due to difficulties in communication, social engagement, and behavioral adaptation. Delayed diagnosis exacerbates these issues, hindering timely interventions. Recent machine learning (ML) algorithms have shown promise in predicting ASD, enabling early diagnosis and intervention. However, existing datasets suffer from limitations such as small sample sizes, class imbalance, and privacy concerns. The main objective of this study is to design a federated learning (FL)-based hybrid deep learning framework that can accurately and securely detect ASD in children, overcoming data imbalance and privacy challenges. Specifically, the study addresses the following research questions: (i) How can federated learning be employed to securely collect and train ASD-related data across multiple schools while ensuring privacy? (ii) Can a hybrid deep learning model combining convolutional neural network (CNN) and long short-term memory (LSTM) improve ASD prediction accuracy compared to existing models? (iii) To what extent can Dragonfly Optimization (DFO) enhance hyperparameter tuning for robust performance under imbalanced data conditions? To this end, we propose the Adaptive Learning Rate Optimized Hybrid Model (ALROH), which integrates a modified CNN for feature extraction, LSTM for sequential pattern recognition, and DFO for hyperparameter optimization. Evaluated on toddler and children datasets, ALROH achieves accuracies of 99.36% and 99.23%, respectively, outperforming state-of-the-art methods by up to 5%. By enabling privacy-preserving and scalable ASD screening in educational settings, ALROH facilitates early interventions, potentially improving academic outcomes for students with ASD.
Introduction
Autism spectrum disorder (ASD) is a neurodevelopmental condition characterized by persistent challenges in social interaction, communication, and repetitive behaviors. It manifests differently across individuals, from mild to severe impairments, making early identification and intervention essential (Fuentes, Hervás & Howlin, 2020; Tian, Gao & Yang, 2022). In educational environments, undiagnosed ASD often leads to difficulties in social communication, adapting to classroom structures, and coping with conventional teaching approaches (Stack, Symonds & Kinsella, 2021). Consequently, students with ASD may experience reduced engagement, academic struggles, and limited opportunities for integration.
Research on inclusive education for students with ASD has highlighted diverse perspectives on support systems. For instance, authors of Hasson et al. (2022) explored the experiences of parents, school staff, and students with ASD, emphasizing the need for individualized support to foster inclusivity in mainstream education. Similarly, authors of Russell, Scriney & Smyth (2022) conducted a systematic review of educator attitudes toward including students with ASD, identifying both positive views and challenges related to training and resources. Despite the growing awareness of ASD, a large proportion of students remain undiagnosed or misdiagnosed due to subtle symptoms and limited awareness among educators and parents (Munroe & Dunleavy, 2023; Russell, Scriney & Smyth, 2022). Traditional diagnostic procedures, such as behavioral observations and standardized psychological tests, require professional intervention, making them unsuitable for large-scale screening in schools (Bishop & Lord, 2023; Yu, Ozonoff & Miller, 2023; Spain et al., 2022). These gaps highlight a pressing need for scalable, automated, and privacy-preserving ASD detection frameworks that can be deployed in educational settings.
From a national perspective, many countries, including India, face challenges in providing adequate clinical resources and awareness programs for early ASD detection, particularly in rural and underserved areas. From an international perspective, ASD prevalence continues to rise, with the World Health Organization estimating that one in 100 children worldwide is affected (Simeoli et al., 2024; Ganai et al., 2025). Despite this, existing educational systems globally lack integrated digital tools for early ASD identification. Thus, there is both a national and global necessity for intelligent, technology-driven screening methods that can complement traditional diagnostics and support inclusive education.
Recent research has applied machine learning (ML) to ASD prediction using behavioral, cognitive, and demographic data (Ganai et al., 2025; Corona et al., 2021; Yu, Ozonoff & Miller, 2023). While promising, these models face two critical limitations: class imbalance, where datasets contain disproportionately more non-ASD samples than ASD samples, and data privacy concerns, since student health and behavioral data are highly sensitive. To mitigate these issues, federated learning (FL) has emerged as a decentralized and privacy-preserving paradigm that allows institutions to collaboratively train models without sharing raw data (Mohammadi et al., 2024; Rashed et al., 2024). Though FL has shown success in medical domains, its application in educational ASD screening remains largely unexplored (Lakhan et al., 2023).
The primary objective of this research is to develop a federated learning-based hybrid deep learning framework for accurate and privacy-preserving ASD detection in children. This study is guided by the following research questions:
-
(1)
RQ1: How can FL be leveraged to securely collect ASD-related data across schools while ensuring data privacy and diversity?
-
(2)
RQ2: Can a hybrid CNN–LSTM architecture effectively learn both spatial and sequential patterns in ASD-related features to improve predictive performance?
-
(3)
RQ3: To what extent can Dragonfly Optimization (DFO) enhance the hyperparameter tuning of hybrid models, thereby mitigating class imbalance and improving model robustness?
Contributions: In addressing the above questions, this research introduces the Adaptive Learning Rate Optimized Hybrid Model (ALROH), which integrates CNN, LSTM, and DFO in a federated learning environment. The novelty of ALROH lies in combining decentralized privacy-preserving data collection with hybrid deep learning to achieve high accuracy and robustness in ASD detection. This approach offers a scalable solution that can be implemented in educational institutions for large-scale ASD screening, thereby contributing to inclusive education both nationally and internationally.
The manuscript is structured as follows. ‘Literature Survey’ provides an overview of various ASD predictive approaches proposed in recent years. ‘Materials and Methods’ elaborates on the FL architecture and the proposed ALROH model. ‘Results and Discussion’ presents the experimental results of the ALROH model, evaluating its performance on different datasets and comparing it with existing approaches. Finally, ‘Conclusion’ concludes the study and discusses potential directions for future research.
Literature survey
This section provides an overview of various ASD predictive approaches that have been presented in recent years. Thabtah (2018) presented a mobile app for screening ASD, which was called ASDTests. The tool is easy to use, enabling parents, children, adults, and healthcare professionals to screen for ASD. The test consisted of collecting personal data and conducting a behavioral analysis through a quiz that included 10 questions, based on which the ASD was predicted. Moreover, this work collected data from different age groups, including adults, adolescents, children, and toddlers. They collected both ASD samples and normal samples for predicting ASD. Furthermore, for prediction, two machine learning classifiers were used: Naïve Bayes (NB) and Support Vector Machine (SVM). The findings showed that NB achieved 94.23%, 99.85%, and 97.94% accuracy in predicting ASD in adolescents, adults, and children, respectively. This work did not use any feature selection.
Thabtah & Peebles (2019) presented an approach for predicting ASD using a machine learning (ML) method called Rules-ML (RML), which selects the best features for predicting ASD. In the RML, five definitions were established, and features were selected using these definitions. The RML and other rule-based predictive approaches were then employed for predicting ASD. They used C4.5 Decision Tree (DT), AdaBoost (AB), PRISM, Classification and Regression Tree (CART), Bagging, Non-Nested Generalization (NNGE), RIDOR and RIPPER. Evaluations show that RML achieved better accuracy for the adult dataset (95%), C4.5 DT (91%) achieved better accuracy for the children dataset, and AB (87%) achieved better accuracy for the adolescent dataset. This work used feature selection, yet failed to achieve higher accuracy. Alkahtani et al. (2023) presented a dataset for toddlers to predict ASD. Similar to the collection process presented in Thabtah (2018), this work also follows a similar approach for collecting data, specifically by gathering personal data and administering quizzes only to toddlers. The tests were either conducted by health professionals or by parents. After collecting the data, they used feature scaling for normalizing the independent features. For the prediction of ASD, three ML classifiers were used, including K-Nearest Neighbor (KNN), SVM, LSTM, and DT. Evaluations showed that SVM and LSTM achieved 100% accuracy. Their work failed to utilize any feature selection, and the data considered had nearly equal sample sizes, i.e., the number of normal cases and ASD cases was almost equal.
Farooq et al. (2023) used FL for faster prediction of ASD. They trained the FL using two ML classifiers, namely Logistic Regression (LR) and SVM, with only two datasets: adults and children. For better results, in FL, local-model training was performed using SVM and LR, and then pushed to the central server, where a meta-classifier with a global model predicted ASD with improved accuracy. Four different datasets related to adults and children were collected from different repositories and trained to train the FL model. The findings showed that SVM performed well for the children’s dataset (98%) and the adult dataset (81%). This work did not consider any feature selection. Priyadarshini (2023) presented an approach for predicting ASD in adults and toddlers. To address data imbalance and expand the size of ASD datasets, this work employed the Synthetic Minority Oversampling Technique (SMOTE). Further, applied or which used a feature selection/optimization approach. This work presents two approaches: one that uses a CNN for extracting and selecting features, LSTM for prediction, and Particle Swarm Optimization (PSO) for finding the best approach for predicting ASD. The second approach utilized a CNN for extracting features and selecting features with a Gated Recurrent Unit (GRU) for prediction. Findings showed that CNN-LSTM-PSO achieved better accuracy for toddlers (99.64%) and adults (98.89%). Pae & Pae (2024) employed two machine learning (ML) classifiers, namely Random Forest (RF) and Decision Tree (DT), for predicting ASD in adults, adolescents, and children. The findings showed that RF achieved better accuracy for the children dataset (95.9%), while DT achieved better accuracy for the adult (94.3%) and adolescent (80.8%) datasets. This work did not consider any feature extraction.
Hajjej et al. (2024) presented an approach for predicting ASD in toddlers, which involved merging two datasets from Thabtah (2018) and Alkahtani et al. (2023). To increase the dataset size and handle data imbalance, used SMOTE. For feature selection, we employed three methods: Boruta Feature Selection (BF), Bi-Directional Elimination feature selection (BEFS), and ML-based feature selection (MFS). DT, RF, LR, KNN, SVM, Gradient Boosting Machine (GBM) and XGBoost (XGB) were used for classification. Also, presented an ensemble RF-XGB approach for predicting ASD in toddlers. Findings show that RF-XGB with MFS achieved 99% accuracy with feature selection and 94% without feature selection. Furthermore, in this work, they presented a method for teachers to assess and guide student behavior. Reghunathan et al. (2024) employed three ML classifiers, namely LR, KNN, and SVM, for predicting ASD in different age groups. For reducing features from the dataset, i.e., selecting features, the Cuckoo-Search Algorithm (CSA) was used. They evaluated their approach considering adolescent, children and adult datasets, where L-R with CSA achieved better accuracy for children (96.23%), adolescents (89.42%) and adults (97.01%). This work failed to achieve higher accuracy. Bawa et al. (2024) presented an approach for predicting ASD in children, adolescents, and adults. They manually selected only 14 features for evaluation and, for classification, used six ML classifiers, including DT, KNN, NB, RF, SVM and LR. To increase the dataset size and improve prediction accuracy, they merged all three datasets. Findings showed that LR achieved 94.3%, 99.0% and 97.2% accuracy for children, adolescents and merged datasets. For the adult dataset, SVM achieved an accuracy of 98.5%.
Alshammari et al. (2024) presented an approach that utilized FL with a privacy-preserving mechanism to secure the collected ASD toddler data and employed ML classifiers for predicting ASD. They used feature transformation and presented FL optimization for faster computation with security. For prediction, Kernel Support Vector Machine (KSVM), Quadratic Discriminant Analysis (QDA) with Principal Component Analysis (PCA), Support Vector Machine (SVM) with Polynomial Kernel (SVM-PK), KNN with Locally Linear Embedding (LLE), and Isolation Forest (IF) were used. The findings showed that QDA-PCA achieved an accuracy of 94%. This work did not consider any feature selection. Aldrees et al. (2024) presented an approach for predicting ASD in toddlers, using data collected as part of the Diverse ASD screening data for toddlers. They employed three feature selection approaches: PCA, Chi-Square, and Backward Feature Elimination (BFE). For prediction, the following models were used: LR, RF, SVM, KNN, XGB, Stochastic Gradient Classifier (SGC), and Extra-Trees (ET). They modified the XGB model and presented a model called XGB 2.0. The findings showed that XGB 2.0 and Chi-Square achieved 99% accuracy for the toddler’s dataset. Das et al. (2025) employed five ML classifiers, namely LR, KNN, DT, SVM, and neural networks. They utilized MFS for feature selection and stacked the presented ML classifiers to present a new classifier for prediction. Evaluation using the toddler dataset showed 99.14% accuracy using the stacked method. The computation time is significantly high when more than two machine learning classifiers are stacked. The summary of the literature survey is presented in Table 1.
| Ref. no. | Model used | Feature selection used | Best model | Accuracy (%) |
|---|---|---|---|---|
| Thabtah (2018) | NB, SVM | No | NB | 94.23% (Adolescents), 99.85% (Adults), 97.94% (Children) |
| Thabtah & Peebles (2019) | RML, C4.5 DT, AB, PRISM, CART, Bagging, NNGE, RIDOR, RIPPER | Yes | RML (Adult), C4.5 DT (Children), AB (Adolescent) | 95% (Adults), 91% (Children), 87% (Adolescents) |
| Alkahtani et al. (2023) | KNN, SVM, LSTM, DT | No | SVM, LSTM | 100% (Toddler) |
| Farooq et al. (2023) | FL with LR and SVM | No | SVM | 98% (Children), 81% (Adults) |
| Priyadarshini (2023) | CNN-LSTM-PSO, CNN-GRU | Yes (SMOTE for data balancing) | CNN-LSTM-PSO | 99.64% (Toddler), 98.89% (Adults) |
| Pae & Pae (2024) | RF, DT | No | RF (Children), DT (Adult, Adolescent) | 95.9% (Children), 94.3% (Adults), 80.8% (Adolescents) |
| Hajjej et al. (2024) | DT, RF, LR, KNN, SVM, GBM, XGB, RF-XGB | Yes (BF, BEFS, MFS) | RF-XGB | 99% (with FS), 94% (without FS) (Toddler) |
| Reghunathan et al. (2024) | L-R, KNN, SVM | Yes (CSA) | L-R with CSA | 96.23% (Children), 89.42% (Adolescents), 97.01% (Adults) |
| Bawa et al. (2024) | DT, KNN, NB, RF, SVM, LR | Yes (Manually selected 14 features) | LR (Children, Adolescent, Merged), SVM (Adult) | 94.3% (Children), 99.0% (Adolescents), 97.2% (Merged), 98.5% (Adults) |
| Alshammari et al. (2024) | FL with KSVM, QDA, PCA, SVM-PK, KNN-LLE, IF | Yes (Feature Transformation) | QDA-PCA | 94% (Toddler) |
| Aldrees et al. (2024) | LR, RF, SVM, KNN, XGB, SGC, ET, XGB 2.0 | Yes (PCA, Chi-Square, BFE) | XGB 2.0 with Chi-Square | 99% (Toddler) |
| Das et al. (2025) | LR, KNN, DT, SVM, Neural Networks | Yes (MFS) | Stacked ML Classifier | 99.14% (Toddler) |
According to the above survey, it has been identified that most existing ASD prediction studies have been trained using small sample sizes and have not adequately addressed the issue of class imbalance, which significantly affects model performance and generalization. Only Priyadarshini (2023) has attempted to tackle the class imbalance problem among the surveyed works using SMOTE. Furthermore, very few studies have explored the use of FL for ASD prediction, with only Lakhan et al. (2023), Farooq et al. (2023), and Alshammari et al. (2024) incorporating FL-based approaches. Additionally, Abu-Nowar et al. (2024) introduced SENSES-ASD, a technology-based system designed to enhance social-emotional skills in individuals with ASD, offering a promising approach for personalized interventions. Given these limitations, this work introduces the ALROH model, which leverages FL for privacy-preserving data collection and employs a hybrid DL framework integrating CNN for feature extraction, LSTM for sequential learning, and DFO for parameter optimization. The proposed ALROH model aims to enhance the accuracy of ASD prediction while addressing data scarcity, class imbalance, and privacy concerns. The detailed architecture and methodology of ALROH are discussed in the next section.
Materials and Methods
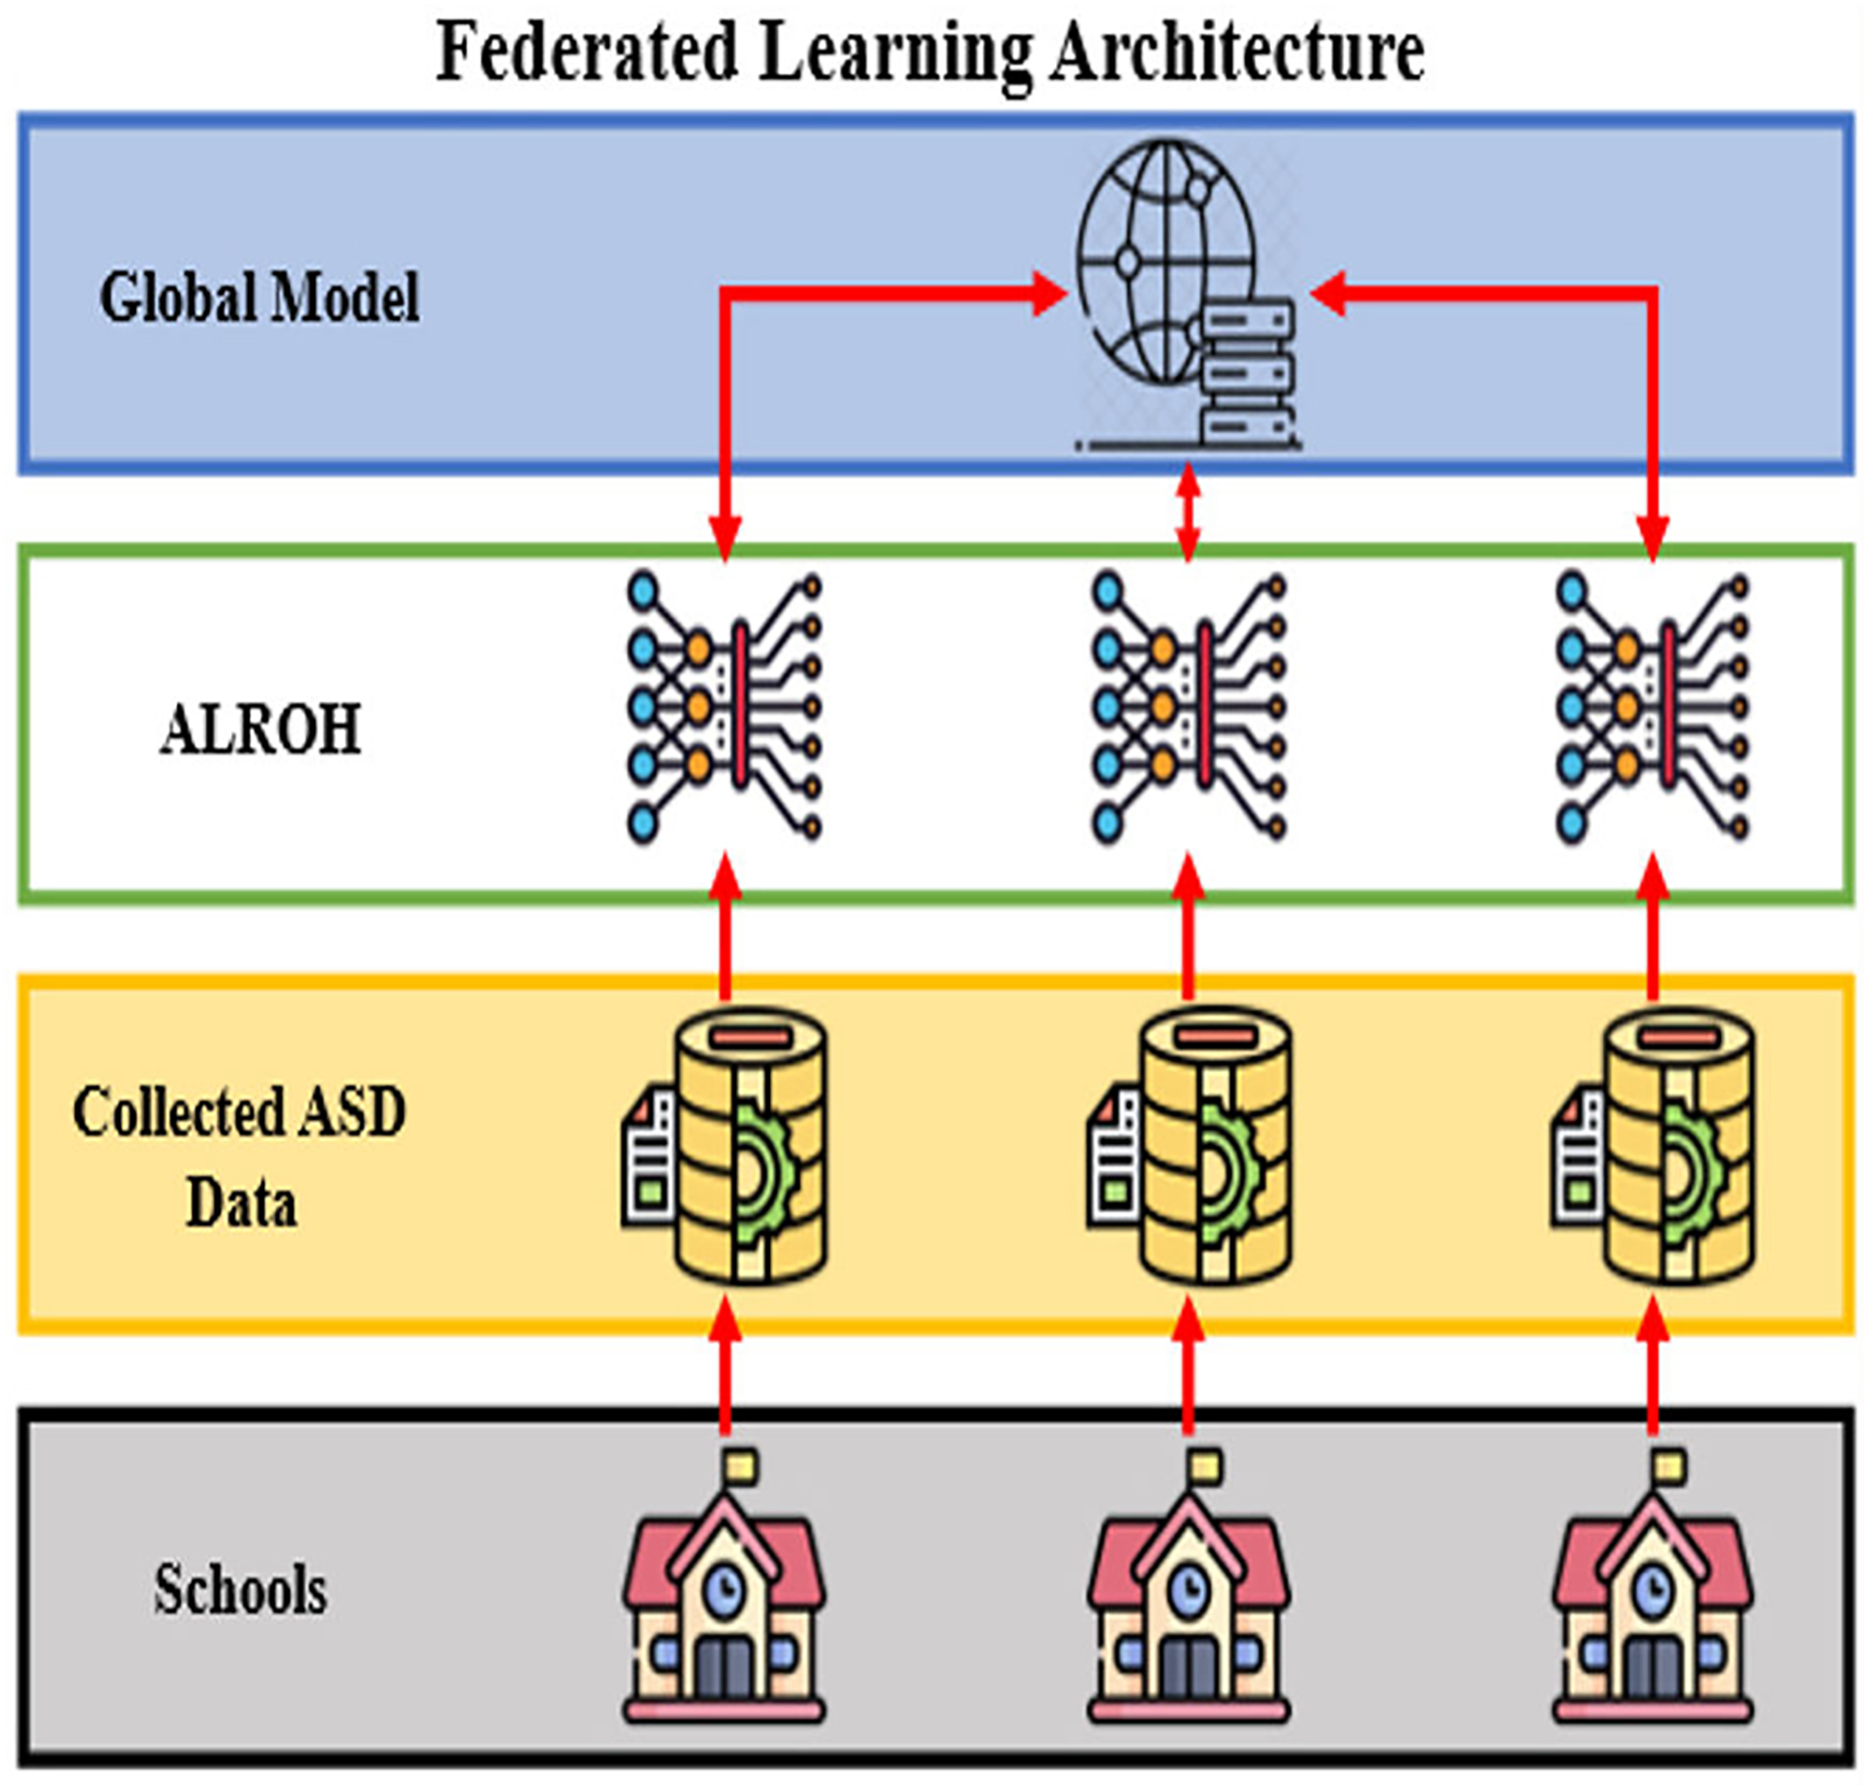
The complete architecture of this methodology in FL is presented in Fig. 1, which is designed for predicting ASD in toddlers and children based on student performance data. The architecture is structured into four hierarchical layers, beginning with schools at the bottom, where raw ASD-related data is collected. This data includes responses to screening questions (A1–A10), demographic attributes such as age and gender, family history of ASD, test taker identity, and total ASD score. The collected ASD data is stored in decentralized local databases at each participating school, ensuring that sensitive information remains private and secure. Instead of sharing raw data, schools train the ALROH model locally. The locally trained models are then sent to the Global Model server, where their parameters are aggregated to refine a shared global model. The refined global model is then redistributed back to each local entity for further training. This iterative process continues, improving the model’s accuracy while preserving privacy. By leveraging FL, this architecture prevents direct data sharing. It mitigates concerns about data privacy and security risks, which are particularly crucial when handling sensitive information related to healthcare and students. The ALROH model is specifically designed to analyze ASD prediction patterns effectively by combining convolutional feature extraction, sequential pattern recognition, and an optimized learning approach, which is discussed in the next section.
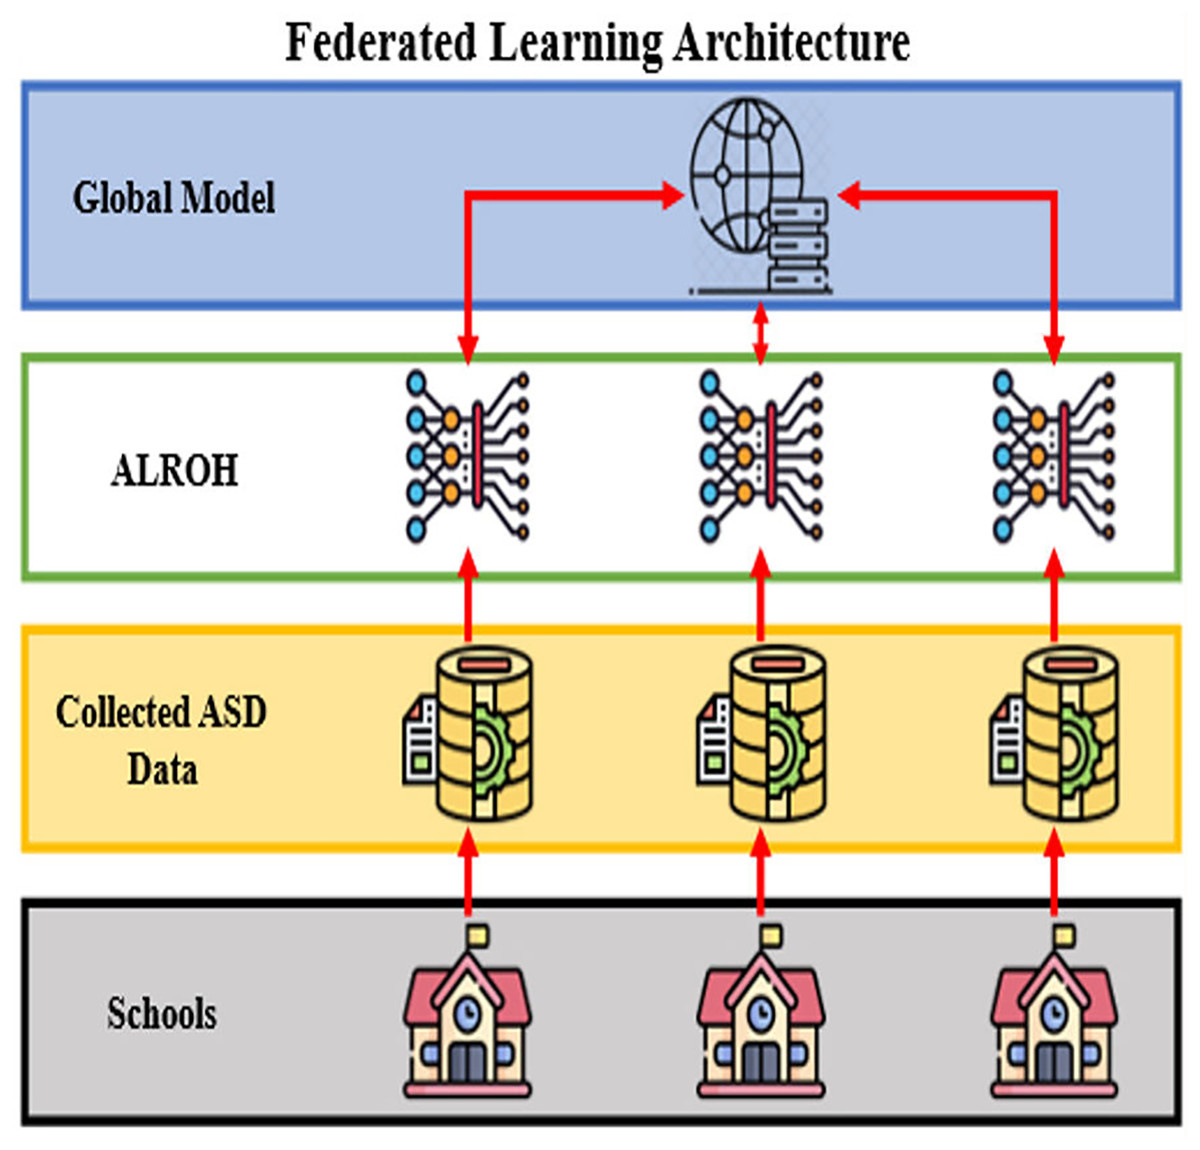
Figure 1: FL architecture for ASD prediction.
Architecture
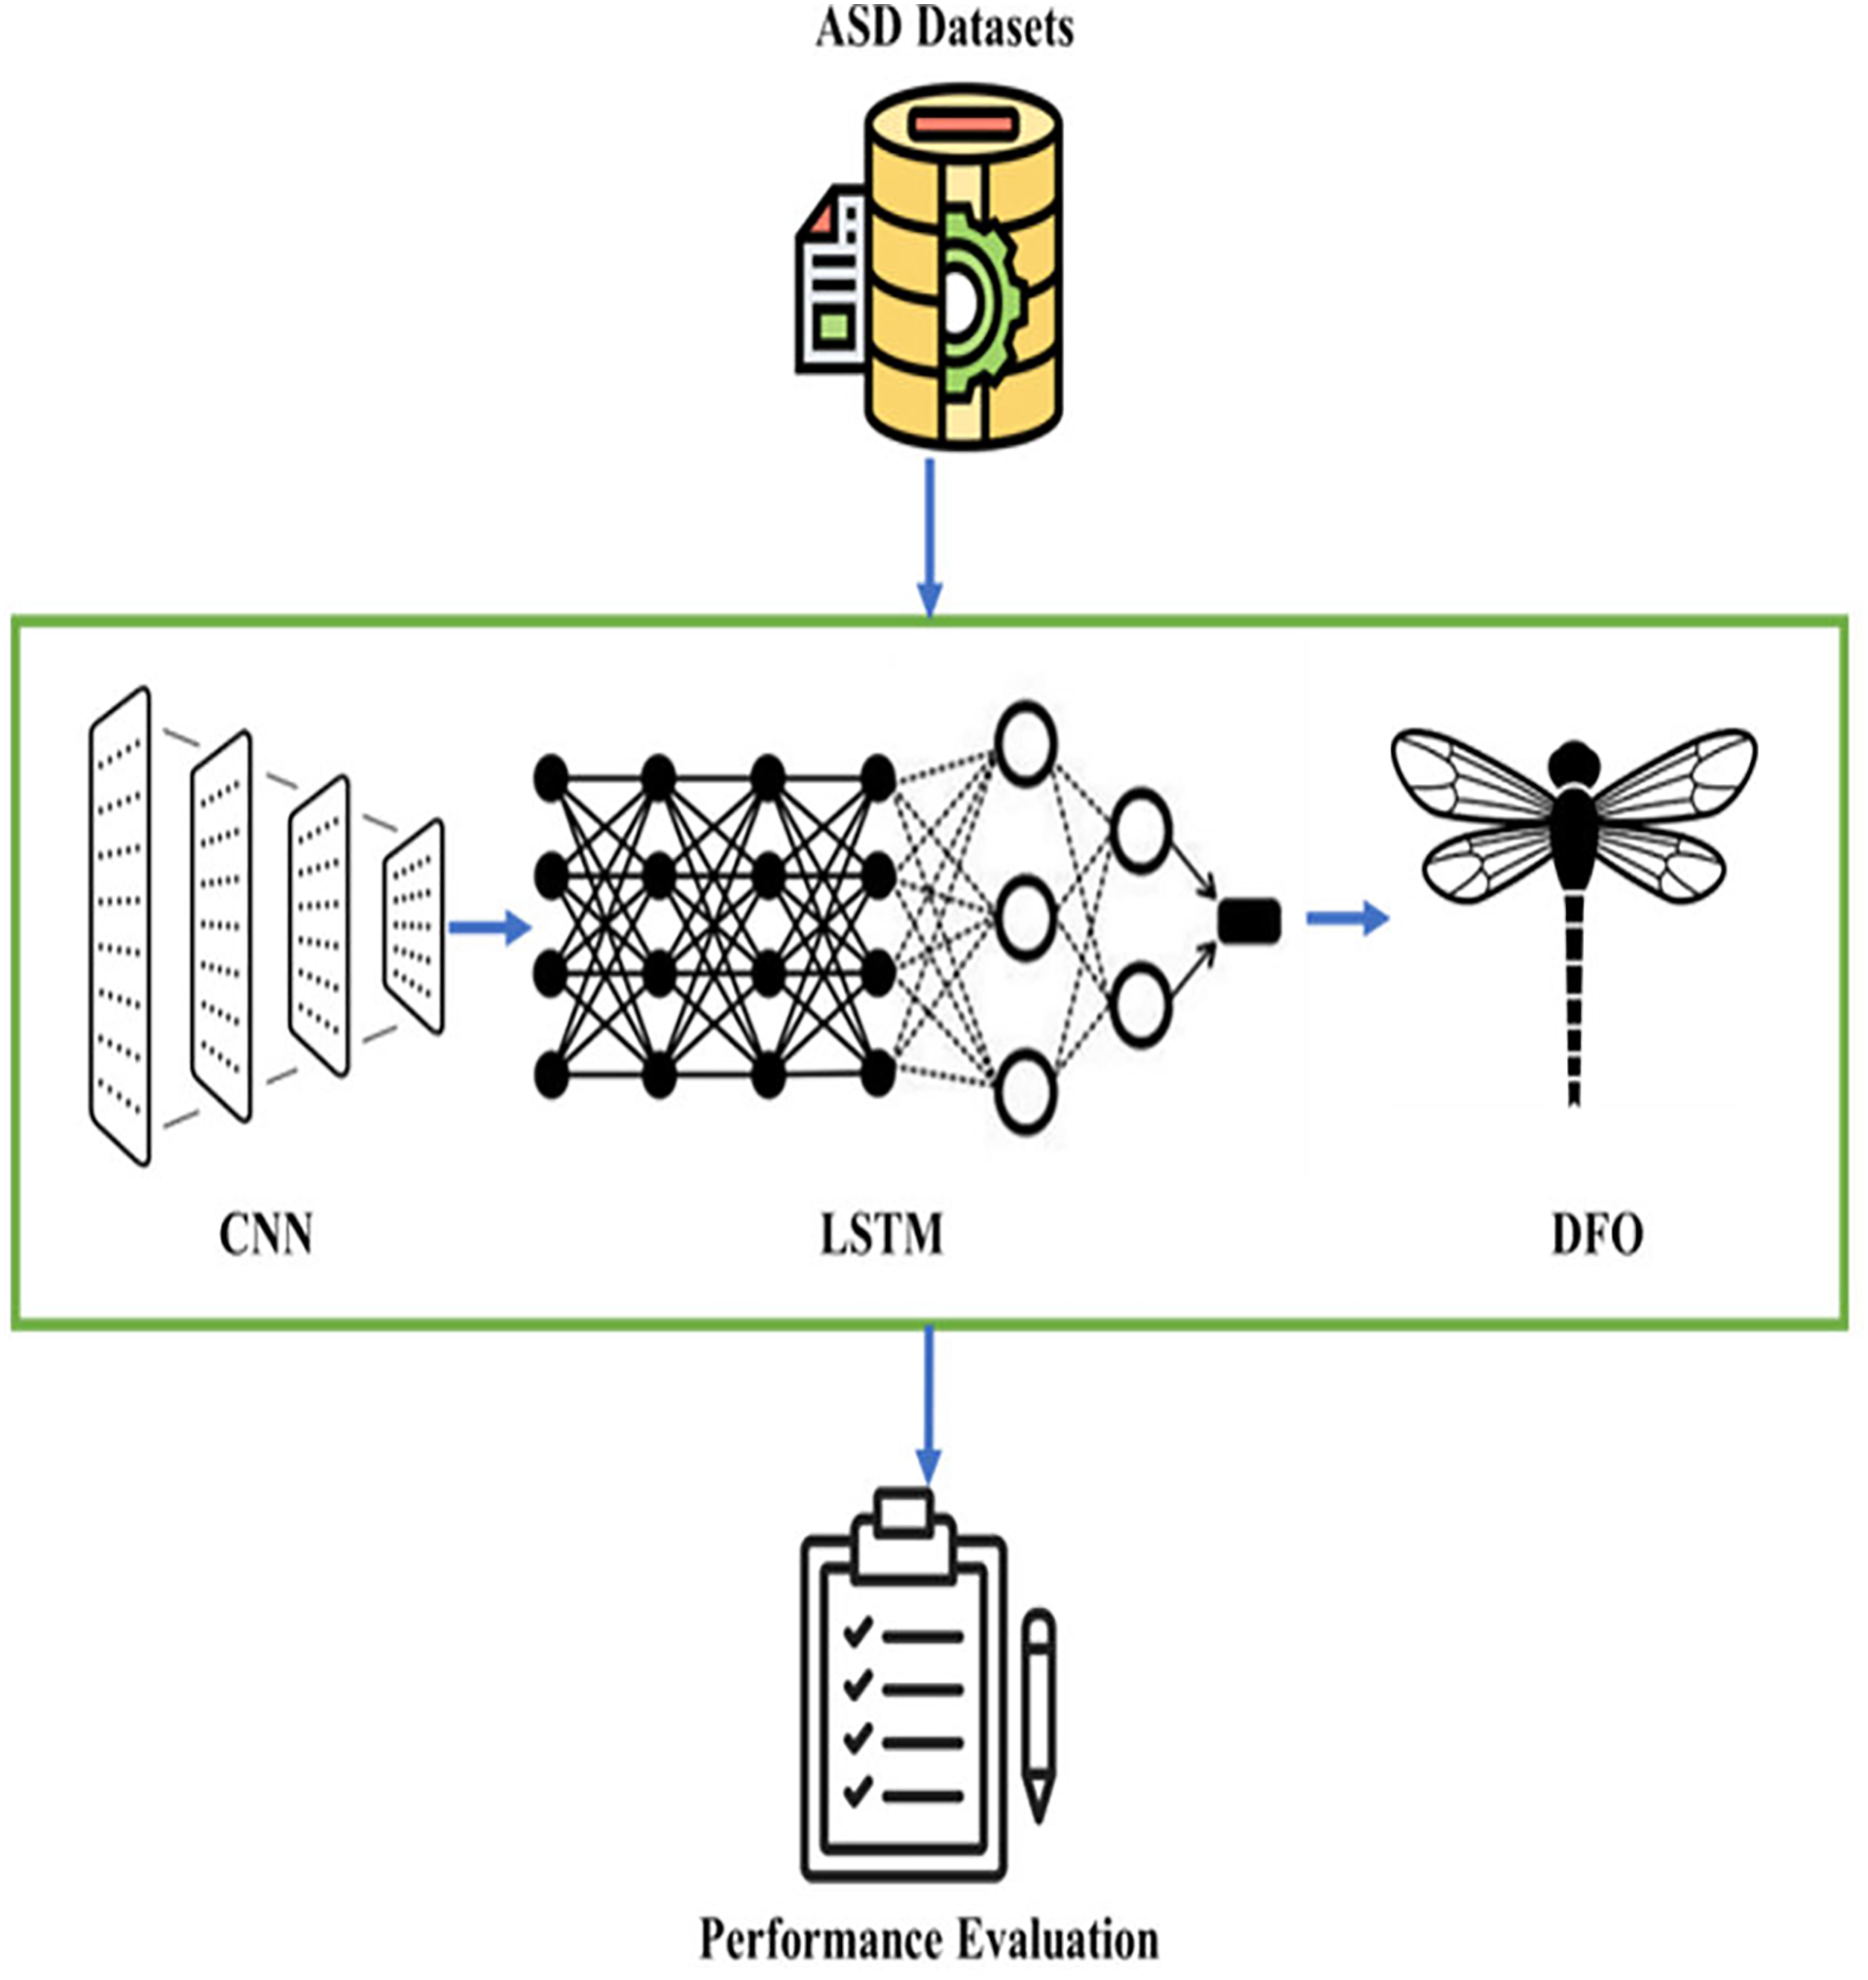
The architecture of the ALROH model for ASD prediction is presented in Fig. 2. The process begins with preprocessed datasets, which are initially stored in .arff format for compatibility with standard preprocessing tools (e.g., WEKA). To simulate a FL environment, this dataset is partitioned into multiple client subsets, each representing an independent data holder. Instead of centralizing the raw data, each client subset is trained locally, and the learned parameters are aggregated on a central server using the FL mechanism. This setup ensures that model training simulates privacy-preserving and distributed learning rather than direct centralized training. Each client employs a CNN–LSTM model for feature extraction and sequential behavior analysis. The CNN identifies key patterns and dependencies in the behavioral and sensory data through convolution operations, ReLU activation, pooling, and fully connected layers. The extracted feature maps are then passed to the LSTM, which is well-suited for modeling the sequential dependencies that characterize ASD-related behavioral patterns. To enhance the overall predictive accuracy, a DFO algorithm is applied to optimize the hyperparameters and weights of the CNN–LSTM model. The DFO utilizes swarm intelligence to dynamically adjust network parameters, minimize prediction errors, and enhance convergence across the federated nodes. Finally, the aggregated model parameters are forwarded to the output layer, which generates a binary classification result: ASD-positive (1) or ASD-negative (0). This approach facilitates early detection of ASD, enabling timely interventions and personalized support for children at risk. Thus, the ALROH architecture integrates simulated FL with deep learning models (CNN and LSTM) and optimization techniques (DFO) to deliver an accurate, scalable, and privacy-aware framework for ASD prediction.
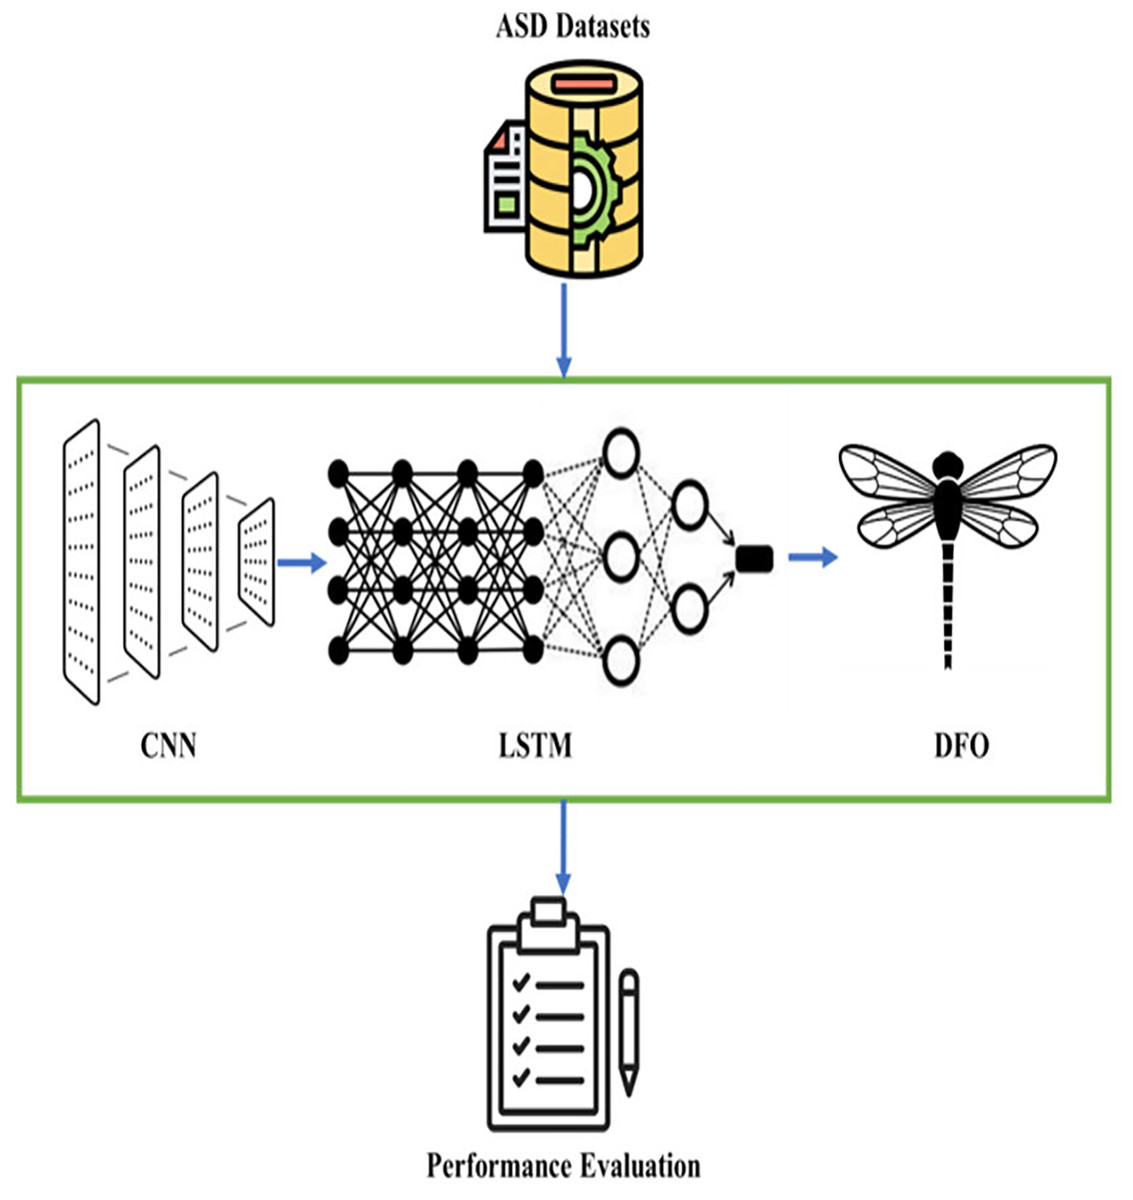
Figure 2: ALROH model for ASD prediction.
CNN for feature extraction
To handle ASD tabular datasets in .arff or .csv format, the proposed method first preprocesses each record into a structured matrix representation, where rows correspond to ASD-related attributes (behavioral, demographic, or screening-question features) and columns correspond to individual samples. This transformation enables convolutional operations in CNNs to exploit local correlations between neighboring features. The input feature matrix is denoted in Eq. (1).
(1)
In Eq. (1), denotes ASD-related features at every row and column , denotes the total number of features and denotes different samples of ASD. Although CNNs are conventionally applied to image data, recent studies (e.g., ConvTabNet (Borisov et al., 2022), TabCNN (Kulkarni, 2024)) demonstrate that 1D/2D convolution can effectively capture spatial feature interactions in tabular datasets (Alenizy & Berri, 2025). Thus, a modified 1D-CNN is adopted here, where convolution kernels slide across the feature dimension to extract higher-order interactions among attributes. Therefore, every feature vector is transformed using a convolution filter to capture the local dependencies present in each sample; that is, every neuron in the convolution layer analyzes every feature of the input ASD data. In the convolution layer, the process of convolution is to extract spatial patterns through a filter/kernel having size . Using this, the feature-map is constructed using the following operation presented in Eq. (2).
(2)
In Eq. (2), denotes kernel weights at position and summation denotes the overall kernel-window. Further, the convolution slides over having stride , which defines the step-size movement, and zero-padding is applied to ensure dimensional consistency. Further, for every convolution-layer , the feature map is evaluated using Eq. (3).
(3)
In Eq. (3), denotes a bias matrix for every feature map, denotes a convolutional kernel between feature maps of the previous layer and feature-maps of the current layer and denotes Rectified Linear Unit (ReLU) activation function, as presented in Eq. (4).
(4)
Hence, using Eq. (3), the output feature map using a convolution layer for position is evaluated using Eq. (5).
(5)
Using Eq. (5), the convolution layer enables hierarchical feature learning. After the convolution layer, the extracted features are passed on to the pooling layer, where they are reduced in complexity while retaining the dominant features. In the pooling layer, by utilizing max-pooling with having window size and stride , the pooling layer is evaluated as presented in Eq. (6).
(6)
In Eq. (6), denotes the pooling process. Using Eq. (6), only the highest value is retained for every window. Hence, the output dimensions for the pooling layer are defined using Eq. (7).
(7)
After multiple convolution layers and a pooling layer, the output is flattened into a vector form denoted as , which is then passed on to the Fully Connected Layer (FCL), where the following operation is performed as presented in Eq. (8).
(8)
In Eq. (8), , , denotes total feature maps extracted using FCL, denotes weights that connect every row and column , i.e., for every feature-map for layer for every position in feature-map present in Layer. To avoid overfitting in FCL, a dropout regularization function was applied, which reduced the overall number of neurons. Moreover, softmax was applied to convert the raw output features extracted using a modified CNN process into a binary class probability distribution using Eq. (9).
(9)
In Eq. (9), denotes the probability of the given input feature matrix belongs to a class , i.e., 1 or 0 for ASD-positive or ASD-negative, respectively, denotes the input feature matrix, which is extracted from the CNN and processed by LSTM, as discussed in the next section, denotes weight vector for class which maps to extracted feature to its respective class , denotes the dot product of the weight vector and , producing a scalar score for the class , denotes the applied exponential function for class-score and denotes the normalization term, which ensures the probabilities sum for the class . Once the CNN layer extracted the hierarchical feature embeddings from structured ASD records. Pooling is then applied to reduce dimensionality, followed by flattening into a feature vector, which is passed to the LSTM. The LSTM model, which handles sequential dependencies in the dataset, is discussed in detail in the next section.
LSTM model for ASD prediction
After extracting features using a modified CNN, the feature matrix is passed on to LSTM, which captures sequential patterns and temporal dependencies from ASD datasets for ASD prediction. The flattened CNN feature embeddings are sequentialized to exploit dependencies among attributes. While LSTMs are designed for temporal sequences, each ASD record is represented here as a pseudo-sequence of features, where the ordering of attributes enables the LSTM gates to capture inter-feature dependencies that a CNN alone cannot model. Additionally, the LSTM in this work is utilized to address the vanishing gradient problem and learn from long-term dependencies using gates that control data flow. For every extracted feature using the modified CNN from the input feature matrix , the LSTM cell processes the input sequence using Eq. (10).
(10)
In Eq. (10), is the input for the time step . The LSTM cell utilizes two states at every step. , i.e., hidden-state and cell-state . The contains data related to upcoming steps and stores long-term dependency. Further, the LSTM cell consists of three primary gates, forget-gate , input-gate and output gate . The decides which previous data has to be forgotten, determines which new data has to be stored and controls which data is passed on to the next time step. The decides which data has to be forgotten or retained using previous cell-state . Moreover, the uses input and previous , applies weight-transformation and passes to the sigmoid-activation function as presented in Eq. (11).
(11)
In Eq. (11), has activation values (close-forget past data) and (retain past data), denotes weight-matrix for , denotes weight-matrix for , is a bias term. The is a sigmoidal activation function, which is evaluated using Eq. (12).
(12)
The consists of two processes, i.e., input-gate activation and candidate cell-state which are evaluated using Eqs. (13) and (14), respectively.
(13)
(14)
In Eqs. (13) and (14), controls how much new data enters and , , , , and are weights and bias terms, denotes candidate-memory content, which helps in identifying which new data has to be added and is a hyperbolic-tangent activation function, which is evaluated using Eq. (15).
(15)
Moreover, the is updated utilizing and using Eq. (16).
(16)
In Eq. (16), denotes updated cell state, denotes element-wise multiplication, ensures past memory is kept and ensures new data is added. Finally, the determines which has to be sent as . Similar to , also consists of two processes, first where output-gate activation is evaluated and then is updated. The output-gate activation is evaluated using Eq. (17).
(17)
In Eq. (17), determines output strength and , and are weights and bias terms. Further, the is updated using Eq. (18).
(18)
In Eq. (18), has relevant data from and scales between −1 and 1 for a stable learning process. After the learning process using LSTM, the ASD prediction is performed. This work presents the DFO approach for optimizing hyperparameters of the CNN-LSTM model, which is discussed in detail in the next section.
Dragon-fly optimization
After extracting features from a CNN and utilizing sequential learning with LSTM, this work presents a DFO approach that optimizes the hyperparameters of CNN-LSTM to enhance accuracy and minimize loss. The CNN–LSTM framework involves critical hyperparameters (learning rate, number of CNN filters, LSTM hidden units, dropout rate, batch size). To avoid manual tuning, the DFO metaheuristic is employed. Each dragonfly represents a candidate hyperparameter set, and its position is updated by balancing exploration (global search) and exploitation (local refinement). DFO is a swarm-intelligent approach inspired by the swarm behaviour of dragonflies. The dragonflies move in groups during the exploration phase and remain in a static state during the exploitation phase, based on five key forces. These forces help optimize hyperparameters such as batch size, learning rate, LSTM total units, dropout rate, and others. In the DFO approach, every dragonfly denotes a candidate approach in hyperparameter searching space. The position update of dragonfly is evaluated using Eq. (19).
(19)
In Eq. (19), denotes dragonfly position at time (current hyper-parameter values), denotes memory-based movement (previous best position), denotes separation, i.e., avoid collision or overcrowding, denotes alignment, which helps to synchronize velocity with respect to its other dragonfly neighbors, denotes cohesion, i.e., the dragonfly moves towards center of its neighboring solutions, denotes attraction towards the best approach found during optimization, , , , and denote weight coefficients that control the impact of every movement factor. The is evaluated as Eq. (20).
(20)
The Eq. (20) ensures every dragonfly remembers its best solution and returns to them if a new position does not improve fitness. Further, the is evaluated using Eq. (21).
(21)
The Eq. (21) avoids collision with other dragonflies by repelling dragonflies that are too close and denotes the total number of neighboring solutions. The , and are evaluated using Eqs. (22), (23) and (24), respectively.
(22)
(23)
(24)
In Eq. (22), the ensures the dragonflies’ velocity is the same as its neighbors, in Eq. (23) ensures the movement of dragonflies toward the swarm center and in Eq. (24), every dragonfly moves towards the best global solution found so far. This position update approach provides a framework for efficiently exploring and exploiting the search space, thereby enhancing hyperparameters for ASD prediction. Furthermore, the fitness function is used to evaluate every dragonfly’s solution. Hence, the accuracy and loss of the CNN-LSTM model for ASD prediction are evaluated using a fitness function guiding optimization in Eq. (25).
(25)
In Eq. (25), denotes fitness-score, denotes the prediction accuracy of the CNN-LSTM model, denotes loss attained during cross-entropy and and are balancing coefficients. Through iterative position–velocity updates, DFO avoids premature convergence and identifies hyperparameters that maximize ASD prediction accuracy. In DFO, every candidate solution (dragonfly) is tested utilizing Eq. (25), and the best-performing hyperparameters are retained. Further, every dragonfly updates its respective velocity to control convergence speed using Eq. (26).
(26)
In Eq. (26), is the velocity of a dragonfly at time , denotes inertia weight, denotes best local solution found is dragonfly, denotes the best global solution found by Dragonfly and , denotes random coefficients, which ensure exploration and avoid premature convergence. Moreover, in Eq. (26), keeps momentum using the previous velocity, moves toward a best local solution and moves towards the best global solution. This velocity update process allows dragonflies to adapt dynamically, reduce search stagnation, and find the best solution. The complete hyper-tuning process for the CNN-LSTM model is presented in Algorithm 1 below.
| Step 1 Start |
| Step 2 Initialize the Dragonfly Population |
| Step 3 Define hyperparameter ranges of CNN-LSTM |
| Step 4 Randomly generate initial position and velocity |
| Step 5 Evaluate fitness function |
| Step 6 Train CNN-LSTM using every dragonfly’s hyperparameter set |
| Step 7 Compute accuracy and loss to determine fitness-score |
| Step 8 Update Position and Velocity |
| Step 9 Use the position update value for generating new hyperparameter values |
| Step 10 Update velocity for controlling convergence speed |
| Step 11 Check convergence |
| Step 12 If a stopping condition is met |
| Step 13 Stop |
| Step 14 Else repeat from Step 2 |
| Step 15 End If |
| Step 16 Return the best hyperparameters |
| Step 17 The best dragonfly’s position represents optimized CNN-LSTM hyperparameters |
| Step 18 End |
Using the DFO in the CNN-LSTM model, the approach avoids local minima, balances random exploration, handles class imbalance, provides focused learning, and finds the best optimal values for hyperparameter tuning. The overall ALROH model achieves higher prediction accuracy using hyperparameter tuning, which is discussed in detail in the next section.
Results and discussion
This section begins by describing the system specifications for implementing the ALROH model and the performance metrics employed for evaluation. It then provides a detailed discussion of the datasets utilized in this study. Finally, the performance of the ALROH model is analyzed for each dataset and compared with existing approaches to assess its effectiveness.
System requirements and performance metrics
To evaluate the performance of the proposed ALROH model, experiments were conducted on a system equipped with 16 GB of RAM and an Intel Core i7 processor. The model was implemented using Python and executed within the Anaconda environment, which was installed on a Solid-State Drive (SSD) to enhance computational speed and efficiency. Using an SSD helped reduce data retrieval time, thereby optimizing the training and evaluation process. Standard performance metrics were also employed to assess the effectiveness and reliability of the ALROH model. These included accuracy, precision, recall, and F-score, widely used in ML to evaluate predictive models. The mathematical formulations of these metrics are presented in Eqs. (27), (28), (29), and (30), ensuring a comprehensive assessment of the model’s predictive capabilities.
(27)
(28)
(29)
(30)
In Eqs. (27), (28), (29) and (30), and denotes true-positive and false-positive, and and denotes true-negative and false-negative.
Datasets
In this work, three publicly available ASD datasets were utilized to evaluate the performance of the proposed ALROH model. The goal was to assess the model’s predictive capabilities across different datasets and ensure its generalizability in ASD detection. The first dataset was the children dataset, collected by Thabtah (2018). This dataset is openly accessible and can be downloaded from UCI Machine Learning Repository (2025). It contains 292 samples, with 141 ASD-positive cases and 151 non-ASD cases. Additionally, Thabtah (2018) also collected a toddler dataset, which is publicly available and can be accessed from Kaggle.com (2025). This dataset comprises 1,053 samples, where 728 cases were identified as ASD-positive, while 325 cases were classified as non-ASD, referred to as the toddler 1 dataset in this work. Furthermore, another toddler dataset was considered, which was collected by Alkahtani et al. (2023). This dataset is openly accessible and can be downloaded from Kaggle.com (2022). It comprises a total of 506 samples, consisting of 341 ASD cases and 165 non-ASD cases, which is referred to as the toddler 2 dataset in this work. With respect to population context, the datasets employed in this study were originally collected by Thabtah (2018) and Alkahtani et al. (2023) using standardized screening questionnaires (such as Autism Spectrum Quotient—AQ-10) and behavioral indicators. The participants were toddlers and children flagged for screening in educational and healthcare contexts. These datasets do not explicitly categorize children by ASD severity levels or therapy participation; instead, they label children as “ASD-positive” or “non-ASD” based on screening thresholds. Therefore, the data reflect screening-level detection rather than detailed clinical severity assessments or therapy outcomes. This makes the datasets particularly suitable for evaluating early-detection models such as ALROH, which aim to assist schools in identifying at-risk children for further professional evaluation. Thus, enhance the robustness of the evaluation, a combined toddler dataset was created by merging the datasets collected by Thabtah (2018) and Alkahtani et al. (2023). The merged dataset comprised 1,559 samples, including 1,069 ASD-positive cases and 490 non-ASD cases, which is referred to as the merged toddler dataset in this work. Finally, a comprehensive dataset was generated by merging the children and toddler datasets collected by Thabtah (2018) and the toddler dataset collected by Alkahtani et al. (2023). The final merged dataset consisted of 1,851 samples, comprising 1,210 ASD cases and 641 non-ASD cases, which is referred to as the merged dataset in this work. Five different datasets were used to rigorously evaluate the ALROH model. By considering multiple datasets with varying distributions of ASD and non-ASD cases, this study aimed to ensure the reliability, effectiveness, and generalization capability of the proposed model across different age groups and data distributions.
Research questions and hypotheses: The empirical evaluation of ALROH was guided by three research questions (RQ): RQ1: Can federated learning (FL) enhance the generalizability of ASD prediction models by securely integrating data from multiple sources? RQ2: Does a hybrid CNN–LSTM architecture capture both spatial and sequential behavioral patterns more effectively than conventional models? RQ3: To what extent does Dragonfly Optimization (DFO) improve hyperparameter tuning, convergence speed, and robustness under class-imbalanced conditions? Based on these, the following hypotheses were tested: (i) FL improves model generalization across datasets; (ii) CNN–LSTM outperforms baseline ML/DL approaches in accuracy and recall; (iii) DFO enhances predictive stability and convergence efficiency compared to non-optimized baselines.
Children dataset
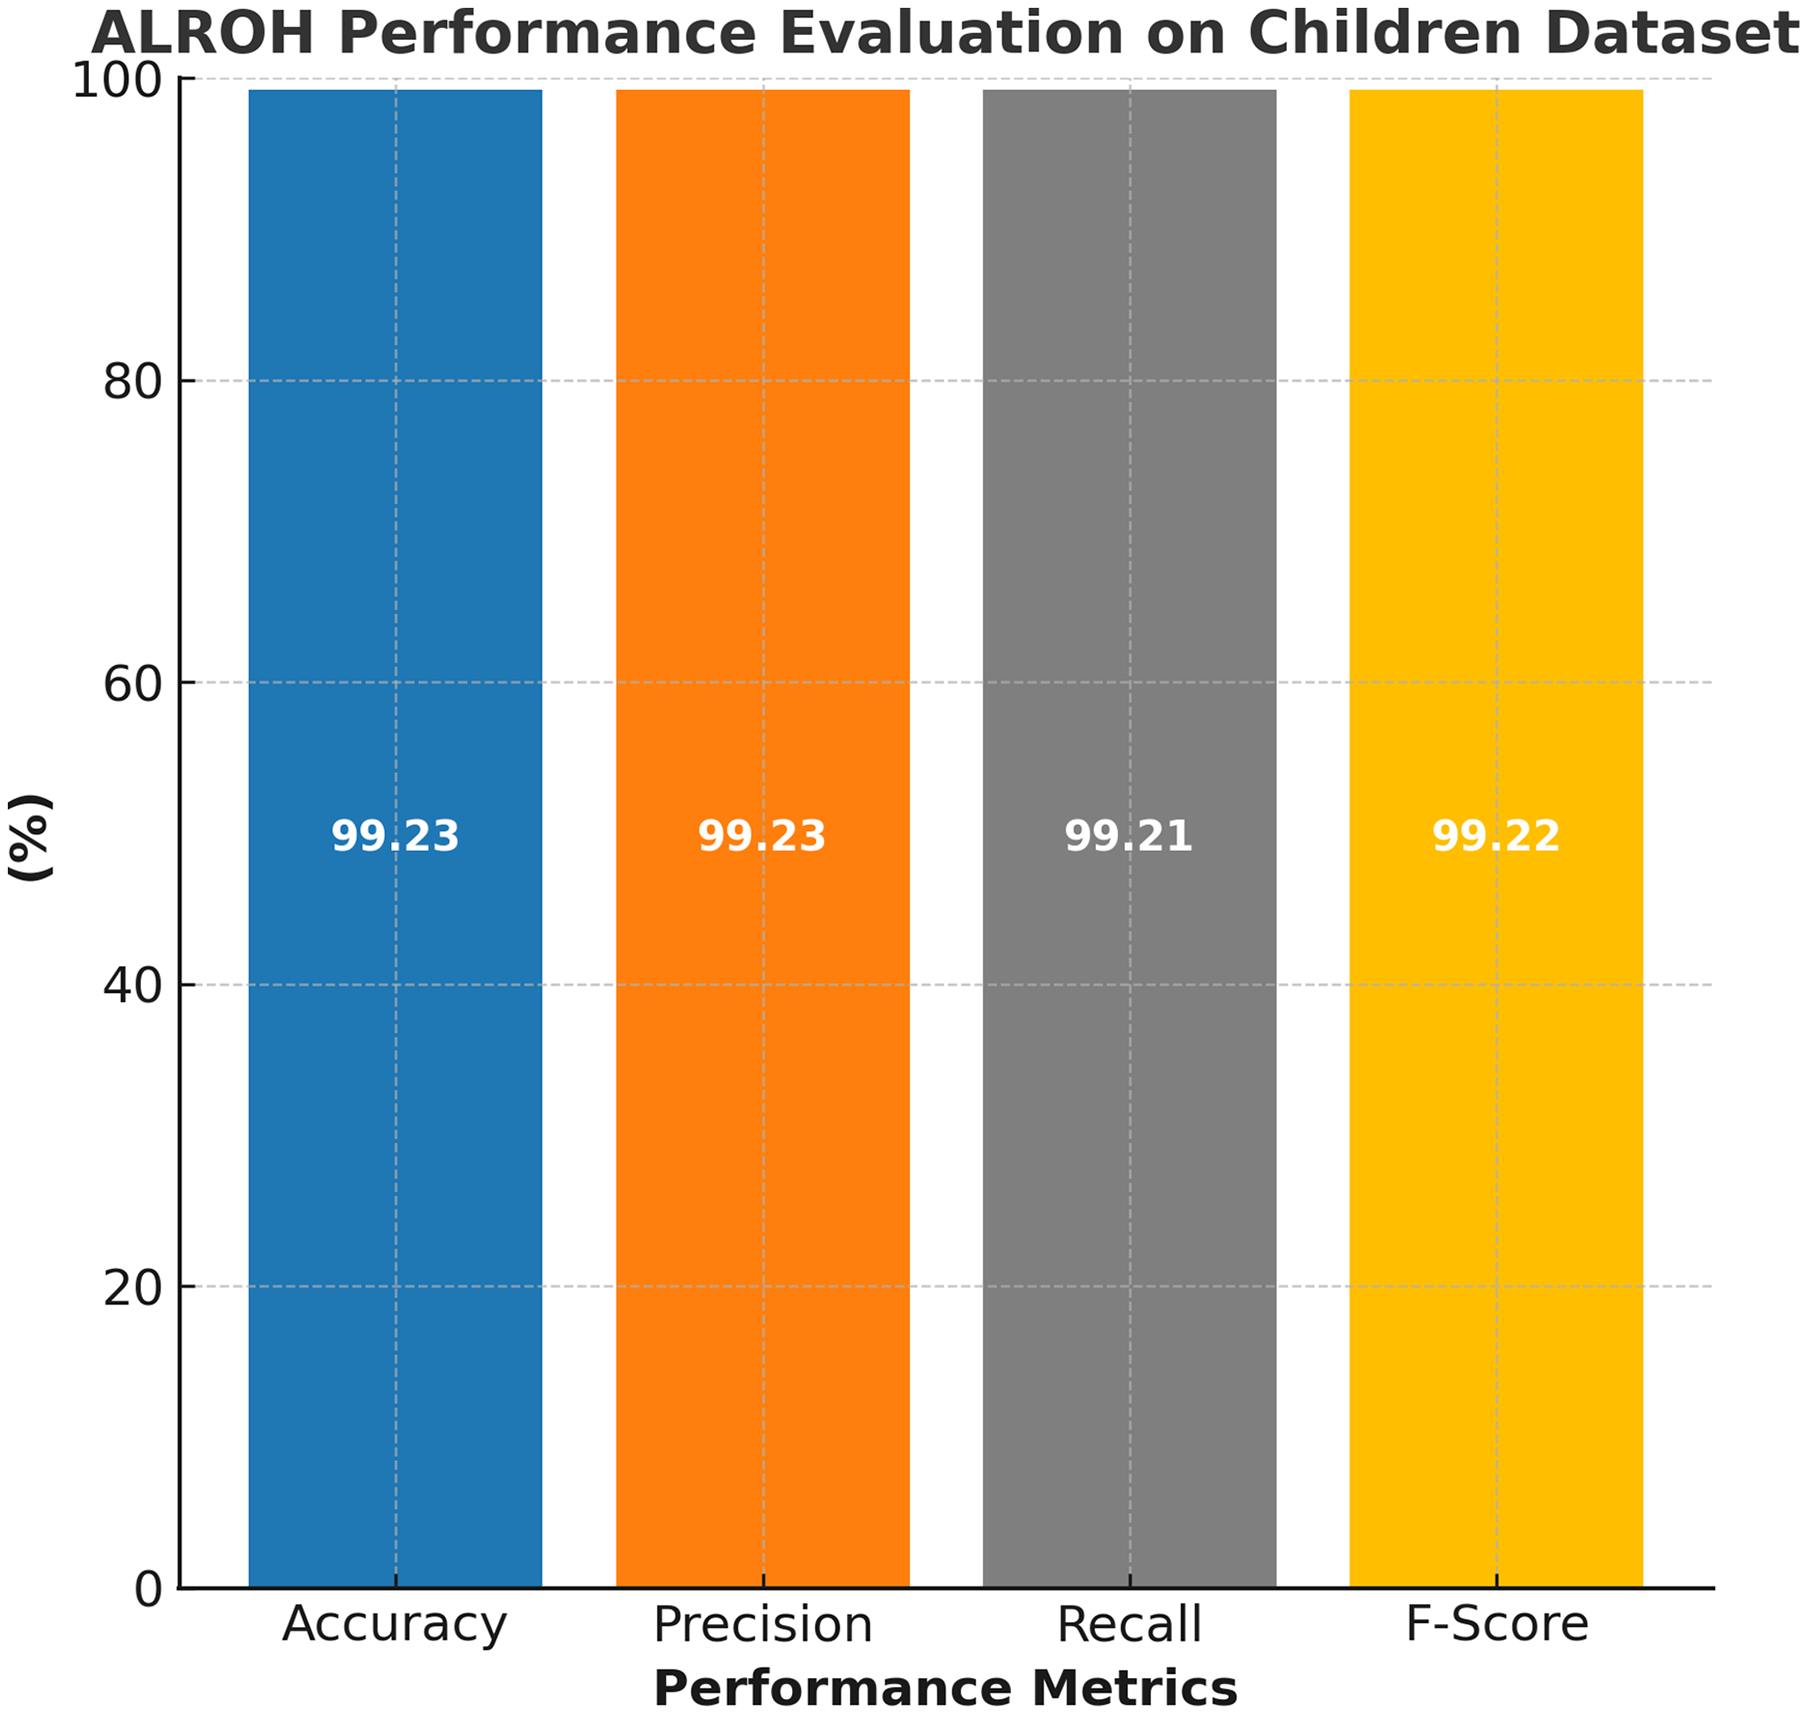
The performance of the proposed ALROH model was thoroughly evaluated using the ASD children dataset, and the results are illustrated in Fig. 3. The model demonstrated exceptional predictive capability across all standard performance metrics. Specifically, the ALROH model achieved 99.23% accuracy, indicating its high reliability in correctly classifying ASD and non-ASD cases. Additionally, the model achieved a precision of 99.23%, indicating its ability to minimize false positives while accurately identifying ASD cases. A 99.21% recall further highlights the model’s effectiveness in correctly detecting ASD cases, ensuring that very few ASD-positive instances were misclassified. Finally, the 99.22% F-score reflects the model’s balanced performance, demonstrating its robustness in predicting ASD.

Figure 3: Performance evaluation of ALROH model on ASD children dataset.
Toddler dataset 1
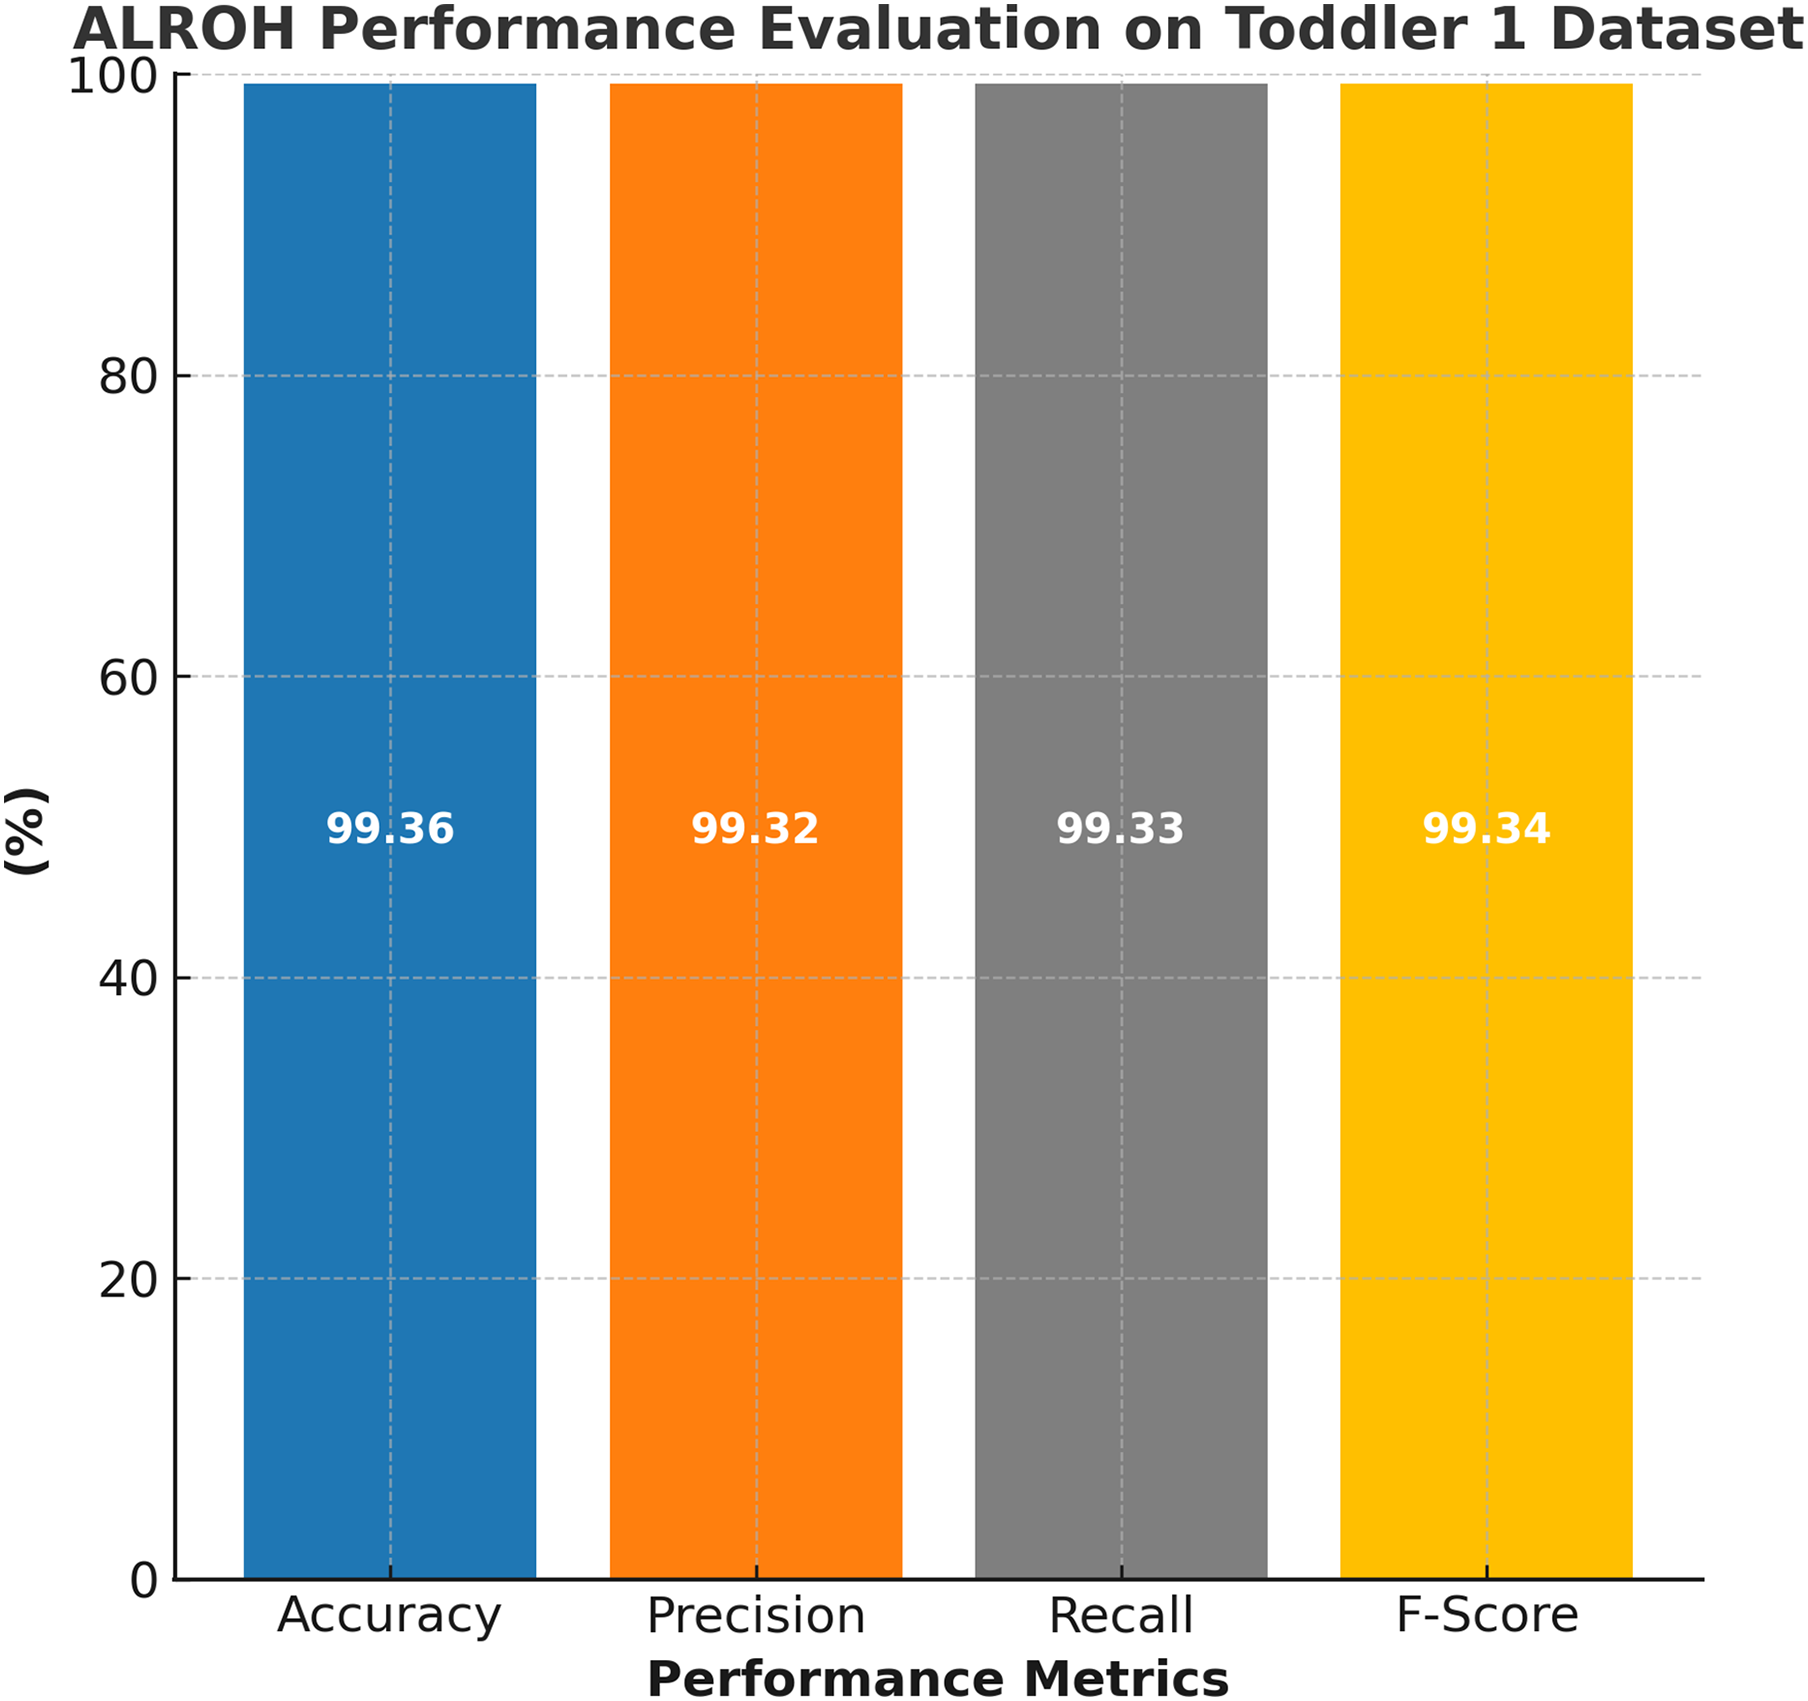
The performance evaluation of the ALROH model on the ASD Toddler 1 dataset is presented in Fig. 4, demonstrating the model’s effectiveness in accurately predicting ASD in toddlers. The ALROH model achieved 99.36% accuracy, indicating strong predictive performance and reliability in classifying ASD and non-ASD cases. Additionally, the model achieved 99.32% precision, ensuring minimal false positives while accurately identifying ASD-positive instances. A 99.33% recall further highlights the model’s ability to accurately detect ASD cases, thereby minimizing false negatives (FNs) and improving early diagnosis. Moreover, a 99.34% F-score reflects a balanced performance, signifying the overall robustness of the model.

Figure 4: Performance evaluation of ALROH model on ASD Toddler 1 dataset.
Toddler dataset 2
The performance evaluation of the ALROH model on the ASD Toddler 2 dataset is presented in Fig. 5, showcasing its high efficiency in predicting ASD among toddlers. The ALROH model achieved 99.28% accuracy, indicating its strong capability in distinguishing ASD and non-ASD cases with minimal errors. The model also demonstrated 99.26% precision, ensuring that FPs were kept to a minimum while accurately identifying ASD cases. Additionally, the 99.27% recall highlights the model’s effectiveness in accurately detecting ASD cases, thereby minimizing FNs and enhancing early diagnosis. The 99.27% F-score further validates the model’s balanced performance, demonstrating its robustness in classifying ASD.
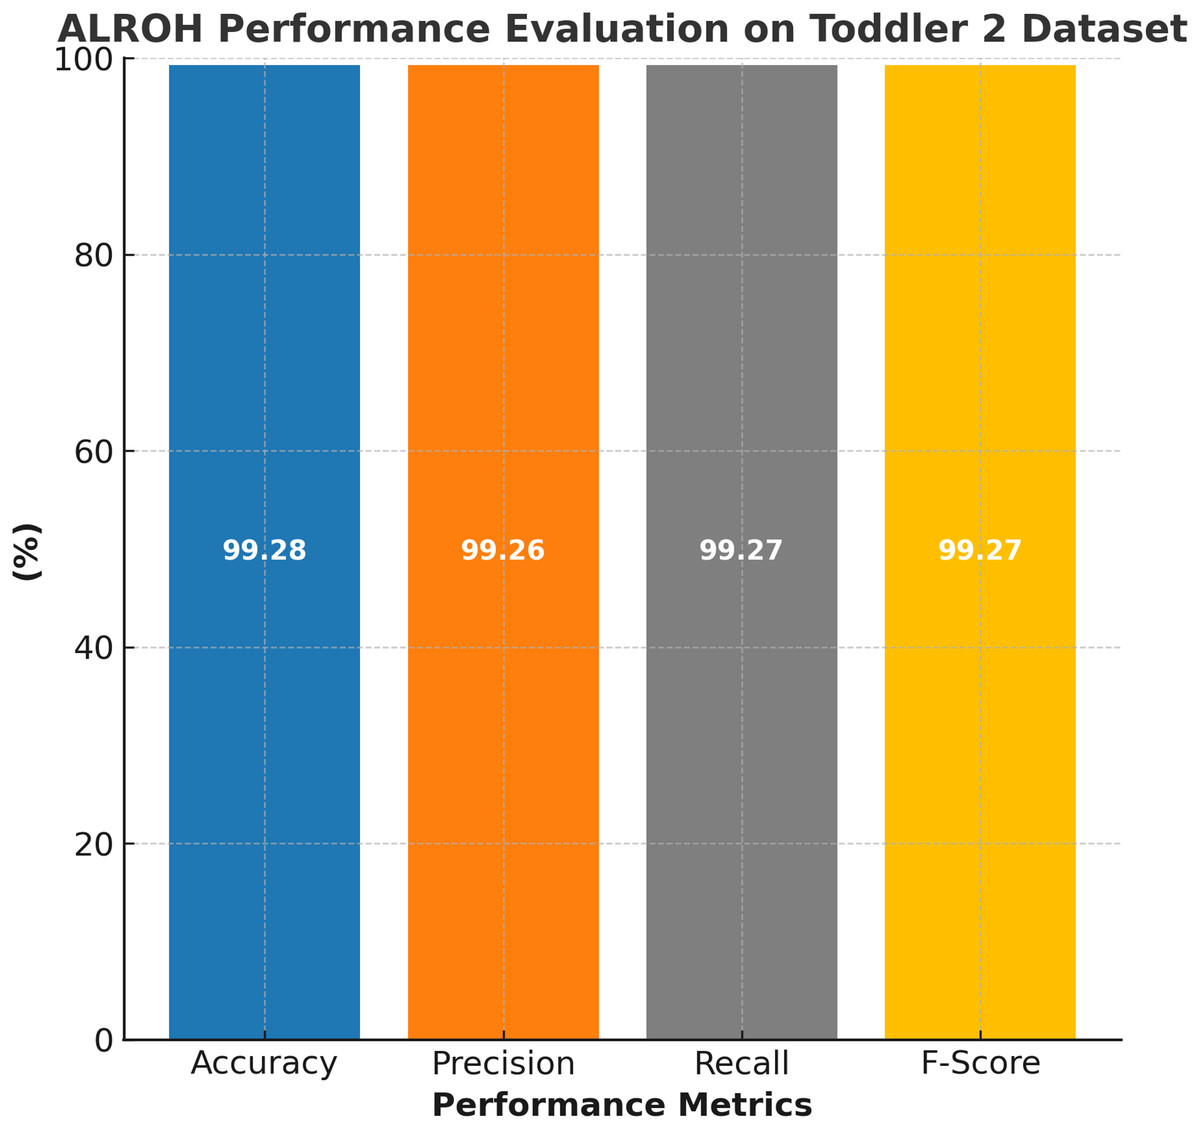
Figure 5: Performance evaluation of ALROH model on ASD Toddler 2 dataset.
Merged toddler dataset
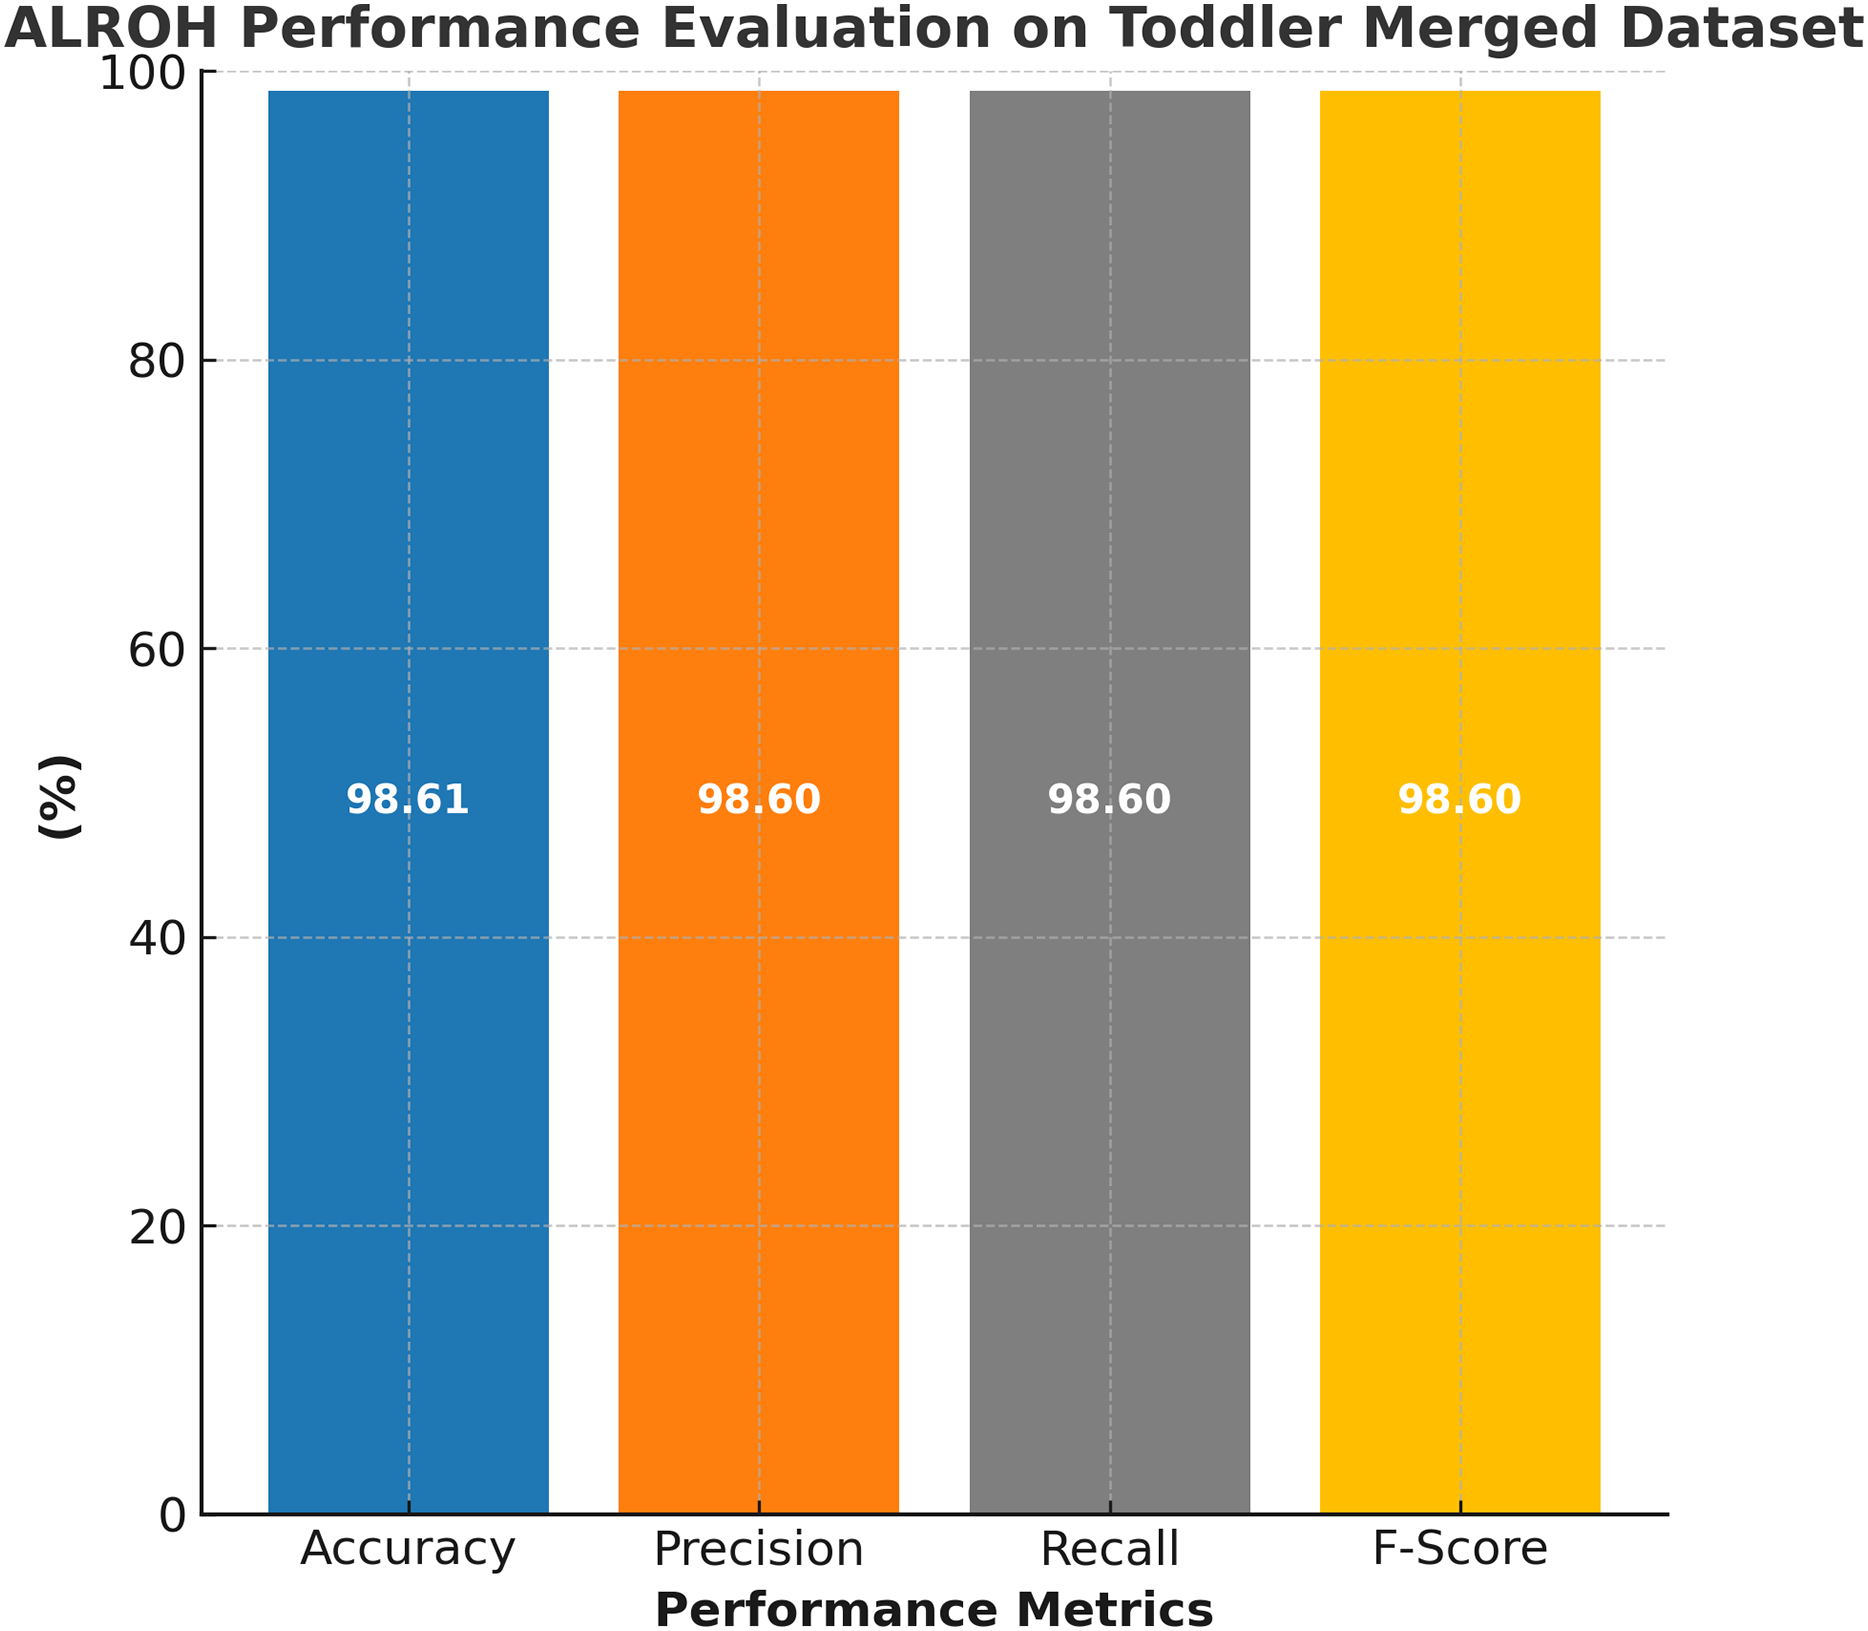
The performance evaluation of the ALROH model on the ASD merged toddler dataset is presented in Fig. 6, demonstrating its effectiveness in handling a larger and more diverse dataset. The ALROH model achieved 98.61% accuracy, demonstrating its robustness and generalization capabilities across various toddler ASD datasets. The 98.6% precision reflects the model’s ability to classify ASD cases while minimizing FPs correctly. Additionally, 98.6% recall highlights the model’s efficiency in identifying true ASD cases, ensuring minimal FNs. The 98.6% F-score further confirms the model’s balanced performance, making it a reliable approach for ASD prediction in toddlers. The slightly lower accuracy compared to individual toddler datasets suggests that the merged dataset introduces greater variability. Yet, ALROH still maintains high performance, showcasing its adaptability and effectiveness in predicting ASD across different datasets.

Figure 6: Performance evaluation of ALROH model on ASD merged toddler dataset.
Merged dataset
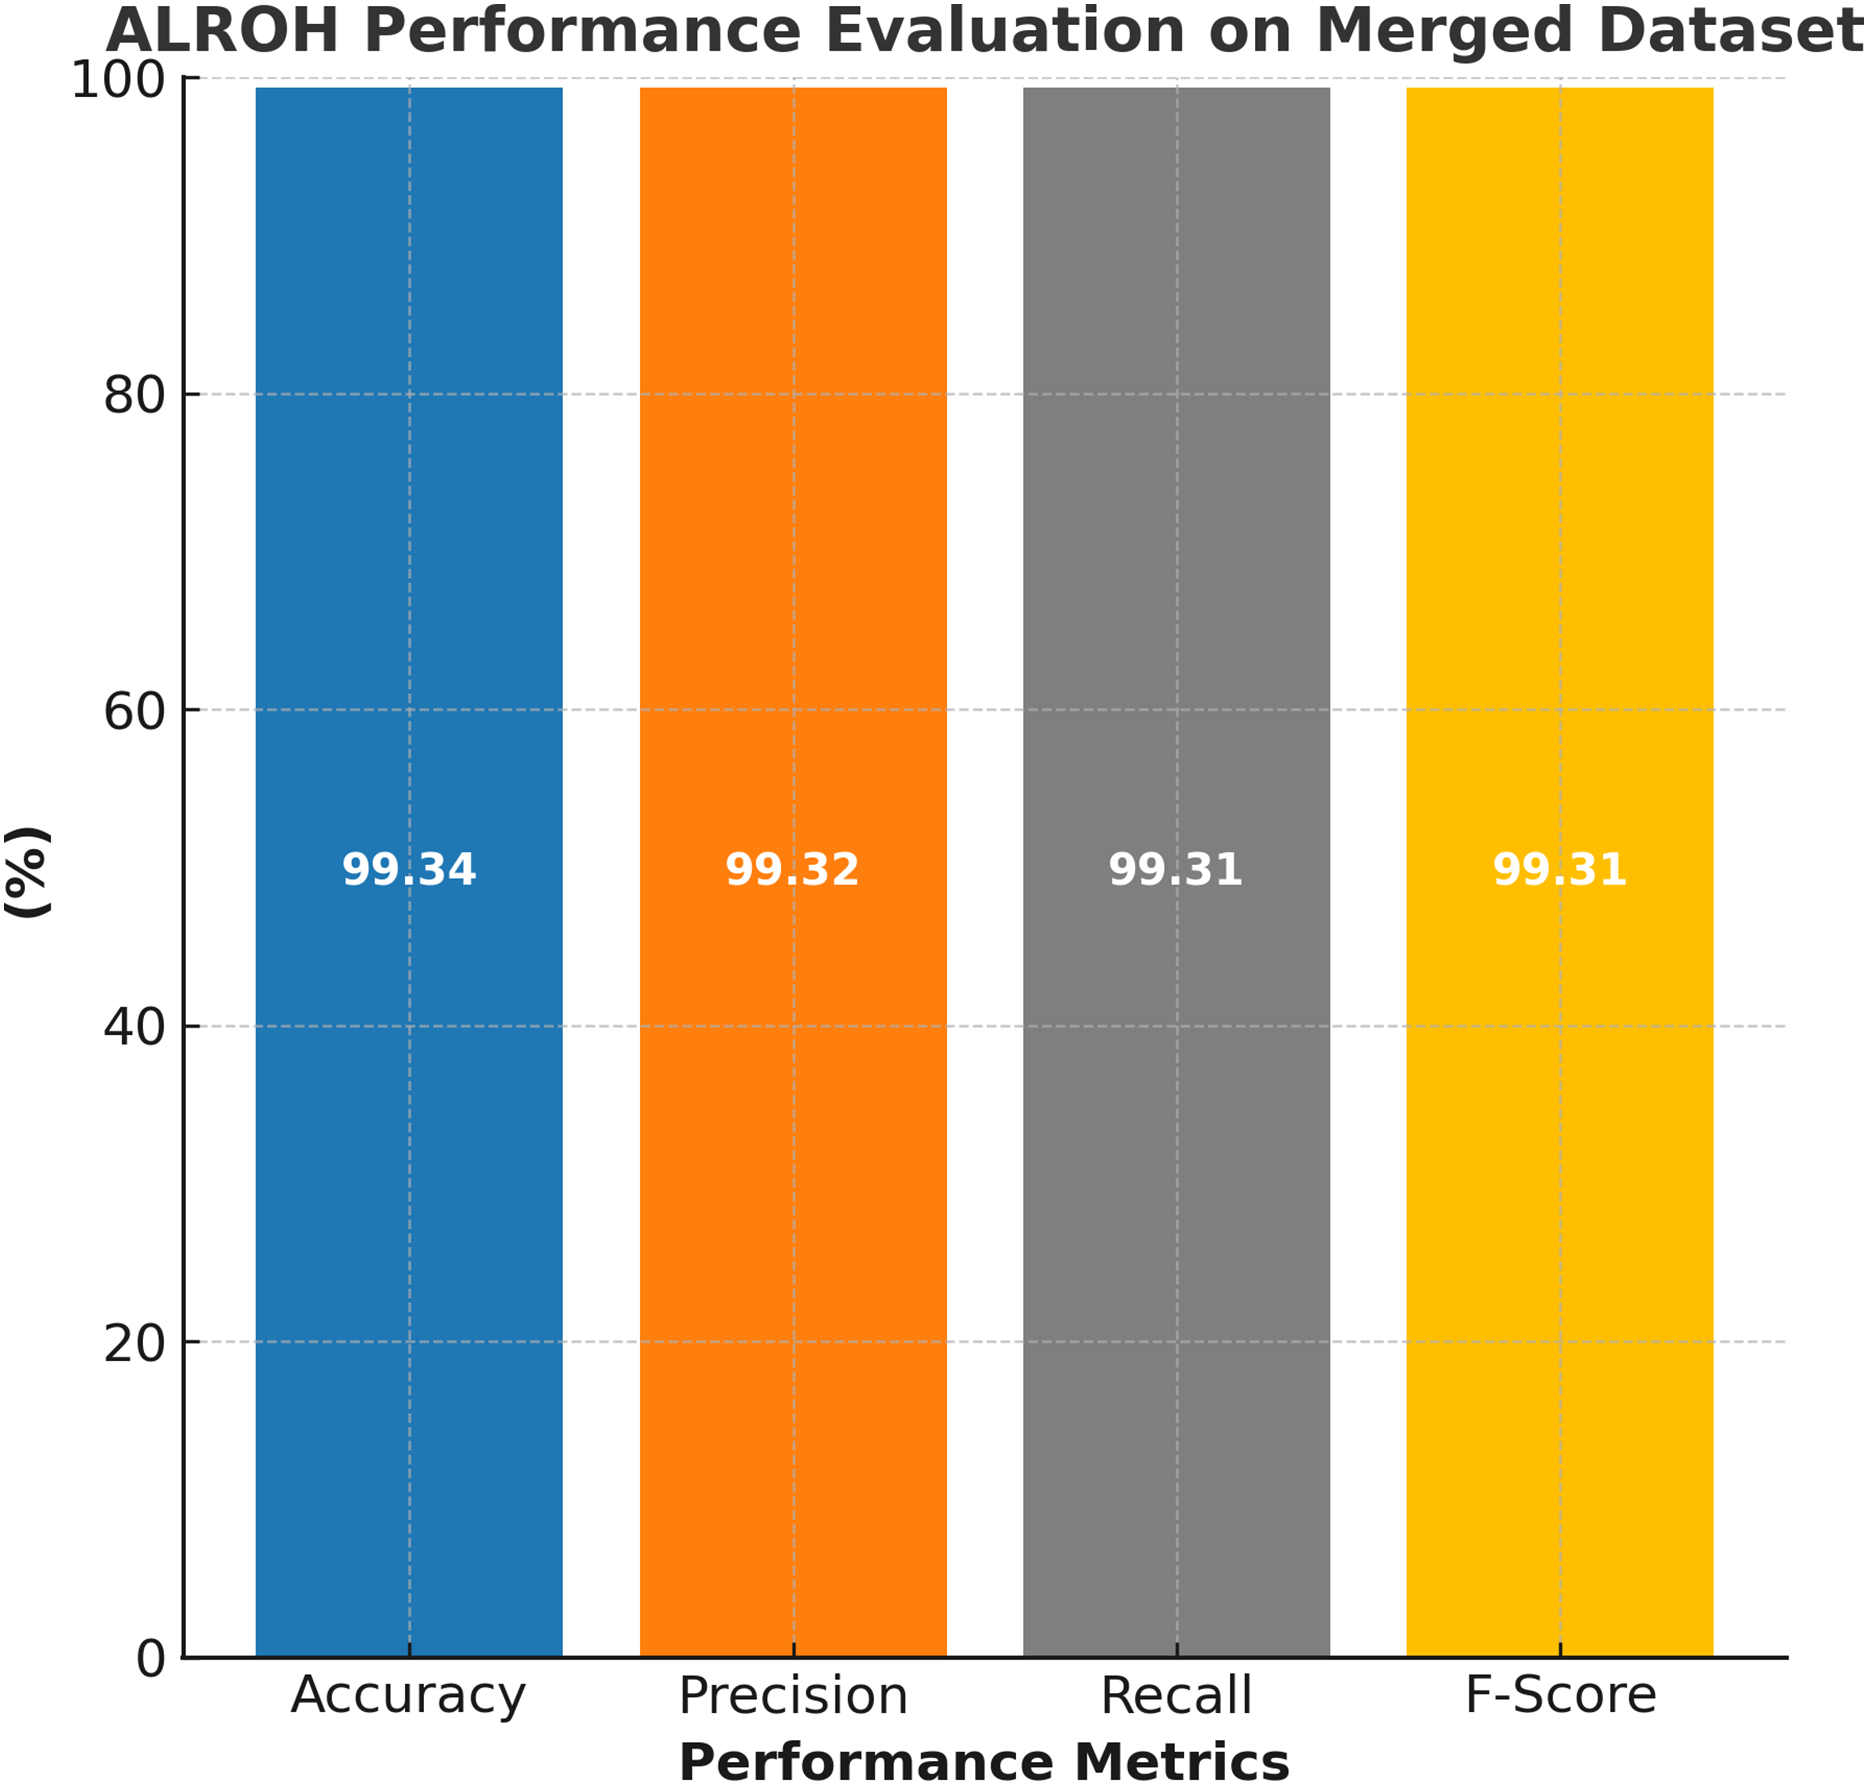
The performance evaluation of the ALROH model on the ASD merged dataset is presented in Fig. 7, highlighting its strong predictive capabilities across a diverse dataset that includes both children and toddlers. The ALROH model achieved 99.34% accuracy, demonstrating its ability to generalize well across different age groups and dataset variations. The 99.32% precision indicates the model’s efficiency in correctly identifying ASD cases while minimizing FPs. Furthermore, 99.31% recall reflects the model’s effectiveness in detecting ASD cases, ensuring that very few actual ASD cases are misclassified. The 99.31% F-score further validates the model’s balanced performance. These high-performance metrics indicate that ALROH can effectively handle larger and more diverse datasets, making it a promising tool for early ASD detection in both children and toddlers, thereby improving screening accuracy and facilitating timely interventions. Further, in the next section, the ALROH model is compared with existing approaches discussed in the literature survey.

Figure 7: Performance evaluation of ALROH model on ASD merged dataset.
Ablation study
To evaluate the contribution of each component in the ALROH model, an ablation study was conducted using the merged toddler dataset. The study assessed the model’s performance under four conditions: (1) ALROH without DFO, using standard gradient descent for optimization; (2) ALROH without LSTM, replacing it with a fully connected layer for prediction; (3) ALROH without CNN, using raw input features directly fed to LSTM; and (4) ALROH without FL, trained on a centralized dataset. The results, summarized in Table 2, demonstrate that the full ALROH model (with CNN, LSTM, DFO, and FL) achieved the highest accuracy (98.61%), precision (98.6%), recall (98.6%), and F-score (98.6%). Removing DFO reduced accuracy to 96.5%, indicating its role in optimizing hyperparameters. Replacing the LSTM with a fully connected layer decreased accuracy to 95.8%, highlighting the importance of the LSTM in capturing sequential patterns. Omitting CNN led to a significant drop in accuracy to 94.2%, underscoring its effectiveness in feature extraction. Finally, training without FL reduced accuracy to 97.1%, suggesting that FL enhances generalization through decentralized data. These findings confirm that each component is integral to ALROH’s superior performance.
| Model configuration | Accuracy (%) | Precision (%) | Recall (%) | F-score (%) |
|---|---|---|---|---|
| Full ALROH model | 98.61 | 98.6 | 98.6 | 98.6 |
| Without DFO | 96.5 | 96.4 | 96.5 | 96.4 |
| Without LSTM | 95.8 | 95.7 | 95.8 | 95.7 |
| Without CNN | 94.2 | 94.1 | 94.2 | 94.1 |
| Without FL | 97.1 | 97.0 | 97.1 | 97.0 |
Comparative study
This section discusses the results of the ALROH model and compares them with existing approaches. The results are compared in Table 3, which highlights the superiority of the proposed ALROH model over existing approaches. The ALROH model achieved 99.23% accuracy, outperforming previous models, including SVM (98%) from Farooq et al. (2023), RF (95.9%) from Pae & Pae (2024), L-R (96.23%) from Reghunathan et al. (2024), and LR (94.3%) from Bawa et al. (2024). Additionally, ALROH demonstrated significantly higher precision (99.23%), recall (99.21%), and F-score (99.22%), ensuring better overall performance in accurately predicting ASD cases. In contrast, the SVM model from Farooq et al. (2023) had 44% recall, indicating a high number of FNs, which is critical in ASD prediction as undiagnosed cases may not receive timely intervention. Similarly, while RF from Pae & Pae (2024) and LR from Reghunathan et al. (2024) yielded competitive results, their accuracy and recall values were lower than those of ALROH, suggesting a slightly reduced ability to classify ASD cases correctly. Furthermore, the LR model from Bawa et al. (2024) had the lowest accuracy (94.3%), making it the least effective among the compared approaches.
| Ref | Year | Model | Accuracy | Precision | Recall | F-score |
|---|---|---|---|---|---|---|
| Farooq et al. (2023) | 2023 | SVM | 98 | 92 | 44 | 60 |
| Pae & Pae (2024) | 2024 | RF | 95.9 | 95.8 | 95.8 | 95.8 |
| Reghunathan et al. (2024) | 2024 | L-R | 96.23 | 94.5 | 94.7 | 97.9 |
| Bawa et al. (2024) | 2024 | LR | 94.3 | 93.1 | 94.4 | 93.8 |
| Proposed | 2025 | ALROH | 99.23 | 99.23 | 99.21 | 99.22 |
Furthermore, the comparative study on the ASD toddler dataset is presented in Table 4, demonstrating the ALROH model’s effectiveness compared to other state-of-the-art approaches. The ALROH model achieved 99.36% accuracy, outperforming models such as QDA-PCA (94%) from Alshammari et al. (2024) and Stacked Model (99.14%) from Das et al. (2025), while showing competitive performance against CNN-LSTM-PSO (99.64%) from Priyadarshini (2023), RF-XGB (99%) from Hajjej et al. (2024), and XGB 2.0 (99%) from Aldrees et al. (2024). In addition to its high accuracy, ALROH also demonstrated better precision (99.32%), recall (99.33%), and F-score (99.34%), ensuring a balanced performance in ASD prediction. Notably, while CNN-LSTM-PSO from Priyadarshini (2023) achieved a slightly higher accuracy of 99.64%, its precision (96%), recall (94%), and F-score (91%) were significantly lower than those of ALROH, indicating that it had more false positives and false negatives. On the other hand, QDA-PCA from Alshammari et al. (2024) had the lowest accuracy (94%) and an F-score of only 87%, suggesting weaker overall predictive performance. Moreover, compared to RF-XGB from Hajjej et al. (2024) and XGB 2.0 from Aldrees et al. (2024), both of which achieved 99% accuracy, the ALROH model still performed better in terms of precision and recall, making it more reliable and effective for ASD prediction in toddlers. The Stacked Model from Das et al. (2025) combined multiple classifiers and achieved strong results (99.14% accuracy, 98.76% precision, 99.37% recall, and 99.07% F-score), but its computational complexity was significantly higher than that of ALROH.
| Ref | Year | Model | Accuracy | Precision | Recall | F-score |
|---|---|---|---|---|---|---|
| Priyadarshini (2023) | 2023 | CNN-LSTM-PSO | 99.64 | 96 | 94 | 91 |
| Hajjej et al. (2024) | 2024 | RF-XGB | 99 | 99 | 99 | 99 |
| Alshammari et al. (2024) | 2024 | QDA-PCA | 94 | 93 | 100 | 87 |
| Aldrees et al. (2024) | 2024 | XGB 2.0 | 99 | 98 | 99 | 99 |
| Das et al. (2025) | 2024 | Stacked | 99.14 | 98.76 | 99.37 | 99.07 |
| Proposed | 2025 | ALROH | 99.36 | 99.32 | 99.33 | 99.34 |
Practical Implications of Findings. ALROH’s superior performance is attributed to its hybrid DL framework, which integrates CNN for feature extraction, LSTM for sequential learning, and DFO for hyperparameter tuning. This combination enables better generalization and robustness in predicting ASD, making ALROH a highly efficient and effective model for early ASD detection in toddlers. Beyond achieving superior predictive performance, the results of ALROH carry important implications for practice. For parents, the availability of accurate and privacy-preserving screening tools may help raise early awareness of ASD-related behaviors, reducing delays in seeking professional evaluation and therapy. For teachers, the system can serve as a supportive decision-making aid, enabling early identification of students who may require differentiated instructional approaches or referrals to specialists. For school administrators and policymakers, ALROH demonstrates the feasibility of deploying federated learning frameworks that allow institutions to collaborate without compromising student privacy. This could guide the creation of national screening initiatives and inclusive education policies, ensuring equitable access to early interventions.
While the current datasets primarily focus on screening outcomes (ASD-positive or non-ASD), they do not include detailed socio-economic or clinical contexts, such as family education level, economic background, age stratification, or therapy history. Such variables could provide deeper insights into risk factors and strengthen the objectivity of ASD prediction frameworks. As part of future research, incorporating these variables into federated learning pipelines would allow models such as ALROH to capture both behavioral patterns and contextual risk factors, thus enhancing their relevance for educational planning and social policy design. In the next section, the conclusion, along with a detailed discussion of future work, is presented.
Conclusion
This work presented an ASD prediction model using a federated learning-based hybrid deep learning framework, the ALROH model. The primary objective was to improve ASD detection in children and toddlers while ensuring privacy preservation and addressing challenges such as class imbalance and small dataset sizes. The ALROH model integrated CNN for feature extraction, LSTM networks for sequential learning and prediction, and the DFO approach for hyperparameter optimization, thereby achieving consistent improvements over existing ASD predictive models. Specifically, for the ASD children dataset, ALROH achieved 99.23% accuracy, outperforming conventional models such as SVM, RF, and L-R. Similarly, for the ASD toddler dataset, ALROH surpassed CNN-LSTM-PSO, RF-XGB, XGB 2.0, and stacked models, attaining an accuracy of 99.36%. The results confirm ALROH as a highly accurate and efficient model for ASD detection, while also highlighting the critical role of federated learning in the privacy-preserving collection and training of ASD data across multiple institutions. Unlike traditional centralized learning, FL enables collaborative knowledge sharing without exposing sensitive child health data. However, this study also acknowledges certain limitations. A significant challenge remains the collection of sufficiently large and representative datasets, as well as ensuring the accuracy and reliability of multi-institutional data. Furthermore, collaborative learning among different schools introduces issues of interoperability, communication overhead, and network security, all of which are crucial when handling sensitive behavioral and medical data of children. Looking ahead, several research perspectives can further strengthen this work. Future research will focus on measuring the impact of network performance parameters, such as bandwidth, edge–cloud communication time, and aggregation delays, on FL-based ASD screening systems. Also, the work may consider incorporating passive sensing devices (e.g., smartwatches, speech monitors, or environmental cameras) to enable richer, multi-sensory ASD detection. Enhancing the FL framework with blockchain or advanced encryption mechanisms could address confidentiality and security concerns in data sharing across school networks. Additionally, integrating FL with scalable cloud–edge infrastructures would improve computational efficiency, real-time model updates, and deployment feasibility at a larger scale. By addressing these limitations and extending FL capabilities, future research can pave the way for a secure, scalable, and more inclusive early ASD prediction system.