
Economic insights into credit risk: a deep learning model for predicting loan repayment capacity
- Published
- Accepted
- Received
- Academic Editor
- Trang Do
- Subject Areas
- Artificial Intelligence, Data Mining and Machine Learning, Data Science, Social Computing, Neural Networks
- Keywords
- Credit risk assessment, Loan repayment prediction, Deep learning, Gated transformer, Attention mechanism
- Copyright
- © 2025 Qiu et al.
- Licence
- This is an open access article distributed under the terms of the Creative Commons Attribution License, which permits unrestricted use, distribution, reproduction and adaptation in any medium and for any purpose provided that it is properly attributed. For attribution, the original author(s), title, publication source (PeerJ Computer Science) and either DOI or URL of the article must be cited.
- Cite this article
- 2025. Economic insights into credit risk: a deep learning model for predicting loan repayment capacity. PeerJ Computer Science 11:e3339 https://doi.org/10.7717/peerj-cs.3339
Abstract
Accurately predicting loan repayment capacity is critical to effective credit risk assessment in banking, finance, and economic policymaking. This study proposes a novel deep learning architecture, the Gated Transformer, designed specifically for structured credit data. The model integrates categorical and numerical features into a unified latent space and employs multi-head self-attention combined with a token-wise gating mechanism to dynamically capture complex feature interactions while enhancing interpretability. Experiments conducted on the LendingClub dataset demonstrate that the proposed model achieves strong predictive performance, with an accuracy of 92.38%, an area under the receiver operating characteristic curve (AUROC) of 0.8517, and an area under the precision-recall curve (AUPRC) of 0.9213. Further robustness tests across multiple random seeds confirm the model’s stability. These findings underscore the model’s effectiveness in handling heterogeneous financial data and its potential to support responsible, data-driven credit risk evaluation.
Introduction
Predicting loan repayment capacity is a critical issue in financial management, particularly in corporate financial management. A borrower’s ability to repay a loan is influenced by a multitude of factors, including socioeconomic, educational, behavioral elements, and others. These factors vary significantly depending on the context and type of enterprise or business activity. Numerous studies in the academic literature have explored these aspects, contributing to the development of models that aim to more accurately predict repayment capacity.
Specifically, several socioeconomic factors have been found to impact loan repayment capacity. For example, age, education level, marital status, and household characteristics were identified as significant factors influencing the repayment behavior of microfinance clients in Ethiopia. Older borrowers generally demonstrated better repayment capacity due to accumulated experience and more stable sources of income (Abdulahi, Charkos & Haji, 2022). Moreover, household size was found to have a negative impact on repayment ability, suggesting that larger families may have more strained financial resources (Ojiako, 2012). A similar pattern was also observed in studies on cooperative farmers, where factors such as net farm income and the number of years of cooperative membership positively correlated with repayment capacity, while age and level of education showed negative influences (Ilavbarhe, Alufohai & Keyagha, 2017).
In the business environment, income diversification is considered a key factor in enhancing loan repayment capacity. For instance, multiple income streams from both agricultural and non-agricultural activities can serve as a financial buffer against shocks, thereby improving borrowers’ ability to adhere to repayment schedules. For example, the study by Okonta, Achoja & Okuma (2023) on poultry, fish, and arable crop farmers in Nigeria demonstrated a clear hierarchy in repayment capacity based on income diversity and the effectiveness of management practices. Microfinance institutions also emphasize the importance of integrating credit assessment mechanisms to evaluate a borrower’s financial health, particularly their ability to generate stable cash flows from multiple income sources (Okero & Waweru, 2023). Credit risk assessment is another crucial factor in predicting loan repayment, involving an evaluation of the borrower’s credit history and financial condition, typically reflected in credit scores obtained from credit reference bureaus (Okero & Waweru, 2023). A systematic evaluation of these elements enables better insight into default likelihood, allowing financial institutions to adjust their lending strategies accordingly.
Computer-based models employing advanced statistical methods, such as logistic regression and machine learning algorithms, have also been applied to improve the accuracy of loan repayment prediction (Abdulahi, Charkos & Haji, 2022). Large-scale modelling has also proven effective for policy-relevant forecasting in other domains, reinforcing the importance of principled model design and validation for risk prediction (Nguyen et al., 2021). Cultural and institutional contexts also significantly shape repayment behavior. The influence of social capital and group lending models has been recognized as instrumental in facilitating repayment success. In Indonesia, community lending models involving collaborative participation among borrowers showed higher repayment rates, largely due to social pressure from group members to fulfill loan obligations (Indriani et al., 2023; Abdirashid & Jagongo, 2019). Additionally, geographical and economic conditions, including credit accessibility, also play a vital role in assessing repayment capacity within microfinance frameworks (Dang et al., 2022; Enimu, Eyo & Ajah, 2017).
In a comparative analysis of different contexts, subtle differences in repayment performance between cooperative members and microfinance beneficiaries highlight the importance of contextual adaptation in financial decision-making (Gudde Jote, 2018). Studies show that when institutions adjust loan terms based on local practices and borrower histories, repayment rates can improve significantly, emphasizing the need for tailored approaches in lending strategies. Moreover, mechanisms for monitoring loan repayments also play a key role in predicting and enhancing repayment capacity. Flexible repayment schedules, as opposed to rigid ones, can facilitate better compliance with repayment obligations. The study by Field & Pande (2008) indicates that while repayment frequency itself may not significantly affect default rates, flexibility in scheduling can promote more sustainable financial behavior. Furthermore, promoting financial literacy among borrowers has been shown to improve their ability to manage loans effectively, leading to better repayment outcomes (Kariuki & Namusonge, 2024).
With increasing demand for credit risk assessment, we propose a deep learning-based approach that integrates diverse information such as socioeconomic characteristics, credit history, behavioral factors, and income structure to provide more accurate predictions of loan repayment capacity. Our design is informed by advances in multimodal representation learning, e.g., unified frameworks that couple sequence encodings with predicted structural views via contrastive objectives to boost generalization (Nguyen et al., 2024), and we analogously integrate heterogeneous borrower signals (demographics, credit history, behavioural traces) within a single architecture. The proposed model not only contributes academically by offering deeper insights into borrower behavior, but also has strong practical value in supporting financial institutions to build more precise and context-adaptive credit risk assessment systems. This represents an important step toward developing sustainable lending strategies, minimizing credit risk, and promoting long-term financial stability.
Beyond its academic contributions, this study also carries significant practical implications. For commercial banks and credit institutions, a more accurate prediction of loan repayment capacity enables the development of risk-sensitive lending policies, reducing default rates and improving portfolio quality. By integrating diverse borrower information into a unified predictive framework, financial institutions can refine credit scoring systems, tailor loan products to specific client segments, and design more flexible repayment plans that align with borrower conditions. Furthermore, in the broader context of financial risk management, such predictive models help institutions comply with regulatory requirements, strengthen early-warning mechanisms, and enhance resilience against systemic risks, thereby fostering a more sustainable and inclusive financial ecosystem.
Related work
The rapidly growing field of machine learning and deep learning has witnessed numerous important applications in predicting loan repayment capacity. Recent studies emphasize the effectiveness of various algorithms in enhancing prediction accuracy, thereby improving decision-making processes in loan approvals. In 2022, a prominent study by Abdulahi, Charkos & Haji (2022) demonstrated that the implementation of machine learning techniques, particularly the Random Forest algorithm, significantly improved the accuracy of predicting the repayment capability of small and medium-sized enterprises in Malaysian financial institutions. This aligns with the findings of Addo, Guegan & Hassani (2018), who asserted that machine learning and deep learning models have considerably enhanced the credit risk analysis framework through advanced data-driven predictive capabilities. The integration of these models has enabled the effective utilization of large datasets, allowing for more accurate assessments of default probabilities compared to traditional methods. Furthermore, the study by Wu (2022) highlights the increasing reliance of banks on machine learning to improve both the speed and accuracy of default predictions, signaling a pivotal shift from manual evaluations to automated systems. In 2023, Jumaa, Saqib & Attar (2023) emphasized the potential of deep learning methods in refining credit risk assessment frameworks, asserting that consumer loan default prediction models developed using these techniques deliver higher accuracy and better identification of borrower risks. For example, research by Liu et al. (2023) demonstrated that Bayesian deep learning can significantly enhance predictive outcomes by identifying subtle variations in default indicators—factors that are critical for lenders. The optimal application of different machine learning models is also discussed by Zhou (2023), who compared the performance of models such as Logistic Regression, Decision Trees, and XGBoost, thereby illustrating their capabilities in contextualizing borrowers’ asset values and financial conditions.
Additionally, alternative approaches have emerged in recent literature. For instance, Netzer, Lemaire & Herzenstein (2019) focused on textual analysis of loan applications, showing that qualitative insights extracted from applicants’ textual data can substantially enhance the assessment of repayment behavior. This innovative intersection between natural language processing and financial forecasting reflects a trend of complementing traditional numerical analysis with qualitative indicators, providing a more holistic view of borrower risk. Similarly, Kvamme et al. (2018) integrated diverse methodological frameworks, employing convolutional neural networks (CNNs) to predict mortgage defaults with impressive results, showcasing the flexibility of deep learning models in handling complex datasets. The study by Xu, Lu & Xie (2021) on P2P lending emphasized the benefits of using machine learning methods in assessing repayment risks, effectively leveraging robust datasets to fine-tune prediction criteria. As the field continues to advance, blending machine learning with deep learning appears to be an emerging trend. For instance, Li, Tian & Zhuo (2023) explored blended models to improve the accuracy and stability of credit default predictions. Interest in ensemble methods is also on the rise, with (Hamori et al., 2018) comparing ensemble learning methods with various neural network architectures. Their results indicate that although deep learning provides advanced predictive capabilities, ensemble methods like Random Forest still offer competitive accuracy and reliability. Such integrated approaches demonstrate how traditional algorithms can be enhanced by modern technologies, providing financial institutions with more powerful toolsets for predicting repayment capacity.
In practical applications, the research by Bature et al. (2023) illustrates the development of a credit default prediction system using machine learning, clearly showing how theoretical models can be operationalized into useful applications for financial institutions. This transition from model to real-world implementation is crucial, reflecting the growing trend of applying advanced analytics in day-to-day lending processes. However, challenges remain. The need for more robust feature extraction techniques in deep learning, as discussed by Aniceto, Barboza & Kimura (2020), highlights the inherent complexity of credit data. This complexity calls for ongoing research and innovation in feature selection and extraction as fundamental components in the development of reliable predictive models. As the landscape of credit risk assessment continues to evolve, deepening the integration of machine learning and deep learning technologies holds great promise for achieving higher predictive accuracy in loan repayment forecasting. Studies by Turiel & Aste (2019) recognize the potential of AI-based models to recalibrate lending practices, underscoring the importance of technological adaptation in modern financial services.
Material and methodology
Data description and pre-processing
We utilized a dataset from LendingClub (https://www.kaggle.com/datasets/jeandedieunyandwi/lending-club-dataset), which includes both approved and rejected loan applications. This dataset serves as a valuable resource for analyzing credit risk and predicting loan repayment behavior. It contains borrower demographic information, loan characteristics, and creditworthiness indicators such as FICO scores. Key features include loan amount, interest rate, loan term, borrower income, debt-to-income ratio, FICO score, loan purpose, and repayment status. This dataset supports various tasks such as credit risk modeling, loan approval prediction, and economic behavior analysis.
Given the complexity of the original data, we applied several preprocessing techniques before using it for model training and evaluation:
Feature integration: The original data sources consisted of multiple files containing complementary information. We merged these sources into a single dataset by matching records using a unique borrower identifier.
Handling missing and invalid values: The dataset contained a significant number of missing values (NaN) and invalid entries (e.g., abnormally large values). Missing values were imputed using the mean of the respective feature. For invalid entries, we applied a filtering strategy: if more than 30% of the records in a feature were invalid, the feature was discarded; otherwise, only the affected rows were removed.
After analyzing the processed dataset, we observed an imbalance between negative and positive labels. The number of data points with negative labels was significantly higher than those with positive labels. There are many potential issues and risks associated with using an imbalanced dataset. If we train a classifier on such data, the model may classify all minority class instances as belonging to the majority class, potentially resulting in high test accuracy. However, such a model could be meaningless, as it would lack the ability to recognize samples from the minority class.
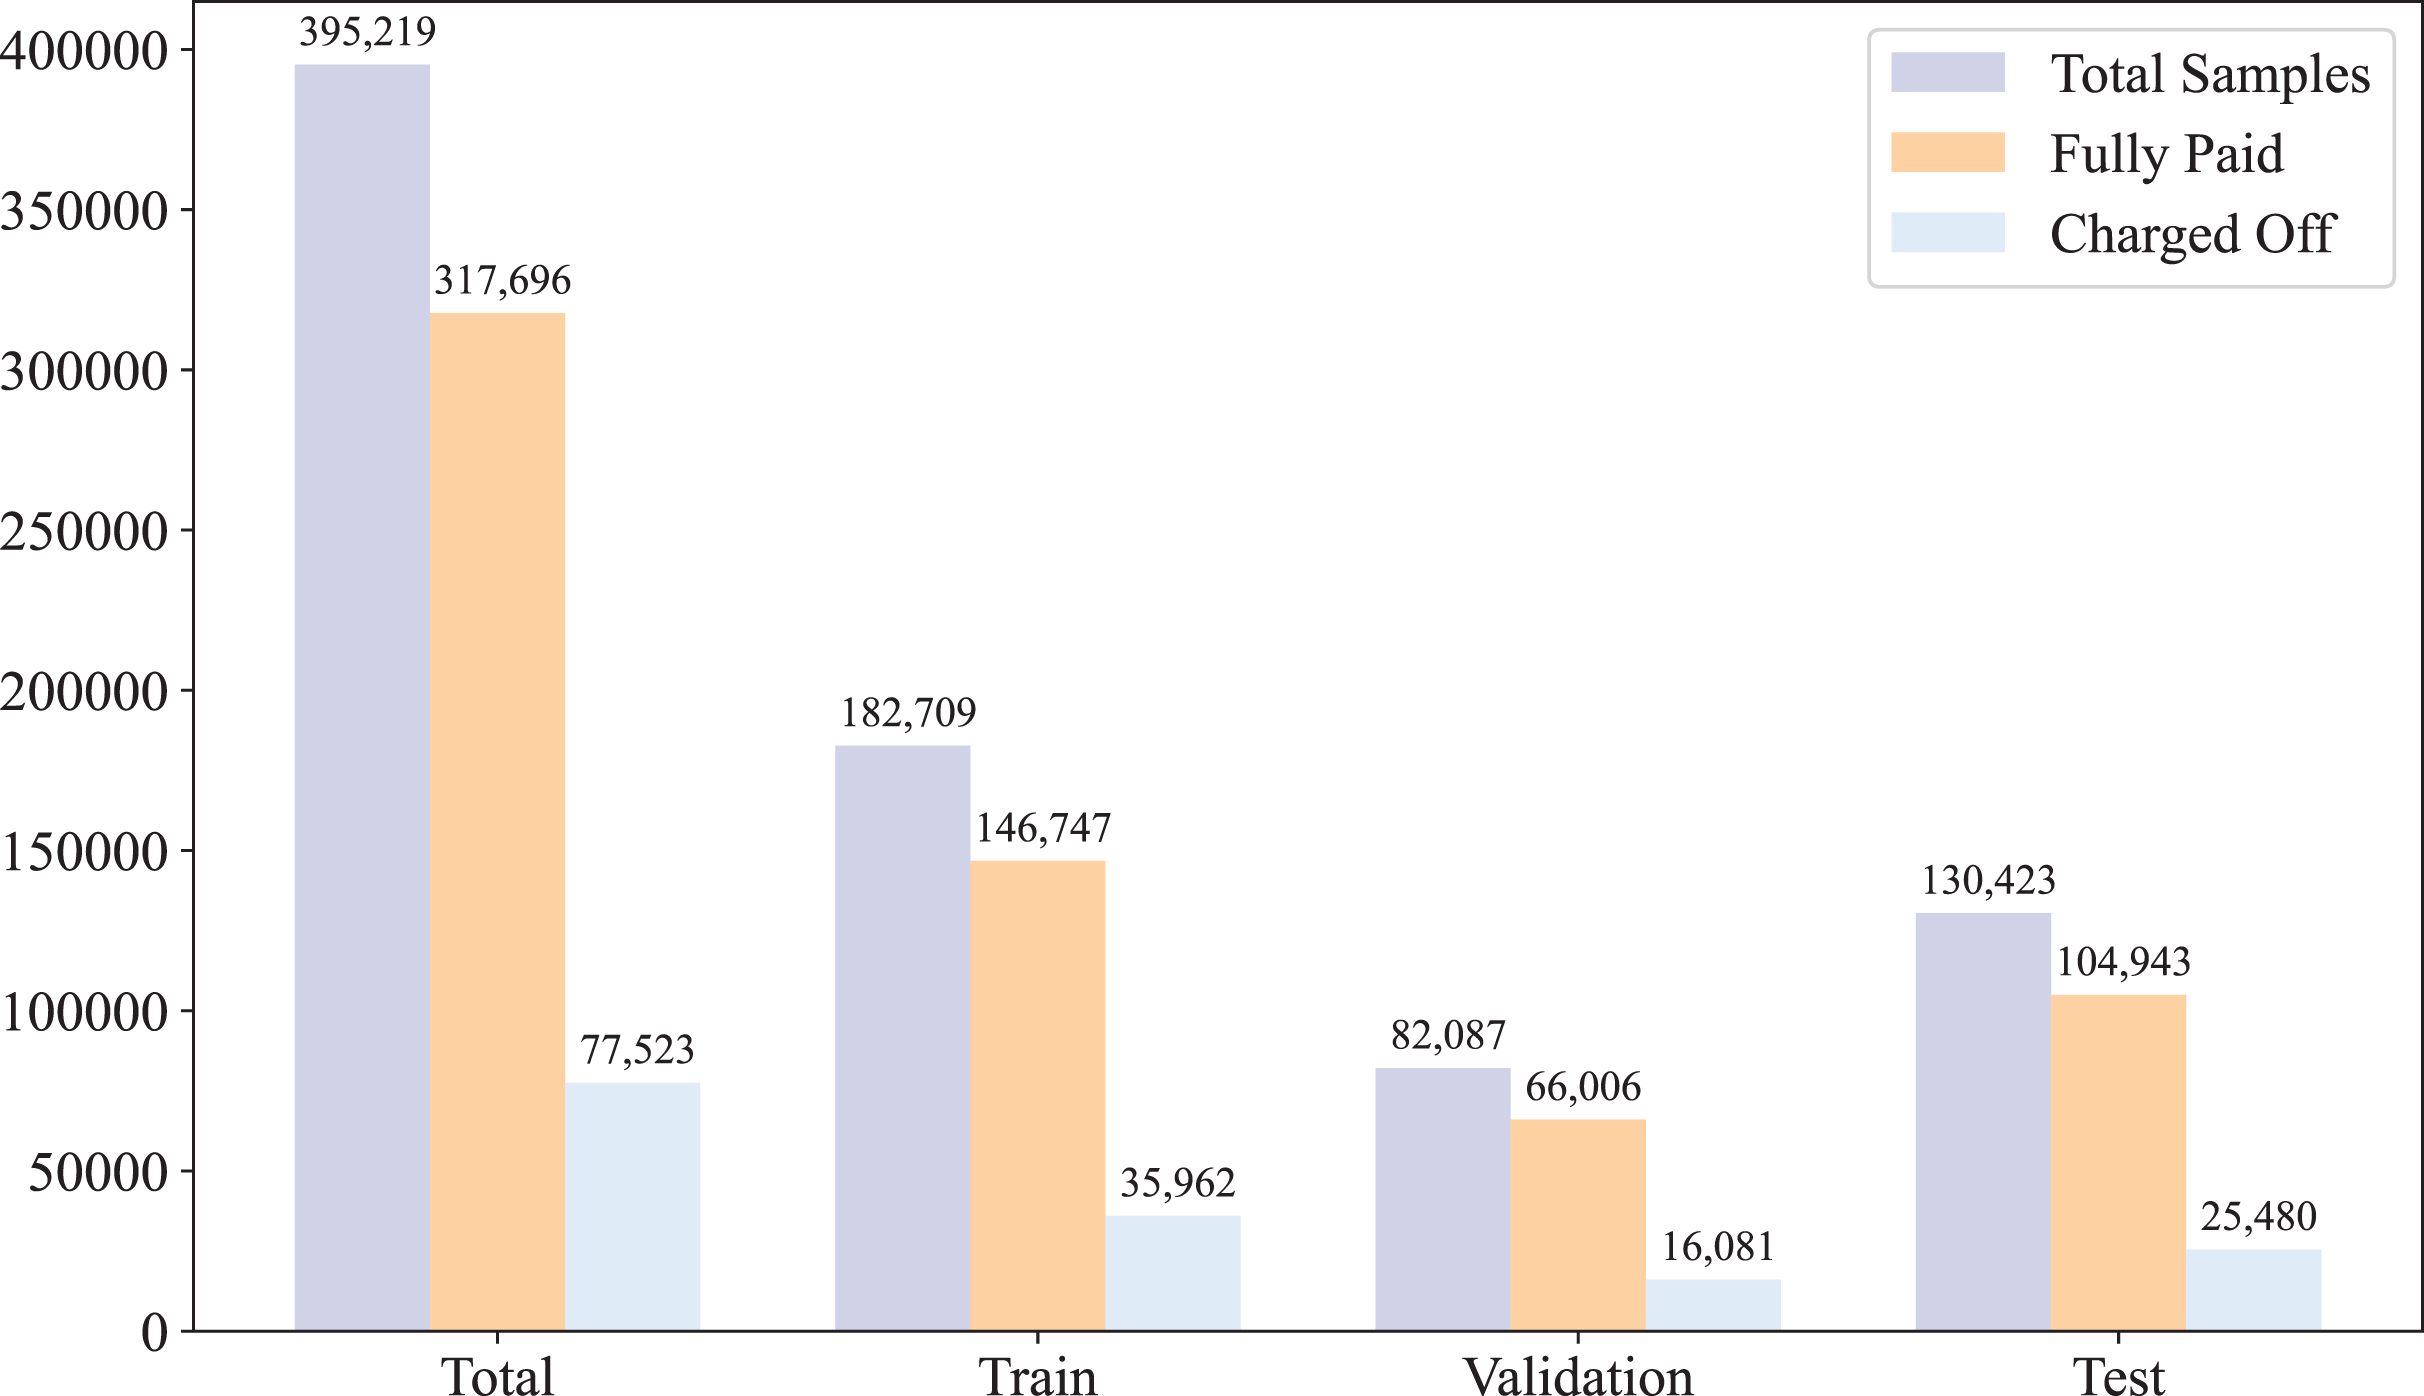
After preprocessing the data, we randomly split the dataset into three subsets: training, validation, and test, with respective ratios of 0.6, 0.1, and 0.3. The purpose of this split is to train the model effectively while ensuring reliable evaluation and tuning. The training set is used to fit the model parameters, the validation set is used to optimize hyperparameters and prevent overfitting, and the test set is used to assess the final performance of the model on unseen data. The statistical distribution of the dataset across these subsets is illustrated in Fig. 1.
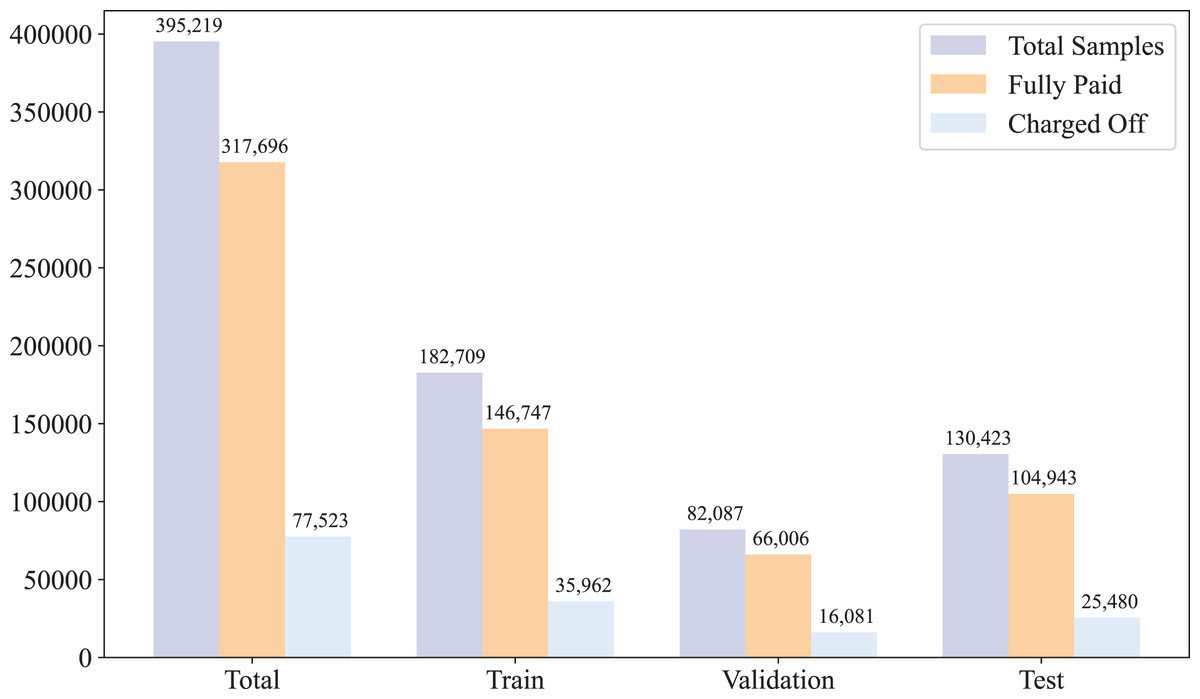
Figure 1: Data distribution.
Motivation behind model architecture
The task of predicting loan repayment capacity involves analyzing heterogeneous tabular data composed of both categorical and numerical features with complex interdependencies. Despite these advances, prior research still exhibits several important limitations. Most existing studies predominantly focus on applying conventional machine learning or deep learning models such as Random Forests, eXtreme gradient boosting (XGBoost), CNNs, or ensemble methods, which often require extensive feature engineering and are limited in capturing complex cross-feature dependencies inherent in tabular credit data. While some works explore innovative directions, such as textual analysis or blended modeling, they generally do not address the challenge of simultaneously integrating heterogeneous feature types within a unified framework. Moreover, the interpretability of deep learning approaches remains underexplored, restricting their adoption in regulatory and high-stakes financial contexts. These gaps motivate the design of our Gated Transformer architecture, which aims to not only achieve high predictive performance but also enhance transparency and adaptability across diverse real-world credit datasets.
We select the proposed Gated Transformer architecture due to its inherent ability to model interactions among diverse feature types via multi-head self-attention mechanisms. Unlike conventional models, the Transformer-based approach processes features in a contextual manner, dynamically weighting their contributions based on learned dependencies. Furthermore, the introduction of a token-wise gating mechanism enhances interpretability and allows the model to selectively emphasize relevant features, which is crucial for economic applications where understanding feature importance is key. This architecture also effectively integrates categorical embeddings and normalized numerical inputs within a unified latent space, facilitating end-to-end learning without extensive preprocessing. Overall, the Gated Transformer provides a flexible and powerful framework to extract meaningful economic insights from complex credit data, improving predictive performance while maintaining interpretability necessary for responsible financial decision-making.
Proposed architecture
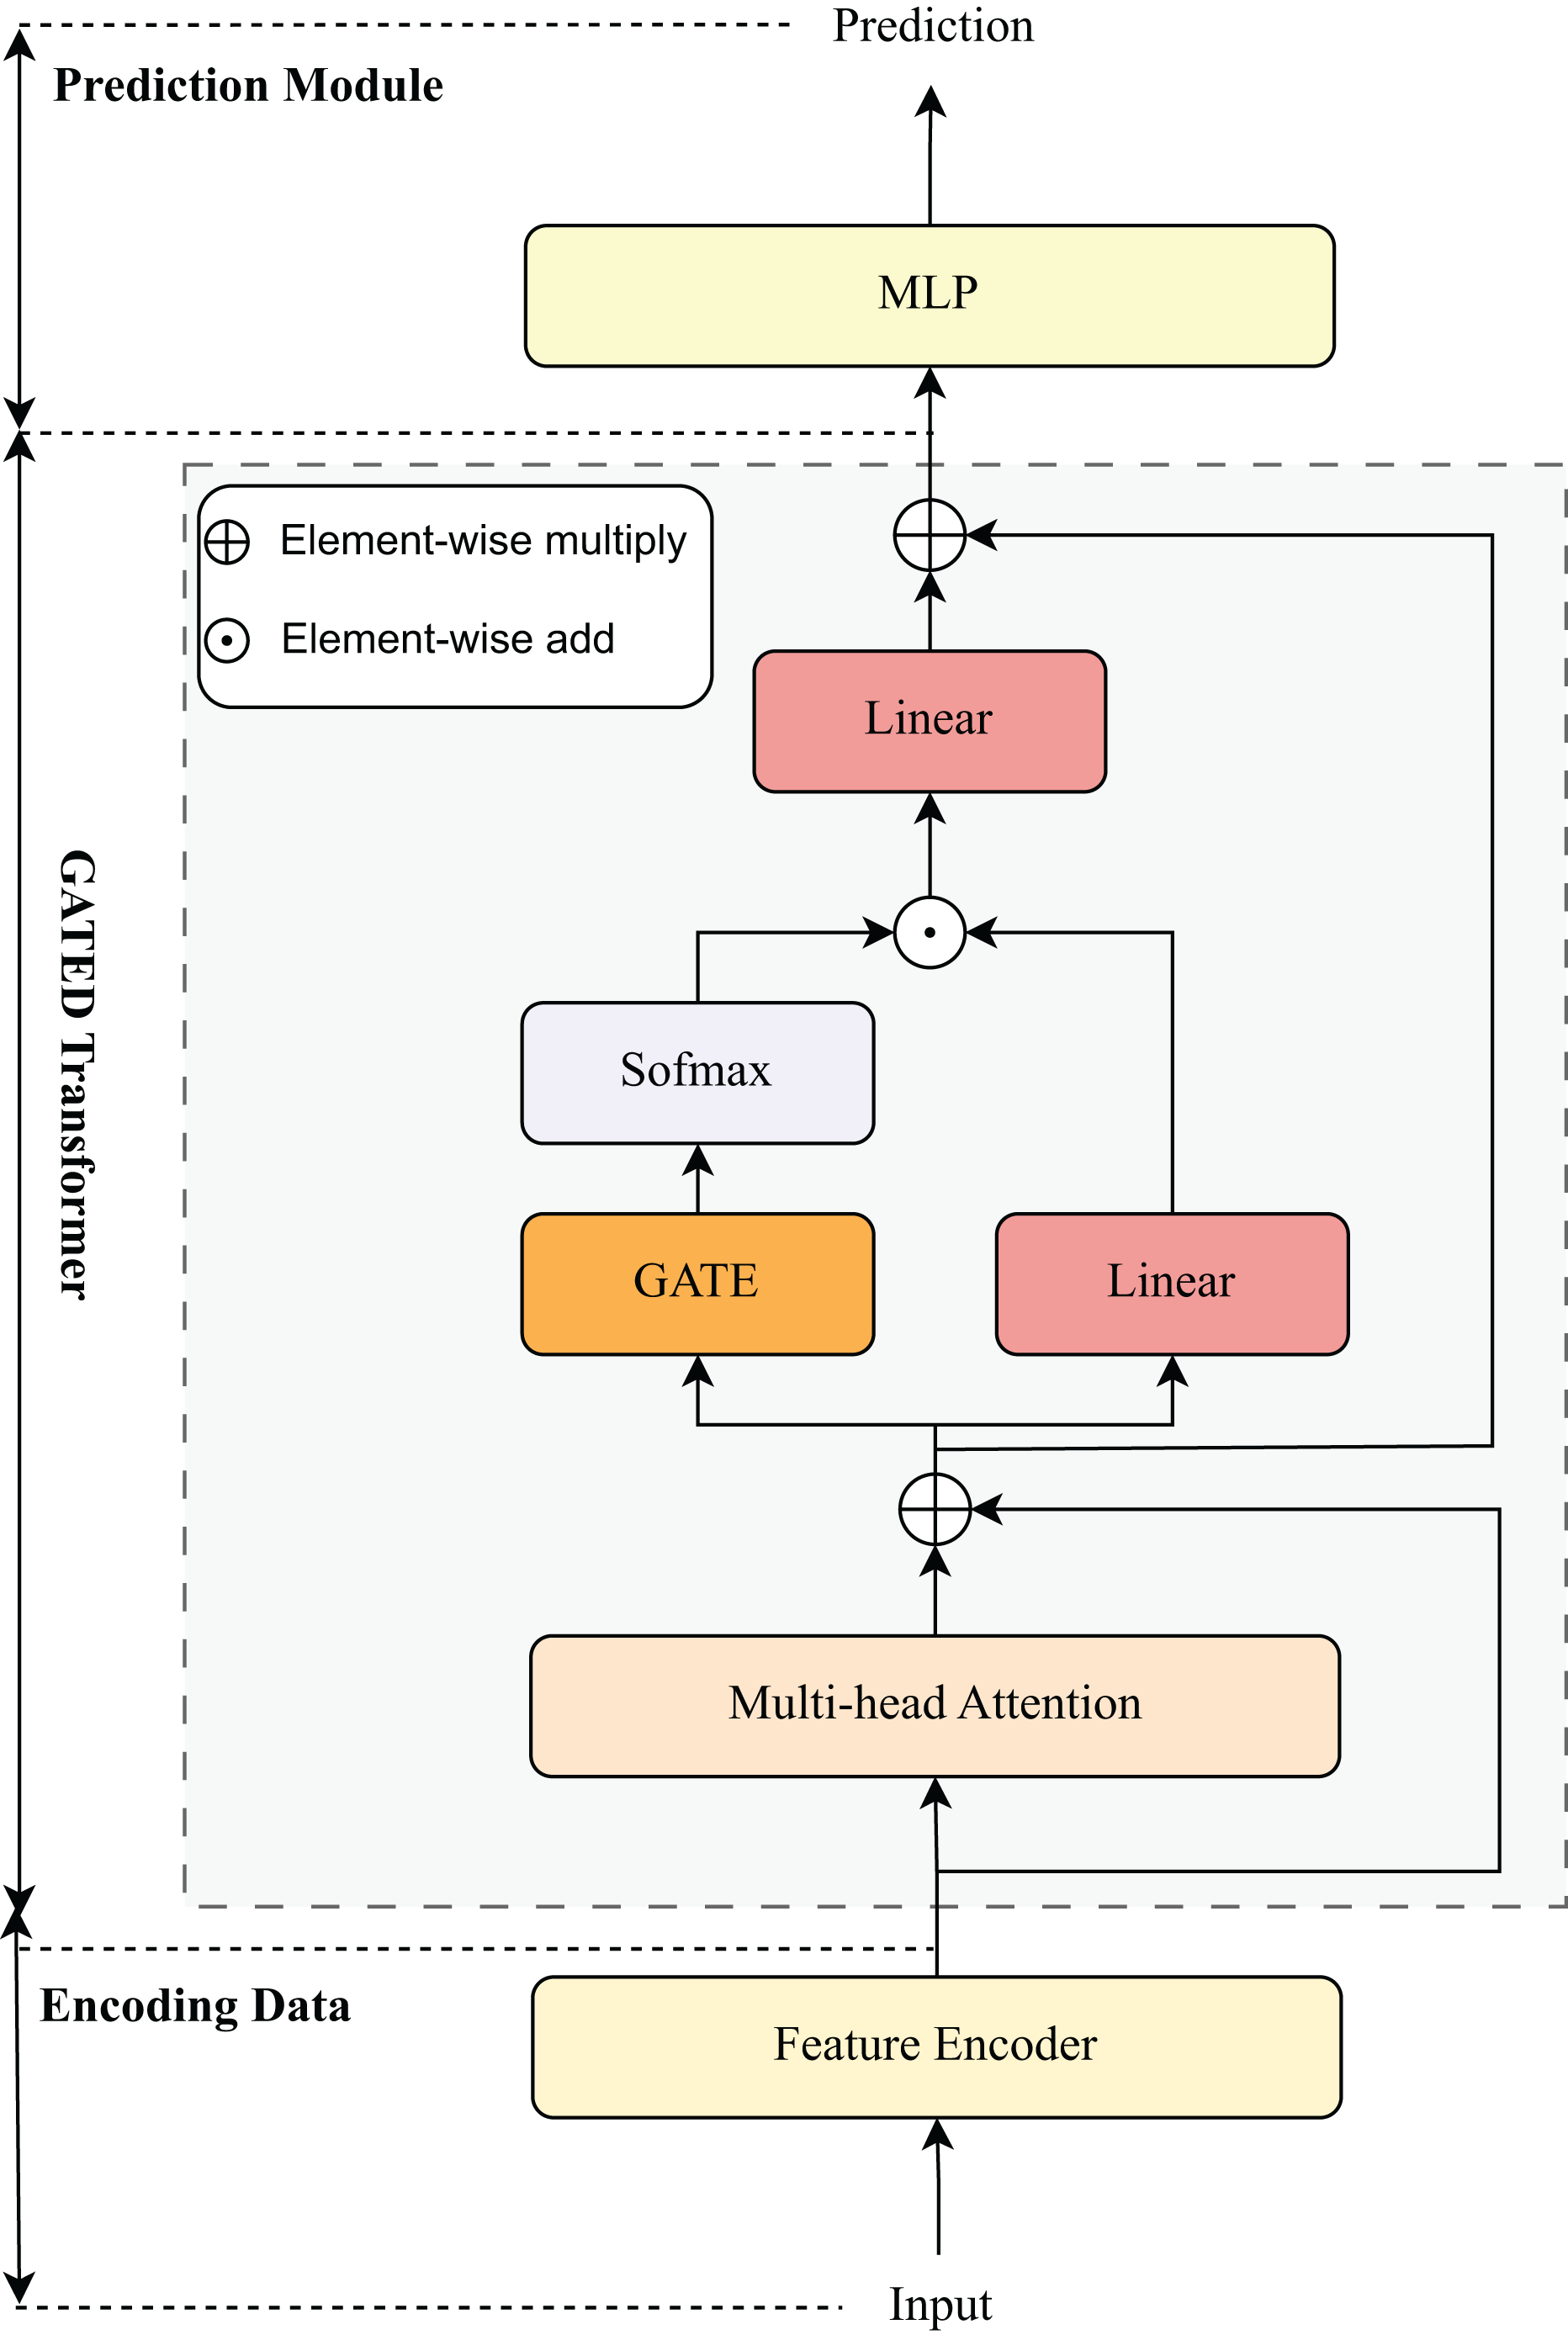
Our proposed method is a Transformer-based architecture tailored for tabular data, consisting of three main stages: Feature Encoding and Gated Transformer Processing and Prediction Module, as illustrated in Fig. 2. The design effectively integrates both categorical and numerical features into a unified embedding space and leverages gated self-attention mechanisms to capture complex feature interactions.
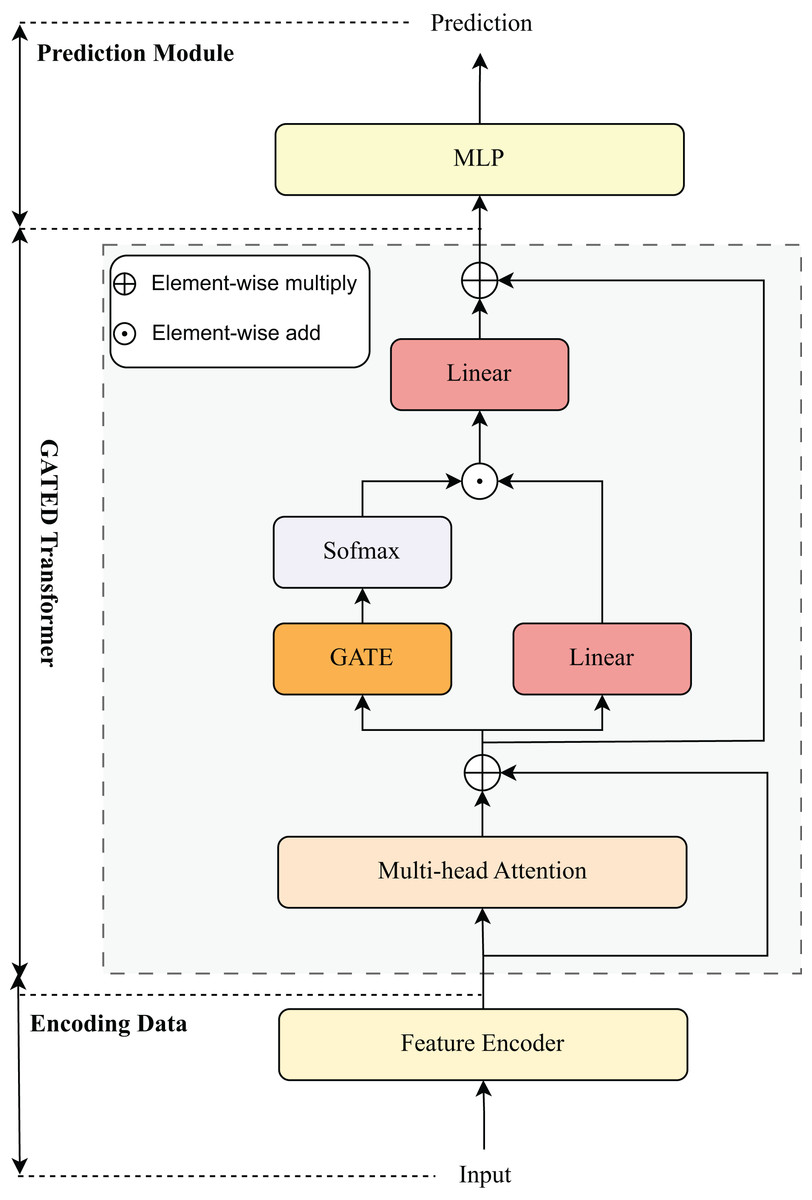
Figure 2: Model architecture visualization.
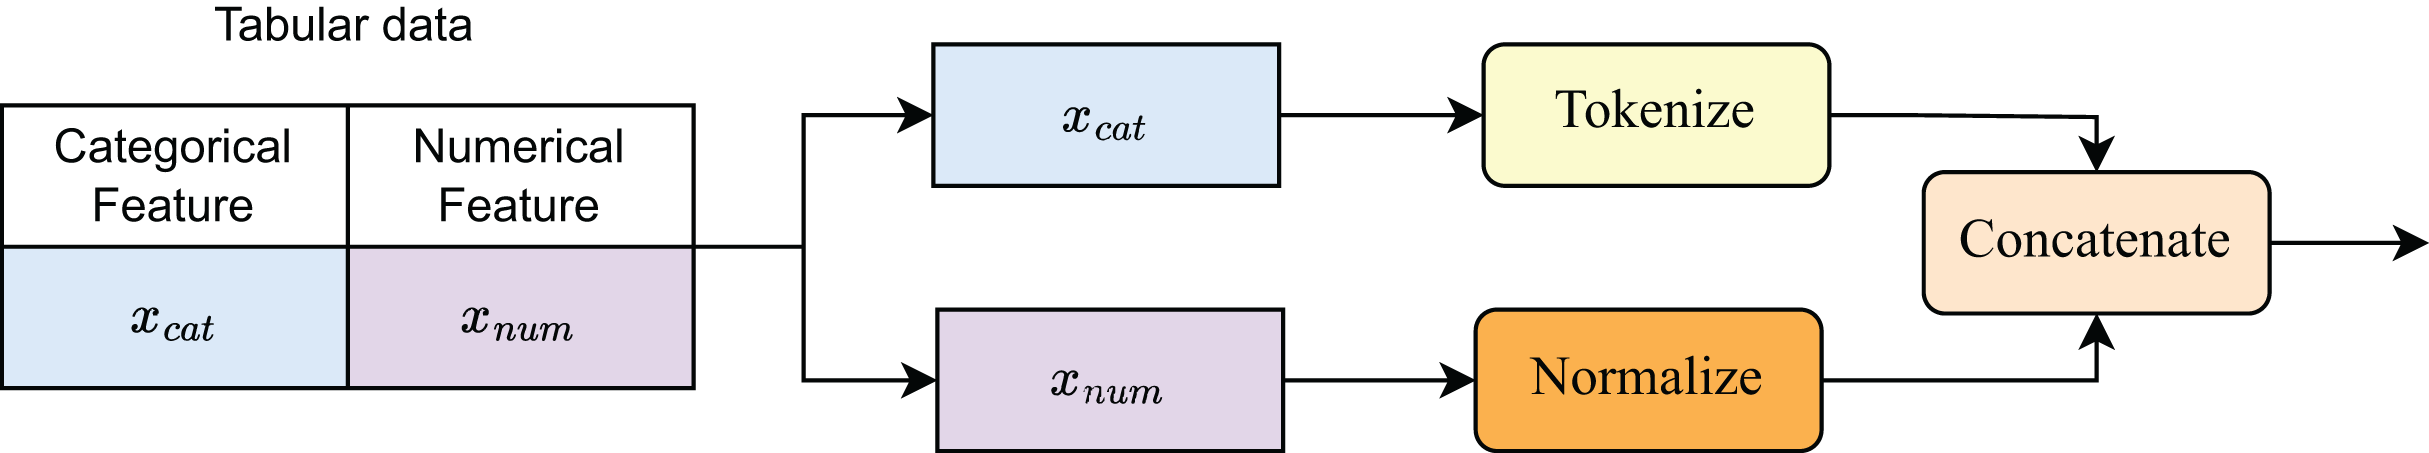
Encoding data
To encode the data before training the model, we construct a processing block called the Feature Encoder. Figure 3 illustrates the data encoding process. Categorical features are tokenized and mapped to embedding vectors via an embedding table:
(1)
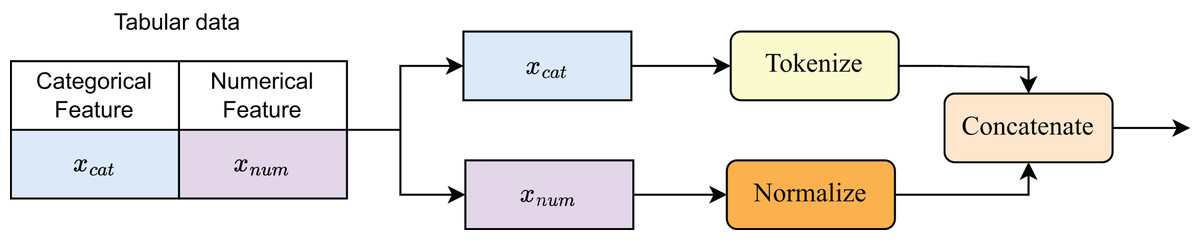
Figure 3: Details of feature encoder.
Numerical features , typically scalars or low-dimensional vectors, are first normalized and then projected into the embedding space through a shared linear layer:
(2)
All features are then combined via concatenation, along with a special embedding token :
(3) where is the number of categorical features, and is the number of numerical features.
Gated transformers
The Gated Transformer is a variant of the Transformer (Vaswani et al., 2017) architecture originally introduced in the field of natural language processing. It is modified and fine-tuned to better suit the characteristics of tabular data features. The Gated Transformer consists of two main components: multi-head self-attention layers and gated feedforward layers. The input representation Z is first processed by a multi-head self-attention mechanism to capture interactions among features:
(4) where
(5) Here, Z = E corresponds to the input embedding of tabular data described in Section Encoding Data, is the output projection matrix, and are the learnable projection matrices for the -th attention head. The attention output is then modulated by a token-wise gating mechanism. Specifically, a gating vector is computed as:
(6) where denotes the sigmoid function, is a learnable parameter, and controls the activation strength of each token embedding. The gated output is then passed through two linear projections and combined as follows:
(7) where denotes element-wise multiplication, and indicates residual addition. The resulting output serves as the input for the MLP layer.
Experimental setup
Traditional ML models
We explore various machine learning models to predict borrower repayment abilities. The machine learning algorithms considered include Logistic Regression, Random Forests, Naive Bayes, Light Gradient Boosting Machine (LightGBM), Neural Networks, K-Nearest Neighbors (KNN), and XGBoost. Some of these models are used in previous studies, while others were selected based on their potential performance. We provide justifications for selecting these algorithms and will present initial experimental results.
• Random Forests (Breiman, 2001) are ensemble learning methods particularly suited for handling imbalanced datasets. By aggregating predictions from a large number of randomized decision trees, Random Forests reduce model variance and mitigate overfitting. The final prediction is made through majority voting (classification) or averaging (regression), formally expressed as: (8)
• Naive Bayes (Webb, 2011), in contrast, adopts a probabilistic and generative perspective. Assuming conditional independence among features given the class label, it models the joint probability distribution . According to Bayes’ theorem: (9)
• LightGBM (Ke et al., 2017) represents a new generation of gradient boosting algorithms, engineered for extreme efficiency and scalability. Unlike traditional Gradient Boosting Decision Trees that grow trees level-wise, LightGBM grows trees leaf-wise, selecting leaves that yield the largest loss reduction. This strategy substantially accelerates training time and reduces memory consumption, often achieving state-of-the-art results in multi-class classification and ranking problems.
• K-Nearest Neighbors (Kramer, 2013) offers a fundamentally different approach. It is a non-parametric, instance-based learning algorithm that classifies a data point based on the majority label among its nearest neighbors. Distance between points is often measured using the Euclidean metric: (10)
• XGBoost (Chen & Guestrin, 2016) stands as a highly optimized implementation of gradient boosting, celebrated for its speed and predictive performance. Unlike basic boosting algorithms, XGBoost explicitly incorporates regularization terms to control model complexity. The objective function typically takes the form: (11)
where penalizes the number of leaves T and the leaf weights .
• CatBoost (Dorogush, Ershov & Gulin, 2018) is a gradient boosting algorithm on decision trees, specifically designed to handle categorical features efficiently without extensive preprocessing. Unlike traditional boosting methods, CatBoost employs an ordered boosting strategy to reduce prediction shift and prevent overfitting. Additionally, it uses target statistics with permutation-driven schemes for encoding categorical variables, ensuring unbiased estimation.
By evaluating these models, we aim to identify the most suitable algorithm for predicting borrower repayment behavior, balancing accuracy, interpretability, and computational efficiency.
Advanced tabular models
Recent advancements in deep learning have markedly improved predictive capabilities for tabular data tasks. In this study, we conduct a comparative analysis of several advanced tabular deep learning architectures, each addressing challenges inherent to tabular datasets, including sparsity and overfitting, while striving to maximize predictive fidelity. These architectures will be designed and implemented for a dataset related to loan repayment capacity prediction. Through this, we will analyze and evaluate the performance of the proposed model in comparison with these advanced tabular models.
Multilayer Perceptron (MLP) (Lippmann, 1994): As a widely adopted baseline for tabular data modeling, MLP leverages fully connected layers with nonlinear activation functions to learn feature interactions. Despite its simplicity and computational efficiency, MLP often struggle to capture complex dependencies between heterogeneous features compared to more advanced architectures. Nonetheless, they remain a strong reference point for benchmarking due to their robustness and ease of implementation.
TabNet (Arik & Pfister, 2019): TabNet leverages a sequential attention mechanism to dynamically prioritize relevant features at each decision step, offering an elegant trade-off between predictive power and interpretability. By enforcing sparse attention, TabNet remains resistant to overfitting and enables human-understandable model explanations. Critical hyperparameters such as learning rate and batch size play pivotal roles in governing its convergence behavior and generalization performance. The model’s architecture is particularly well-suited for tasks demanding feature importance transparency.
TabTransformer (Huang et al., 2020): In adapting transformer architectures to the domain of tabular data, TabTransformer introduces column embedding and self-attention layers to capture intricate feature dependencies more effectively than conventional MLP-based approaches.
TabPFN (Hollmann et al., 2022): Characterized by its meta-learned, probabilistic foundation, TabPFN stands out by offering rapid and competitive predictions with minimal hyperparameter tuning requirements. Particularly advantageous for small or noisy datasets, TabPFN circumvents overfitting tendencies commonly observed in deep models.
FT-Transformer (Gorishniy et al., 2021): FT-Transformer revisits the transformer paradigm with feature tokenization to process tabular data as sequences of tokens, each corresponding to an input feature. This allows the model to fully exploit the attention mechanism across heterogeneous feature types. Empirical studies from FT-Transformer demonstrate that FT-Transformer often matches or surpasses tree-based models like XGBoost on benchmark datasets.
SAINT (Somepalli et al., 2021): SAINT advances the field by introducing both self-attention and inter-sample attention mechanisms to better model feature interactions not only within a single instance but also across the dataset. This dual-attention framework enriches the learned representations and captures complex global dependencies, thereby enhancing predictive accuracy.
AutoInt (Song et al., 2018): AutoInt leverages the self-attention mechanism to automatically learn high-order feature interactions in tabular data. By stacking multiple interacting layers equipped with residual connections, the model adaptively captures both low- and high-order dependencies without extensive manual feature engineering. The attention-based design not only enhances interpretability by highlighting influential feature interactions but also demonstrates strong performance across diverse real-world tabular prediction tasks.
Tuning parameters
To ensure a fair comparison of model performance, we conducted hyperparameter tuning using the random search strategy. For each machine learning model, a range of critical hyperparameters was systematically explored to identify the optimal configuration. Table 1 summarizes the machine learning models employed in the loan repayment capacity prediction task, together with their key hyperparameters and corresponding tuning ranges. Additionally, Table 2 provides the hyperparameter tuning details for advanced tabular models applied to this task. The hyperparameters of these advanced models were selected based on insights from relevant research articles and official implementation source codes.
| Model | Hyperparameter | Tuning values |
|---|---|---|
| Random Forest | n_estimators | 100, 200, 500 |
| max_depth | 10, 20, 30 | |
| min_samples_split | 2, 5 | |
| Naive Bayes | var_smoothing | 1e−9, 1e−8, 1e−7, 1e−6 |
| fit_prior | [0.5, 0.5] | |
| LightGBM | num_leaves | 50, 100, 150 |
| learning_rate | 0.01, 0.05, 0.1, 0.2 | |
| max_depth | −1, 10, 20, 30 | |
| feature_fraction | 0.7, 0.8, 0.9, 1.0 | |
| K-nearest neighbors | n_neighbors | 3, 5, 7, 9 |
| Metric | Euclidean, manhattan | |
| Weights | Uniform, distance | |
| XGBoost | learning_rate | 0.01, 0.1, 0.2, 0.3 |
| max_depth | 3, 6, 9, 12 | |
| Subsample | 0.5, 0.7, 1.0 | |
| CatBoost | learning_rate | 0.01, 0.1, 0.2, 0.3 |
| Depth | 3, 6, 9, 12 | |
| Iterations | 50, 100, 150 |
| Model | Hyperparameter | Tuning values |
|---|---|---|
| MLP | Learning rate | 0.01–0.05 |
| Dimension | 256, 512 | |
| Number of layers | 3, 5 | |
| Activation function | ReLU, LeakyReLU | |
| TabNet | Learning rate | 0.01–0.05 |
| Batch size | 512, 2,048 | |
| Decision steps | 3, 10 | |
| Sparsity regularization | 1e−5, 1e−3 | |
| TabTransformer | Number of attention heads | 4–8 |
| Hidden size | 128, 512 | |
| Number of transformer layers | 4, 8 | |
| Learning rate | 1e−4, 1e−3 | |
| TabPFN | Learning rate | 1e−4, 1e−3 |
| Hidden size | 128, 512 | |
| Number of attention heads | 4, 8 | |
| FT-Transformer | Embedding dimension | 32, 128 |
| Number of transformer layers | 2, 4 | |
| Number of attention heads | 4, 8 | |
| Dropout rate | 0.1, 0.3 | |
| SAINT | Learning rate | 1e−4–3e−4 |
| Number of attention heads | 4, 8 | |
| Dropout rate | 0.1, 0.3 | |
| Number of layers | 4, 8 | |
| AutoInt | Learning rate | 1e−4–3e−4 |
| Number of attention heads | 4, 8 | |
| Embedding dimension | 128, 256 |
Evaluation metrics
In this section, we introduce multiple evaluation metrics to assess model performance, each providing different insights into prediction quality. The formulas of the metrics are described as follows.
• Area Under the Receiver Operating Characteristic Curve (AUROC) (12)
• Area Under the Precision-Recall Curve (AUPRC) (13)
• Accuracy (ACC) (14)
• Matthews Correlation Coefficient (MCC) (15)
• F1-score (16)
Computational environment
All experiments were conducted on a machine equipped with an Intel Core i9-12900K processor, 64 GB of RAM, and an NVIDIA RTX 3090 GPU. The operating system used was Ubuntu 20.04 LTS. The software environment consisted of Python 3.9, with key libraries including Scikit-learn (version 1.6) PyTorch (version 2.0.0). Model training and evaluation were performed using Visual Studio Code with integrated support for Jupyter notebooks. The CUDA toolkit version 11.4 was employed to leverage GPU acceleration for deep learning tasks. On average, the training process for our model required approximately 40 min, while inference latency per sample was around 215 milliseconds, ensuring suitability for real-time applications. During training, RAM consumption remaining stable at around 4 GB.
Results and discussion
Ablation study
To validate the contribution of each component in our proposed architecture, we performed a detailed ablation study. Specifically, we investigated the effect of three critical modules: (1) Feature Encoder, (2) the Multi-head Attention, and (3) the Gated Transformer layers. For each ablation setting, we systematically removed or replaced the corresponding component and evaluated the model under the same experimental setup as described earlier.
As presented in Table 3, removing the Feature Encoder and directly feeding raw features into the Gated Transformer resulted in a notable drop in AUROC (0.8291 vs. 0.8517) and ACC (0.9028 vs. 0.9238), confirming the necessity of embedding alignment across heterogeneous feature types. Excluding the Multi-head Attention from the Gated Transformer led to a significant performance degradation across all metrics, particularly MCC (0.6623 vs. 0.6942), indicating that attention plays an essential role in stabilizing feature interactions. Finally, replacing the Gated Transformer with a standard Transformer reduced both F1 (0.9471 vs. 0.9617) and AUPRC (0.9054 vs. 0.9213), suggesting its effectiveness in capturing global contextual information for robust classification. Overall, these results demonstrate that each component contributes meaningfully to the final performance, with the gated self-attention mechanism providing the largest performance gain. This highlights the importance of both architectural refinements and embedding strategies in achieving good results for tabular data modeling.
| Model variant | AUROC | AUPRC | ACC | MCC | F1 |
|---|---|---|---|---|---|
| Without feature encoder | 0.8291 | 0.9017 | 0.9028 | 0.6512 | 0.9462 |
| Without multi-head attention | 0.8356 | 0.9078 | 0.9102 | 0.6623 | 0.9501 |
| Gated Transformer Transformer | 0.8402 | 0.9054 | 0.9157 | 0.6705 | 0.9471 |
| Full model (Ours) | 0.8517 | 0.9213 | 0.9238 | 0.6942 | 0.9617 |
Results of ML models comparison
Table 4 present the comparative performance of various machine learning models against our proposed method across multiple evaluation metrics. Overall, our model consistently outperforms all baselines. For AUROC, our approach achieves a score of 0.8517, representing a significant improvement over the second-best model, CatBoost, which attains 0.7636. Similarly, for AUPRC, our model records the highest value of 0.9213, surpassing all other methods, with CatBoost again being the closest at 0.9012 and Naive Bayes (0.8929). In addition, our method also demonstrates superior classification performance, achieving the highest ACC (0.9238), MCC (0.6942), and F1 (0.9617). Notably, while models such as LightGBM and XGBoost show competitive results, particularly in ACC and F1, they still lag behind our model by a noticeable margin across all metrics. These results collectively highlight the robustness and effectiveness of our proposed method compared to existing baseline models.
| Model | AUROC | AUPRC | ACC | MCC | F1 |
|---|---|---|---|---|---|
| Random Forest | 0.7241 | 0.8819 | 0.8889 | 0.6119 | 0.9351 |
| Naive Bayes | 0.7514 | 0.8929 | 0.8641 | 0.5412 | 0.9173 |
| LightGBM | 0.7289 | 0.8837 | 0.8899 | 0.6153 | 0.9356 |
| K-Nearest Neighbors | 0.7125 | 0.8778 | 0.8632 | 0.5128 | 0.9187 |
| XGBoost | 0.7345 | 0.8859 | 0.8891 | 0.6109 | 0.9348 |
| CatBoost | 0.7636 | 0.9012 | 0.9091 | 0.6445 | 0.9438 |
| Ours | 0.8517 | 0.9213 | 0.9238 | 0.6942 | 0.9617 |
Results of advanced models comparison
In order to further assess the effectiveness of our proposed method, we conducted a comprehensive comparison against several advanced models specifically designed for tabular data. As shown in Table 5, our model achieves a score of 0.8517, outperforming the best-performing model, FT-Transformer (0.8294), by a margin of 2.7%. Similarly, for AUPRC, our method records 0.9213, compared to 0.9027 achieved by SAINT and AutoInt (0.8932). Moreover, our model exhibits the highest ACC (0.9238), outperforming TabPFN (0.9056) and FT-Transformer (0.9031). For the MCC and F1, two critical indicators for balanced performance in classification tasks, our method also yields the best results, indicating improved predictive stability and robustness. Overall, these comparisons highlight the superiority of our proposed approach over existing advanced techniques for tabular data modeling.
| Model | AUROC | AUPRC | ACC | MCC | F1 |
|---|---|---|---|---|---|
| MLP | 0.7513 | 0.8851 | 0.8725 | 0.6338 | 0.9072 |
| TabNet | 0.8023 | 0.8782 | 0.8921 | 0.6215 | 0.9382 |
| TabTransformer | 0.8157 | 0.8859 | 0.8973 | 0.6321 | 0.9425 |
| TabPFN | 0.8235 | 0.8927 | 0.9056 | 0.6587 | 0.9491 |
| FT-Transformer | 0.8294 | 0.8993 | 0.9031 | 0.6523 | 0.9478 |
| SAINT | 0.8171 | 0.9027 | 0.8992 | 0.6409 | 0.9447 |
| AutoInt | 0.8011 | 0.8932 | 0.8819 | 0.6320 | 0.9318 |
| Ours | 0.8517 | 0.9213 | 0.9238 | 0.6942 | 0.9617 |
Stability and robustness study
To assess the stability and reliability of our proposed method in predicting loan repayment capacity, we performed experiments across 15 different random seeds. Each seed represents a distinct initialization of the random number generator used in the model training process, ensuring that the evaluation captures the inherent variability and robustness of the model under different starting conditions. The results, presented in Table 6, show that the model’s performance metrics remain relatively stable across all trials. The mean values for key evaluation metrics including AUROC, AUPRC, ACC, MCC, and F1 are consistently high, with means of 0.8522, 0.9207, 0.9244, 0.6945, and 0.9610, respectively. This indicates that the model is robust to variations in initialization, as it maintains a strong predictive ability for loan repayment capacity regardless of the random seed used during training. The standard deviations for these metrics are also relatively low, ranging from 0.0042 to 0.0069. These small variations suggest that the model’s performance is not highly sensitive to small changes in initialization, further demonstrating its stability and reliability. Specifically, the low standard deviation in metrics such as AUROC and F1 is an important indicator of how consistently the model can discriminate between repaying and non-repaying loan applicants, which is a crucial aspect of predicting loan repayment capacity accurately.
| Trial | AUROC | AUPRC | ACC | MCC | F1 |
|---|---|---|---|---|---|
| 1 | 0.8517 | 0.9213 | 0.9238 | 0.6942 | 0.9617 |
| 2 | 0.8425 | 0.9152 | 0.9291 | 0.6827 | 0.9543 |
| 3 | 0.8571 | 0.9254 | 0.9167 | 0.7023 | 0.9635 |
| 4 | 0.8493 | 0.9137 | 0.9278 | 0.6912 | 0.9587 |
| 5 | 0.8659 | 0.9294 | 0.9223 | 0.6985 | 0.9682 |
| 6 | 0.8481 | 0.9186 | 0.9312 | 0.6881 | 0.9594 |
| 7 | 0.8564 | 0.9247 | 0.9245 | 0.6967 | 0.9618 |
| 8 | 0.8432 | 0.9161 | 0.9193 | 0.6854 | 0.9537 |
| 9 | 0.8603 | 0.9282 | 0.9267 | 0.7002 | 0.9659 |
| 10 | 0.8518 | 0.9194 | 0.9232 | 0.6949 | 0.9608 |
| 11 | 0.8578 | 0.9227 | 0.9205 | 0.6973 | 0.9626 |
| 12 | 0.8475 | 0.9171 | 0.9286 | 0.6892 | 0.9575 |
| 13 | 0.8612 | 0.9268 | 0.9257 | 0.7015 | 0.9664 |
| 14 | 0.8504 | 0.9202 | 0.9221 | 0.6935 | 0.9591 |
| 15 | 0.8551 | 0.9238 | 0.9240 | 0.6957 | 0.9610 |
| Mean | 0.8522 | 0.9207 | 0.9244 | 0.6945 | 0.9610 |
| Std | 0.0069 | 0.0048 | 0.0045 | 0.0050 | 0.0042 |
In conclusion, the stability across different random seeds is particularly significant in the context of loan repayment prediction, as it implies that the model is not overfitting to particular subsets of the data or to specific random initialization conditions. This robustness ensures that the model is likely to perform well on new, unseen loan data, making it a dependable tool for financial institutions in assessing the repayment likelihood of loan applicants.
Limitations
While the proposed Gated Transformer model achieves strong predictive performance on the LendingClub dataset, its applicability has several constraints. First, the model’s training and evaluation on a single platform-specific dataset may limit its generalizability to other financial institutions, credit products, or regional contexts without further adaptation. Second, as with most real-world credit data, historical biases in lending decisions and socioeconomic disparities may be embedded in the features, posing risks of perpetuating unfair outcomes if bias detection and mitigation are not implemented. Third, although the token-wise gating mechanism improves interpretability relative to conventional deep learning models, the architecture remains more complex than traditional statistical approaches, which may hinder adoption in regulatory environments requiring clear, transparent decision-making.
Conclusion
In this article, we introduced a novel Gated Transformer-based deep learning model tailored for tabular data in the domain of credit risk assessment. By effectively integrating categorical and numerical features into a unified embedding space and leveraging multi-head self-attention with token-wise gating, our model captures complex feature interactions and improves interpretability, addressing key challenges in economic predictive modeling. Experimental results demonstrate that our approach outperforms advanced tabular data models across multiple metrics, including accuracy, AUPRC, MCC, and F1, highlighting its robustness and predictive power. This work provides a flexible and powerful framework for extracting meaningful economic insights from complex credit datasets, facilitating more informed and responsible financial decision-making. In addition, future research should systematically evaluate the model’s transferability across diverse datasets and financial contexts to address the current limitation of platform dependency. Another important avenue lies in developing robust bias detection and mitigation strategies to prevent the reinforcement of historical socioeconomic disparities. Finally, simplifying the model architecture while preserving predictive performance may enhance its acceptance in highly regulated financial environments.