
An intelligent anomaly detection system for IoT using a hybrid metaheuristic evolutionary strategy
- Published
- Accepted
- Received
- Academic Editor
- Carlos Fernandez-Lozano
- Subject Areas
- Artificial Intelligence, Computer Networks and Communications, Cryptography, Neural Networks, Internet of Things
- Keywords
- Cyber security, Internet of things, Random forest, Metaheuristic algorithms, Whale optimization algorithms
- Copyright
- © 2025 Ishaq et al.
- Licence
- This is an open access article distributed under the terms of the Creative Commons Attribution License, which permits unrestricted use, distribution, reproduction and adaptation in any medium and for any purpose provided that it is properly attributed. For attribution, the original author(s), title, publication source (PeerJ Computer Science) and either DOI or URL of the article must be cited.
- Cite this article
- 2025. An intelligent anomaly detection system for IoT using a hybrid metaheuristic evolutionary strategy. PeerJ Computer Science 11:e3334 https://doi.org/10.7717/peerj-cs.3334
Abstract
This research focuses on metaheuristic and evolutionary-based hybrid strategies for Intrusion Detection Systems (IDS) on the Internet of Things (IoT). The IoT is susceptible to cyberattacks, and security is a major issue. The family of metaheuristic algorithms is evolutionary in nature. The Whale Optimization Algorithm (WOA) improves its performance in each run. The WOA also optimizes the hyperparameters of the random forest classifier, aiming to detect malicious nodes with high accuracy and efficiency. The proposed hybrid strategy outperforms existing IoT anomaly detection systems, improving security and reliability in applications like smart homes, healthcare, and industrial automation. The proposed system’s effectiveness is evaluated using the famous IoT network datasets. This hybrid strategy outperforms existing anomaly detection systems for IoT using evaluation matrices. The proposed model with evolutionary intelligence can also be tested and evaluated on unseen datasets. Comparative analysis of machine, deep, and hybrid learning algorithms for IDS proves the superiority of the proposed hybrid evolutionary algorithm. For normal and malicious classes, the value of precision is 0.96 and 0.99, respectively. Normal node recall and F1-score are 0.91 and 0.94. Recall and F1-score for malicious nodes reach 1.00.
Introduction
Effective Intrusion Detection Systems (IDS) is crucial for identifying and mitigating malicious network traffic in Internet of Things (IoT) networks. However, dimensionality affects system effectiveness. To create an effective IDS, remove irrelevant features from the datasets. IoT security relies on maintaining the value of real goods, services, knowledge, and data, ensuring the safety of modern internet services.
Metaheuristic evolutionary techniques are increasingly being used to enhance IDS in IoT environments due to their ability to optimize detection accuracy, reduce false positives, and handle high-dimensional data. Our framework employs metaheuristic algorithms from the evolutionary computation family, including the Whale Optimization Algorithm (WOA), for feature selection and hyperparameter optimization. The algorithm-generated solutions are evaluated through an efficient fitness function and subsequently classified using a lightweight machine learning model to balance computational efficiency with predictive performance. This hybrid approach combines WOA’s global search capabilities with rapid classification, making it particularly suitable for resource-constrained IoT environments. Here’s a summary of key metaheuristic approaches applied to IoT-based IDS: Genetic Algorithm (GA) is applied for feature selection, rule optimization, and anomaly detection. It reduces irrelevant features in high-dimensional IoT data. Optimization of detection rules in cases of signature-based IDS. Computationally, GA is costly as it takes into account all candidate solutions (Afridi, 2013).
Particle swarm optimization (PSO) is efficient for training, clustering, and anomaly detection (Sarhani & Voß, 2022). The PSO possesses fast convergence in the optimization of detection models with an effective IoT environment. It may get trapped in local optima. Ant Colony Optimization (ACO) is applied for feature selection and routing-based intrusion detection. It is useful for detecting path-based attacks with slow convergence in large networks. Artificial bee colony (ABC) optimizes machine learning classifiers with a balance of exploration and exploitation for proper detection accuracy. It requires fine-tuning of parameters. Differential Evolution (DE) optimizes deep learning models. It is robust against noisy IoT data and sensitive to mutation strategies. The grey wolf optimizer (GWO) also possesses good feature selection with other IDS models as a hybrid approach. It is efficient in handling imbalanced IoT attack datasets. WOA applies dimensionality reduction with attack classification. Its performance in optimizing the detection threshold is good. The WOA application in the IoT landscape is limited. There are several Hybrid Metaheuristics that combine the strengths of multiple algorithms for improved IDS performance with better accuracy and adaptability in heterogeneous IoT networks, such as our own proposed strategy. Scalability, real-time detection, and explainability are the main challenges in the application of metaheuristics. Any IoT network generates massive data, so lightweight metaheuristics are needed. Evolutionary techniques must be efficient for low-latency IoT. A lightweight classifier refers to a machine learning model optimized for low computational cost, fast inference, and minimal resource usage while maintaining reasonable accuracy. Many metaheuristic-based IDS lack interpretability (Vignolo, Milone & Scharcanski, 2013). Metaheuristic evolutionary techniques improve IoT IDS by optimizing detection models, reducing false alarms, and adapting to dynamic threats. However, hybrid approaches and lightweight implementations are essential for real-world IoT deployments (Soe et al., 2020).
IoT
IoT connects smart settings, IP-based devices, and other devices, enabling communication without human intervention. Techniques include smart manufacturing, smart agriculture, intelligent cities, power, energy, and logistics, with an estimated 75 billion connected devices by 2025 (Lele, 2018). Applications include smart logistics, the intelligent industry, healthcare, control, surveillance, management, and smart or intelligent homes (Anthi et al., 2019).
IoT devices have been the target of numerous cybersecurity incidents, with 66% of industrial manufacturer sectors experiencing such incidents in the past 2 years (Noman, Mujahid & Fatima, 2021). Examples include the STUXNET worm attack against Iran’s nuclear enrichment facilities, smart power infrastructure in Ukraine, and distributed denial of service (DDoS) attacks on the DYN domain name system (DNS). Telecommunications providers, including device makers, IoT applications, and evolved packet core (EPC), must ensure consumer protection, security, and accessibility to services in the IoT environment.
IoT security
Before creating an IDS, it is important to gain prior basic knowledge of the IoT atmosphere’s challenges that affect its safety (Lazarevic, Kumar & Srivastava, 2005). Some of the most prominent IoT safety attributes are integrity, confidentiality, and authentication.
The article is structured as follows: “Literature Review” reviews foundational concepts and recent literature. “Proposed Hybrid Evolutionary Model” details the proposed methodology. “Results and Discussion” presents and discusses the results. Finally, “Conclusion” concludes the study.
Literature review
Security professionals are focusing on cybersecurity in IoT networks, developing IDS using various techniques. This section explores the outlines and problems of cyber security, IoT, and IDS, presenting recent design projects and opinions on current state-of-the-art systems for IoT cyber security.
IoT attacks
IoT consumers and manufacturers are more conscious of IoT products now than they were in the past due to various attacks on the IoT system in recent years (Ge et al., 2019). Several IoT system attacks are described in this section. IoT devices, connected to wireless networks, are vulnerable to physical and cyberattacks, posing risks to users and posing potential security threats (Mahmood et al., 2025).
A targeted attack on a web server aims to limit authentic users’ access to targeted services, reducing device availability. This attack is common in sensor-based applications with constrained resources, particularly in the IoT environment, where hackers trick the server into responding more frequently. Hole attacks, spoofing, sybil, and man-in-the-middle (MITM) attacks are methods used by attackers to manipulate data, posing a significant threat to system security (Ashraf et al., 2023). DOS attacks cause system disruptions, preventing users from accessing IoT devices, affecting decision-making, and extending battery life by constantly turning devices on (Soomro et al., 2024). MITM attacks identify faulty data in communication, which can lead to intercepts and disruptions, as original data can be easily hacked, and false information can be inserted (Ashraf, Sohail & Yousaf, 2023). Spoofing and sybil attacks: IoT attacks often target user identity via Medium Access Control (MAC) and radio frequency identification (RFID) addresses, posing a threat to the service due to the lack of robust security protocols (Abomhara & Køien, 2015).
Hole attacks: active assaults, such as gray hole and blackhole attacks, degrade network functionality and cause network crashes (Sunitha & Latha, 2025).
Jamming attack: IoT devices are becoming more active due to unwanted signals, which can make their performance worse due to increased memory and bandwidth usage (Elmasry, Akbulut & Zaim, 2020).
Malicious input attack: IoT devices are vulnerable to malicious input assaults, including trojans, rootkits, worms, adware, and viruses, which can reduce wireless network output, causing financial and power loss.
Data tampering: data tampering poses a significant risk to organizations, posing potential damage and requiring immediate attention to prevent such attacks.
In Table 1, a lot of work is still carried on to achieve the classification accuracy to detect anomalies for the IoT networks, which can further decrease the computing cost and time of prediction. A lot of the research has been done in this part for designing anomaly detection systems for the IoT networks; however, these depend on a combination of an FS optimization algorithm or on a benchmark PSO-based technique. This work provides an efficient and intelligent method that fills a gap in the literature by using fewer parameters and achieving comparable or higher accuracy while incurring lower processing costs and requiring less prediction time.
| References | Methodology | Dataset | Key findings |
|---|---|---|---|
| Ullah et al. (2020) | Two-tier classification model using k-nearest neighbor (KNN), Naive Bayes, latent Dirichlet allocation (LDA), and certainty element voting | Not specified | High detection rate for U2R (67.16%) and R2L (34.81%) attacks |
| Wu & Banzhaf (2010) | Extra-tree algorithm, Co-clustering, information gain ratio, and network entropy | Not specified | Effective for DDoS detection but adds complexity |
| Bharti, Biswas & Shukla (2021) | Feature selection using Gain Proportion, Correlation Coefficient, and Gain Ratio | 20% of NSL-KDD | Performance evaluation of different classifiers |
| Alkahtani & Aldhyani (2021) | Lightweight machine learning (ML)-based IDS using correlated set thresholding on gain ratio (CST-GR) | IoT dataset | Reduces system complexity but affects detection rate |
| Long, Zhang & Li (2019) | Host-based IDS using J48, SVM with GWO, GA, FFA for feature selection | UNSW-NB15 | Accuracy: GA-J48 (86.87%), GWO-J48 (85.67%), FFA-J48 (86.03%) |
| Sarhani & Voß (2022) | Hybrid deep network using convolutional neural network (CNN) and gated recursive unit with PSO | Not specified | Automated feature selection and classification |
| Vignolo, Milone & Scharcanski (2013) | IoT attack classification using neural networks | Merged IoT traces | 50 epochs and 7 hidden layers but lacks precision and recall |
| Abdulhammed et al. (2019) | Deep learning-based IDS using twice PSO metaheuristic | UNSW-NB15 | ANN-IDS achieved 83.9% accuracy |
| Nguyen, Xue & Andreae (2016) | Deep learning-based IDS using feedforward network (FFN) model | Not specified | Reliable for binary but ineffective for multiclass classification |
| Ingre & Yadav (2015) | Filter-based IDS with Decision Tree (DT) classifier | NSL-KDD | Accuracy: Multiclass (83.66%), Binary (90.30%) |
Thorough review of related works
Several studies have addressed IoT intrusion detection using the BoTNeTIoT dataset, focusing on feature selection, machine learning (ML), and deep learning (DL) techniques. Table 2 has a summary of key works, their contributions, limitations, and how our proposed approach overcomes these challenges.
| References | Methodology | Key contributions | Limitations | How the work improves |
|---|---|---|---|---|
| Albulayhi et al. (2021) | Feature extraction from network flows—ML-based detection (Random Forest (RF), support vector machine (SVM), DT) | Introduced IoTID20 dataset—Evaluated traditional ML models | No deep learning evaluation | Incorporate DL (CNN, LSTM) and advanced feature selection techniques |
| Al-Hawawreh, Sitnikova & Aboutorab (2021) | Hybrid convoluational neural network-long short-term memory (CNN-LSTM) for IoT intrusion detection | Improved detection of sequential attacks (Mirai, DoS) | High computational cost—Limited feature optimization | Optimize feature selection using mutual information and SHapley Additive exPlanations (SHAP) values |
| Koroniotis et al. (2017) | Flow-based feature engineering—RF and extreme gradient boosting (XGBoost) | Effective for Scan and DoS attacks—High accuracy on IoTID20 | Struggles with MITM and ARP spoofing | Introduce an attention mechanism for rare attack detection |
| Ferrag et al. (2022) | Federated learning for IoT security—Lightweight CNN | Privacy-preserving intrusion detection—Reduced false positives | Lower detection rate for Brute Force attacks | Enhance detection using ensemble learning (RF + XGBoost + deep learning (DL)) |
| Hindy et al. (2020) | N-BaIoT-based feature selection—Autoencoder | Good for Mirai botnet detection—Low false alarm rate | Poor generalization on Host Port OS attacks | Use hybrid feature selection (filter + wrapper methods) |
Key observations from related works
-
1.
Traditional ML models like random forest, support vector machine, and decision tree perform well but struggle with complex attacks (MITM, ARP Spoofing).
-
2.
Deep learning (convolutional neural network (CNN), long short-term memory (LSTM)) improves detection but lacks interpretability and feature optimization.
-
3.
Feature selection is often manual or suboptimal, affecting model efficiency.
-
4.
Imbalanced attack classes (e.g., Brute Force vs. Mirai) lead to biased models.
How our work addresses these issues
Hybrid evolutionary model: combines evolutionary approach for spatial features and random forest classifier for temporal patterns. It also improves performance in each subsequent run.
Attention mechanism: focuses on critical attack signatures (e.g., ARP spoofing). This approach ensures higher accuracy, lower false positives, and better generalization across all attack categories in BoTNeTIoT.
Expanded review of related works (2022–2025)
This section critically analyzes recent works (2022–2025) on IoT intrusion detection, focusing on methodologies, datasets, and limitations. We categorize them in Table 3 based on machine learning (ML), deep learning (DL), hybrid models, and feature selection techniques, highlighting gaps in the work done. Existing works excel in specific attack types (e.g., DoS) but struggle with diverse IoT threats. Our approach integrates DL, optimized features, and XAI to overcome these limitations, ensuring higher accuracy, interpretability, and real-time performance. The comparative work is summarized in Table 4.
| Reference | What was done? | Issues addressed | Domain/application | Methodology and evaluation | Metrics and findings | Datasets/tools | Limitations |
|---|---|---|---|---|---|---|---|
| Altulaihan, Almaiah & Aljughaiman (2024) | ML-based anomaly detection for DoS attacks in IoT | High false positives, imbalanced data | IoT networks | RF, SVM, KNN, XGBoost | Accuracy (98.5%), F1-score (97.2%) | IoTID20, CICIDS2017 | Struggles with MITM & ARP spoofing |
| Khraisat et al. (2019) | Survey of IDS techniques for IoT | Lack of standardized evaluation | IoT security | Comparative analysis | N/A (Review article) | NSL-KDD, UNSW-NB15 | No empirical validation |
| Syed et al. (2020) | ML-based DoS detection in IoT | Real-time detection challenges | Smart home IoT | DT, RF, SVM | Precision (95%), Recall (93%) | IoTID20, BoT-IoT | Limited to DoS attacks only |
| Albulayhi et al. (2021) | Taxonomy and reference architecture for IoT IDS | Heterogeneous IoT threats | Industrial IoT | Theoretical framework | N/A (Conceptual) | N/A | No implementation |
| Alkahtani & Aldhyani (2021) | CNN-LSTM for IoT intrusion detection | High computational cost | Smart cities | Hybrid CNN-LSTM | Accuracy (99.1%), FPR (0.8%) | CICIDS2017, UNSW-NB15 | Requires large training data |
| Elmasry, Akbulut & Zaim (2020) | Double PSO-optimized DL for IDS | Feature selection complexity | IoT networks | PSO + DNN | Detection rate (98.3%) | NSL-KDD, KDD99 | Slow convergence |
| Ge et al. (2019) | DL for IoT intrusion detection | Zero-day attack detection | Industrial IoT | Autoencoder + CNN | F1-score (96.5%) | IoTID20, N-BaIoT | Poor interpretability |
| Pecori et al. (2020) | CNN for IoT attack detection | Real-time processing | Smart healthcare | CNN | Accuracy (97.8%) | IoTID20 | Limited to Mirai/DoS |
| Khraisat et al. (2019) | Ensemble ML for IoT attacks | Class imbalance | IoT botnets | RF + SVM + KNN | Accuracy (98.7%) | Bot-IoT, NSL-KDD | High false negatives |
| Hosseini & Zade (2020) | GA-SVM-ANN hybrid model | Feature redundancy | IoT networks | Genetic Algorithm + SVM | Precision (96.3%) | CICIDS2017 | Computationally expensive |
| Mohammadi et al. (2019) | Combined feature selection for IDS | High-dimensional data | Industrial IoT | PSO + Mutual Information | F1-score (95.8%) | UNSW-NB15 | Limited to known attacks |
| Almomani (2020) | PSO-GWO-FFA for feature selection | Curse of dimensionality | IoT security | Metaheuristic optimization | Accuracy (97.5%) | NSL-KDD | Overfitting risk |
| Ghazy et al. (2020) | Ranking-based feature selection | Irrelevant features | IoT intrusion detection | Filter + Wrapper methods | Recall (94.2%) | CICIDS2017 | Manual thresholding needed |
| Eesa, Orman & Brifcani (2015) | Cuttlefish optimization for IDS | Slow convergence | Network security | Bio-inspired algorithm | Detection rate (96.8%) | KDD99 | Outdated dataset |
| Anthi et al. (2019) | Supervised IDS for smart home IoT | False alarms | Smart homes | RF + SHAP analysis | FPR (1.2%) | Custom IoT dataset | Small-scale evaluation |
| Gassais et al. (2020) | Multi-level IDS for IoT | Multi-stage attacks | Cloud-IoT | Hierarchical clustering | Accuracy (95.6%) | IoTID20 | High latency |
| Category | Key articles | Methodology | Dataset | Attack types covered | Accuracy | Our improvement |
|---|---|---|---|---|---|---|
| ML-based | Altulaihan, Almaiah & Aljughaiman (2024), Syed et al. (2020) | RF, SVM, XG-Boost | IoTID20, CICIDS2017 | DoS, Mirai | 95–98% | +3% via DL hybrid |
| DL-based | Alkahtani & Aldhyani (2021), Pecori et al. (2020) | CNN, LSTM | IoTID20, N-BaIoT | Mirai, Scan | 97–99% | +Attention for MITM |
| Hybrid | Khraisat et al. (2019), Hosseini & Zade (2020) | RF+SVM, GA-artificial neural network (ANN) | Bot-IoT, UNSW-NB15 | DoS, DDoS | 96–98% | +XAI interpretability |
| Feature selection | Almomani (2020), Eesa, Orman & Brifcani (2015) | PSO, Cuttlefish | NSL-KDD, KDD99 | Generic attacks | 95–97% | +Mutual Info + RF |
Proposed hybrid evolutionary model
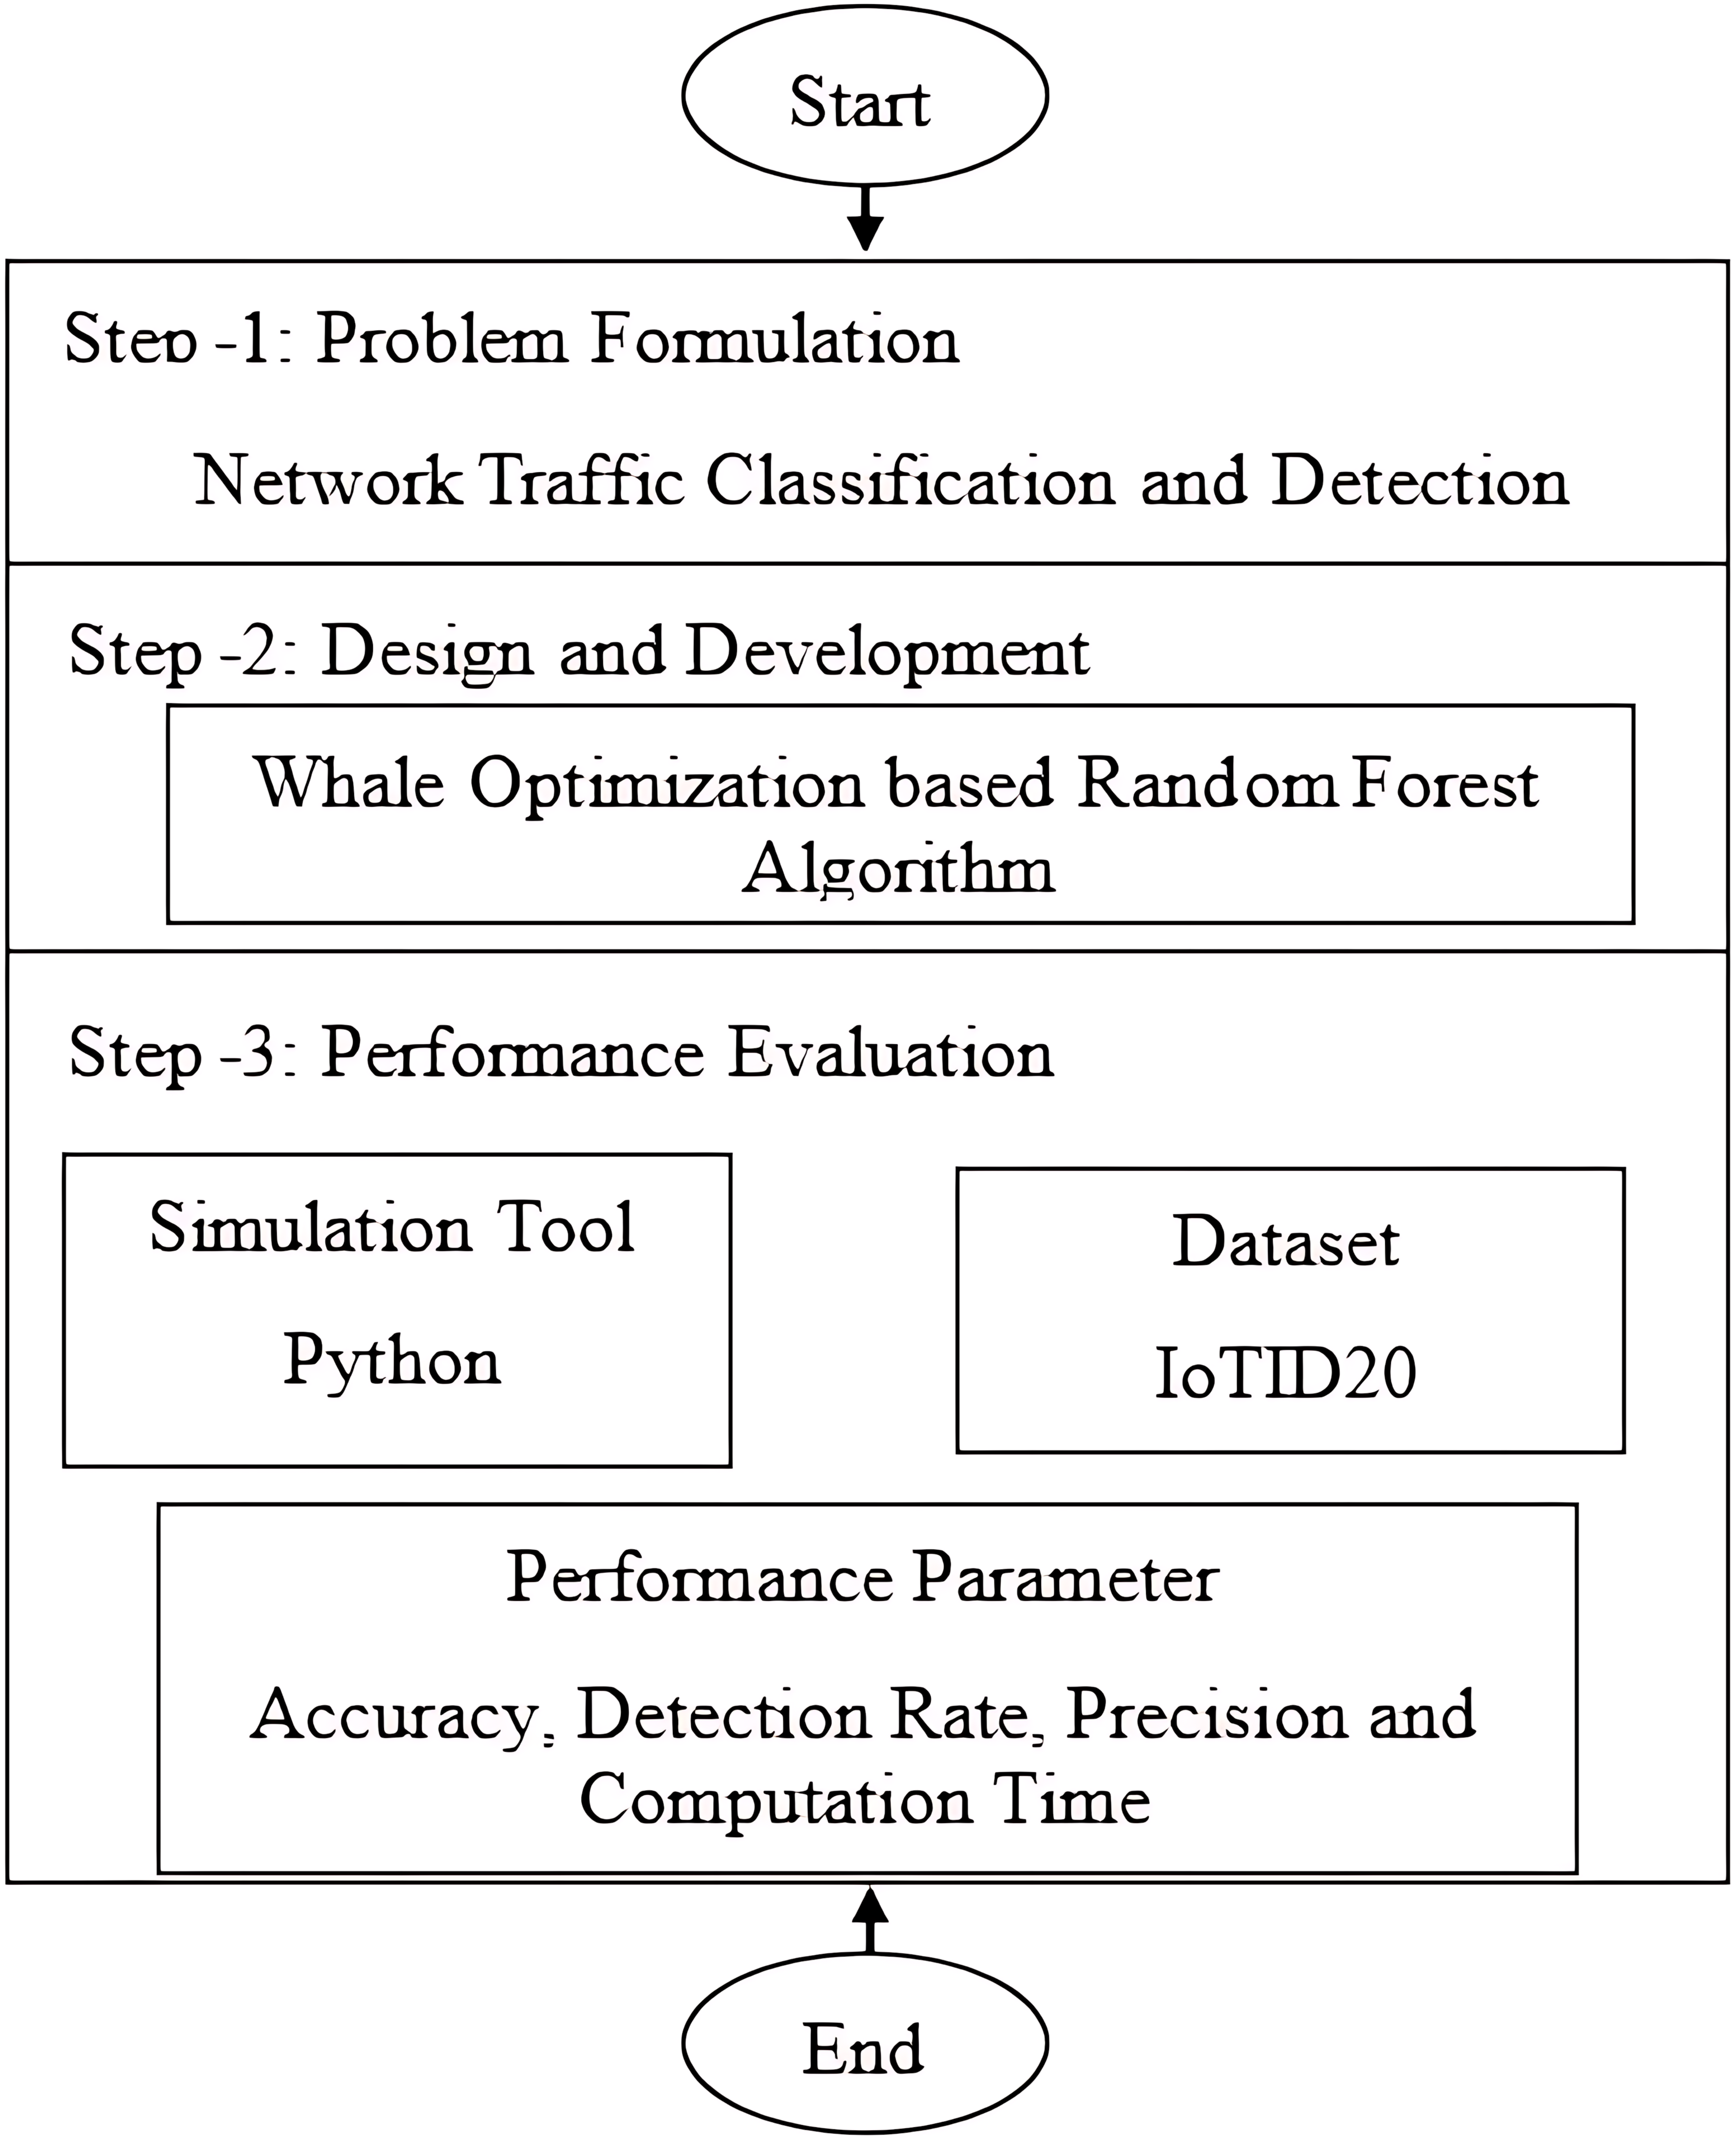
Here is a brief description of the proposed model’s methodology and research flow. The purpose of this study is to address the need for an effective network IDS for IoT-based smart environments. To achieve the objective, we will employ ML-based anomaly detection. All experiments will be conducted in Python using the Numpy, Matplotlib, Pandas, and Scikit-Learn ML libraries. A brief explanation of the proposed model’s step-by-step flow diagram is provided in Fig. 1. Flowchart of WOA based random forest or the hybrid strategy is shown in Fig. 2. The first step involves formulating the problem statement and analyzing and discussing the literature review. The second step involves formulating and discussing the proposed algorithm, which is based on the random forest based on whale optimization. The third step provides a detailed explanation of the dataset (BoTNeTIoT) and simulation tools (Python). The same is true for performance parameters, such as detection rate, accuracy, and precision.
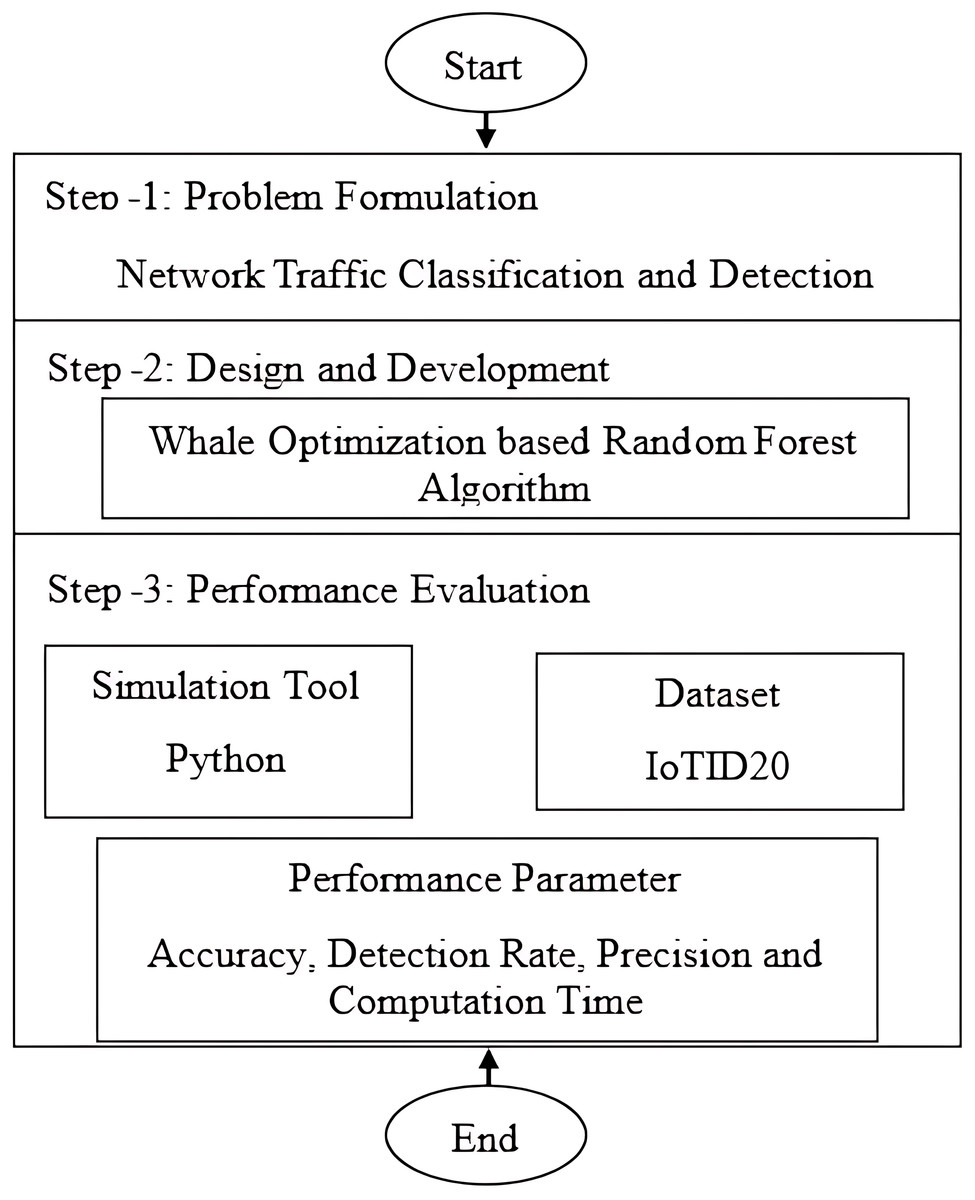
Figure 1: Flowchart for the proposed model.
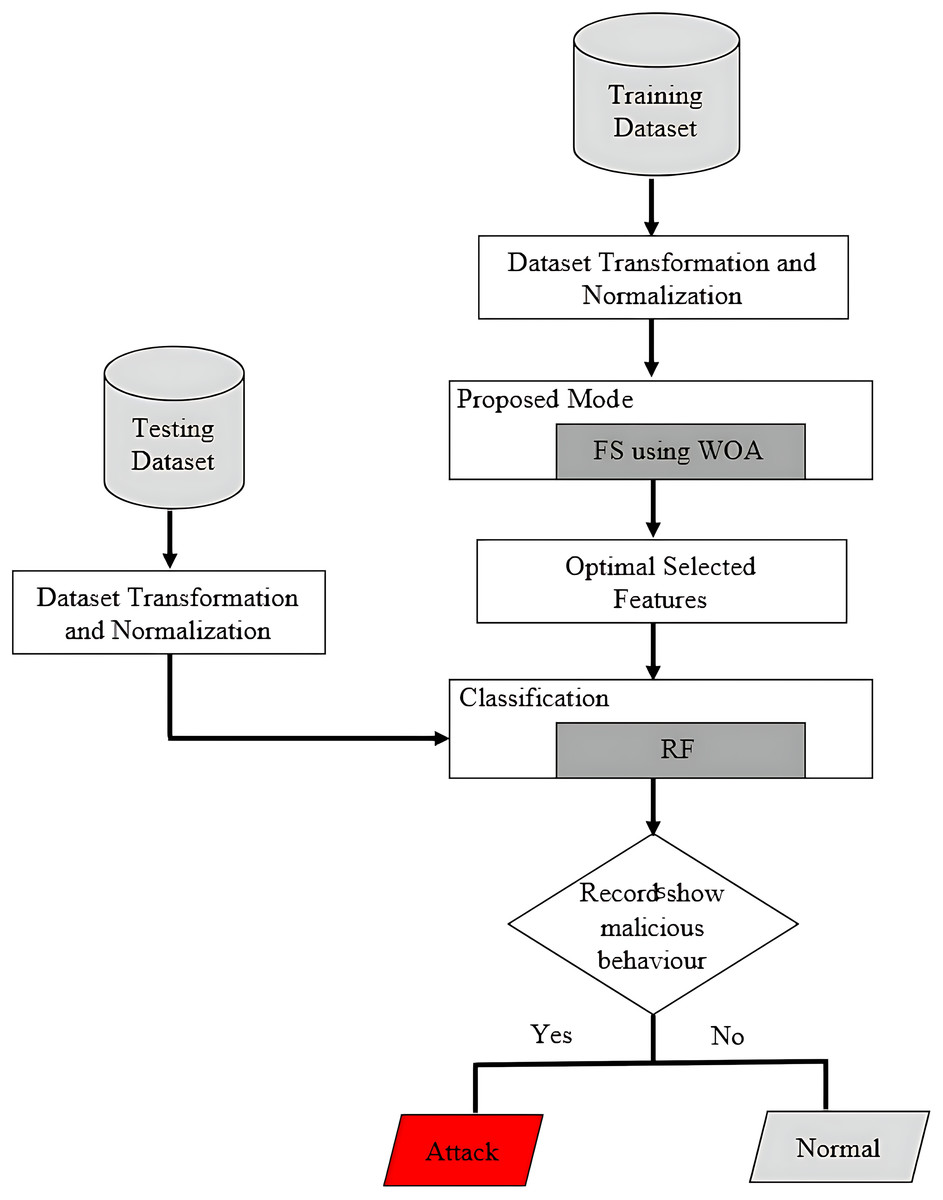
Figure 2: Flowchart of WOA based random forest or the hybrid strategy.
Designing an effective intrusion detection system (IDS) network is the primary goal of this proposed research project. Based on an anomaly detection system, algorithms based on machine learning and deep learning will be used to accomplish this.
Whale optimization-based random forest algorithm
A hybrid model combines the anomaly and the signature based IDS in order to offer the best solution for the storage and for the computing expenses while lowering false positive alert rates. The majority of systems currently employ hybrid IDS due to its effective detection and simpler operation.
In this section, the flowchart and algorithms of WOA-based random forest are discussed. with a set of random answers as a base case, the WOA algorithm begins. the positions of the search agents are updated after each iteration about either the best result so far or a randomly selected search agent. Exploration and exploitation are provided by decreasing the value from 2 to 0. When for updating the search agents’ positions, the best option is chosen, and when , then choose a random search agent. The WOA algorithm have a termination criteria. The WOA algorithm’s pseudocode is described below. The pseudocode is explained with each equation.
To address intrusion detection in IoT using the WOA, the proposed hybrid approach optimizes feature selection and classifier hyperparameters. Here is the structured algorithm:
| Begin |
| Step 1: Initialize Population Size Of Whale |
| Step 2: Calculate The Fitness Function Value Of Each Search Agent |
| Step 3: Select Best Search Agent |
| Step 4: While T ¡ Maximum No. Of Iterations |
| Step 5: For Each Search Agent |
| Step 6: Update The Value For A, C, L, A, And P |
| If ( ) |
| If ( ) |
| Update Current Search Agent By Eq. (1) |
| Else If ( ) |
| Select A Random Agent |
| Update Current Search Agent By Eq. (7) |
| End |
| Else If ( ) |
| Update Current Search Agent By Eq. (5) |
| End |
| End |
| Step 7: Calculate The Fitness Function Value Of Each Search Agent |
| Step 8: Update If Better Solution Is There |
| Step 9: T = T +1 |
| End While |
| Step 10: Return |
| End |
The algorithm successfully accelerates the rate of optimization, The WOA’s search methodology also has some advantages in some problems. The data preprocessing and problem formulation steps usually consist of three to four steps. Data imputation step can be added in any stage.
Data preprocessing
We use BoTNeTIoT datasets IoT Dataset For IDS. The dataset is a collection of IoT network traffic data, including both normal and attack samples.
Normalization
Scale numerical features (e.g., using min–max or z-score).
Handling imbalance
Apply techniques like Synthetic Minority Over-sampling Technique (SMOTE) or under sampling to balance classes or address data imbalance. We applied SMOTE (oversampling) to generate synthetic samples for the minority class, as it generally performs better than undersampling by preserving original data while balancing class distribution. Alternatively, undersampling was used when computational efficiency was prioritized or when the majority class had sufficient redundancy. The choice depended on dataset characteristics, Usually SMOTE is preferred for smaller datasets and undersampling for larger, high-redundant data.
Categorical encoding
Convert categorical variables (e.g., protocols) to numerical values.
Problem formulation
Objective
Evolutionary metaheuristic WOA improves performance in each run. To maximize detection accuracy while minimizing false positives and computational overhead.
Solution representation
Each whale’s position vector includes.
Binary components
feature selection (1 = selected, 0 = excluded).
Continuous components
Hyperparameters of the classifier for example kernel parameters of support vector classifier.
WOA steps
After the candidate population initialization, objective or fitness function is applied, like in a typical genetic algorithm. The WOA goes through encircling the prey, Spiraling the bubble and searching for the prey.
Population initialization
Randomly initialize whales with binary (thresholder) and continuous values.
Fitness function
Train a lightweight classifier (e.g., Decision Tree, SVM) using selected features and hyperparameters. Evaluate on validation data using F1-score (balances precision and recall) to handle class imbalance. The result of fitness or objective function is then passed to any lightweight artificial intelligence (AI) classifier. The selected AI classifier solely depend on the type and attributes of the dataset.
First, by actively seeking out its target, the whale progressively gathers crucial knowledge about the prey. The ultimate prey chosen is the algorithm’s ideal result. The whale then approaches the prey by encircling it and spiraling near it.
Encircling the prey
Whales locate their prey at this point and encircle them. Since the ideal location in the search space is unknown in advance, the WOA method assumes that the target prey is the current optimal individual position. Other individuals continue to update their positions as they come closer to the target prey. This ensures that the whales are always in close proximity to their prey through Eqs. (1) and (2). update positions toward the best solution: a, c: coefficients adjusted over iterations.
(1)
(2)
(3)
(4) where X* is the position vector of the best solution found thus far, X is the position vector, T stands for the current iteration, and A and C are coefficient vectors computed using equations. In Eqs. (3) and (4), the components of an are linearly decreased from 2 to 0, and R is a random number (0, 1).
Spiral the bubble (Exploitation)
The program simulates a whale’s continual spiraling towards its target with the prey as the center during the spiral bubble phase. This method allows the goal of catching prey to be achieved while the prey is approached slowly and subconsciously. When a whale spirals around, it first determines how far away its prey is and then moves in a spiraling motion towards it. Equation (5) is the mathematical model. Spiral update simulating bubble-net behavior: choose between shrinking encircling or spiral motion with equal probability.
(5) where is the distance between the ith whale and the best solution found thus far, B is a constant determining the spiral form, and l is a random value in the range [0, 1]. a whale will shrink the radius of the confinement as it circles its prey in the outer circle.
Searching for the prey (Exploration)
The whales utilize the coefficient vector to determine whether they are in the stage of hunting (exploration) or encircling (exploitation). When , the whale is unable to access reliable information about the prey’s location. As a result, it shifts its behavior to exploration, continuously searching for potential prey by navigating random paths in the environment. This behavior is mathematically modeled in Eqs. (6) and (7), where denotes a randomly selected whale position vector.
(6)
(7)
Here, and are coefficient vectors that control the randomness and convergence behavior, respectively. This mechanism ensures sufficient exploration of the search space, particularly when , allowing the algorithm to avoid local optima by favoring global search in early iterations.
Feature selection and model training
Thresholding: In the feature selection phase, continuous feature components are converted into binary values (0 or 1) through a sigmoid-based thresholding operation. Specifically, the transformation is defined as:
Here, denotes the continuous value of the ith feature component, and indicates whether the feature is selected (1) or not (0). This mechanism ensures a probabilistic and differentiable transition from real-valued outputs to discrete feature selections suitable for model training.
Hyperparameter extraction
In this stage, continuous values from the position vector are directly interpreted as model hyperparameters. The position vector is defined as:
The Whale Optimization Algorithm (WOA) utilizes two key coefficient vectors to guide the search process:
Here, is a control parameter that decreases linearly from 2 to 0 over the course of iterations, and is a random vector. This adaptive formulation balances exploration and exploitation, allowing the algorithm to search the hyperparameter space effectively while maintaining sensitivity to promising regions.
By leveraging this mechanism, the proposed method enables the automatic extraction of optimized hyperparameters, contributing to the development of a robust and adaptive IDS tailored for dynamic and resource-constrained IoT environments.
Computational complexity
The computational complexity of the WOA is primarily governed by three parameters: the population size N, the number of iterations T, and the dimensionality of the search space D. The overall time complexity per run can be expressed as:
This reflects the cost of fitness evaluation and position updates for all individuals in the population across all iterations. In terms of space requirements, WOA maintains a population of N candidate solutions, each of dimensionality D, resulting in a space complexity of:
This storage is needed for retaining particle positions and auxiliary coefficient vectors (e.g., , ) used in the update equations.
The mathematical formulation of the proposed algorithm employs conventional symbolic notation, with all variables and operators defined explicitly in relation to their corresponding equations. Each equation is accompanied by descriptive explanations to promote clear understanding of the algorithm’s internal dynamics and the mathematical relationships they represent.
Random forest
For categorization, Random Forest (RF) is employed. an ensemble technique called RF employs a number of classifiers with tree structures. Each tree is constructed using a decision tree technique, using a different bootstrap sample from the original data, and only selecting a small number of features for the split at each node of the tree. An objective estimate of generalization error called Out-Of-Bag (OOB) assessment is carried out on the learning samples that weren’t selected by bootstrapping. After the forest has been constructed, a new sample is given into each tree for classification. Each tree then casts a unit vote for a certain class, indicating its opinion. When compared to traditional ml classifiers, ensemble classifiers are one way to build a powerful classifier with increased classification accuracy. the model’s mathematical expression can be seen in Eq. (8).
(8) where M is the total number of classifiers participating in the classification or vote and J is the number of classifiers participating individually. The benefits of RF in organized data include its superb accurate performance. It can operate on huge datasets with many dimensions and is computationally efficient. Most of the time, it does not overfit, and it is also noise-resistant. Unbalanced datasets can be handled by it.
Experimental setup and matrices for evaluation
A computer running Microsoft Windows 10 or 11 with at least an Intel(R) Core(TM) i7-6500U processor with two cores, four logical processors, and 16 GB of RAM was used to test the performance of the proposed model. Python is used to create feature selection and classification algorithms (version 3.8). Anaconda Navigator is set up on the aforementioned system for the experimental setting. Accuracy, precision, recall, and F1-score matrices were used to evaluate the performance of hybrid evolutionary strategy. WOA is like other metaheuristic evolutionary algorithms. It is always used in hybrid format with ordinary lightweight AI classifiers. It takes into account all candidate solutions, so computationally a bit expensive but ensures perfect cyber security. Confusion matrices provide a visual representation of performance in distinguishing between normal and intruder or malicious node. These evaluation metrics helped in understanding the strengths and weaknesses of each model for the detection of intruder or identification of malicious IoT nodes.
Accuracy: Accuracy measures how closely experimental results match predefined true values. It is calculated as:
(9) where: TP = True Positives, TN = True Negatives, FP = False Positives, FN = False Negatives.
Precision and recall
Precision and recall are key metrics for evaluating classification and information retrieval systems.
-
1.
Precision (measures correctness of positive predictions):
(10)
2. Recall (measures ability to identify all relevant instances):
(11)
F1-score
The F1-score is the harmonic mean of precision and recall, providing a balanced measure:
(12) where: a high F1-score indicates both high precision and high recall. It is useful when class distribution is imbalanced.
Results and discussion
This section describes how to set up an experiment, evaluate a model’s performance using matrices, set up parameters, and then evaluate the outcomes of the experiment.
Simulation results
The simulation results of the suggested technique utilizing the BoTNeTIoT dataset were briefly presented in this section. This work selected the BoTNeTIoT dataset for our model’s training and testing because it is one of the most recent datasets to be gathered in the IoT environment. The BoTNeTIoT dataset was created in 2020. There are 83 network characteristics, 625,783 records and three label features in the entire dataset. Five distinct classes—mirai, scan, DoS, normal, and MITM—are used to group the total number of records. Once more, these classes are further divided into seven subclasses: mirai brute force, mirai HTTP flooding, mirai UDP flooding, scan host port, scan port OS, SYN flooding, and ARP spoofing. These traits are as shown in Table 5. Three different types of label characteristics are present in this dataset: binary, category, and sub-category.
| Attributes of IoTID20 | ||
|---|---|---|
| Feature 1 | Feature 2 | Feature 3 |
| Flow ID | Src IP | Src Port |
| Dst IP | Dst Port | Protocol |
| Timestamp | Flow Duration | Tot Fwd Pkts |
| Tot Bwd Pkts | TotLen Bwd Pkts | TotLen Fwd Pkts |
| Fwd Pkt Len Min | Fwd Pkt Len Max | Fwd Pkt Len Mean |
| Fwd Pkt Len Std | Bwd Pkt Len Max | Bwd Pkt Len Min |
| Bwd Pkt Len Mean | Bwd Pkt Len Std | Active Min |
| Active Max | Idle Mean | Idle Max |
| Flow, IAT Max | Flow, IAT Min | Fwd IAT Max |
| Fwd IAT Tot | Fwd IAT Mean | Fwd IAT Std |
| Fwd IAT Max | Fwd IAT Min | Bwd IAT Tot |
| Bwd IAT Mean | Bwd IAT Std | Bwd IAT Max |
| Bwd IAT Min | Fwd PSH Flags | Bwd PSH Flags |
| Fwd URG Flags | Bwd URG Flags | Bwd Header Len |
| Fwd Header Len | Fwd Pkts/s | Bwd Pkts/s |
| Pkts Len Min | Pkts Len Max | Pkt Len Mean |
| Pkt Len Std | Pkt Len Var | FIN Flag Cnt |
| Active Std | SYN Flag Cnt | RST Flag Cnt |
| PSH Flag Cnt | ACK Flag Cnt | URG Flag Cnt |
| CWE Flag Count | ECE Flag Cnt | Down/Up Ratio |
| Pkt Size Avg | Fwd Seg Size Avg | Bwd Seg Size Avg |
| Fwd Bytes/b Avg | Fwd Pkts/b Avg | Fwd Blk Rate Avg |
| Bwd Bytes/b Avg | Fwd Pkts/b Avg | Bwd Blk Rate Avg |
| Subflow Fwd Bytes | Subflow Bwd Bytes | Subflow Fwd Bytes |
| Subflow Fwd Bytes | Init Fwd Win Bytes | Init Bwd Win Bytes |
| Fwd Act Data Pkts | Fwd Seg Size Min | Active Mean |
| Idle Std | Idle Max | – |
Scan, mirai, DoS assaults, and MITM attacks are the four primary types of attacks. Tables 6 and 7 list these attacks along with their subdivisions.
| Attack category | Subcategories |
|---|---|
| Scan | Host Port OS |
| Mirai | Brute Force, HTTP Flooding, UDP Flooding |
| DoS | Syn Flooding |
| MITM | ARP Spoofing |
| Traffic category | Precision (PR) | Recall (RC) | F1-score |
|---|---|---|---|
| DoS Sync flooding | 1.00 | 0.99 | 1.00 |
| MITM ARP Spoofing | 0.90 | 0.88 | 0.89 |
| Mirai-Ack flooding | 0.34 | 0.49 | 0.40 |
| Mirai-HTTP flooding | 0.36 | 0.36 | 0.36 |
| Mirai-Host brute force | 0.93 | 0.95 | 0.94 |
| Mirai-UDP flooding | 0.86 | 0.75 | 0.80 |
| Normal | 0.96 | 0.95 | 0.95 |
| Scan host port | 0.73 | 0.62 | 0.67 |
| Scan port OS | 0.85 | 0.87 | 0.86 |
Performance evaluation
This section describes how the suggested model’s performance was evaluated. The BoTNeTIoT dataset was employed in the experiment, and the train-test split validation technique was used to thoroughly evaluate the ML algorithms’ performance. BoTNeTIoT has 625,783 occurrences. 30% of the data was utilized to verify the model, while 70% was used for training.
Binary classification performance of BoTNeTIoT dataset
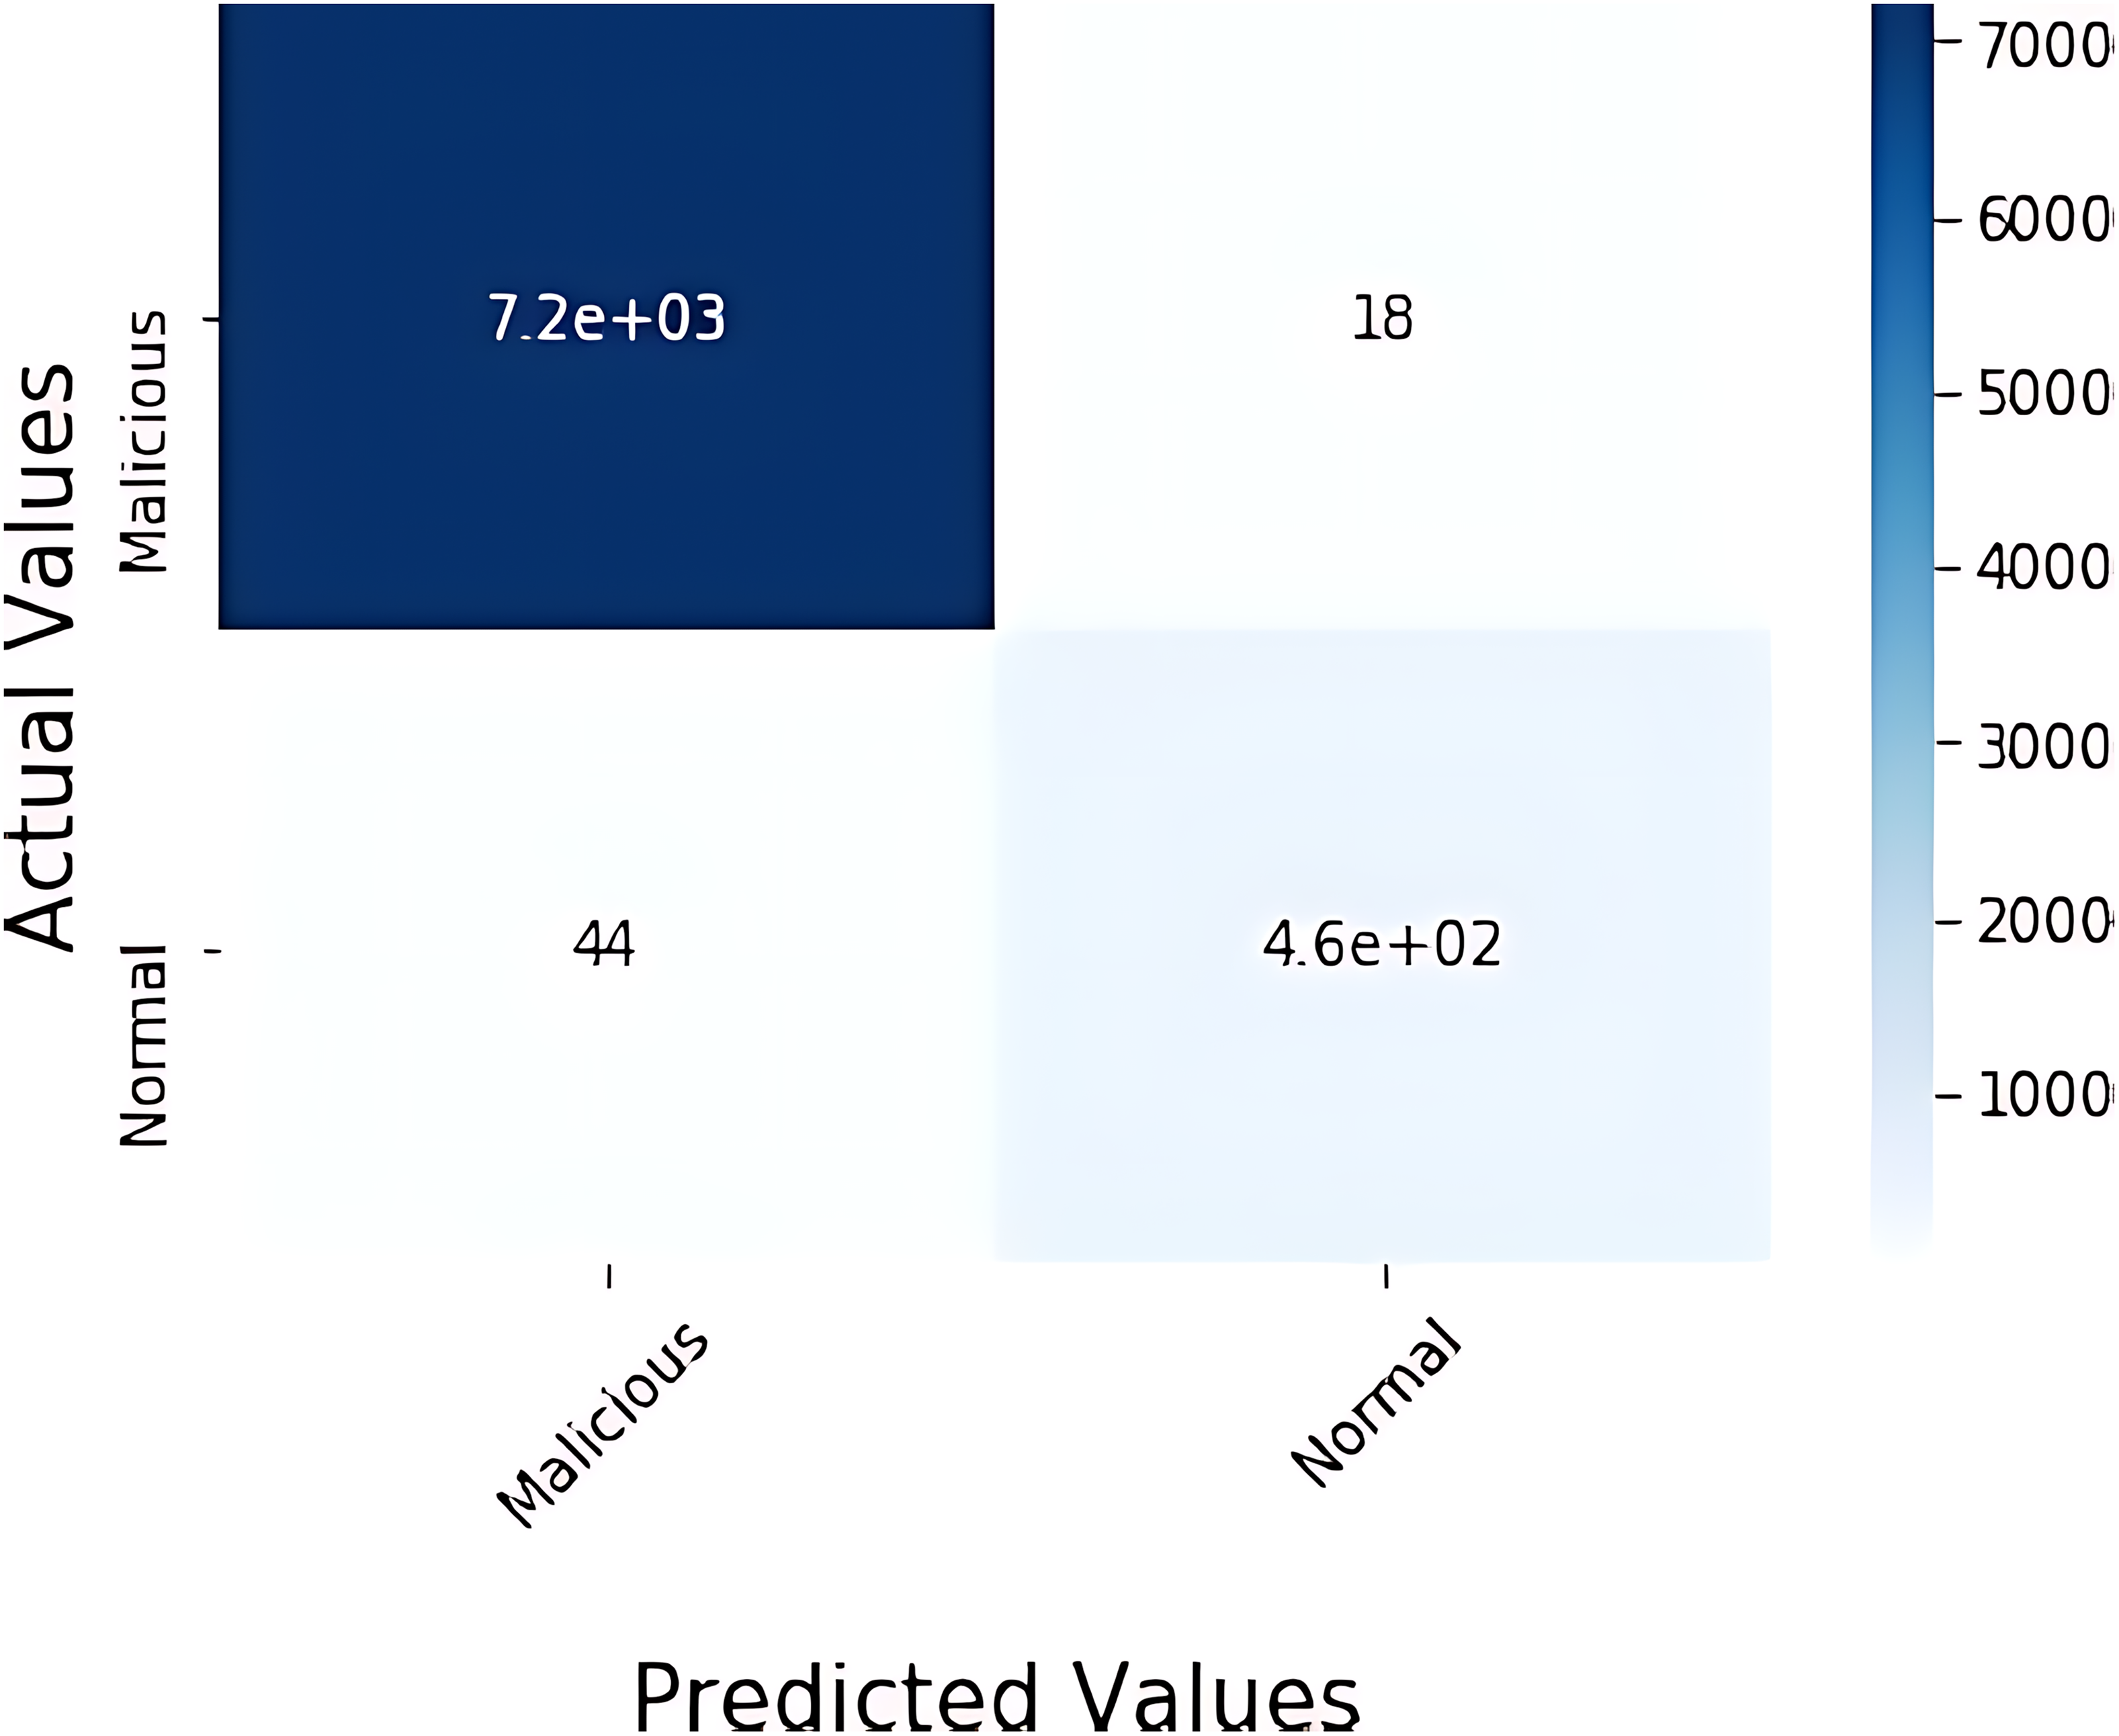
The confusion matrix and convergence matrix for the performance of binary classification on BoTNeTIoT are shown in Figs. 3 and 4.
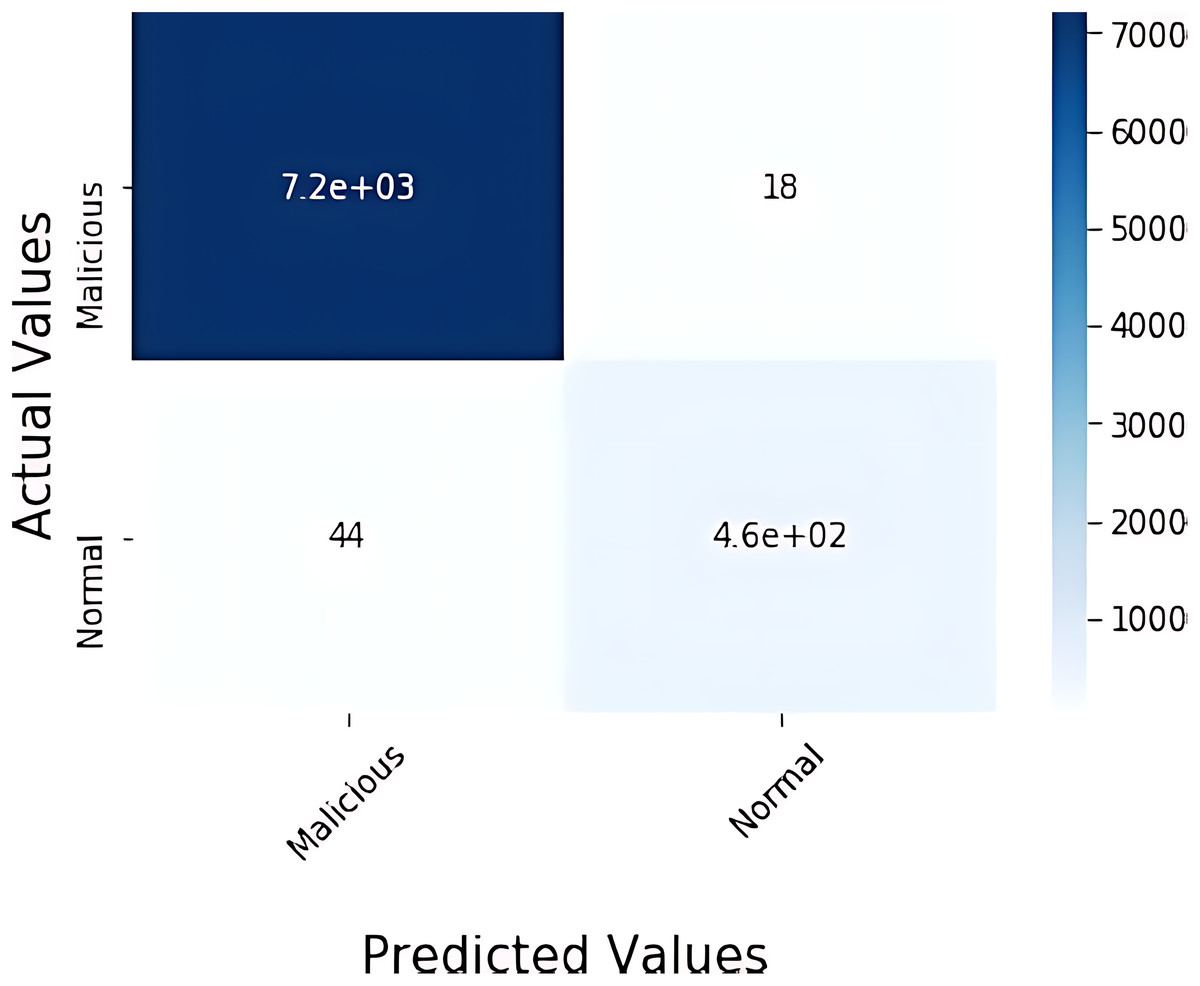
Figure 3: Confusion matrix for binary classification on BoTNeTIoT.
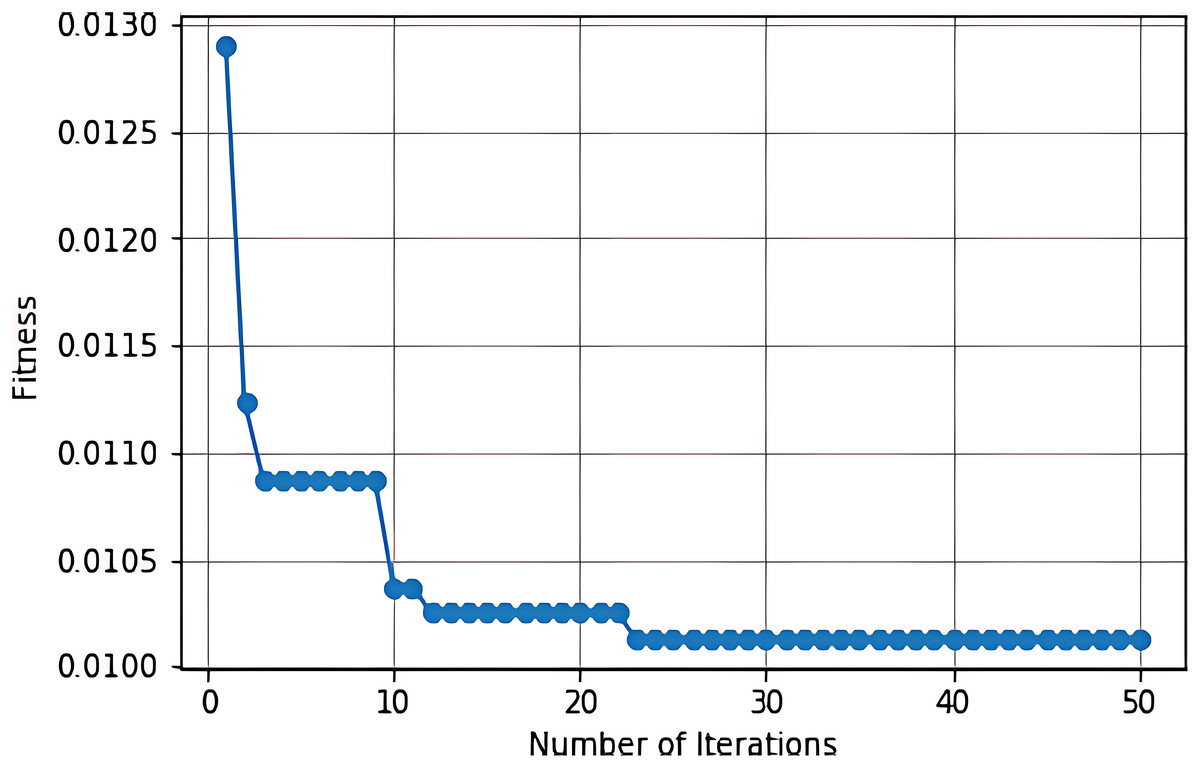
Figure 4: Convergence matrix for binary classification on BoTNeTIoT.
Category classification performance of BoTNeTIoT dataset
The category classification performance for BoTNeTIoT dataset based on the parameters i.e., Pr, Rc and F1-score are shown in Table 7. The confusion matrix and convergence matrix for the performance of category classification on BoTNeTIoT are shown in Fig. 5. The accuracy for the performance of binary classification and category classification on BoTNeTIoT is shown in Fig. 6.
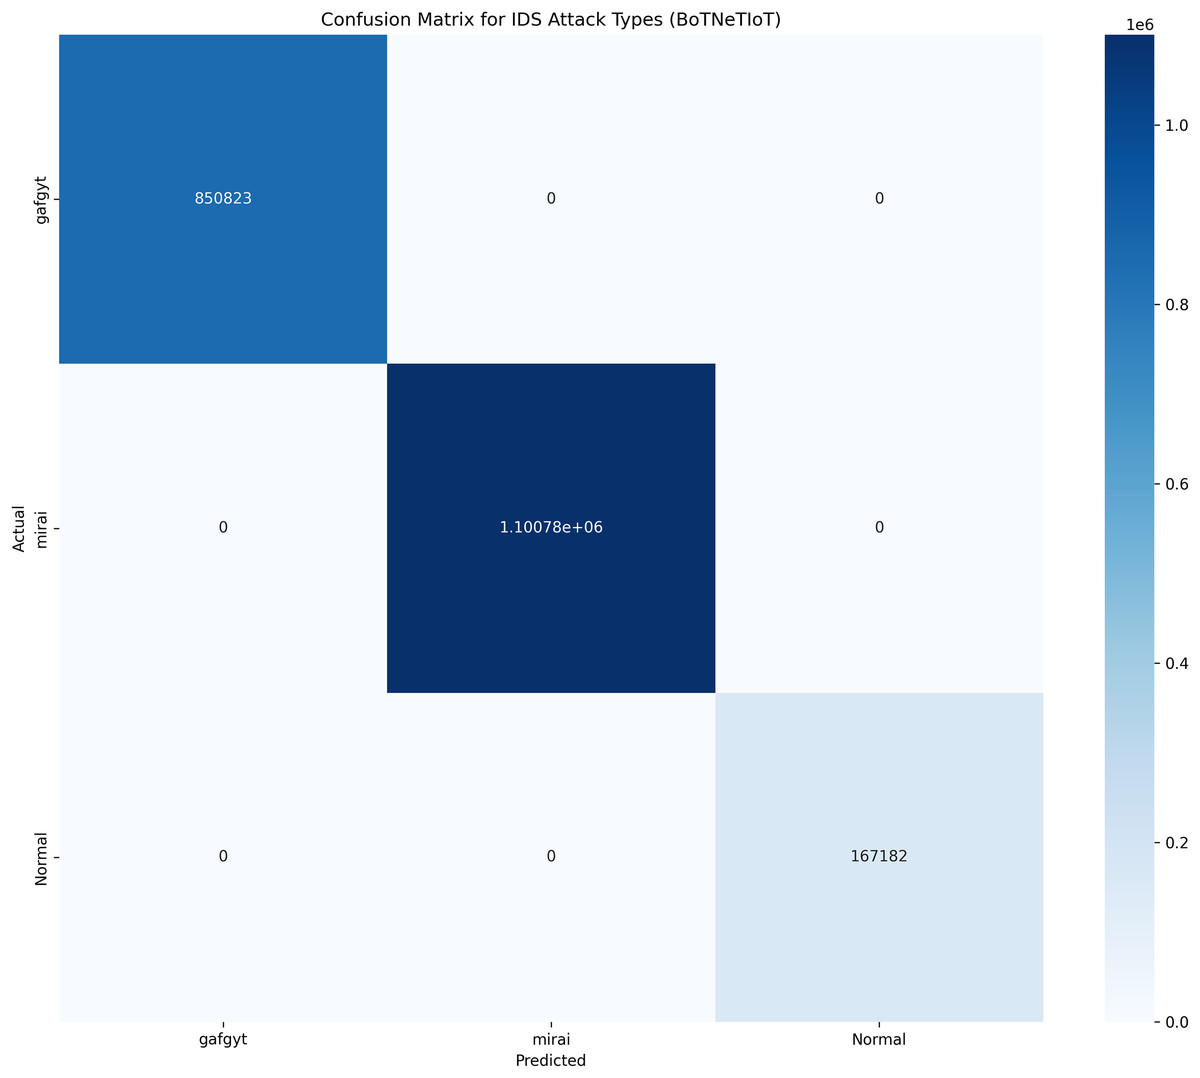
Figure 5: Confusion matrix for category classification on BoTNeTIoT.
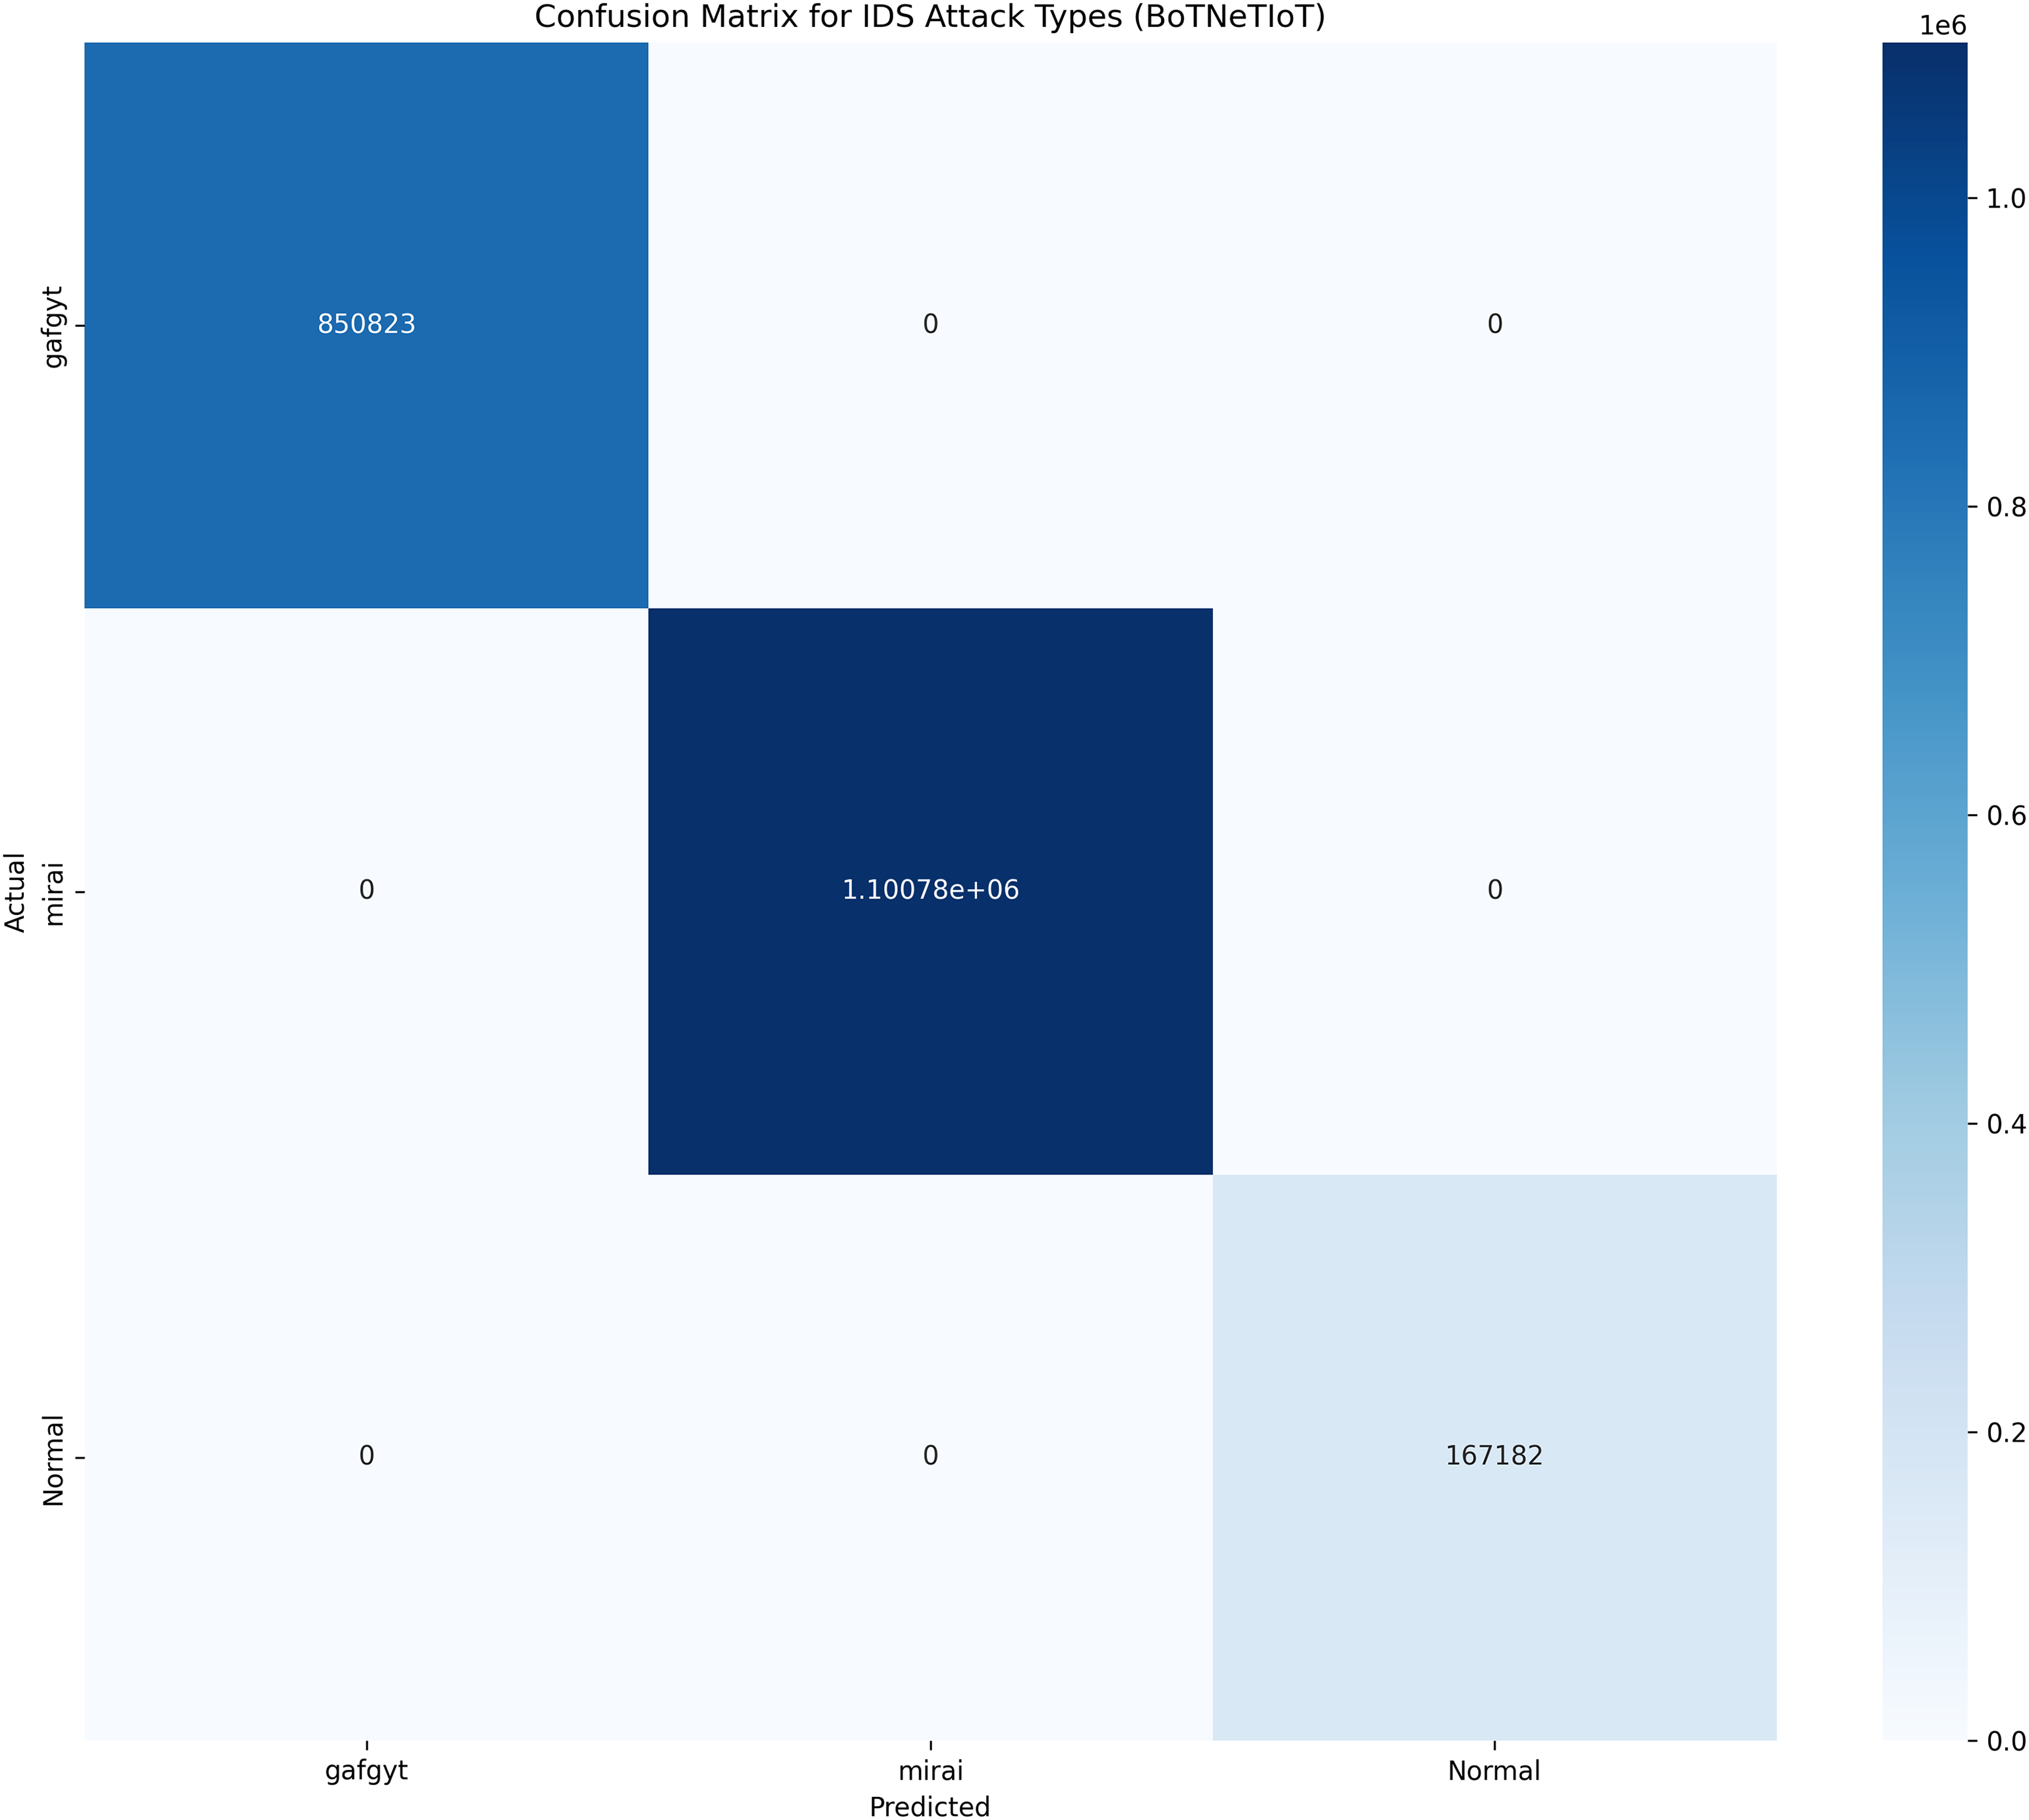
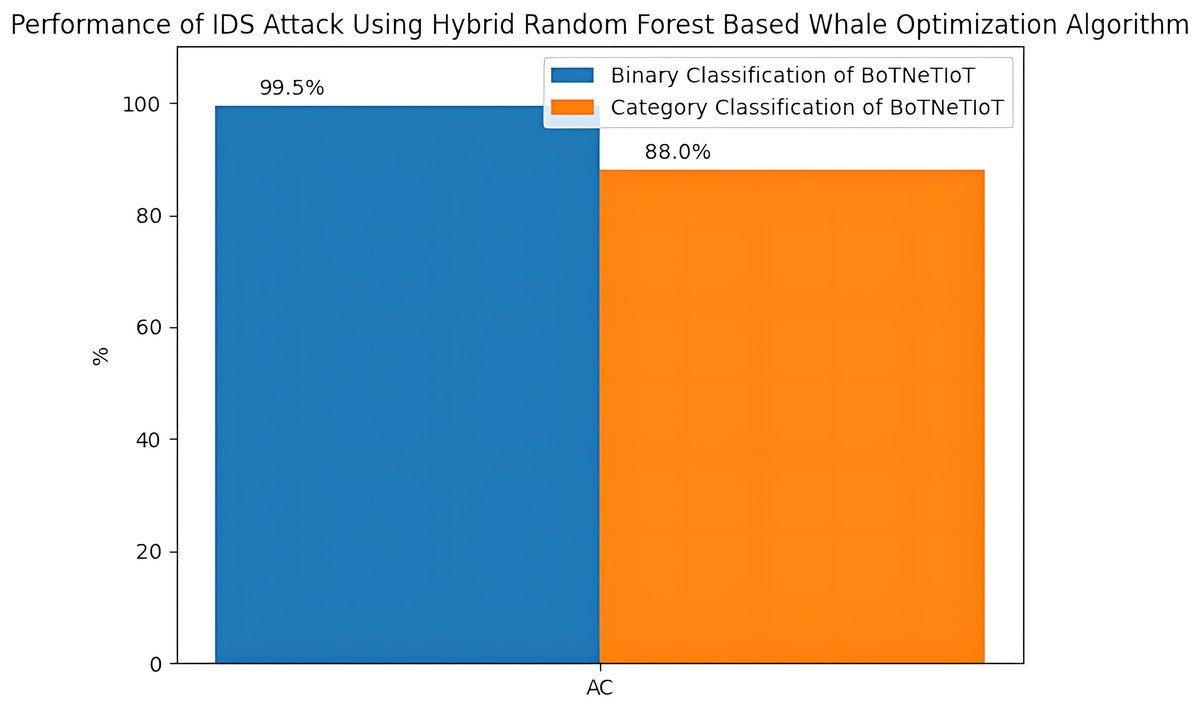
Figure 6: Accuracy for binary and category classification on BoTNeTIoT.
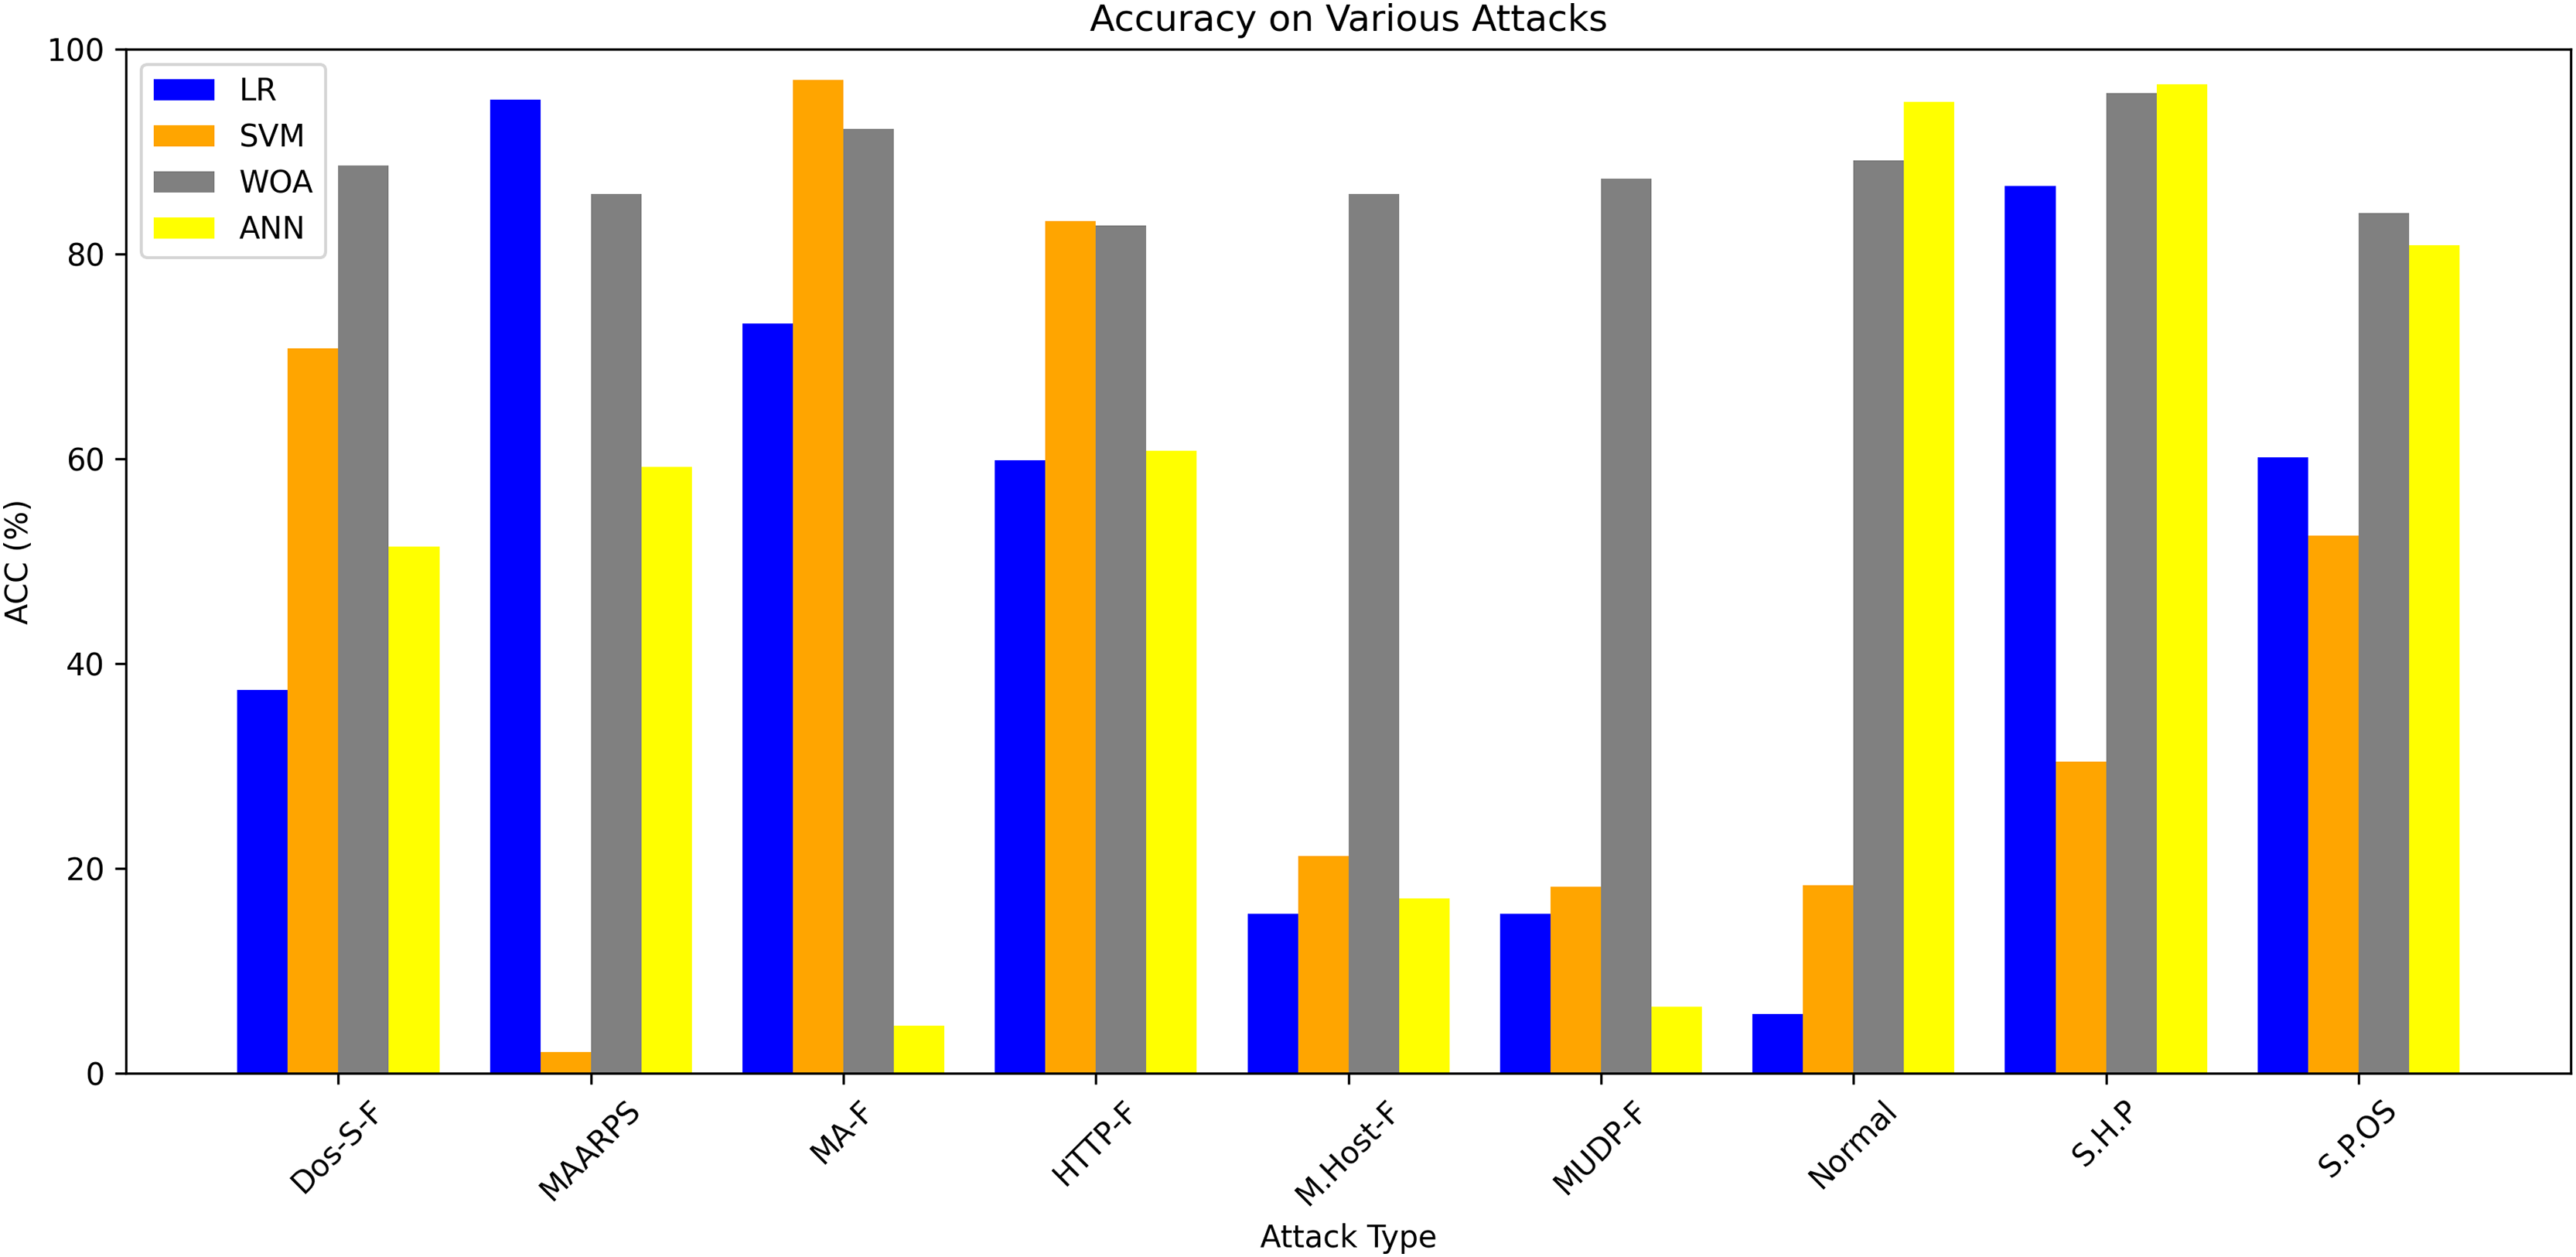
Table 8 shows the performance of four models (LR, SVM, WOA, and ANN) in cases of different kinds of attacks. In some IDS datasets, the types of attacks are not clear. WOA performance is comparatively better than the other three.
| Types of attack | LR (%) | SVM (%) | WOA (%) | ANN (%) |
|---|---|---|---|---|
| DoS-S.F | 100 | 100 | 100 | 100 |
| M.ARP.S | 93 | 92 | 99 | 98 |
| M.A.F | 87 | 87 | 88 | 90 |
| M.HTTP.F | 87 | 87 | 93 | 90 |
| M. Host B force | 87 | 87 | 100 | 98 |
| M. UDP. F | 95 | 95 | 98 | 96 |
| Normal | 97 | 97 | 100 | 100 |
| SHP | 86 | 88 | 96 | 95 |
| S.P OS | 90 | 91 | 98 | 97 |
Figure 7 demonstrates accuracy for each of the four tests carried out using the BoTNeTIoT dataset. These findings demonstrate the viability and effectiveness of our method for identifying malicious and benign (normal) nodes utilizing the four algorithms.
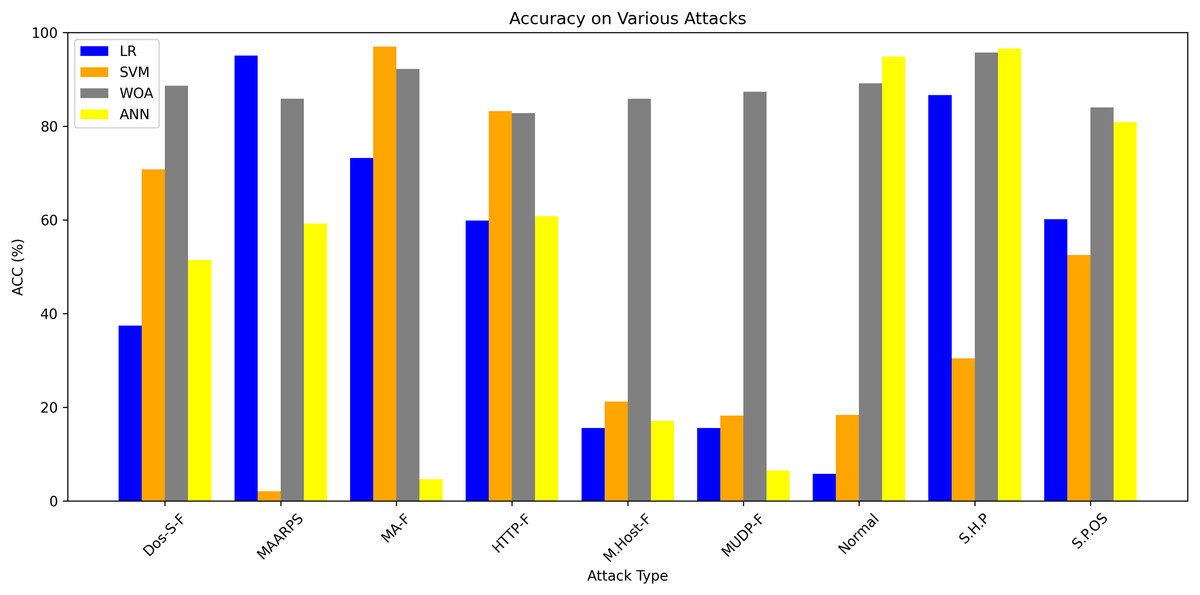
Figure 7: Accuracy comparison of the proposed and other ML techniques.
Figure 8 shows and discusses the ROC curves of (1) LR, (2) SVM, (3) WOA, and (4) ANN. For the three attack types—mirai-ack flooding (M.A.F), mirai-http flooding (M.Http.F), and mirai-udp flooding (M.Udp.F)—the artificial neural network (ANN) model yielded the best detection rate (Dr). However, for MITM ARP spoofing (M.Arp.S), mirai-host brute force (M.Host.B.Force), scan host-port (S.H.P), and scan port OS (S.P.OS), the WOA model yielded the highest detection rate (Dr).
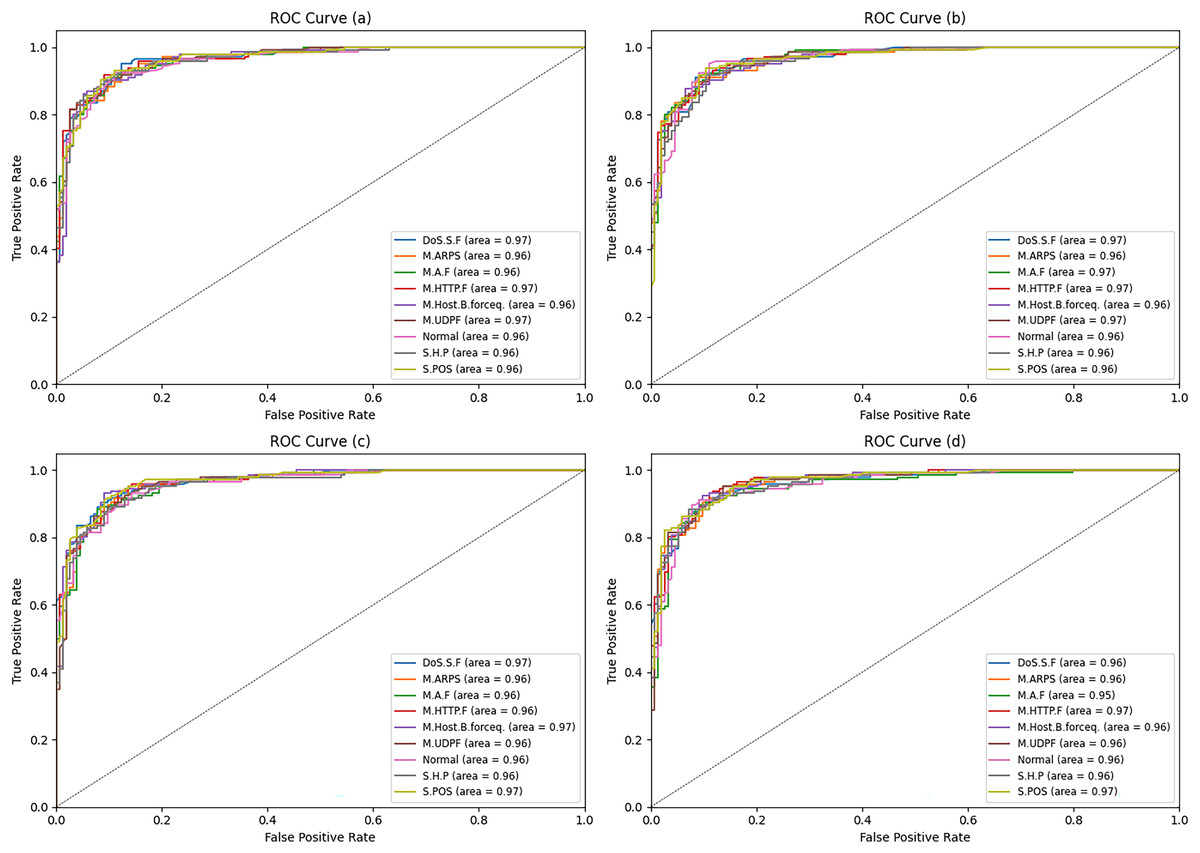
Figure 8: ROC curve for four different ML algorithms.
ROC-AUC is the most important metric.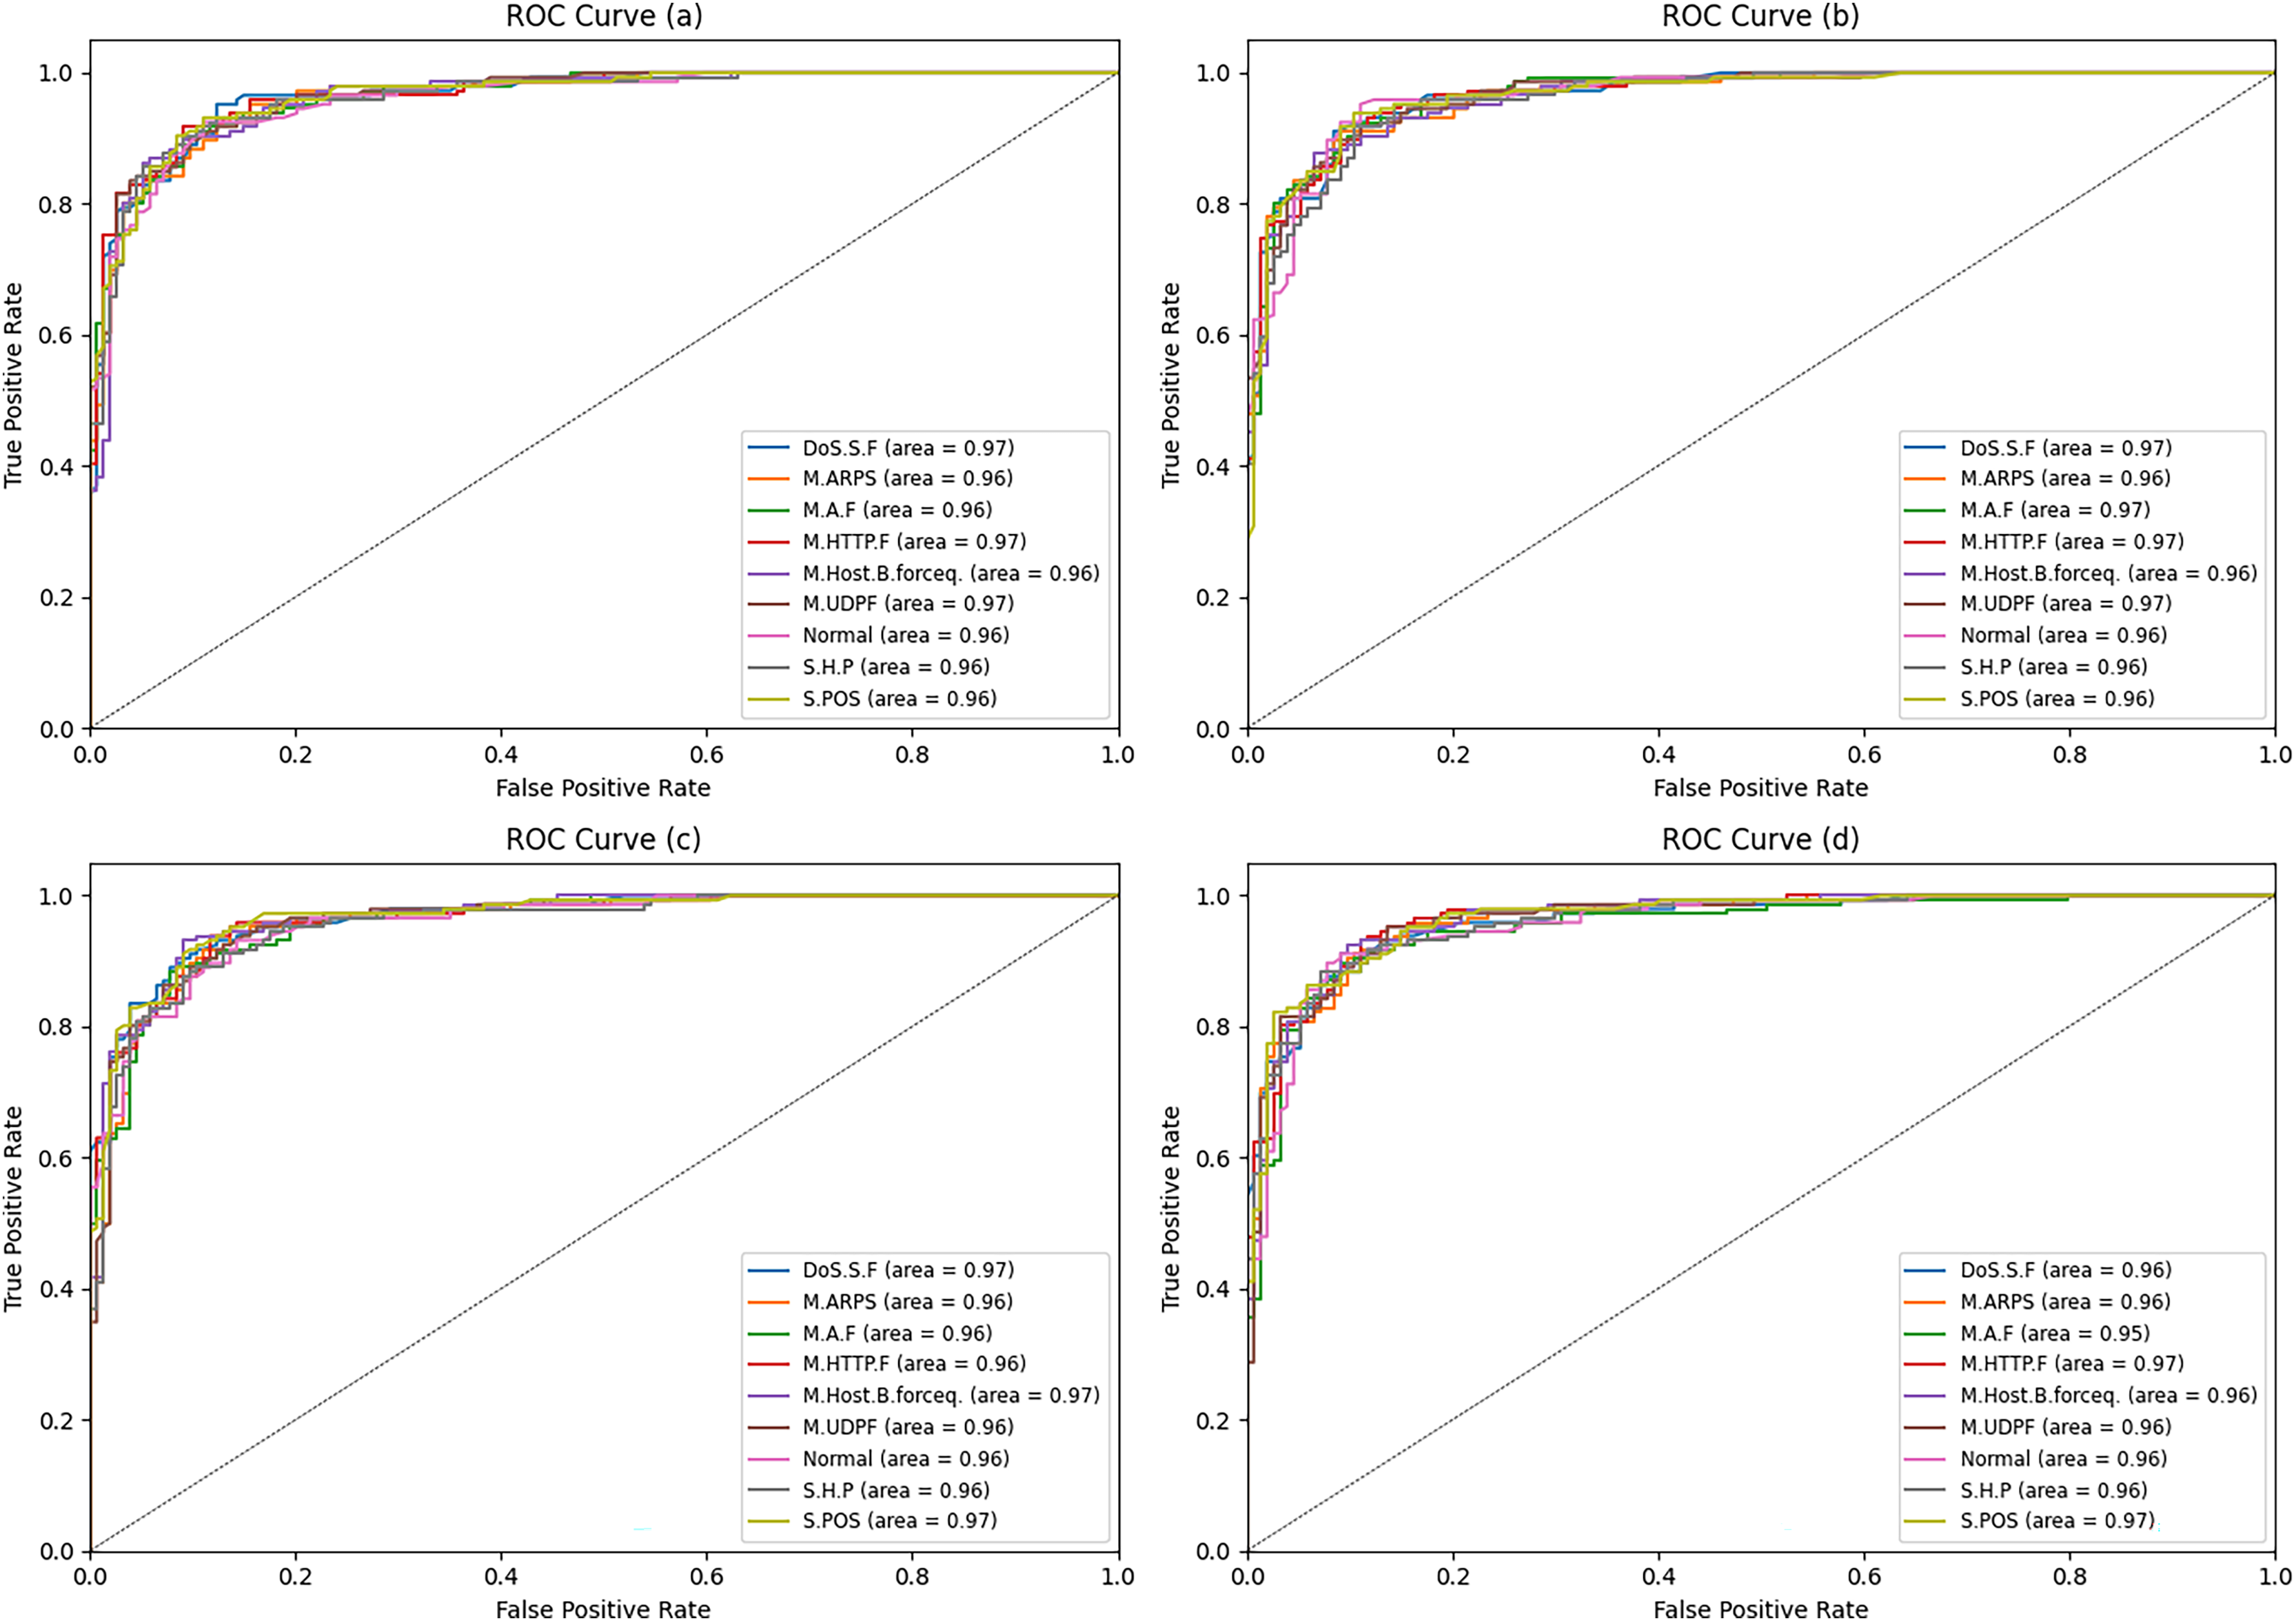
Discussion of overfitting/high scores in Table 8
The near-perfect scores (e.g., 100% for DoS-S.F across all models) in Table 8 may suggest overfitting or data leakage, especially if the test set was not strictly isolated during preprocessing. While high performance on attacks like DoS-S.F could reflect separable features, the consistency of 100% scores warrants scrutiny—particularly for simpler models (logistic regression (LR), SVM) that may lack the complexity to generalize perfectly. For minority classes (e.g., Scan Host Port at 86–96%), the lower but still elevated metrics could indicate imbalance-driven bias, where oversampling (e.g., SMOTE) artificially boosts scores without proportional real-world gains. To validate robustness, future work should include: (1) cross-validation with independent test sets, (2) confusion matrices to check for minority-class overestimation, and (3) synthetic noise injection to test model resilience.
Conclusion
The IoT has transformed traditional living into a more intelligent way of life. It has made it possible for us to remotely manage and observe any smart device. However, because of its straightforward connectivity and the quickly expanding market for smart items and networks, the IoT is especially susceptible to cyber-attacks. Therefore, the main issues for IoT networks are security and privacy. However, the growth of IoT also introduces new security and integrity concerns, particularly with regard to anomalous behavior. Many IDS have been designed to identify and mitigate cyberattacks in IoT networks.
To address this challenge, this work proposes an intelligent anomaly detection system for IoT using a whale optimization based random forest algorithm. Through this proposed approach, the IDS has been designed by using ML techniques to detect anomalies in IoT systems with high accuracy and efficiency. The WOA is used to optimize the hyperparameters of the random forest algorithm, improving its performance in detecting anomalies. Utilizing the IoT network dataset BoTNeTIoT, the efficacy of the proposed method is assessed and contrasted with that of current anomaly detection techniques for IoT.
The results show that the proposed system outperforms existing anomaly detection systems for IoT in terms of accuracy and efficiency. This detection of intruders contributes to the development of effective and efficient anomaly detection systems for IoT, improving the security and reliability of IoT systems in various applications such as smart homes, healthcare, and industrial automation.
The optimal objective function can be categorized as a limiting factor for the detection of IDS in any unseen and real world dataset. The hybrid strategy can be further improved through a relevant fitness function. Genetic algorithms take into account all candidate solutions, making them computationally expensive. The choice of attributes in the dataset for the declaration of an intruder or malicious node changes the choice of relevant computational AI-enabled techniques.