
You Only Look Once 11 (YOLO11) optimization for lightweight and accurate plant detection in uncrewed aerial vehicle imagery
- Published
- Accepted
- Received
- Academic Editor
- Consolato Sergi
- Subject Areas
- Artificial Intelligence, Computer Vision, Neural Networks
- Keywords
- YOLO11, Object detection, Plant detection, Unmanned aerial vehicles, Deep learning
- Copyright
- © 2025 Zhou and Zhao
- Licence
- This is an open access article distributed under the terms of the Creative Commons Attribution License, which permits unrestricted use, distribution, reproduction and adaptation in any medium and for any purpose provided that it is properly attributed. For attribution, the original author(s), title, publication source (PeerJ Computer Science) and either DOI or URL of the article must be cited.
- Cite this article
- 2025. You Only Look Once 11 (YOLO11) optimization for lightweight and accurate plant detection in uncrewed aerial vehicle imagery. PeerJ Computer Science 11:e3322 https://doi.org/10.7717/peerj-cs.3322
Abstract
Detecting plant objects from uncrewed aerial vehicle (UAV) aerial images provides crucial information for applications such as precision agriculture, ecological monitoring, and urban green space management. Optimizing object detection models for this task requires addressing unique challenges, including small object sizes, complex backgrounds, and ensuring lightweight architectures suitable for UAV systems with limited computational resources. YOLO11, the latest official release in the You Only Look Once (YOLO) series, serves as the foundation for our study, where we propose three key modifications to enhance its performance for UAV-based plant detection. First, we add a P2 detection head and remove the P5 detection head to better leverage high-resolution features for small object detection while reducing computational cost. Second, we integrate the convolutional block attention module into the Neck, enhancing multi-scale feature fusion and focusing on critical plant-related features. Third, we replace the original Complete Intersection over Union (CIoU) Loss with Shape-Intersection over Union (Shape-IoU) Loss, improving bounding box regression by incorporating geometric consistency. Additionally, we combine four valuable single-class plant detection datasets into a larger, multi-class dataset, providing a more comprehensive benchmark for UAV-based plant detection. Experimental results on this benchmark indicate a notable reduction in parameter count and computational cost, with accuracy comparable to or marginally higher than state-of-the-art YOLO-based baselines, demonstrating effectiveness in lightweight and resource-constrained scenarios.
Introduction
The use of uncrewed aerial vehicle (UAV) imaging technology to capture real-time aerial images of the Earth’s surface and detect plant species, locations, and quantities has valuable applications in precision agriculture, ecological protection and monitoring, disaster assessment, and urban green space management (Toscano et al., 2024; Lyu et al., 2022; Khan, Gupta & Gupta, 2022; Li et al., 2025). To achieve this, a growing interdisciplinary research focus has emerged, combining deep learning with UAV-based plant detection (Lv et al., 2024; Bai et al., 2023; Jackulin & Murugavalli, 2022). This field leverages large-scale plant image datasets to train deep learning models (Singh et al., 2020; Zou et al., 2020; Lu et al., 2021; Li et al., 2023; Lu et al., 2023; Ye & Yu, 2024), which can be integrated into UAV control systems to identify key plant features (such as maize tassels or cotton bolls) from aerial images, allowing for accurate assessment of plant growth conditions and distribution.
Compared to conventional object detection tasks, plant detection in aerial imagery presents unique challenges for deep learning model optimization (Velusamy et al., 2021; Kaur & Singh, 2022; Cheng et al., 2023; Zou et al., 2023). For example, in the Cotton Boll Detection Augmented (CBDA) dataset (Lu et al., 2023), the cotton bolls to be detected and counted are often partially obscured by dense foliage or appear in tightly clustered formations, leading to ambiguous object boundaries. Detection tasks typically occur in natural environments with complex and diverse backgrounds, such as leaves and branches. Additionally, the small size of the target objects, especially in UAV-captured images, means they occupy very limited pixels in the frame. These distinct visual characteristics and task-specific challenges introduce unique difficulties in dataset construction and model optimization.
To facilitate research in this area, various plant detection datasets have been developed (Singh et al., 2020; Zou et al., 2020; Lu et al., 2021; Li et al., 2023; Lu et al., 2023; Ye & Yu, 2024). In terms of deep learning model design, the dominant approaches can be classified into two-stage detectors (Du, Zhang & Wang, 2020), known for high detection accuracy, and single-stage detectors (Wang et al., 2021), which balance accuracy and computational efficiency. Since the computational resources in UAV control systems are often limited (Cao et al., 2023), the single-stage You Only Look Once (YOLO) family of detectors (Redmon et al., 2016; Sohan et al., 2024), known for its real-time performance and detection accuracy, has emerged as a promising solution, gaining favor among researchers. YOLO11 is the latest official release in the YOLO series, while YOLOv8 is the previous official stable version (Ultralytics, 2023, 2025b; Sohan et al., 2024; Khanam & Hussain, 2024). Additionally, Lu et al. (2023) introduced YOLOv8-UAV, which represents the state of the art in UAV-based plant detection, and leveraged four valuable single-class datasets to advance the field (Lu et al., 2023; Li et al., 2023; Ye & Yu, 2024). However, the relatively small scale and single-class nature of these datasets limit their ability to fully capture the diversity and complexity of UAV-based plant detection tasks, highlighting the need for further dataset integration and expansion.
To sharpen the problem and its motivation, we note two persistent obstacles. First, most available datasets targeting small-object plant detection from UAV imagery are single-class and modest in scale, which hinders standardized, cross-crop evaluation and controlled ablation. Second, although YOLO11 is the latest official iteration of the YOLO family, further lightweighting tailored to resource-constrained UAV deployments remains feasible. This motivates task-oriented adjustments for small-object plant detection that maintain a compact design while delivering accuracy comparable to state-of-the-art methods under reduced compute and memory budgets.
Building on these research trends and the stated motivation, our study proposes several optimizations tailored to the unique challenges of UAV-based plant detection, using the modular architecture of YOLO11. Specifically, we introduce three key improvements to the YOLO11 framework. First, we enhance small object detection by adding a P2 detection head and removing the P5 detection head, a modification referred to as P2 Added and P5 Removed (P2AR). This adjustment allows the model to better leverage high-resolution, low-level feature maps for detecting small plant targets while reducing computational cost. Second, we integrate the Convolutional Block Attention Module (CBAM) (Woo et al., 2018) into the Neck, improving the feature fusion process and enabling the model to focus on critical plant features while suppressing irrelevant background information. Third, we replace the original Complete Intersection over Union (CIoU) Loss with Shape-Intersection over Union (Shape-IoU) Loss (Zhang & Zhang, 2023) to improve bounding box regression by incorporating geometric consistency, particularly for targets with varying shapes and sizes. In addition to these structural enhancements, we make a further contribution by combining four recently published, smaller-scale plant detection datasets (Lu et al., 2023; Li et al., 2023; Ye & Yu, 2024) into a single, larger-scale dataset named Plant4. This dataset integrates diverse plant categories and provides a more comprehensive foundation for training and evaluating models. Ablation studies, comparisons with state-of-the-art methods, and a transfer learning study conducted on the Plant4 dataset demonstrate the effectiveness and robustness of our proposed approach.
Our contributions are four fold:
We propose three key optimizations to the YOLO11 architecture to address the unique challenges of UAV-based plant detection. Specifically, we introduce the P2AR modification to improve small object detection, integrate the CBAM into the Neck to enhance feature fusion, and replace the original CIoU Loss with Shape-IoU Loss to improve bounding box regression by incorporating geometric consistency.
We combine four single-class plant detection datasets to form Plant4, a larger multi-class benchmark. This integration creates a more comprehensive and diverse benchmark for UAV-based plant detection tasks, leveraging the strengths of the original datasets while addressing their limitations in scale and diversity.
We validate the effectiveness of our proposed approach through extensive ablation studies, comparisons with state-of-the-art methods, and a transfer learning study. Results indicate a notable reduction in parameter count and computational cost, with accuracy comparable to or marginally higher than state-of-the-art methods.
We discuss the broader implications and limitations of our work, offering insights for future research on UAV-based plant detection and model optimization.
Related work
Object detection and UAV-oriented adaptions
Object detection is a fundamental research area in computer vision, aiming to accurately and efficiently identify the categories and locations of objects within an image (Trigka & Dritsas, 2025; Dalal & Mittal, 2025). Contemporary detection methods can be broadly categorized into two paradigms: two-stage detectors and one-stage detectors (Alhashmi & Al-azawi, 2025). Two-stage frameworks first generate a set of candidate regions of interest through a region proposal stage, and subsequently refine these proposals in a classification and regression stage to determine object categories and bounding boxes. In contrast, one-stage detectors treat object detection as a unified task that simultaneously performs classification and localization across the entire image (Kang et al., 2025; Alhashmi & Al-azawi, 2025). Owing to these design characteristics, two-stage detectors are renowned for their accuracy but incur substantial computational and memory costs, making them more suitable for resource-rich environments. One-stage detectors, by comparison, are characterized by their lightweight efficiency, which makes them particularly well suited for deployment on resource-constrained platforms such as UAVs (Laghari et al., 2024).
With the rapid advancement of UAV imaging technologies in recent years, object detection from UAV imagery has emerged as an active research topic (Leng et al., 2024; Hua & Chen, 2025). UAV-based detection has demonstrated broad and valuable applications in diverse domains, including smart city management (Shah et al., 2024), traffic monitoring (Butilă & Boboc, 2022), emergency response (Khan, Gupta & Gupta, 2022), and precision agriculture (Toscano et al., 2024). Among the available detection paradigms, the YOLO family has attracted particular attention due to its balance between lightweight efficiency and detection accuracy, which makes it especially well suited for deployment on UAV platforms with limited computational resources (Jiao & Abdullah, 2024). Nevertheless, despite these advances, further optimization remains necessary when adapting YOLO to specific scenarios and tasks where both lightweight design and high accuracy are critical (Dahri et al., 2024; Luan et al., 2024; Hui, Wang & Li, 2024).
In this context, our research focuses on enhancing the latest official YOLO release, YOLO11 (Ultralytics, 2025b), by tailoring it to UAV-based plant detection tasks, where the captured imagery often contains objects with distinctive characteristics such as small sizes, dense distributions, and frequent occlusions (Lu et al., 2023). These challenges demand specialized optimization, and our work emphasizes achieving a better trade-off between lightweight efficiency and detection accuracy under such conditions.
Plant object detection in UAV imagery
UAV-based plant detection at the intersection of aerial imaging and deep learning has drawn sustained attention. Early momentum came from plant disease detection, with PlantVillage (Mohanty, Hughes & Salathé, 2016) and PlantDoc (Singh et al., 2020) providing widely used benchmarks that catalyzed follow-up studies (Pandey et al., 2024; Selvam & Eldho, 2024; Huan, Chen & Zhou, 2025). Building on this line of work, research has increasingly focused on detecting specific plant in UAV imagery. Dedicated datasets have been introduced for cotton boll detection via the Cotton Boll Detection Augmented (CBDA) dataset (Lu et al., 2023), for rapeseed flower detection via the Rape Flower Rectangular Box Labeling (RFRB) dataset (Li et al., 2023), for wheat ear detection via the Wheat Ears Detection Update (WEDU) dataset (Lu et al., 2023), and for maize tassel detection and counting via the MTDC-UAV dataset (Ye & Yu, 2024).
On the algorithmic side, the YOLO family has emerged as a strong choice for resource-constrained UAV platforms, offering competitive accuracy with lightweight inference (Badgujar, Poulose & Gan, 2024). Closest to our study, Lu et al. (2023) introduced YOLOv8-UAV, a YOLOv8-based variant targeting improved small-object plant detection with an efficiency focus. In contrast, our work builds on the latest official YOLO11 architecture (Ultralytics, 2025b) to achieve a smaller parameter count and lower computational cost while maintaining competitive accuracy for UAV-based plant detection. We further harmonize four public single-class UAV plant detection datasets (Lu et al., 2023; Li et al., 2023; Ye & Yu, 2024) into a unified four-class benchmark named Plant4. This consolidation increases class diversity and supports consistent ablation studies and fairer comparisons across crop types within a single evaluation setting.
Method
Method overview
As shown in Fig. 1A, the original YOLO11 model consists of three main components: Backbone, Neck, and Head, which are responsible for feature extraction, multi-scale feature fusion, and object detection, respectively. While YOLO11 demonstrates strong performance in its overall architecture, it still faces certain limitations when handling small objects, multi-scale scenarios, and targets with complex geometric shapes. To address these challenges, we improved YOLO11 by focusing on three key aspects: detection head design, feature enhancement, and loss function optimization. The resulting optimized framework is illustrated in Fig. 1B.
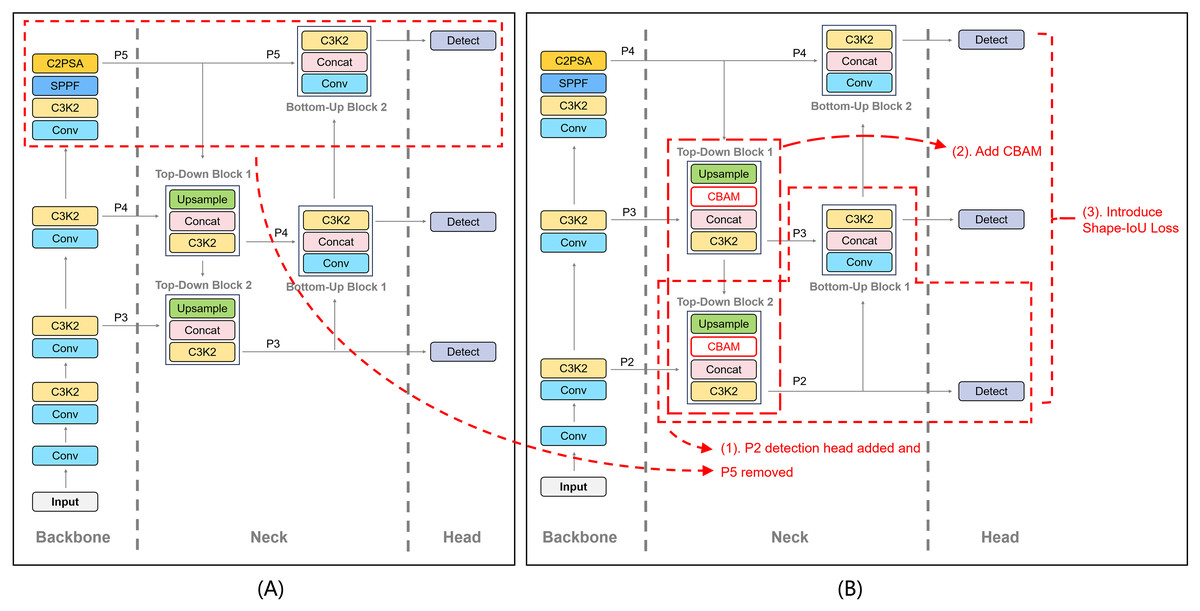
Figure 1: Comparison of the YOLO11 default configuration (A) and the proposed optimization (B).
The dashed boxes highlight the modifications introduced in our method: (1) the addition of a P2 detection head and the removal of the P5 detection head in the Neck to enhance small object detection; (2) the integration of CBAM modules in Top-Down Blocks 1 and 2 to improve feature attention; and (3) the replacement of CIoU Loss with Shape-IoU Loss in the Head to achieve more accurate bounding box regression.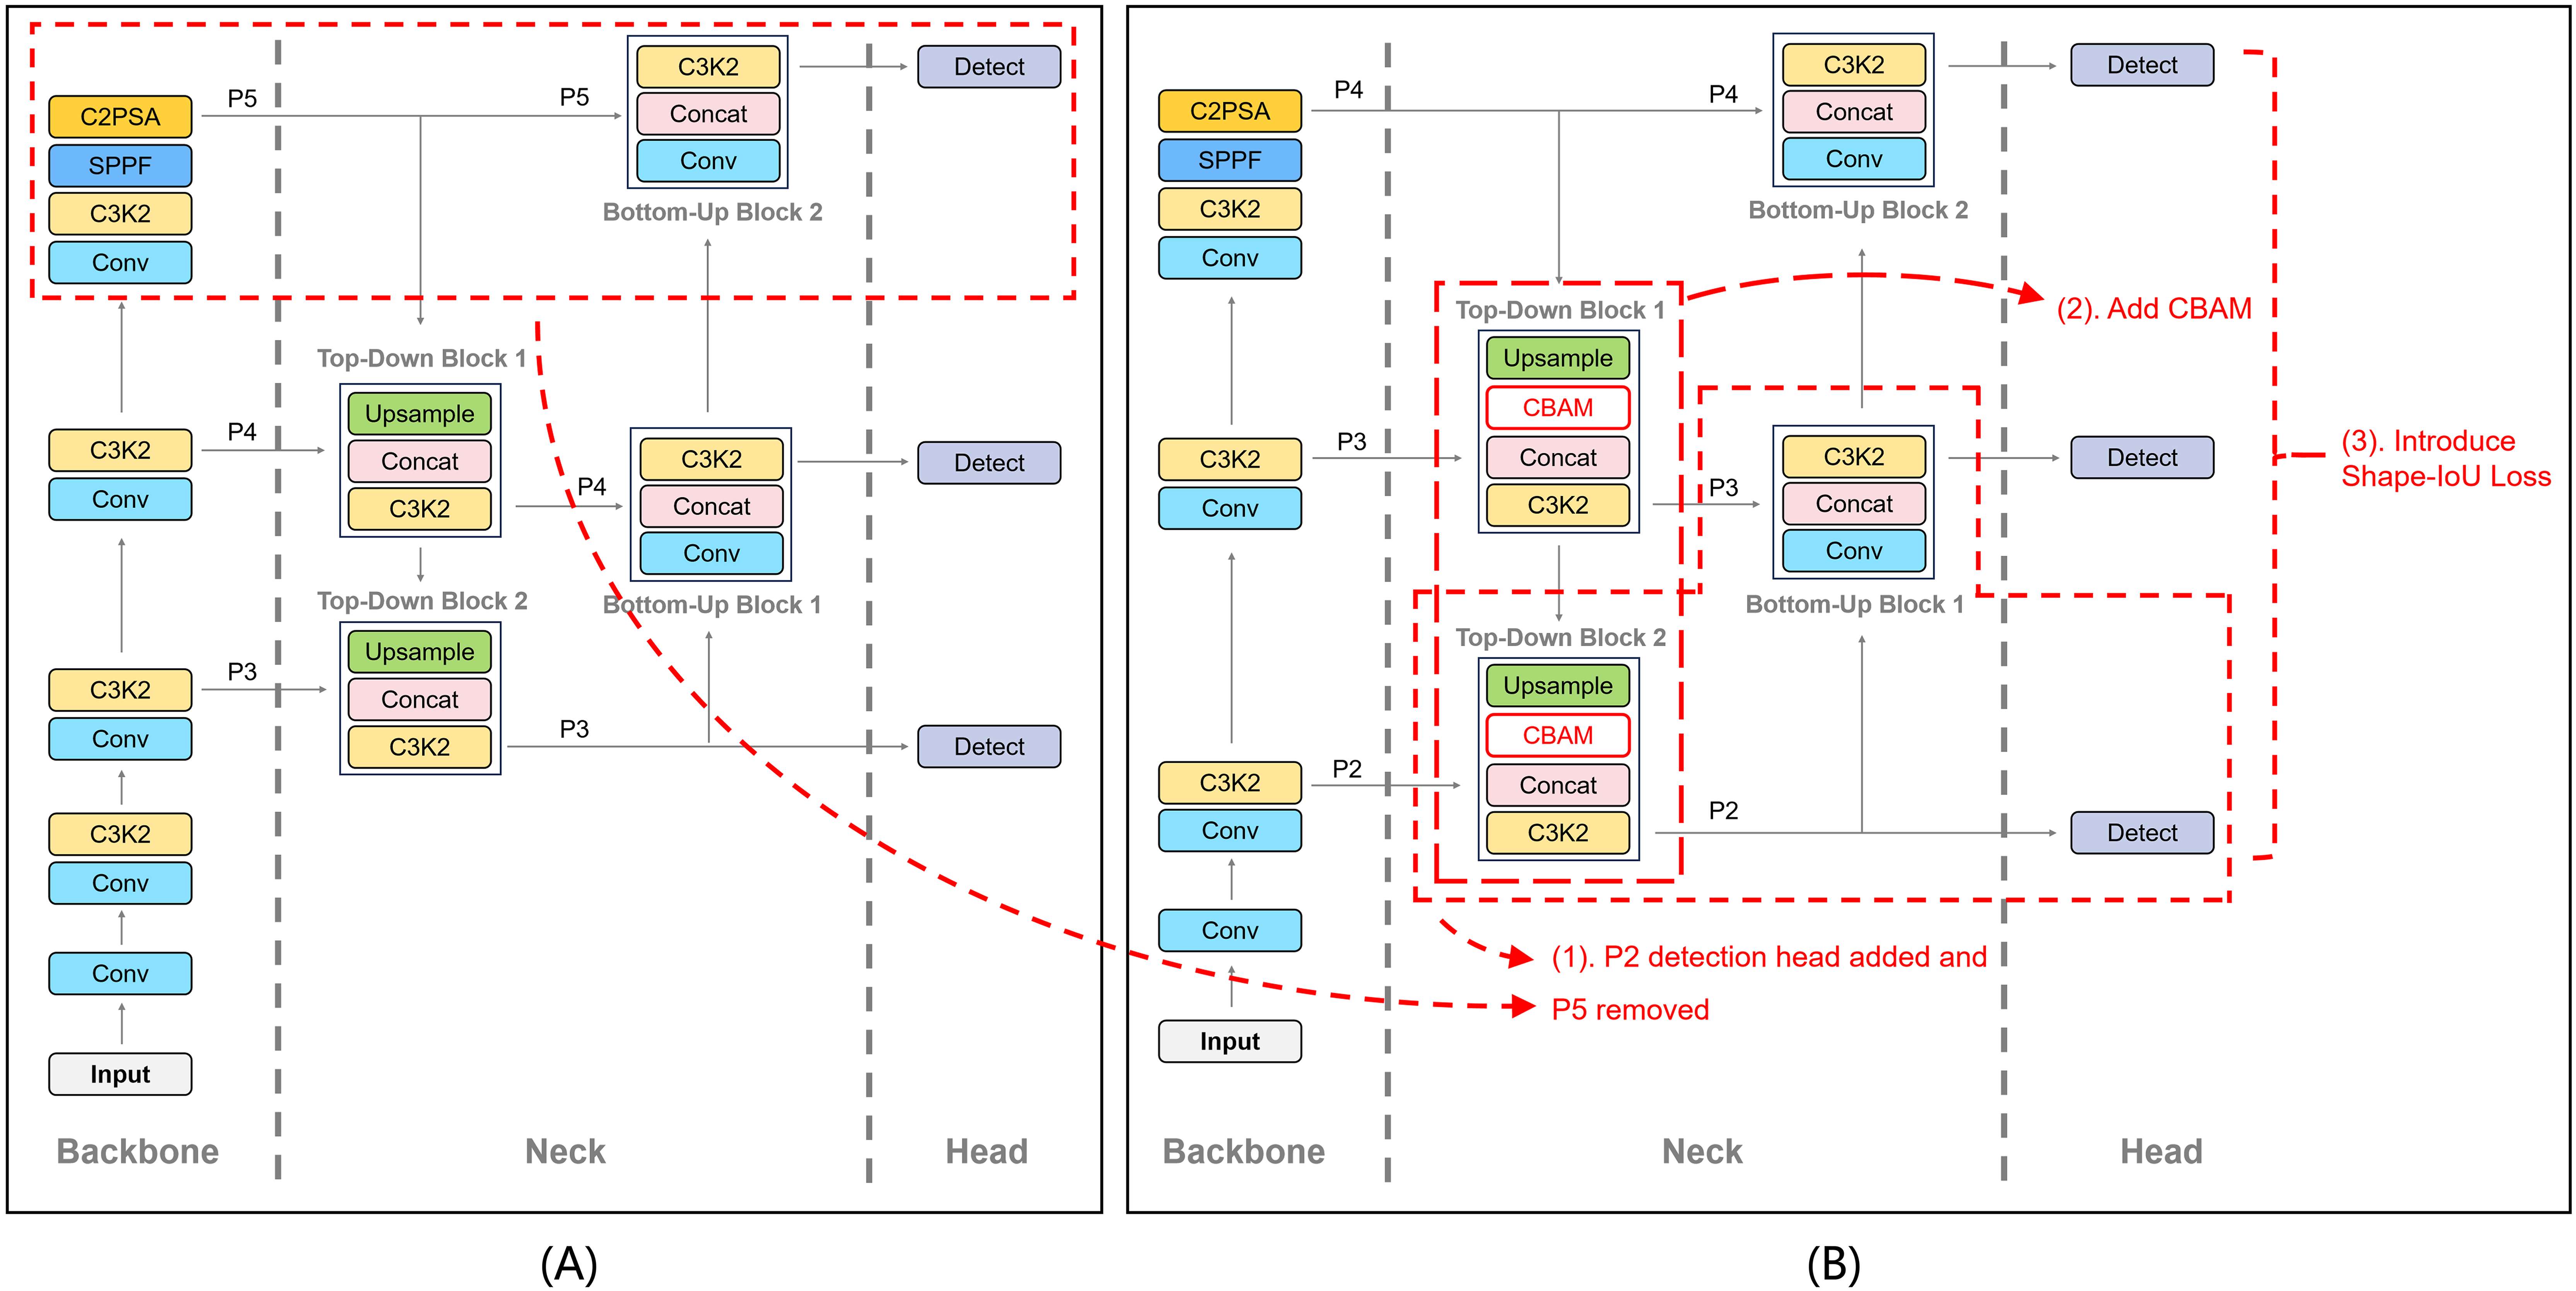
As illustrated in the figure, the first proposed improvement involves removing the original high-level P5 detection head and adding a P2 detection head to enhance the detection capability for small plant targets while maintaining lower computational costs. This modification is referred to as P2 Added and P5 Removed (P2AR) throughout the rest of this article. The second improvement introduces the Convolutional Block Attention Module (CBAM) (Woo et al., 2018) into the Neck to enhance the model’s robustness in detecting small plant targets during the multi-scale feature fusion process. The third improvement replaces the original CIoU Loss with Shape-IoU Loss (Zhang & Zhang, 2023) to further improve detection accuracy.
The detailed descriptions of each improvement are provided in the following sections.
Adding P2 and removing P5 detection heads
In small object detection tasks, high-resolution shallow feature maps typically provide richer positional information and finer details. Based on this observation, we introduced a P2 detection head in the Top-Down Block 2 of the Neck to leverage lower-level high-resolution feature maps, thereby enhancing the model’s ability to detect small objects. Meanwhile, the low resolution and high computational cost of the P5 feature map make it less effective for small object detection. Consequently, we removed the P5 detection head. This design reallocates computational resources to the P2, P3, and P4 detection heads, enabling more efficient and focused detection of small objects.
As illustrated in Fig. 1B, the addition of the P2 detection head was implemented based on the original Neck structure. Specifically, the features from P3 were further upsampled through the Top-Down Block 2, followed by a Cross-Stage Partial with kernel size 2 (C3k2) module and convolutional layers to generate the feature map suitable for the P2 detection head. The final output is the newly introduced P2 detection head. Additionally, to optimize resource allocation, we removed the branch corresponding to the P5 detection head from the Head module, thereby simplifying the overall computational complexity of the model. This adjustment not only enhances the feature extraction capability for small objects but also reduces unnecessary computational overhead.
Adding the P2 detection head is expected to significantly enhance the model’s ability to detect high-resolution small objects, while the removal of the P5 detection head further reduces computational overhead. Specifically, the P2 feature map provides the model with finer-grained information, resulting in clearer object boundaries and more precise localization. Moreover, this optimization strategy does not noticeably impact the detection performance of medium and large objects, as the P3 and P4 detection heads are already capable of effectively capturing the critical features of medium and large targets. The effectiveness of this modification will be experimentally validated in the Experiment section.
Enhancing feature attention with CBAM
Attention mechanisms are widely employed in object detection, as they enable models to focus on significant feature regions, thereby enhancing the representation capabilities of convolutional neural networks. To improve performance on plant detection datasets, our model integrates the Convolutional Block Attention Module (CBAM) (Woo et al., 2018) into the upsampling process of the top-down pathway in YOLO11’s Neck section.
CBAM (Woo et al., 2018) is an attention module that enhances the model’s ability to detect important regions by selectively focusing on crucial features in the input feature map while suppressing less relevant ones. As illustrated in Fig. 2, CBAM comprises two submodules: the channel attention module and the spatial attention module. In our model, CBAM is applied following the upsampling operation, facilitating improved attention to critical features, especially for small targets within the images.
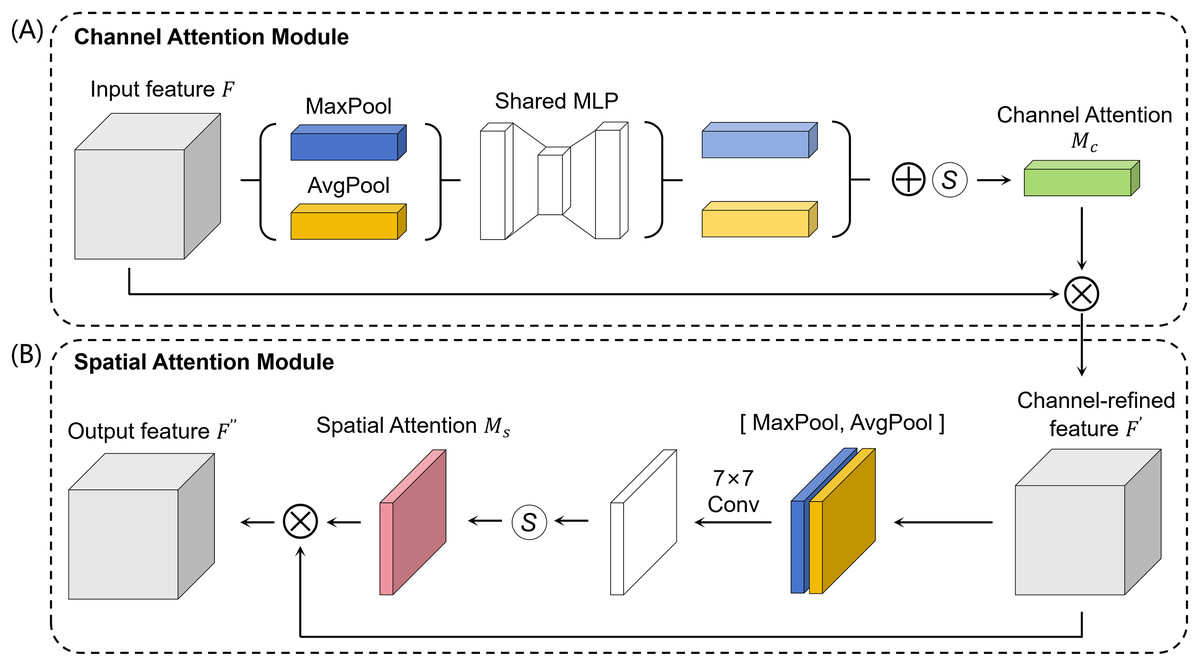
Figure 2: The architecture of CBAM.
CBAM consists of the Channel Attention Module (A) and the Spatial Attention Module (B). The Channel Attention Module enhances important channels by refining feature maps based on spatial context, while the Spatial Attention Module emphasizes key spatial regions by refining feature maps based on channel information.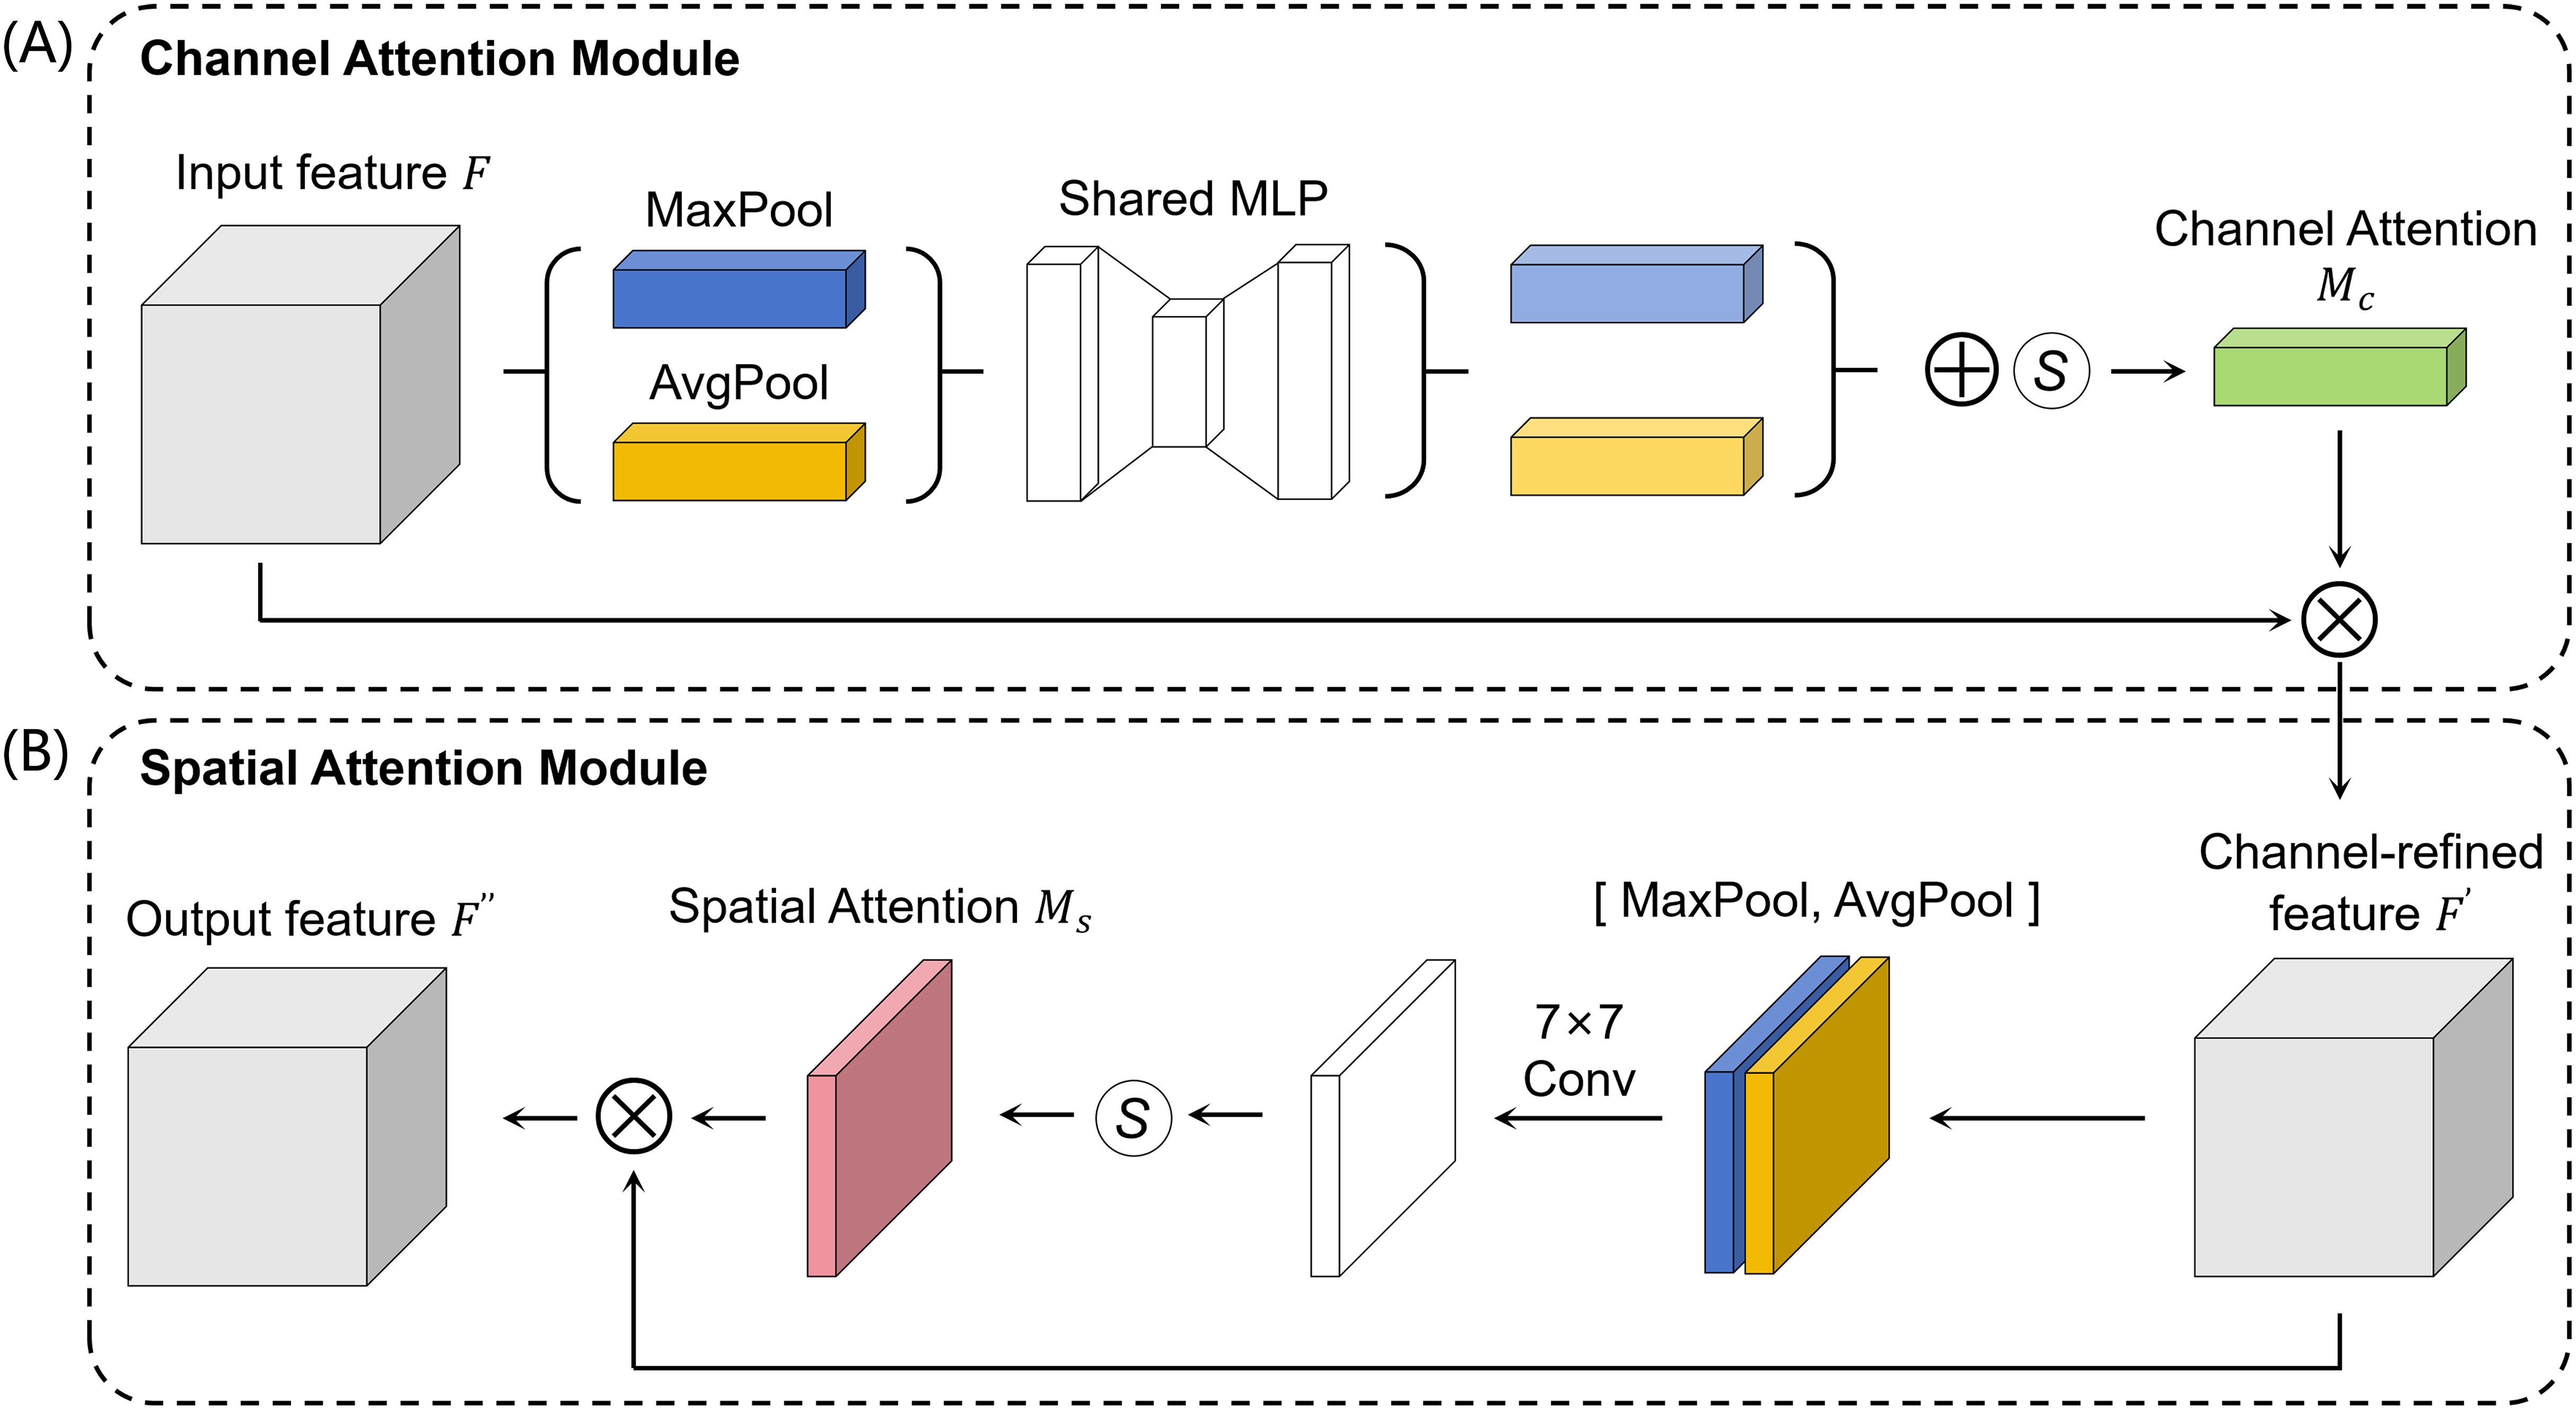
In the channel attention module, spatial information from the input feature map F is aggregated through average-pooling and max-pooling operations, producing two distinct spatial context descriptors. These descriptors are independently processed by a shared multi-layer perceptron, and their outputs are combined element-wise. The result is a channel attention map , which is generated using a sigmoid activation function. This attention map is then multiplied with the input feature map F to yield a refined channel feature map . The channel attention is formulated as:
(1) where denotes the sigmoid function, MLP is a shared multi-layer perceptron, and are the average-pooling and max-pooling operations respectively, and F is the input feature map.
In the spatial attention module, the output feature map undergoes both max-pooling and average-pooling operations to produce two distinct feature maps. These feature maps are then concatenated along the channel dimension and processed with a convolution operation using a filter size of 7, resulting in a single-channel feature map. A spatial attention map is then generated through the application of a sigmoid activation function. Finally, an element-wise multiplication between the spatial attention map and the feature map produces the spatially refined feature map . The spatial attention is computed as:
(2) where represents a convolution operation with the filter size of 7. Then the channel attention map is multiplied with the input feature map F:
(3)
Finally, the spatial attention feature map is subjected to an element-wise multiplication operation with the refined channel feature map :
(4)
By incorporating the CBAM module into the top-down upsampling process within the Neck section of the model, the proposed approach effectively leverages the contextual information present in the image, resulting in enhanced feature representation of the target objects. This integration significantly improves the model’s accuracy and robustness, particularly in detecting small targets in plant object detection tasks.
Enhancing bounding box regression with Shape-IoU loss
Bounding box regression in object detection aims to align the predicted bounding boxes as closely as possible with the ground truth boxes. The default loss function for bounding box regression in YOLO11, CIoU Loss, primarily focuses on the alignment of position, size, and overlap between the predicted and ground truth boxes. However, CIoU Loss lacks sufficient consideration of the geometric consistency of bounding box shapes (e.g., aspect ratios), which may result in suboptimal localization in complex scenarios, especially when target shapes vary significantly. To address this limitation, we propose the introduction of Shape-IoU Loss (Zhang & Zhang, 2023), which further improves regression precision. The principle of CIoU and Shape-IoU Loss is illustrated in Fig. 3A.
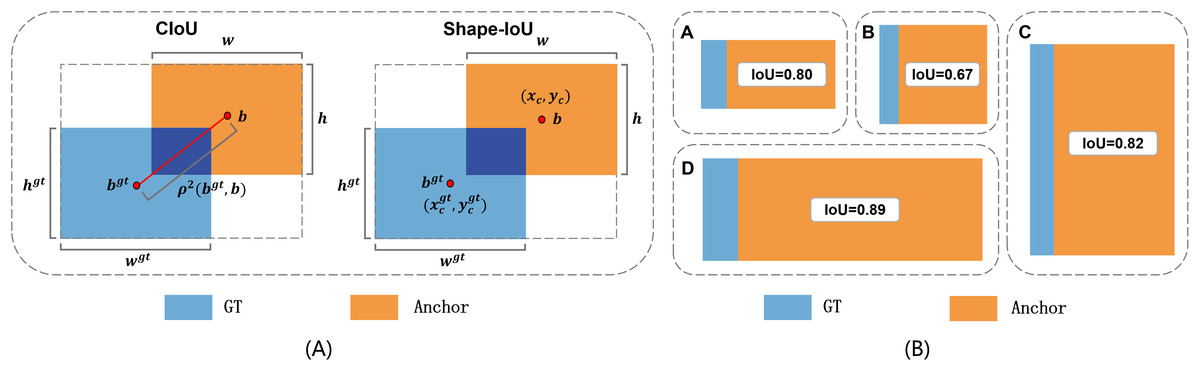
Figure 3: The core principle of Shape-IoU Loss.
(A) Comparison between CIoU Loss and Shape-IoU Loss. (B) Analysis of IoU variations under different conditions.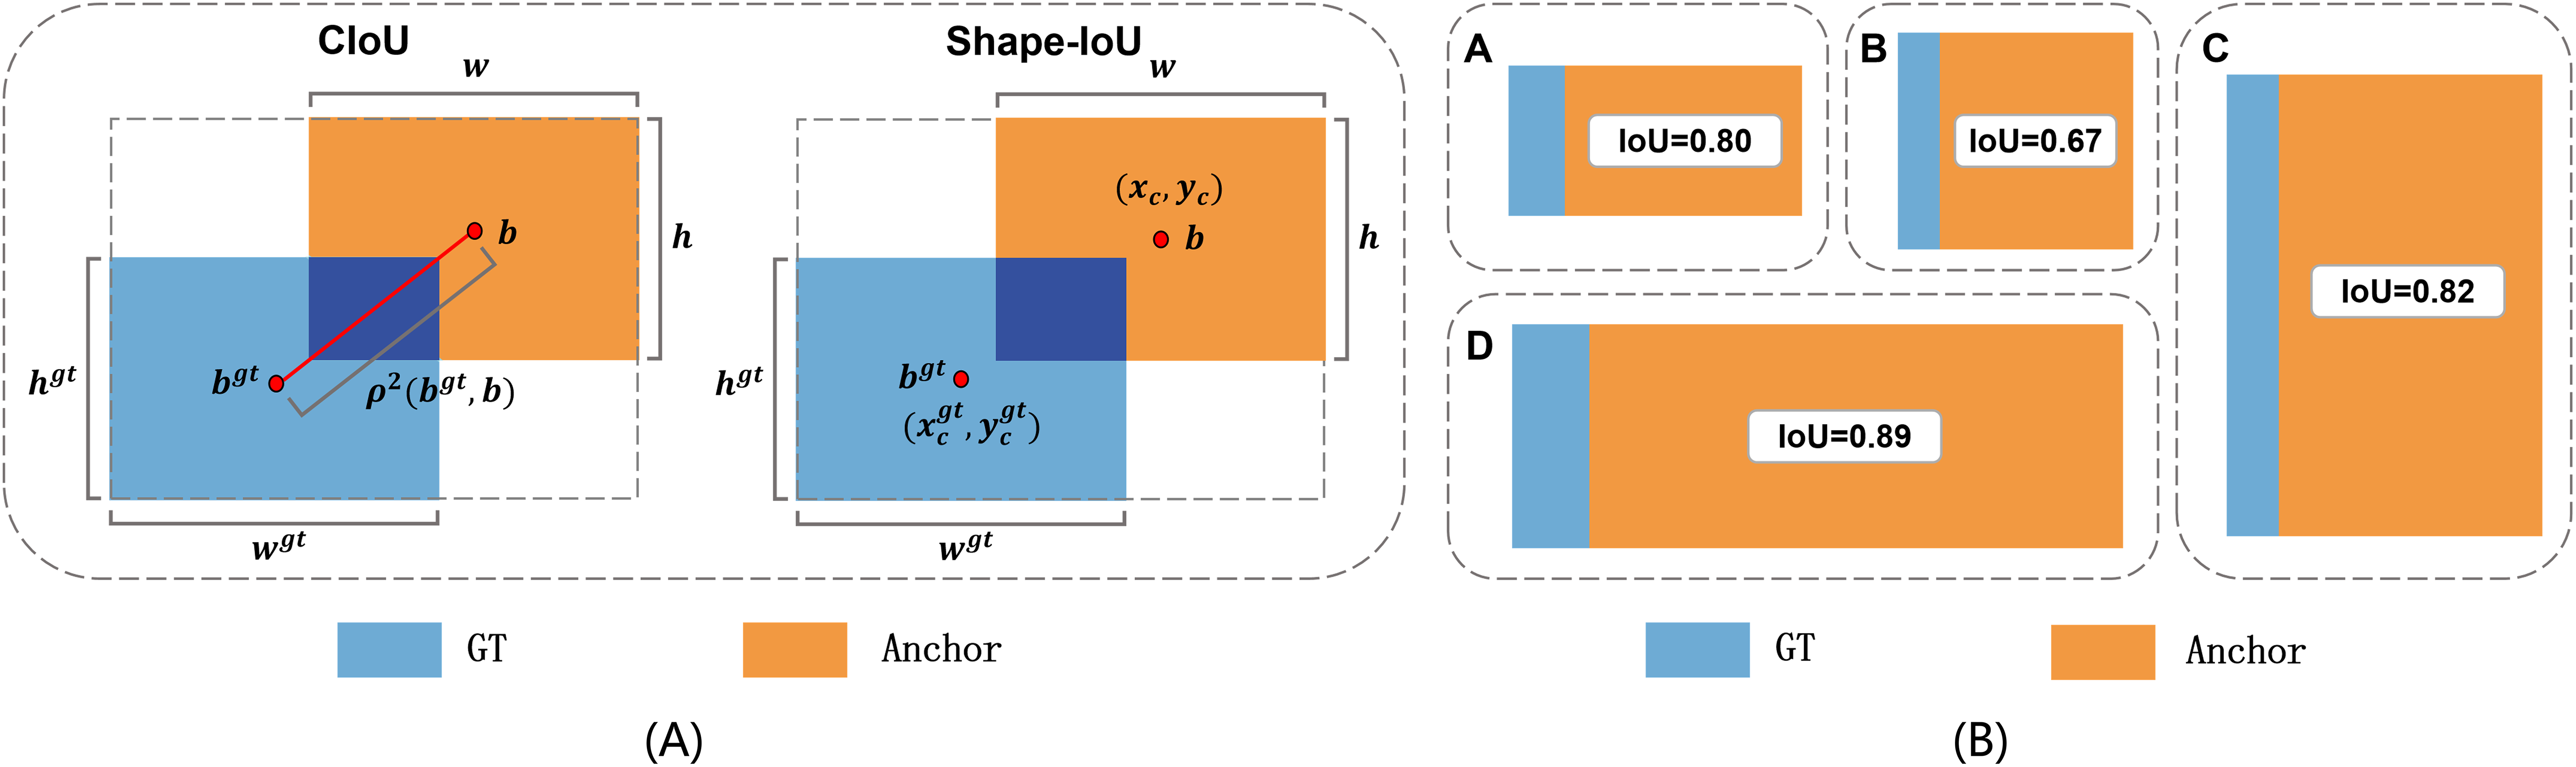
Traditional IoU loss calculates the overlap between the predicted and ground truth boxes, defined as:
(5) where and denote the predicted and ground truth boxes, respectively. The CIoU loss not only measures the overlap between the predicted and ground truth bounding boxes (IoU) but also considers the alignment of their center points and aspect ratios, adding a shape loss term to reduce the difference in their aspect ratios. It is defined as:
(6) where the IoU represents the ratio of the intersection area to the union area between the predicted and target boxes. In Eq. (6), and denote the center points of the predicted and target boxes, respectively, refers to the Euclidean distance between these center points, and is the diagonal length of the smallest enclosing box that covers both the predicted and target boxes. The term is a weighting factor used to balance the impact of the aspect ratio penalty, which is defined as:
(7) where is the aspect ratio penalty term, expressed as:
(8)
Here, and are the width and height of the target box, while and represent the width and height of the predicted box, respectively.
While IoU measures the overlap, it fails to impose constraints on shape consistency. For instance, when two boxes have identical IoU but significantly different aspect ratios, CIoU Loss cannot effectively account for this discrepancy. At the same time, CIoU Loss does not adequately take into account the effect of the inherent properties of the bounding box itself, such as shape and scale, on the regression of the bounding box. As shown in Fig. 3B, all the predicted and target boxes have same biases, with a shape bias of 0, but there are differences in the IoU values. Differences in IoU values between the regions marked as A and B in the figure are due to the different shapes of ground truth boxes, and differences in IoU values between B and C are due to different scalings. In addition, the shape of target boxes has a more significant effect on the IoU values of small-scale bounding boxes compared to large-scale bounding boxes.
Figure 3 illustrates the core concept of Shape-IoU Loss and its impact on bounding box regression. The mathematical formulation begins with the calculation of horizontal and vertical weight coefficients, and , which account for the geometric proportions of the ground truth box:
(9)
Here, and represent the width and height of the ground truth box, while denotes a dataset-specific scaling factor that adjusts for the target’s relative size. These coefficients effectively balance the contributions of horizontal and vertical directions in subsequent computations.
To capture the alignment of shapes, the shape distance term is introduced, defined as:
(10) where and are the center coordinates of the predicted and ground truth boxes, respectively, and represents the diagonal length of the minimal enclosing box. This term penalizes deviations between the predicted and ground truth centers while taking into account the geometric proportions of the target.
The shape alignment component, , further refines the loss by quantifying differences in aspect ratio consistency:
(11) with and defined as:
(12)
Finally, the Shape-IoU Loss is formulated as:
(13)
This loss function simultaneously optimizes bounding box overlap and shape consistency, ensuring superior geometric alignment between predicted and ground truth boxes. Unlike traditional CIoU Loss, which cannot differentiate between boxes with the same IoU but differing aspect ratios, Shape-IoU Loss introduces shape-based constraints, enhancing the precision of bounding box predictions. This is particularly beneficial for detecting small objects or those with highly variable aspect ratios, where accurate localization is critical. By incorporating fine-grained error distribution into the regression process, Shape-IoU Loss significantly improves performance in complex scenarios with diverse object shapes.
The introduction of Shape-IoU Loss improves bounding box regression accuracy without significantly increasing computational overhead. Compared to CIoU Loss, Shape-IoU Loss is better suited for handling targets with diverse geometric shapes, enhancing the model’s generalization performance in varied scenarios. The experimental results in subsequent sections will demonstrate the effectiveness of Shape-IoU Loss in improving model performance.
Experiments
Datasets
To enable the model to effectively learn diverse, multi-class, and cross-domain small object plants as well as various scene characteristics, thereby improving its generalization capability, we combined four publicly available single-class datasets into a larger multi-class dataset. The four single-class datasets used in this process are the Cotton Boll Detection Augmented (CBDA) dataset (Lu et al., 2023), the Maize Tassels Detection and Counting UAV (MTDC-UAV) dataset (Ye & Yu, 2024), the Rape Flower Rectangular Box Labeling (RFRB) dataset (Li et al., 2023), and the Wheat Ears Detection Update (WEDU) dataset (Lu et al., 2023). The combined multi-class dataset is referred to as the Plant4 dataset in this study.
The statistics of the images and instances in each dataset are summarized in Table 1. As shown in the table, the original four single-class datasets suffer from limited image numbers, with three datasets containing only around 100 training images each. Moreover, each of the original datasets includes only a single plant species. The limited image count and the lack of sample diversity may prevent deep learning models from adequately learning diverse features, thereby constraining their generalization capability and diminishing their value for optimization studies.
| Dataset | Img (Tr) | Img (Val) | Inst (Tr) | Inst (Val) | Cls |
|---|---|---|---|---|---|
| CBDA | 120 | 60 | 3,584 | 1,749 | 1 |
| MTDC-UAV | 500 | 300 | 28,531 | 21,460 | 1 |
| RFRB | 127 | 38 | 38,875 | 12,162 | 1 |
| WEDU | 165 | 71 | 20,325 | 9,583 | 1 |
| Plant4 | 912 | 469 | 91,315 | 44,954 | 4 |
Note:
“Img (Tr)” and “Img (Val)” represent the number of training and validation images, respectively. “Inst (Tr)” and “Inst (Val)” denote the number of training and validation instances. “Cls” indicates the number of target classes.
The merged Plant4 dataset consolidates the data from four existing single-class datasets, resulting in a larger and more diverse dataset. By combining these datasets, the total number of images exceeds 1,300 high-resolution samples, with more than 130,000 annotated instances, encompassing four distinct crop scenes and plant species. This increase in dataset size and diversity is expected to address the limitations of the original single-class datasets, such as insufficient image counts and limited sample diversity, which may hinder deep learning models from learning comprehensive features and generalizing. Specifically, the Plant4 dataset integrates four plant categories: cotton, maize, rapeseed, and wheat. The combined dataset exhibits substantial variation in visual appearance, spatial distribution, and object scale across categories, highlighting its potential to support robust model development by leveraging the richness and heterogeneity of the source data.
Although Plant4 aggregates more images and exhibits greater diversity than each source dataset, limitations in scale and balance remain. Specifically, the number of images in Plant4, 1,381, is still modest for training and validation of deep learning models. Given this limitation and to provide a more complete evaluation, the experiments in this section comprise ablation and comparison under a from-scratch regime, complemented by a dedicated transfer learning study.
Moreover, imbalance is evident at both the image and instance levels. Maize images dominate, accounting for 54.8% of the training split and 64.0% of the validation split, while the other three classes each occupy 8.1% to 18.1%. At the instance level, rapeseed contributes a disproportionately large share because individual images contain densely clustered plants, reaching 42.6% in training and 27.1% in validation. Cotton differs in the opposite direction, with few images and sparse occurrences, yielding about 4% of all annotated instances. Such imbalance can induce metric bias and minority underfitting, which are examined further in the Discussion.
Experimental setup and evaluation metrics
To validate the effectiveness of the proposed method, experiments were conducted on a workstation equipped with an Intel i5-14600KF CPU and an NVIDIA RTX 3090 GPU. The models evaluated in the experiments included YOLOv8 (Ultralytics, 2023), YOLO11 (Ultralytics, 2025b), YOLOv8-UAV (Lu et al., 2023), and our optimized model based on YOLO11. The models used in the experiments were modified from the official YOLO project provided by the Ultralytics repository (Ultralytics, 2025a). All implementations were written in Python 3.10 and tested using the PyTorch 2.3 deep learning framework compiled with CUDA 12.1.
In the experiments, ablation studies and comparisons with state-of-the-art methods were conducted under a from-scratch regime in which all models were trained for 300 epochs with a batch size of 8 using Ultralytics defaults, and no pretrained weights were used. To provide a more complete evaluation and reduce potential sensitivity to initialization, a dedicated transfer learning study was also performed: models were first pretrained on COCO (Lin et al., 2014) for 200 epochs under the same defaults, then fine-tuned on Plant4 for 100 epochs with the initial learning rate reduced by half to 0.005. Protocols, data splits, and metrics were kept identical across settings.
The evaluation metrics included the mean average precision at 50% IoU (mAP50), mean average precision across IoU thresholds from 50% to 95% (mAP50−95), model parameters in millions (MParams), and giga floating point operations per second (GFLOPs). These metrics were chosen to comprehensively assess the models’ performance in terms of detection accuracy and computational cost. The following paragraphs provide detailed explanations and mathematical definitions of these metrics.
-
mean average precision at 50% IoU (mAP50): mAP50 represents the mean average precision (AP) across all categories at a threshold of 50% Intersection over Union (IoU). It evaluates the model’s ability to correctly localize objects when the predicted bounding box overlaps with the ground truth by at least 50%.
(14) where N represents the total number of object categories.
-
mean average precision at 50–95% IoU (mAP50−95): mAP50−95 is a more stringent evaluation metric that averages AP across multiple IoU thresholds, ranging from 50% to 95% in increments of 5%. This provides a more comprehensive evaluation of the model’s localization performance across various levels of overlap.
(15) where represents the IoU thresholds.
-
Model parameters (MParams): MParams quantify the total number of trainable parameters in the model, scaled to millions. A lower MParams value indicates a more lightweight model, which is essential for applications in resource-constrained devices such as drones or edge computing systems.
(16) where the total number of parameters represents the sum of all trainable weights and biases in the model.
-
Giga floating point operations per second (GFLOPs): GFLOPs measure the computational cost of a model by quantifying the total number of floating-point operations it performs, scaled to billions. A lower GFLOPs value indicates a more computationally efficient model, which is critical in resource-constrained environments like UAV systems.
(17) where FLOPs is the total number of floating-point operations required to process a single input.
These metrics provide a comprehensive evaluation of both detection accuracy and computational efficiency.
Ablation study
In order to validate the effectiveness of the proposed improvements described in the Method section, we conducted ablation experiments using the YOLO11s model as our baseline. Table 2 presents the results. In this table, “P2AR” denotes “P2 Added and P5 Removed”, indicating that a P2 detection head was introduced while the P5 detection head was removed from the original YOLO11 framework. Meanwhile, “CBAM” and “Shape-IoU” refer to incorporating the Convolutional Block Attention Module into the YOLO11 neck and replacing the default CIoU loss with the Shape-IoU loss, respectively.
| P2AR | CBAM | Shape-IoU | Cotton | Maize | Rapeseed | Wheat | mAP50 | mAP50−95 | MParams | GFLOPs |
|---|---|---|---|---|---|---|---|---|---|---|
| 67.5 | 75.4 | 83.5 | 92.0 | 79.6 | 41.7 | 9.4 | 21.3 | |||
| ✓ | 68.6 | 77.5 | 84.0 | 92.1 | 80.6 | 43.4 | 3.1 | 24.4 | ||
| ✓ | ✓ | 69.3 | 77.2 | 83.7 | 91.2 | 80.4 | 43.0 | 3.2 | 24.5 | |
| ✓ | ✓ | 75.9 | 77.0 | 83.5 | 92.1 | 82.1 | 43.2 | 3.1 | 24.4 | |
| ✓ | ✓ | ✓ | 75.9 | 78.0 | 83.5 | 91.6 | 82.3 | 43.8 | 3.2 | 24.5 |
| Diff v.s baseline | (+8.4) | (+2.6) | (0.0) | (−0.4) | (+2.7) | (+2.1) | (−6.2) | (+3.2) | ||
Note:
P2AR: removes the P5 detection head and adds a P2 detection head; CBAM: incorporates a Convolutional Block Attention Module into the neck; Shape-IoU: replaces the default CIoU loss with Shape-IoU loss.
As shown in the table, incorporating the P2 detection head while removing the P5 head results in a substantial reduction in the YOLO11 model’s parameter count, decreasing from 9.4 to 3.1 MParams, a 67% reduction. Although the computational cost, measured by GFLOPs, slightly increases from 21.3 to 24.4, the overall accuracy (mAP50−95) improves from 41.7 to 43.4. In summary, the P2AR modification successfully reduces parameter overhead while maintaining a comparable computational load, ultimately enhancing the model’s accuracy and achieving a more lightweight design.
When introduced on top of the P2AR scheme, CBAM alone does not provide additional performance gains. In contrast, adding Shape-IoU alone to the P2AR configuration leads to a marked improvement in detecting Cotton, elevating its AP50 score from 68.6 to 75.9. Furthermore, incorporating both CBAM and Shape-IoU simultaneously on top of P2AR not only yields noticeable improvements for Cotton and Maize detection but also achieves the highest mAP among all evaluated models.
In summary, the YOLO11 model incorporating P2AR, CBAM, and Shape-IoU simultaneously achieves a substantial and indisputable reduction in parameters while incurring only a slight increase in GFLOPs. This trade-off results in improved accuracy, thereby demonstrating the effectiveness of our proposed optimization strategies. In the next section, we will present a comprehensive comparative study that evaluates the model’s performance across various parameter and computational scales against state-of-the-art approaches, further substantiating its suitability from a lightweight and accuracy-balanced perspective.
Comparison with state-of-the-art methods
To comprehensively evaluate the effectiveness of the proposed optimization method in terms of both lightweight design and accuracy, we selected YOLOv8 (Ultralytics, 2023), YOLO11 (Ultralytics, 2025b), and YOLOv8-UAV (Lu et al., 2023) as reference baselines and conducted experiments on the Plant4 dataset. YOLO11 represents the latest official stable release in the YOLO series, while YOLOv8 is the previous official version. YOLOv8-UAV, on the other hand, is a specialized variant of YOLOv8, optimized by Lu et al. (2023) specifically for detecting the four small plant targets included in the Plant4 dataset.
In our experiments, we trained each model in four different variants—“n,” “s,” “m,” and “l”—representing a progression from lightweight to more complex configurations. The scaling of model parameters from “n” to “l” follows the official configuration provided by Ultralytics (Ultralytics, 2025a). The experimental results are summarized in Table 3.
| Model | Cotton | Maize | Rapeseed | Wheat | mAP50 | mAP50−95 | MParams | GFLOPs |
|---|---|---|---|---|---|---|---|---|
| YOLOv8-n (Ultralytics, 2023) | 51.6 | 67.1 | 82.4 | 87.4 | 72.1 | 36.0 | 3.0 | 8.1 |
| YOLOv8-s (Ultralytics, 2023) | 70.1 | 75.0 | 83.2 | 91.6 | 80.0 | 42.3 | 11.1 | 28.4 |
| YOLOv8-m (Ultralytics, 2023) | 75.6 | 77.6 | 83.6 | 92.2 | 82.2 | 44.7 | 25.8 | 78.7 |
| YOLOv8-l (Ultralytics, 2023) | 79.5 | 78.1 | 84.0 | 92.8 | 83.6 | 46.2 | 43.6 | 164.8 |
| YOLO11-n (Ultralytics, 2025b) | 47.9 | 68.0 | 82.2 | 88.0 | 71.5 | 36.1 | 2.6 | 6.3 |
| YOLO11-s (Ultralytics, 2025b) | 64.6 | 74.7 | 83.2 | 91.5 | 78.5 | 41.2 | 9.4 | 21.3 |
| YOLO11-m (Ultralytics, 2025b) | 76.7 | 78.9 | 83.6 | 92.9 | 83.0 | 45.4 | 20.0 | 67.7 |
| YOLO11-l (Ultralytics, 2025b) | 77.1 | 79.3 | 83.7 | 92.9 | 83.2 | 45.6 | 25.3 | 86.6 |
| YOLOv8-UAV-n (Lu et al., 2023) | 50.9 | 71.3 | 83.4 | 88.0 | 73.4 | 37.6 | 3.1 | 13.0 |
| YOLOv8-UAV-s (Lu et al., 2023) | 68.7 | 76.7 | 83.6 | 92.0 | 80.2 | 43.1 | 11.1 | 39.6 |
| YOLOv8-UAV-m (Lu et al., 2023) | 77.6 | 78.5 | 83.8 | 91.9 | 82.9 | 45.4 | 25.8 | 103.4 |
| YOLOv8-UAV-l (Lu et al., 2023) | 80.7 | 79.3 | 83.8 | 92.2 | 84.0 | 46.8 | 43.7 | 213.2 |
| Ours-n | 53.5 | 70.2 | 82.9 | 88.2 | 73.7 | 37.3 | 0.96 | 9.1 |
| Ours-s | 75.9 | 78.0 | 83.5 | 91.6 | 82.3 | 43.8 | 3.2 | 24.5 |
| Ours-m | 82.4 | 80.0 | 83.4 | 93.0 | 84.7 | 46.5 | 12.0 | 84.5 |
| Ours-l | 84.1 | 80.6 | 83.7 | 92.5 | 85.2 | 46.7 | 14.9 | 105.9 |
From the table, it can be observed that the detection accuracy for the four plant categories—cotton, maize, rapeseed, and wheat—as well as the overall mAP50 and mAP50−95 metrics, generally improve with an increase in model complexity (MParams and GFLOPs). As baselines, YOLOv8, YOLO11, and YOLOv8-UAV demonstrate a gradual improvement in mAP50−95, reaching approximately 45% as the model scales from the lightweight “n” variant to the larger “l” variant. However, this performance improvement is accompanied by simultaneous increases in parameters and computational cost, with no significant breakthrough in accuracy gains observed across these scaling variations.
In comparison, the proposed improved YOLO11 model, which integrates the P2AR, CBAM, and Shape-IoU strategies, achieves superior detection performance under comparable or even lower parameter and computational cost conditions. For instance, as shown in Table 3, the proposed “ours-n” model has only 0.96 M parameters and a computational cost of 9.1 GFLOPs, yet achieves an mAP50−95 of 37.3%, significantly outperforming other baseline models with similar or lower GFLOPs. Furthermore, the “ours-s” model achieves an mAP50−95 of 43.8% with just 3.2 M parameters and 24.5 GFLOPs, approaching or even surpassing several state-of-the-art models with higher parameters and computational costs. As the model scale increases, the proposed “ours-m” and “ours-l” continue to exhibit remarkable accuracy improvements. Notably, “ours-l” achieves an mAP50−95 of 46.7% with 14.9 M parameters and 105.9 GFLOPs, outperforming most baseline methods under similar parameter or GFLOPs conditions.
To provide a more intuitive representation of the relationship between performance and resource consumption, we plotted the GFLOPs versus mAP and MParams versus mAP curves for different models in Fig. 4. From Fig. 4A, which illustrates the relationship between GFLOPs and mAP, it can be observed that the proposed model’s curve approaches a high mAP level even in the low GFLOPs range, significantly outperforming other models. This indicates that our model achieves comparable or even superior detection accuracy to state-of-the-art methods at the same or lower computational cost. Similarly, as shown in Fig. 4B, which depicts the relationship between MParams and mAP, the proposed method achieves a relatively high baseline accuracy with parameters around the 1M scale. As the parameter count increases, the mAP steadily rises, demonstrating the efficiency and scalability of our method in lightweight and medium-scale models. The curves corresponding to all other methods lie below the proposed method’s curve, indicating that the proposed approach achieves more significant accuracy gains as the model scale increases. This advantage is particularly pronounced in the lightweight parameter and computational cost range.
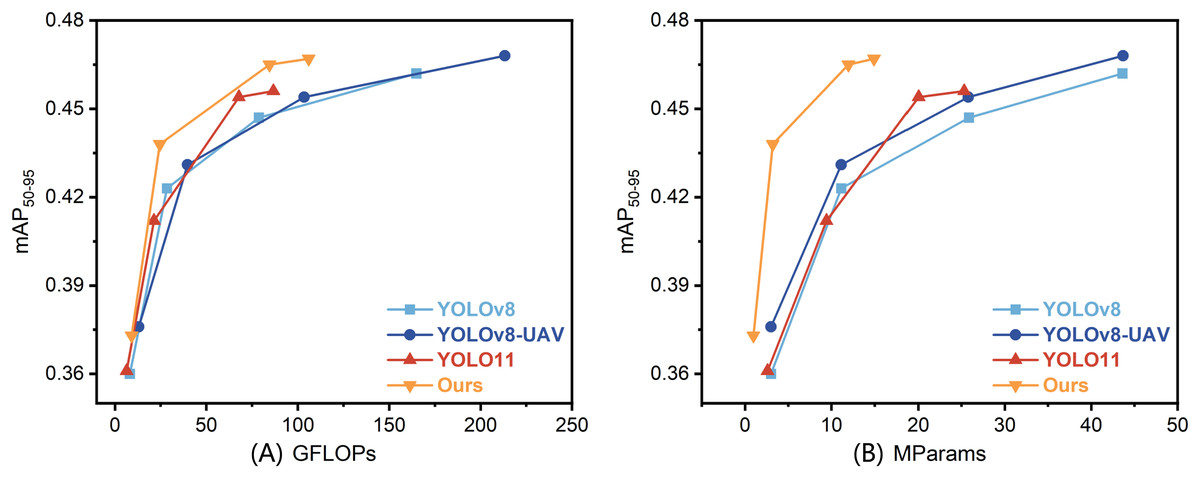
Figure 4: Performance comparison of different models.
Panels show (A) GFLOPs versus mAP50−95 and (B) MParams versus mAP50−95. Each data point corresponds to a model variant at different scales, ranging from lightweight (“n”) to complex (“l”).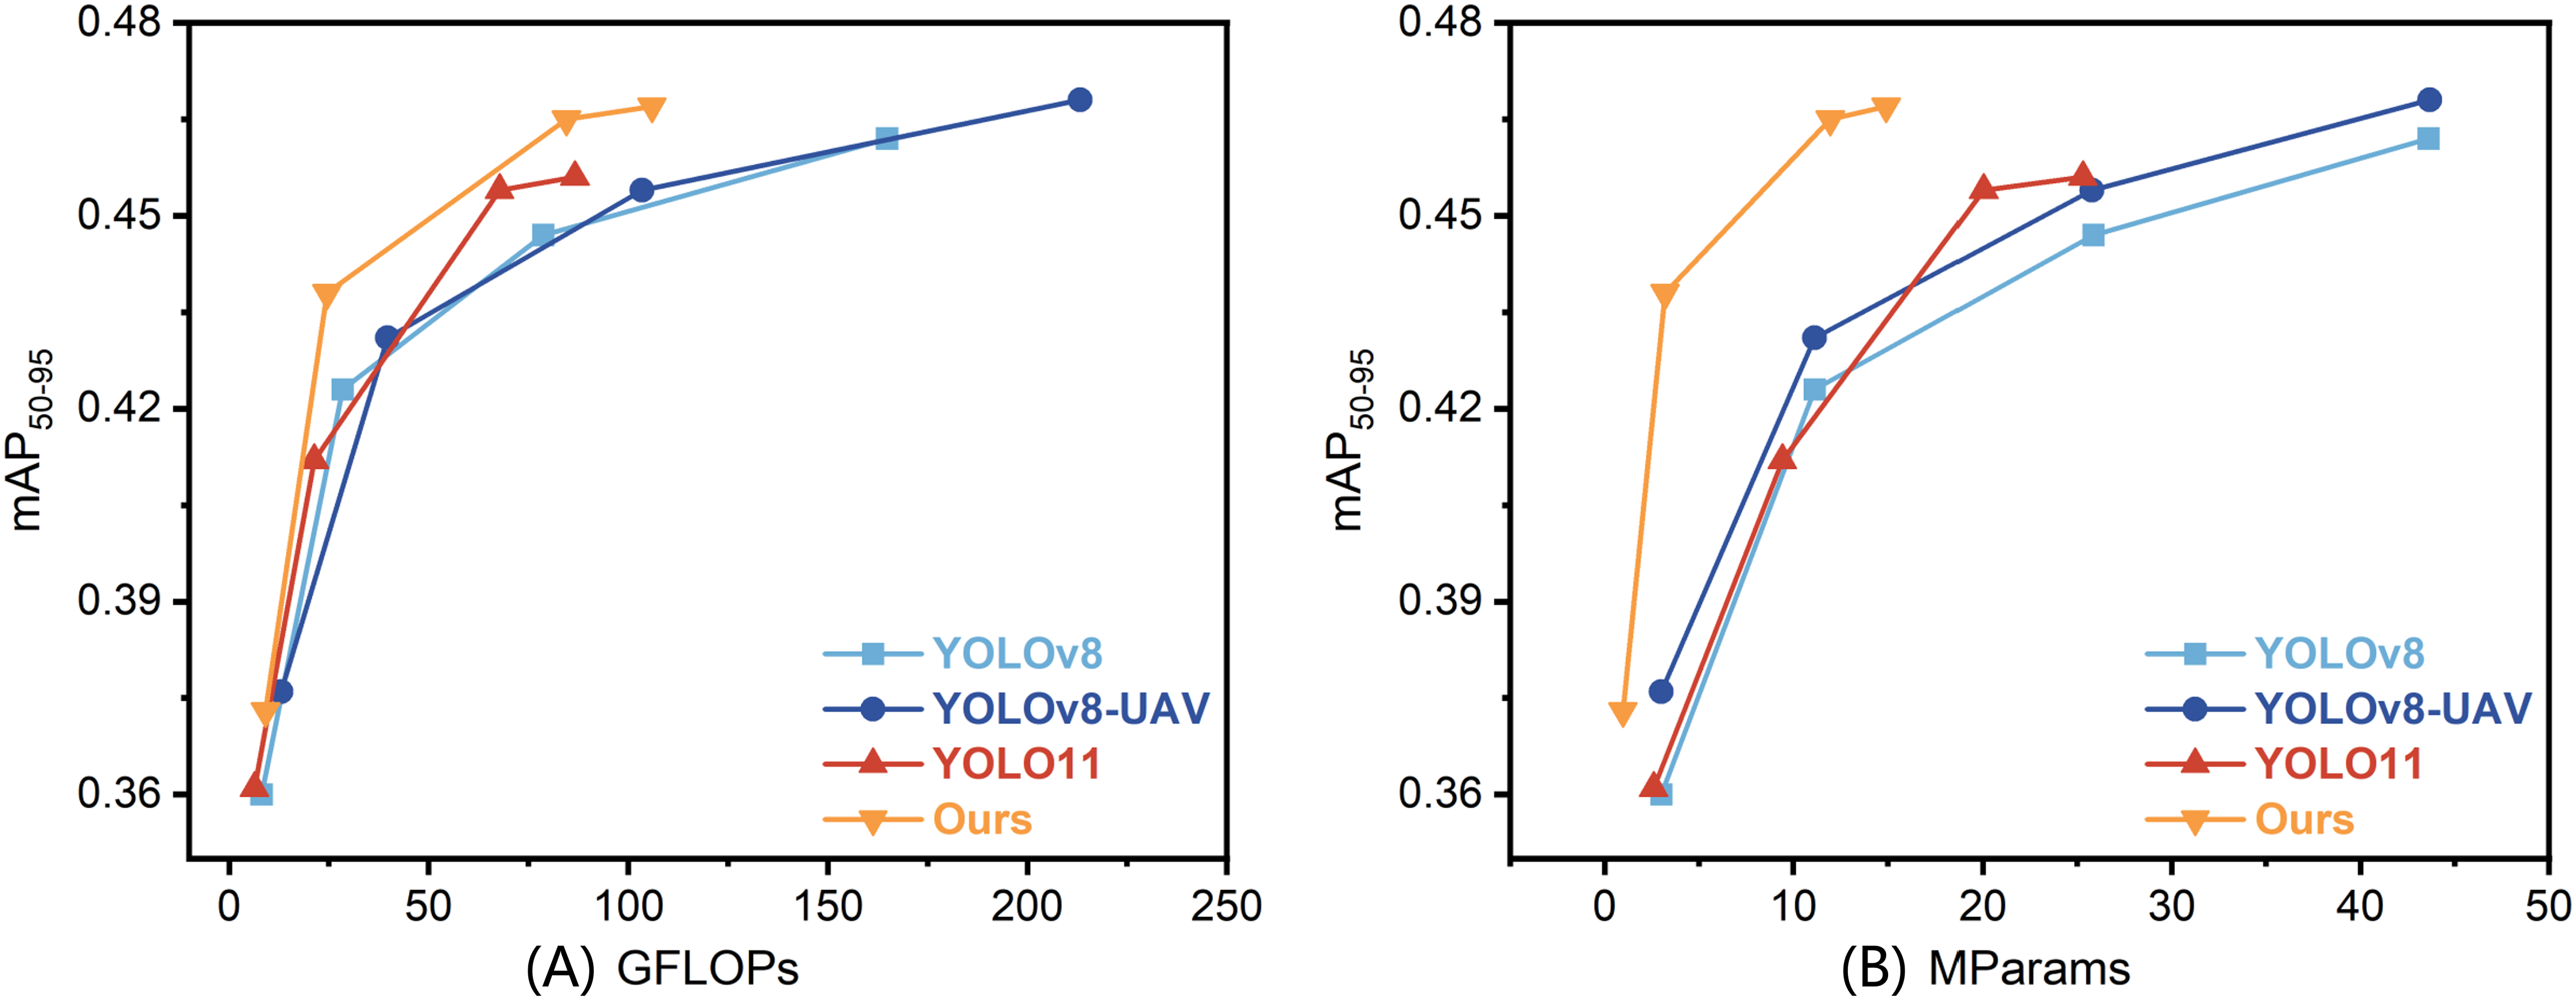
In summary, the proposed method demonstrates significant advantages in balancing lightweight design and high accuracy. Compared to other state-of-the-art YOLO-based methods in the experiments, our approach integrates optimization strategies such as the P2AR structure, CBAM attention mechanism, and Shape-IoU loss, enabling the model to achieve high detection accuracy with extremely low parameter counts and relatively low computational cost. Furthermore, as the model scale increases, the proposed method maintains an excellent performance growth curve. These characteristics indicate that the proposed method is not only well-suited for resource-constrained scenarios, such as real-time detection on edge devices or drones, but also effectively leverages its accuracy advantages in medium- to high-end configurations. This demonstrates the rationality and applicability of the proposed optimization strategies.
Transfer learning study
The ablation and comparison experiments reported above adopt a from-scratch training regime. Such learning is sensitive to random weight initialization and stochastic optimization, particularly with modest data, creating a risk that observed differences partly reflect training variability rather than the method. To address this potential confound and to evaluate robustness under an alternative regime, a transfer learning study is undertaken.
The transfer learning experiments use the “s” scale variants of the compared models, which balance compactness and accuracy, namely YOLOv8-s, YOLO11-s, YOLOv8-UAV-s, and the optimized configuration denoted as ours-s. All models are first trained on COCO (Lin et al., 2014) for 200 epochs under the Ultralytics defaults (Ultralytics, 2025a), where the initial learning rate is 0.01. Fine-tuning on Plant4 then proceeds for 100 epochs with the learning rate reduced to 0.005, following the common guideline that transfer learning benefits from a smaller rate to preserve pretrained features while adapting to the target domain. Results are reported in Table 4.
| Model | Cotton | Maize | Rapeseed | Wheat | mAP50 | mAP50−95 | MParams | GFLOPs |
|---|---|---|---|---|---|---|---|---|
| YOLOv8-s (Ultralytics, 2023) | 66.5 | 72.2 | 73.4 | 88.3 | 75.1 | 41.6 | 11.1 | 28.4 |
| YOLO11-s (Ultralytics, 2025b) | 58.5 | 71.3 | 73.2 | 87.8 | 72.7 | 39.5 | 9.4 | 21.3 |
| YOLOv8-UAV-s (Lu et al., 2023) | 68.2 | 72.6 | 73.7 | 88.0 | 75.6 | 42.1 | 11.1 | 39.6 |
| Ours-s | 69.3 | 72.7 | 73.5 | 87.9 | 75.9 | 42.2 | 3.2 | 24.5 |
As shown in Table 4, under this hyperparameter setting the transfer configuration does not surpass the from-scratch regime, and the four models exhibit a modest decline of 0.7 to 1.7 points in mAP50−95 . The difference largely stems from a substantial gap between the source and target domains, and the reduced learning rate together with a shorter adaptation budget on the target data tends to preserve source biases. COCO pretraining emphasizes ground level objects and broad context, whereas Plant4 focuses on small UAV crop imagery with distinct scale and background statistics, so alignment is partial. The detection head is reinitialized for Plant4 classes, so most transferable benefit resides in the backbone and neck and full specialization proceeds more slowly. These factors are sufficient to account for the slight shortfall without asserting a change in the relative ranking of the models.
Crucially, the balance between accuracy and computational cost remains stable across models in both the from-scratch and transfer settings, and the relative ordering is unchanged. Our proposed method attains mAP50−95 of 42.2 and mAP50 of 75.9 with 3.2 MParams and 24.5 GFLOPs. Compared with YOLOv8-UAV-s at 42.1 and 75.6, computation is lower by 38.1 percent in GFLOPs and parameters are lower by about 71 percent at comparable accuracy. Compared with YOLOv8-s at 41.6 and 75.1, accuracy is higher by 0.6 and 0.8 points with about 71 percent fewer parameters and 13.7 percent fewer GFLOPs. The relative ordering is consistent with the earlier from-scratch comparison. YOLO11-s reaches 39.5 and 72.7 with 9.4 MParams and 21.3 GFLOPs, while our proposed model uses approximately one third of its parameters and improves mAP50−95 by 2.7 points. The relative ordering mirrors the earlier comparison study which was conducted under a from-scratch training regime, indicating that the effectiveness of the proposed configuration remains stable across the from-scratch and transfer regimes.
Discussion
Focusing on UAV plant detection, this study optimizes the official YOLO11 (Ultralytics, 2025b) toward a lightweight yet accurate configuration. Four small single-class plant datasets (Lu et al., 2023; Li et al., 2023; Ye & Yu, 2024) were integrated and annotated to construct a larger four-class benchmark, Plant4, which supports a comprehensive evaluation of the optimized method. Experiments on Plant4 verify effectiveness and show that, under substantially lower parameter and compute budgets, the proposed method attains detection accuracy comparable to or slightly above state-of-the-art baselines (Lu et al., 2023; Ultralytics, 2023, 2025b).
Despite the above advances, limitations remain. First, although the annotated Plant4 dataset increases image and instance counts and improves diversity relative to the four source datasets, limitations in overall scale and class balance persist, as analyzed in the Datasets subsection. A valuable direction for future work is to enlarge coverage by collecting additional images and instances from external datasets and real-world acquisition, and to explore synthetic data and targeted augmentations to mitigate imbalance and increase effective diversity (Kiefer, Ott & Zell, 2022; Westerski & Fong, 2024; Clement et al., 2024).
Second, the main contribution of this article is an optimization of YOLO11 that balances accuracy and efficiency for UAV plant detection. Effectiveness has been validated under both from-scratch and transfer settings, yet edge conditions lie outside the primary scope. Occlusion, noisy imagery, and background clutter can stress detectors in ways not fully reflected by aggregate metrics (Saleh, Szénási & Vámossy, 2021; Liu et al., 2024; Dreyer et al., 2023). A rigorous study of these borderline cases would require case-level stratification and targeted evaluation protocols. Future work will conduct systematic stress tests on curated subsets and, where appropriate, extend annotation to quantify failure modes and guide refinement (Bolya et al., 2020; Wang et al., 2024).
Finally, the proposed optimization has been assessed in a simulation-based experimental environment, and deployment on actual UAV hardware for real-world plant detection remains an important direction. Continued study on on-board compute modules such as NVIDIA Jetson Orin NX and Jetson Xavier NX would support real-time inference within tight power and thermal budgets, reduce end-to-end latency, and enable closed-loop perception and control in the field (Youvan, 2024; Kortli et al., 2022; Saeed et al., 2023).
Conclusion
This study presents optimization strategies for YOLO11 that deliver a lightweight yet accurate configuration for UAV-based plant object detection. By combining four existing single-class datasets, we created a new multi-class dataset, Plant4, to serve as a benchmark for evaluation. Ablation studies, comparisons with state-of-the-art methods, and a transfer learning study on Plant4 support the effectiveness of the proposed approach. Results show a notable reduction in parameter count and computational cost, with accuracy comparable to or marginally higher than state-of-the-art baselines. The strategies proposed in this article offer valuable insights for enhancing model performance in UAV-based plant detection and other small object detection tasks in resource-constrained environments. Future research could deploy these optimizations on real-world UAV systems with task-specific tuning, expand multi-class plant detection datasets in both scale and class balance, and conduct deeper analyses of borderline cases such as occlusion, noisy imagery, and background clutter.