
Estimating compressive strength of CO2 incorporated concrete with data augmentation and explainable regression modeling
- Published
- Accepted
- Received
- Academic Editor
- Davide Chicco
- Subject Areas
- Artificial Intelligence, Data Mining and Machine Learning, Emerging Technologies
- Keywords
- Compressive strength estimation, CO2 incorporated concrete, Carbon sequestration, Generative adversarial networks, Explainable artificial intelligence, Machine learning
- Copyright
- © 2025 Rashid et al.
- Licence
- This is an open access article distributed under the terms of the Creative Commons Attribution License, which permits unrestricted use, distribution, reproduction and adaptation in any medium and for any purpose provided that it is properly attributed. For attribution, the original author(s), title, publication source (PeerJ Computer Science) and either DOI or URL of the article must be cited.
- Cite this article
- 2025. Estimating compressive strength of CO2 incorporated concrete with data augmentation and explainable regression modeling. PeerJ Computer Science 11:e3316 https://doi.org/10.7717/peerj-cs.3316
Abstract
To mitigate the negative impacts of concrete production on the environment while simultaneously improving its structural performance, innovative approaches are required to meet the growing demand for environmentally friendly building materials. This study investigates the integration of regulated dosages of Carbon Dioxide (CO2) during the concrete mixing process to improve compressive strength while contributing to carbon sequestration. Further, the study addresses the challenge of estimating concrete strength by utilizing machine learning algorithms. Moreover, this is accomplished only by utilizing limited experimental data consisting of only 270 rows. To make the Machine Learning (ML) model learn patterns well, Conditional Tabular Generative Adversarial Networks (CTGAN) and Tabular Variational Autoencoder (TVAE) are utilized to generate high-quality synthetic data, thereby significantly expanding the training dataset. This allows for avoiding the limitations associated with small datasets generated from experimentation. The data generated by CTGAN and TVAE are evaluated to ensure that the characteristics of the synthetic data are aligned with the original dataset. After data is compiled using combined real and filtered synthetic datasets, significant improvements in key performance metrics are achieved. Furthermore, Explainable Artificial Intelligence (XAI) techniques are incorporated to provide insights into the black-box models, improving their interpretability and trustworthiness. Results indicate that the Light Gradient Boosting Machine is the most effective for predicting compressive strength, achieving an R2 value of 0.9872, MAE of 1.1847, and RMSE of 1.3833 on test data. The approach proposed demonstrates a robust framework for combining data augmentation and ML to estimate CO2 incorporated concrete compressive strength while effectively addressing challenges related to data scarcity.
Introduction
The escalating threat of global warming, fuelled primarily by greenhouse gas emissions, has emerged as one of the most critical challenges (Mariappan et al., 2023; Rashid et al., 2024; Arif et al., 2025). Among these gases, carbon dioxide ( ) accounts for around 75% of total global emissions due to its abundance and persistence in the atmosphere (Sick, Stokes & Mason, 2022; Yaacob et al., 2024). Cement production, a cornerstone of the construction industry, significantly contributes to approximately 8% of global emissions (Chadha et al., 2024). This is mainly attributable to the calcination of limestone and the energy-demanding procedures involved (Naik, Kraus & Siddique, 2002). With the increasing demand for concrete, the imperative to mitigate its environmental impact intensifies. Innovative strategies, including sequestration and utilisation, are being explored to transform from a liability into a valuable asset, thereby reducing its impact on climate change (Lippiatt, Ling & Pan, 2020). sequestration in concrete entails capturing carbon dioxide and integrating it during the mixing or curing phases (Zhang, Ghouleh & Shao, 2017; Singh et al., 2021). This procedure enables a sequence of chemical reactions that transform atmospheric into stable calcium carbonate , which is embedded within the concrete matrix (Qian et al., 2018). These reactions improve the material’s structural integrity and diminish its porosity (Sharma & Goyal, 2018). The primary carbonation reactions are as follows:
Reaction during hydration:
Reaction with hydration products:
These reactions densify the microstructure of concrete, thereby enhancing its compressive strength and durability (Šavija & Luković, 2016). Moreover, carbonation minimises the overall carbon footprint of concrete by incorporating that would otherwise aggravate atmospheric pollution (Adesina, 2020).
Related works
The potential of incorporating in concrete has been extensively investigated (Chen & Gao, 2020; Suescum-Morales, Fernández-Rodríguez & Jiménez, 2022; Ahmed, Ahmad & Adekunle, 2024). Carbonation has demonstrated the ability to improve both the fresh and hardened characteristics of concrete while minimising its environmental impact (Monkman, Grandfield & Langelier, 2018; Monkman & MacDonald, 2017). The incorporation of in fresh concrete during mixing often reduces slump owing to rapid water loss resulting from exothermic carbonation reactions (Samniang et al., 2021). The initial and final setting times of carbonated concrete tend to be prolonged due to the free water produced during the reaction between and ; however, optimized dosages can accelerate the setting process, resulting in a reduction of initial set times by 22–25% and final set times by 21–25% (Monkman, MacDonald & Hooton, 2016; Monkman, Grandfield & Langelier, 2018). Carbonation in hardened concrete considerably improves compressive strength by forming nanosized calcium carbonate, which densifies the matrix and fills microvoids (Monkman, 2018; Shah et al., 2018). Optimal dosages can increase compressive strength by 14% in 1 day and up to 30.9% in 28 days (Wang, He & Yang, 2018; Kumar et al., 2019). Accelerated carbonation curing has also been found to enhance early-age strength by 20–26% in 3–58 days (Monkman, MacDonald & Hooton, 2015). Excessive dosages might adversely impact compressive strength, highlighting the necessity for precise dosage optimisation (Saikia & Rajput, 2024). Another significant advantage of carbonation is its enhancement of durability. Carbonated concrete exhibits reduced porosity, lower water absorption, and improved resistance to chloride penetration and freeze-thaw cycles (Sharma & Goyal, 2022; Zhang & Shao, 2018). Carbonation refines pore structures, reduces pore sizes, and promotes the formation of stable calcium carbonate and C-S-H gel, resulting in a denser and more durable matrix (Cui et al., 2015; Jang & Lee, 2016). These findings collectively underscore the potential of utilisation to enhance concrete performance while addressing sustainability objectives.
Conventional methods for assessing the compressive strength of concrete necessitate extensive experimental testing, which is both time-consuming and resource-intensive (Candelaria, Kee & Lee, 2022; Getahun, Shitote & Abiero Gariy, 2018). Regression modelling serves as a viable alternative, enabling the prediction of compressive strength based on key input variables like cement content, water-to-cement ratio, aggregate size, and dosage (Tam et al., 2022). Regression models utilise statistical techniques and machine learning (ML) algorithms that enable assessing the mechanical properties of concrete efficiently, minimising dependence on physical testing (Singh et al., 2023). Regression modelling has been utilised in various application areas (Haque et al., 2025). Traditional models such as multiple linear regression and polynomial regression have proven effective in predicting the strength of conventional concrete but often encounter difficulties with complicated, nonlinear interactions (Yeh, 1998). Advanced models, such as support vector regression (SVR) and random forest (RF), have demonstrated efficacy with high-dimensional data, attaining prediction errors below 5% in strength assessments (Ly et al., 2021). Artificial Neural Networks (ANN) excel at capturing nonlinearities, with optimised architectures providing precise predictions for diverse concrete types, such as recycled aggregate and self-compacting concrete (Chopra, Sharma & Kumar, 2016).
Getahun, Shitote & Abiero Gariy (2018) developed a three-layer ANN model utilising 15 input parameters and attained a Mean Average Precision Error (MAPE) of around 2.09%, designating cement, water, RHA, and w/c ratio as the most significant factors. In a similar way, Yan et al. (2013) effectively utilised SVR to predict tensile strength from compressive strength, hence validating the efficacy of margin-based learners in property mapping. Hybrid and ensemble models such as Adaptive Neuro-Fuzzy Inference Systems and ensemble techniques such as Gene-Expression Programming and Extreme Gradient Boosting (XGB) improve prediction accuracy by combining algorithmic strengths, outperforming standalone models (Chu et al., 2021; Shamsabadi et al., 2022). Deep neural networks enhance the capabilities using extensive datasets, while hybrid and ensemble approaches perform exceptionally well under varied situations, rendering regression modelling essential for optimising concrete mix designs. The approaches, such as Convolutional Neural Network (CNN)-Bidirectional Long Short-Term Memory (BiLSTM) architectures and RF-optimised back-propagation networks, have been documented to surpass conventional models, especially in predicting strength at various curing ages (Leondes, 2002; Bharathi, Manju & Premalatha, 2017).
To mitigate data scarcity challenges in forecasting the compressive strength of concrete, as experiments are costly and limited, generative models like Conditional Tabular Generative Adversarial Networks (CTGAN) and Tabular Variational Autoencoders (TAVEGAN) have emerged as viable solutions (Xu et al., 2019; Apellaniz, Parras & Zazo, 2024). These models produce synthetic but realistic datasets by assimilating the fundamental distributions of existing data, thereby improving model training. The integration of synthetic data generation with conventional and sophisticated regression models enhances predictive efficacy, alleviating the risk of overfitting and broadening the applicability of ML techniques to specialised concrete types or innovative mix designs. The implementation of Explainable AI (XAI) techniques enhances the interpretability and reliability of predictive models by offering transparent insights into their decision-making processes. XAI methodologies, including SHapley Additive exPlanations (SHAP), facilitate the identification of essential input variables affecting concrete strength predictions, thereby enhancing decision-making in construction practices (Lundberg & Lee, 2017). In the context of curing and accelerated carbonation curing, maturity-based models have been developed to quantify the synergistic effects of concentration, relative humidity, and flow rate on early-age strength development, demonstrating that optimal curing conditions can yield strengths comparable to those of 28-day moist-cured samples within hours (Xuan, Zhan & Poon, 2018). These models formalise the influence of dosage and curing environment through logistic-type functions, incorporating characteristics associated with carbonation kinetics and hydration acceleration. At a material scale, mathematical modelling has shown that carbonation and uptake are affected by cement chemistry, SCM content, exposure class, and surface-area-to-volume ratio, with high surface-area-to-volume elements demonstrating up to 255% more sequestration capacity compared to normal specimens (Souto-Martinez et al., 2017). These mechanistic insights underscore the need to integrate curing characteristics with mix design parameters in ML frameworks to enhance prediction accuracy.
Recent studies in predictive modelling for civil engineering materials increasingly utilise XAI and data augmentation techniques. SHAP has been pivotal in revealing the impact of individual features on model outputs, enhancing transparency and trust. For instance, in the study quantifying compressive strength in limestone powder incorporated concrete, SHAP was employed to understand the influence of variables like water-to-cement ratio and limestone dosage (Mishra, 2025). Additionally, the SHAP analysis revealed that recycled coarse aggregate has an inverse impact on the strength of Fibre-reinforced recycled aggregate concrete (Alsharari, 2025). Furthermore, SHAP analysis revealed cement content and curing age as the most significant factors affecting compressive strength (Abioye et al., 2025). SHAP explanations reveal interactions among features during the prediction process. While cement generally has a positive impact on strength, it also exhibits localised adverse effects. Findings offer valuable insights for guiding the design of high temperature resistant concrete materials (Meng et al., 2025). Utilising literature insights and limitations in current approaches, this study proposes an ML framework for estimating the compressive strength of incorporated concrete. Advanced regression modelling, synthetic data generation, and model explainability techniques are used to improve accuracy, solve data scarcity, and deliver actionable feature contribution insights. This study has the following objectives.
Evaluates the impact of regulated incorporation during concrete mixing on the development of compressive strength in concrete formulated with varied water-cement ratios and cement types (OPC and PPC) at various curing ages.
It examines the use of regression modelling approaches to estimate the compressive strength of -incorporated concrete.
It introduces and compares models to generate high-quality synthetic data for concrete strength prediction to reduce data scarcity.
To optimise ML models capable of accurately predicting the compressive strength of concrete with Incorporated SHAP to interpret the predictions of the models, providing insights into feature contributions and enhancing the transparency of the models.
The rest of the article is organised as follows: ‘Experimentation and Data Collection’ describes the experimental setup and data collection. ‘System Description’ describes the problem formulation and algorithm, including the problem statement. ‘Results’ covers the data quality, data augmentation, ML model performance, and XAI model interpretability. After discussing the findings, the study concludes in ‘Discussions’.
Experimentation and data collection
Materials
The study utilised two cement types: Ordinary Portland Cement (OPC) and fly ash–based Portland Pozzolana Cement (PPC), adhering to IS: 269-2015 ; equivalent to ASTM C150/C150M and IS: 1489 (Part 1)–1991 equivalent to ASTM C595/C595M, respectively, with specific gravities of 3.15 and 3.06 and standard consistencies of 28% and 34%. River sand, locally sourced and classified as Zone II according to IS: 383-2016; equivalent to ASTM C33/C33M, was used as fine aggregate, exhibiting a specific gravity of 2.65, a fineness modulus of 2.82, and a water absorption of 1.60%. Coarse aggregates comprised crushed stone (20 and 10 mm), assessed in accordance with IS: 383-2016; equivalent to ASTM C33/C33M, exhibiting specific gravities of 2.68 and 2.77, fineness moduli of 6.00 and 6.95, and water absorptions of 0.17% and 0.37%, respectively. Potable tap water was used for both casting and curing. A polycarboxylic ether polymer-based superplasticizer (Fosroc Auramix 200) complying with IS: 9103-1999 ; equivalent to ASTM C494/C494M, was employed as an admixture. Furthermore, 99.9% pure industrial-grade carbon dioxide gas was supplied in high-pressure cylinders (about 300 psi or 20 bar) for the carbonation process.
Mix design and methodology
The study examined the impact of incorporation during mixing on the compressive strength of concrete. The data encompassed various concrete mix proportions, binder types, and dosages, facilitating an extensive assessment. The concrete mixes comprised two types of binders, OPC and PPC, with binder quantities of 500, 400, and 350 kg/m3. Additional constituents comprised water (175–193 kg/m3), coarse aggregates (1,200.63 kg/m3), fine aggregates (674.584 kg/m3), and superplasticisers (0.65% by weight of cement). was injected in concentrations of 0%, 0.05%, 0.10%, 0.15%, and 0.20% by weight of cement, serving as a critical factor in assessing compressive strength. The input parameters for regression modelling were binder type, binder content, water-to-binder ratio, dosage, and testing age. The concrete mixture proportions are listed in Table 1 range of parameters is listed in Table 2.
| Binder type | Binder kg/m3 | Water kg/m3 | Coarse aggregate kg/m3 | Fine aggregate kg/m3 | Superplasticizer % by cement weight | CO2 content % by cement weight |
|---|---|---|---|---|---|---|
| PPC | 500 | 175 | 1,200.63 | 674.584 | 0.65 | 0 |
| PPC | 500 | 175 | 1,200.63 | 674.584 | 0.65 | 0.05 |
| PPC | 500 | 175 | 1,200.63 | 674.584 | 0.65 | 0.10 |
| PPC | 500 | 175 | 1,200.63 | 674.584 | 0.65 | 0.15 |
| PPC | 500 | 175 | 1,200.63 | 674.584 | 0.65 | 0.20 |
| OPC | 400 | 182 | 1,200.63 | 674.584 | 0.65 | 0 |
| OPC | 400 | 182 | 1,200.63 | 674.584 | 0.65 | 0.05 |
| OPC | 400 | 182 | 1,200.63 | 674.584 | 0.65 | 0.10 |
| OPC | 400 | 182 | 1,200.63 | 674.584 | 0.65 | 0.15 |
| OPC | 400 | 182 | 1,200.63 | 674.584 | 0.65 | 0.20 |
| PPC | 400 | 182 | 1,200.63 | 674.584 | 0.65 | 0 |
| PPC | 400 | 182 | 1,200.63 | 674.584 | 0.65 | 0.05 |
| PPC | 400 | 182 | 1,200.63 | 674.584 | 0.65 | 0.10 |
| PPC | 400 | 182 | 1,200.63 | 674.584 | 0.65 | 0.15 |
| PPC | 400 | 182 | 1,200.63 | 674.584 | 0.65 | 0.20 |
| OPC | 350 | 193 | 1,200.63 | 674.584 | 0.65 | 0 |
| OPC | 350 | 193 | 1,200.63 | 674.584 | 0.65 | 0.05 |
| OPC | 350 | 193 | 1,200.63 | 674.584 | 0.65 | 0.10 |
| OPC | 350 | 193 | 1,200.63 | 674.584 | 0.65 | 0.15 |
| OPC | 350 | 193 | 1,200.63 | 674.584 | 0.65 | 0.20 |
| PPC | 350 | 193 | 1,200.63 | 674.584 | 0.65 | 0 |
| PPC | 350 | 193 | 1,200.63 | 674.584 | 0.65 | 0.05 |
| PPC | 350 | 193 | 1,200.63 | 674.584 | 0.65 | 0.10 |
| PPC | 350 | 193 | 1,200.63 | 674.584 | 0.65 | 0.15 |
| PPC | 350 | 193 | 1,200.63 | 674.584 | 0.65 | 0.20 |
| Variables | Minimum | Maximum |
|---|---|---|
| WBRatio | 0.35 | 0.55 |
| OPC | 0.00 | 500 |
| PPC | 0.00 | 500 |
| DAYS | 7.00 | 56.0 |
| CO2 | 0.00 | 0.20 |
In this study, was injected directly during the mixing process. High-purity gas (99.9%) was supplied through a cylinder equipped with a dual-stage regulator, pressure gauge, and calibrated rotameter to ensure a regulated flow rate of 3.0 0.2 L/min. The injection duration for each batch (30–45 s) was determined based on the mixer capacity and the required dosage relative to cement weight, ensuring delivery within 2% of the target. The gas was injected into the concrete mixer through a 10 mm inner-diameter reinforced hose, with the mixing chamber enclosed by gasket-lined acrylic panels to reduce leakage, leaving only a narrow, sealed opening for the hose connection and a pressure relief vent equipped with a one-way valve. The measured was injected consistently, enabling its reaction with the hydrating cement and promoting carbonation within the mix. Safety protocols comprised continuous laboratory ventilation to ensure ambient levels remained below 1,000 ppm, using personal protective equipment (safety goggles, nitrile gloves, and -rated respirators), leak detection via portable monitors, and emergency shut-off valves in compliance with ASTM C1768 standards. This process was essential for achieving the intended interaction between and the binder. Following the mixing process, the concrete was cast into standard moulds to assess its compressive strength. Compressive strength tests were carried out at 7, 28, and 56 days, in accordance with IS: 516-1959 norms; equivalent to ASTM C39, to evaluate the strength of the -incorporated concrete.
Compressive strength test results
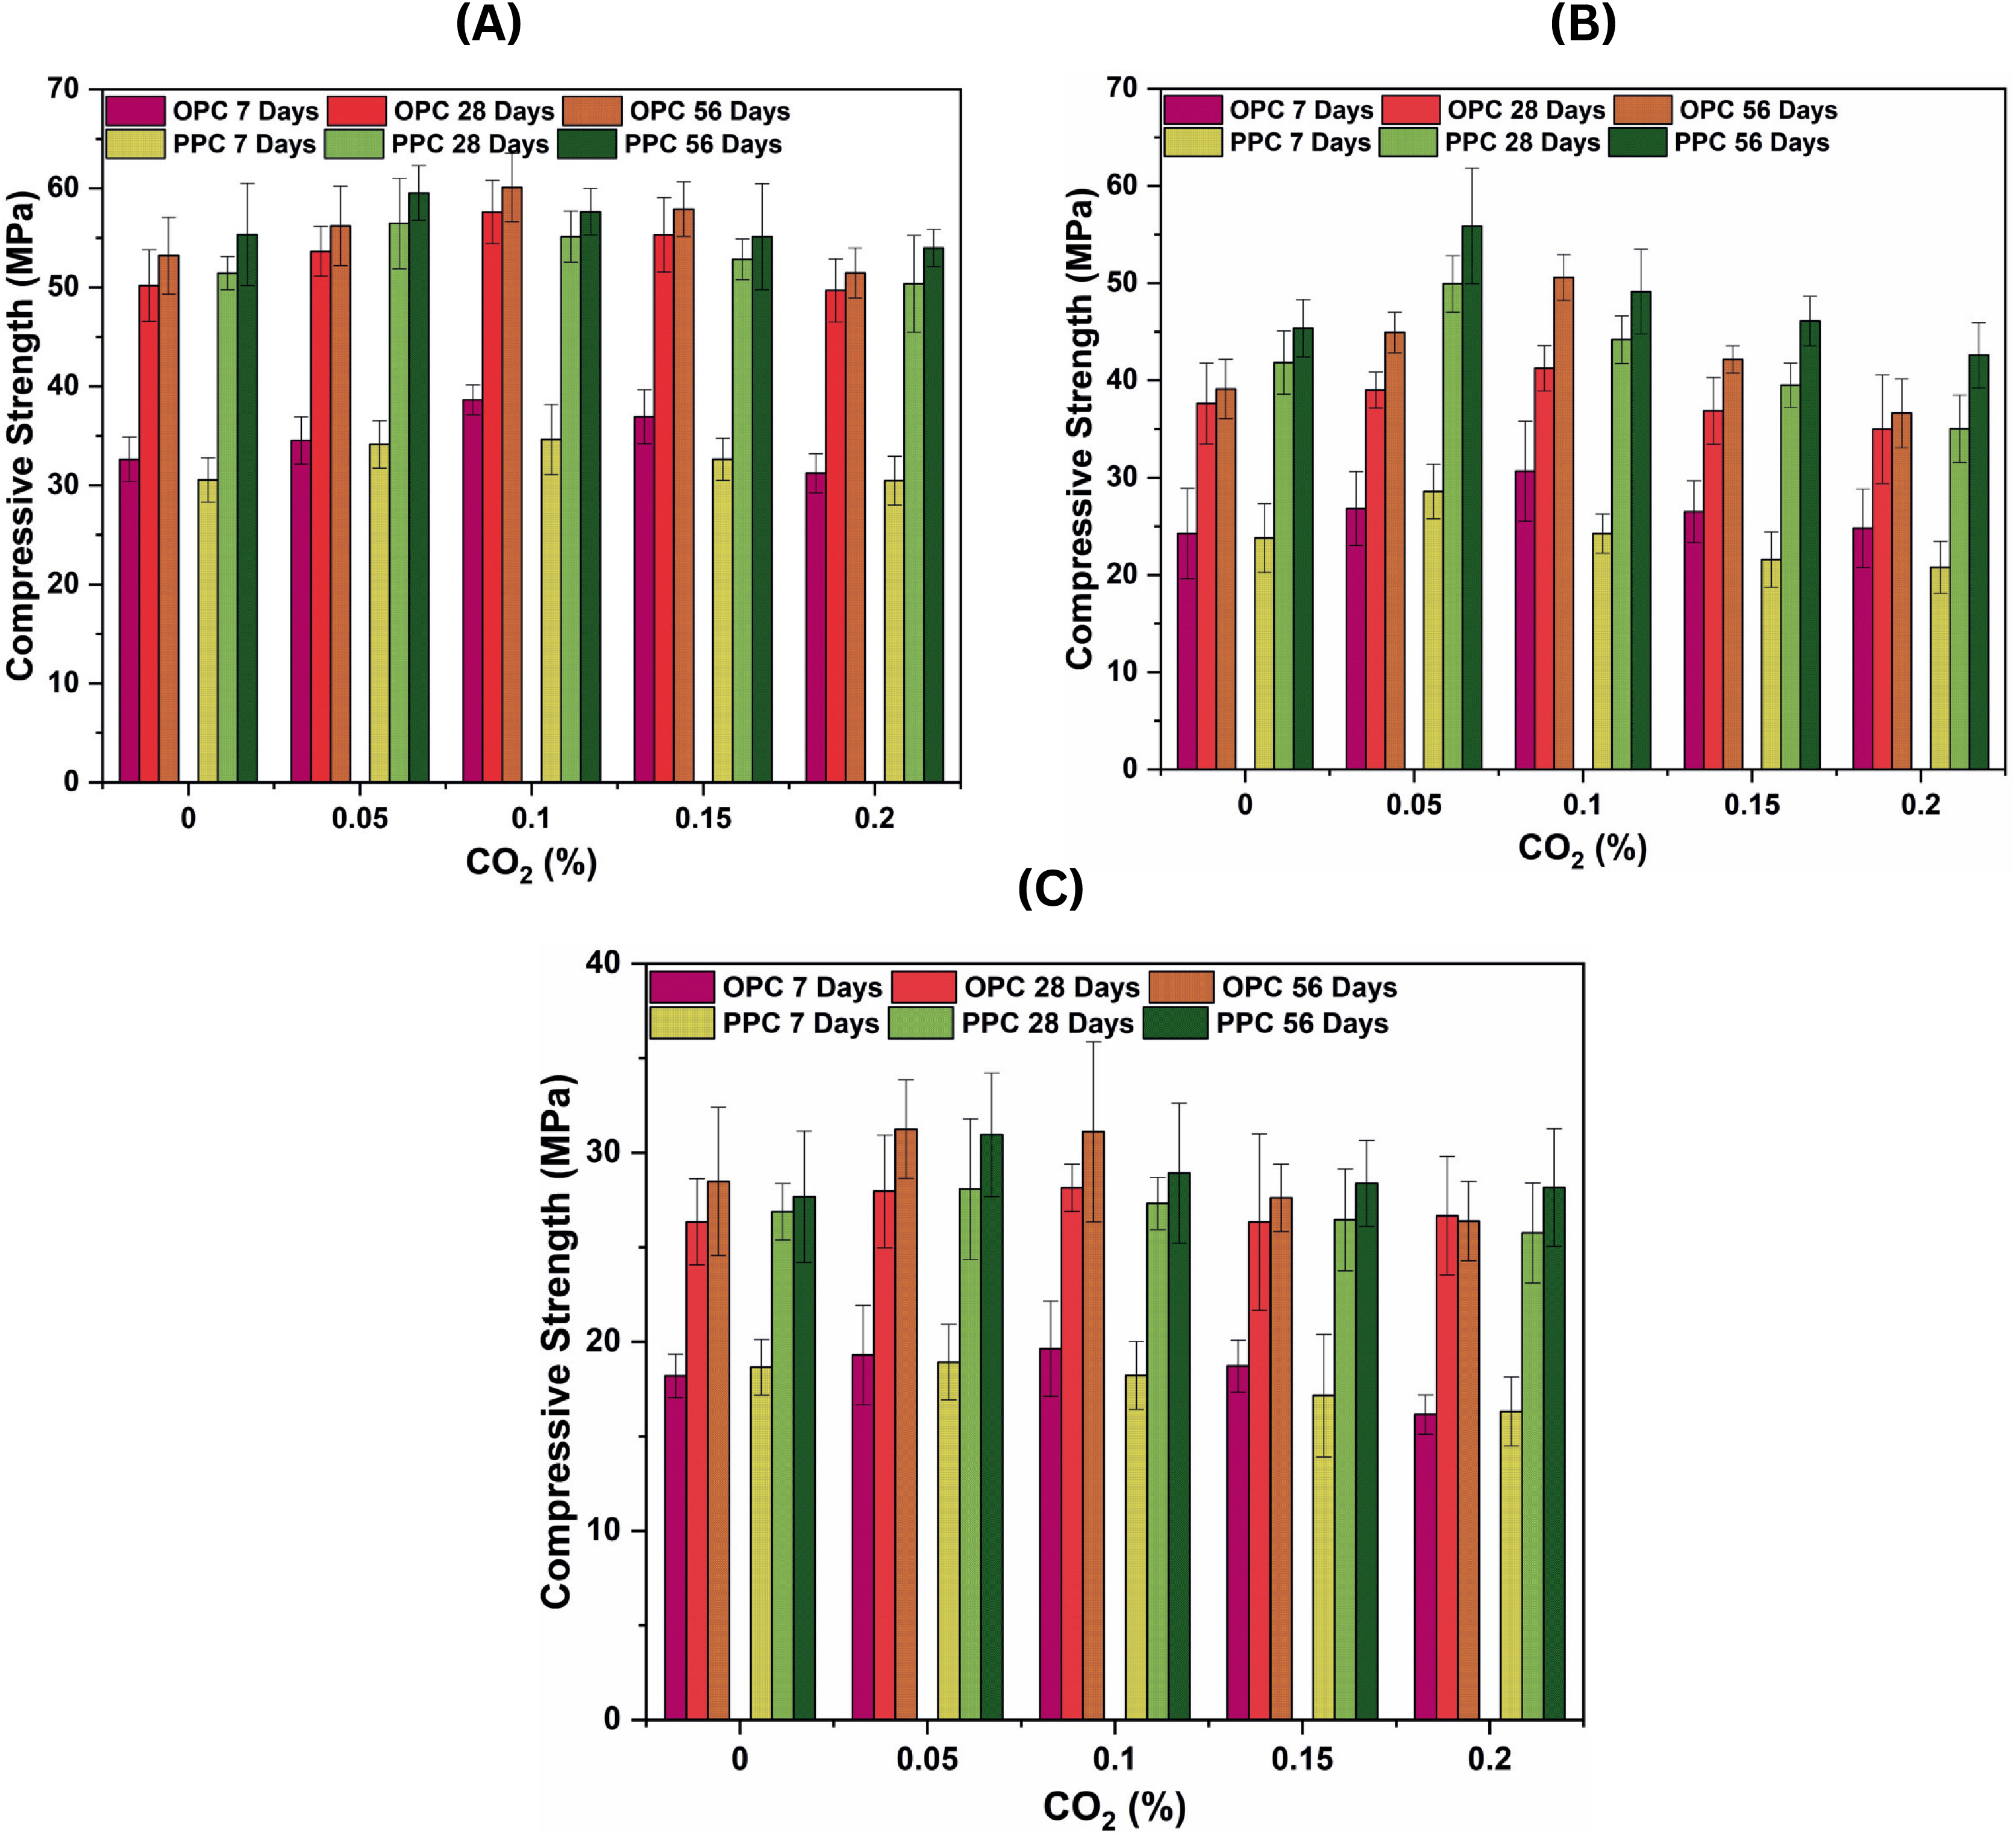
This study examines the impact of incorporation during mixing on the compressive strength of concrete, assessed at 7, 28, and 56 days to determine both early-age and long-term strength development. The findings demonstrate that the incorporation of at regulated dosages during mixing significantly improves the compressive strength of concrete, especially at reduced water-to-cement (w/c) ratios. The optimum concentration ranges from 0.05% to 0.10% for the majority of mixes, beyond which a reduction in strength is observed. This behaviour can be attributed to the carbonation reactions between and calcium hydroxide ( ), which leads to the formation of calcium carbonate ( ). This reaction optimally refines the pore structure and enhances the density of the concrete matrix, consequently augmenting strength. However, excessive exposure may lead to premature carbonation, hindering the hydration process and reducing the availability of for further strength development (Monkman et al., 2018; Monkman & MacDonald, 2016). For the w/c = 0.45 mixes, OPC-based concrete exhibited enhanced compressive strength with increasing dosage up to 0.10%. The control mix demonstrated compressive strengths of 24.25, 37.62, and 39.12 MPa at 7, 28, and 56 days, respectively. The highest strength (50.58 MPa at 56 days) was observed at 0.10% , indicating that moderate carbonation positively impacted the microstructure. Nevertheless, beyond 0.10%, a reduction in strength was noted, likely due to excessive carbonation impeding further hydration (Monkman & MacDonald, 2017). Similarly, for PPC mixes, the compressive strength improved up to 0.05% , to a maximum of 55.87 MPa at 56 days, after which the strength began to decrease, especially at 0.15% and 0.20% concentrations. The presence of pozzolanic materials in PPC would have facilitated early strength development, but prolonged exposure to would have reduced the efficacy of the long-term pozzolanic reaction (Samniang et al., 2021).
For the w/c = 0.35 mixes, with a reduced water content and inevitably higher strength, a more significant improvement due to incorporation was observed. The control OPC mix exhibited compressive strengths of 32.63, 50.19, and 53.20 MPa at 7, 28, and 56 days, respectively. The highest strength (60.09 MPa at 56 days) was attained at 0.10% , indicating the improved densification effect resulting from controlled carbonation. A similar trend was seen for PPC, where 0.05% yielded the highest strength of 59.53 MPa at 56 days. However, beyond this concentration, strength began to decrease, indicating that excessive carbonation would have led to the formation of a dense outer layer that impeded further hydration of the cementitious matrix (Xu et al., 2022). Conversely, the w/c = 0.55 mixes exhibited a comparatively lower strength enhancement due to incorporation. The control OPC mix had compressive strengths of 18.19, 26.33, and 28.47 MPa at 7, 28, and 56 days, respectively. The compressive strength attained a maximum of 31.25 MPa at 56 days with 0.05% ; however, with higher dosages, the increase in strength was negligible. A similar pattern was noted in PPC, with the highest strength (30.95 MPa at 56 days) obtained at 0.05% , followed by a decrease in strength. This limited strength improvement can be attributed to the higher porosity of w/c = 0.55 mixes, which would have reduced the effectiveness of -induced densification. Furthermore, at high w/c ratios, carbonation may progress more rapidly. However, it does not substantially enhance overall strength development due to the extensive availability of pore water (Wang et al., 2019).
The results validate that the inclusion of during mixing improves concrete strength at optimal dosages (0.05–0.10%) owing to the beneficial effects of early-age carbonation. The regulated formation of enhances the packing density of the cement matrix and decreases porosity, thereby enhancing strength. However, when concentration exceeds a critical threshold (beyond 0.10%), the carbonation reaction consumes excessive , which may interfere with long-term hydration and strength development (Rashid & Singh, 2023). The impact of the w/c ratio, as shown in Figs. 1A and 1B, is also evident in the findings, as reduced w/c ratios (0.35 and 0.45) demonstrate a significant increase in strength. This is attributed to the denser microstructure of low w/c ratio mixes, which enables regulated carbonation to enhance the pore structure without substantially reducing hydration (Li et al., 2019). Conversely, high w/c ratio mixes (0.55), as shown in Fig. 1C exhibit increased porosity, hence limiting the efficacy of -induced densification. The comparison between OPC and PPC indicates that PPC typically has superior long-term strength due to the pozzolanic reaction. However, PPC appears more sensitive to excessive exposure, as seen from the more pronounced decline in strength at 0.15% and 0.20% concentrations. The delayed pozzolanic reaction may be impeded by early carbonation, hence influencing the formation of additional cementitious compounds (Šavija & Luković, 2016). The study indicates an optimal range of 0.05–0.10% for strength enhancement, beyond which carbonation impacts hydration. The effect is more pronounced at lower water-to-cement ratios (0.35 and 0.45) and with OPC in comparison to PPC. These insights can be valuable for developing sustainable cementitious composites through the integration of regulated utilisation while ensuring optimal performance.
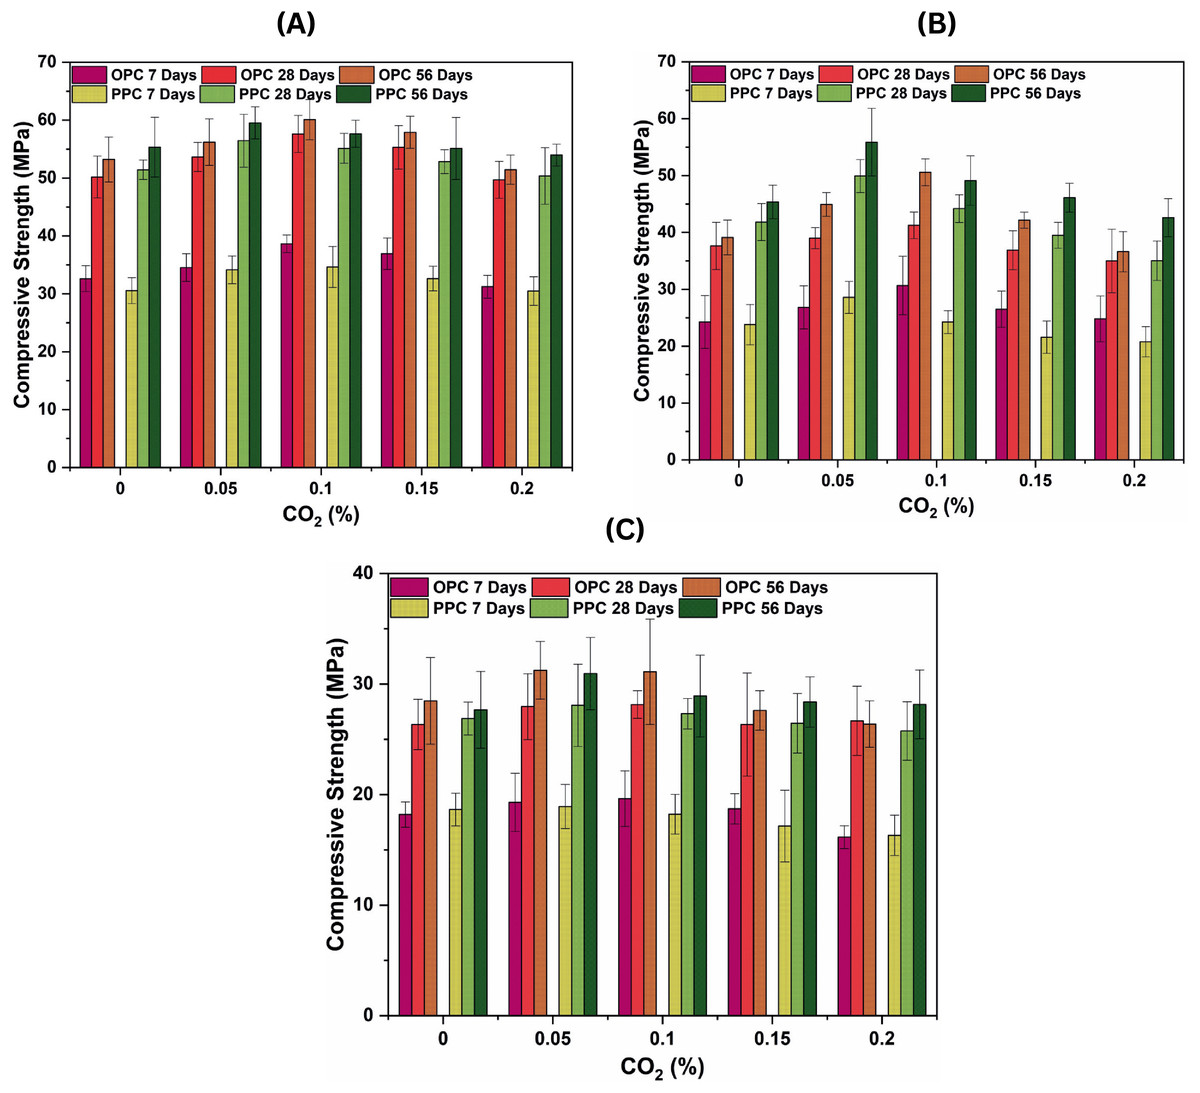
Figure 1: Compressive strength results of mixes at 7, 28, and 56 days for different w/c ratios: (A) w/c = 0.35, (B) w/c = 0.49, and (C) w/c = 0.55.
System description
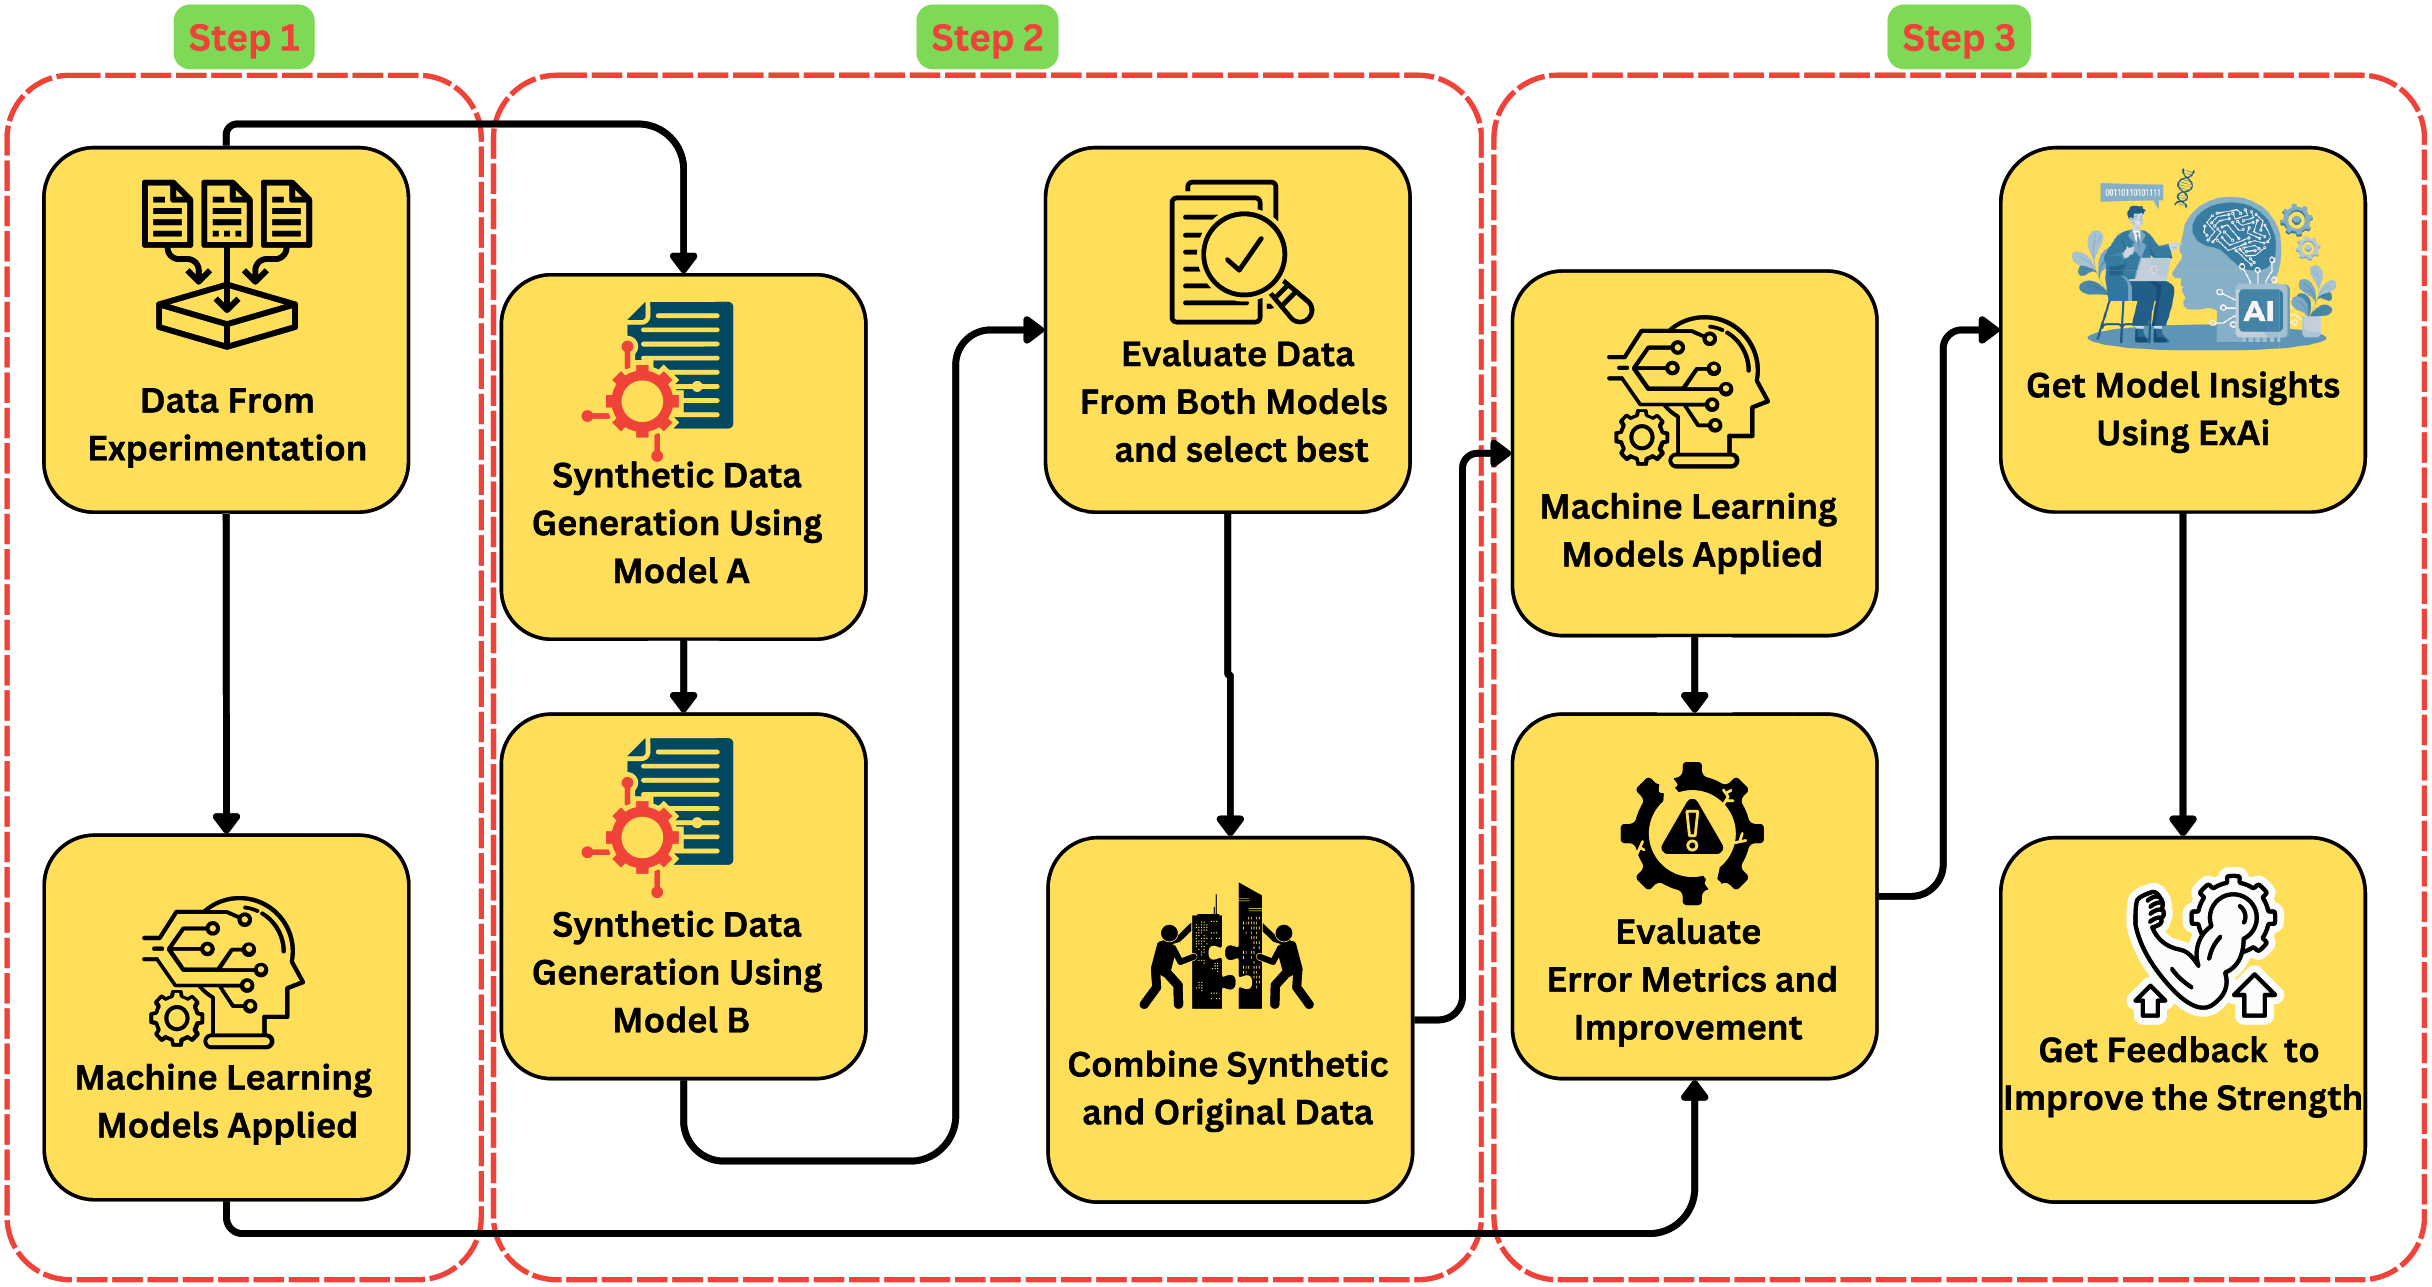
The methodology presented in Fig. 2 outlines a systematic approach to estimating the compressive strength of -incorporated concrete using a combination of data augmentation, ML modelling, and XAI techniques. The process is divided into three key steps:
-
1.
The workflow begins with model training on experimental data collected. Initial ML models create baseline performance measures.
-
2.
Synthetic data generation and integration: Two different models generate high-quality synthetic datasets. After evaluation, the best synthetic data is mixed with the real dataset to improve model training.
-
3.
Advanced ML models predict concrete compressive strength using the combined real and augmented dataset. SHAP provides transparency and understanding of feature contributions in model predictions.
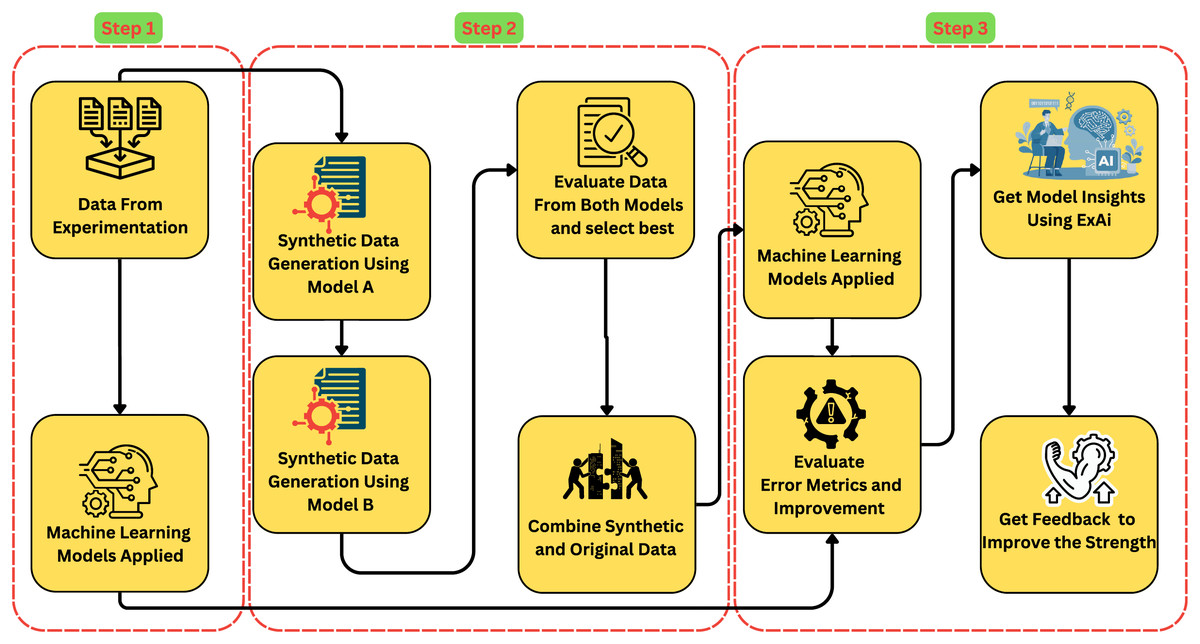
Figure 2: Framework for estimating compressive strength of -incorporated concrete.
This comprehensive approach not only seeks to boost prediction accuracy but also improves model interpretability, leading to improvements in sustainable concrete technology.
Problem formulation
The primary objective of this study is to develop an Artificial Intelligence (AI) model that can accurately forecast the compressive strength of concrete ( ) based on its mix proportions. The dataset , where is the number of samples and represents the features, poses challenges due to its limited size ( ) and the complex, non-linear relationships. Moreover, the lack of interpretability in traditional ML models requires methods to explain predictions, ensuring trust and usability in real-world applications. This study addresses these challenges through a comprehensive framework that integrates data augmentation, ML, and model explainability.
The first step in the proposed framework involves addressing data scarcity by generating synthetic samples using both CTGAN and TVAE. The CTGAN model and the TVAE model are independently trained on the original dataset D to generate synthetic datasets and respectively, each consisting of samples, where is the augmentation factor. A quantitative and qualitative comparison of the synthetic datasets is then conducted using evaluation metrics and model performance metrics when trained on the synthetic data. The framework selects the synthetic dataset characterised by superior quality and the most representative samples based on this comparison. The final augmented dataset is then constructed as:
(1) where is the superior synthetic dataset from either CTGAN or TVAE. This approach ensures that only the best-quality synthetic data is utilised, leading to improved model performance and robustness. The ML model is trained on with the objective of minimising prediction errors for compressive strength. The training process is governed by the following mathematical objective function:
(2) where denotes the loss function, chosen as Mean Squared Error (MSE):
(3) with representing the predicted strength for input . The framework incorporates Explainable AI (XAI) techniques to enhance model interpretability. SHAP is used to decompose predictions into feature contributions, providing insights into the relative importance of each feature. The SHAP decomposition is given by:
(4) where is the base value representing the average prediction, and quantifies the contribution of feature to the prediction for input . This interpretability ensures transparency and trust in the model’s predictions, making it suitable for practical applications. Further, the model undergoes iterative optimisation to improve its performance. This includes hyperparameter tuning and retraining to ensure the model achieves the best possible accuracy and generalisation. The optimisation process is reinforced through 10-fold cross-validation, which splits the dataset into 10 subsets, iteratively training the model on nine subsets while validating on the remaining subset. This method mitigates overfitting and yields a reliable assessment of the model’s efficacy. The evaluation metrics used to assess the model’s performance include Root Mean Squared Error (RMSE), Mean Absolute Error (MAE), and , which are defined as follows:
where is the mean of the true values . The final output is an optimised model that delivers accurate predictions for compressive strength while providing interpretable insights into the underlying factors. This framework effectively addresses the challenges of data scarcity, complexity, and model transparency in concrete strength forecasting.
Algorithm
The proposed Algorithm 1 integrates synthetic data generation to address data scarcity in concrete strength prediction. It combines real and synthetic data and trains ML models. Explainable AI methods, specifically SHAP, are employed to interpret feature contributions, enhancing model transparency.
| Input: Original dataset with rows and features. |
| Output: Optimized model with explainable insights. |
| /* Data Preparation*/ |
| 1 . |
| 2 . |
| /* Data Generation */ |
| 3 Train CTGAN and TVAE models and on D: , . |
| 4 Generate synthetic datasets and : , |
| , where k is the synthetic-to-real ratio. |
| 5 Compare synthetic datasets and select the best quality dataset: |
| . |
| 6 Combine real and selected synthetic data: . |
| /* Training */ |
| 7 Split into training ( ) and testing ( ) sets. |
| 8 Train ML model : . |
| /* Evaluation */ |
| 9 Evaluate on : |
| 10 Compute metrics , , and . |
| /* Optimization */ |
| 11 Refine through iterative retraining and hyperparameter tuning: |
| 12 . |
| /* Explainable AI */ |
| 13 Apply SHAP to interpret : |
| 14 |
| where are feature contributions. |
Results
Data preprocessing and analysis
The original dataset consists of 270 rows and includes the crucial factors affecting concrete compressive strength. The dataset comprises variables including the Water-to-Binder Ratio (WBRatio) between 0.350 and 0.550, OPC and PPC with values between 0.000 and 500.0 kg/m3, curing days (DAYS) spanning from 7 to 56 days, and dose varying from 0.000 to 0.200. Every row in the data shows a unique concrete mix configuration that relates these input variables to the measured compressive strength. The small size of the dataset and the complexity of the relationships among variables emphasise the need for synthetic data augmentation to support the training process of ML models and predictive accuracy. The variable WBRatio exhibits a narrow and consistent distribution, indicating minimal variability across the samples. Similarly, levels show a tightly clustered distribution, suggesting well-regulated conditions with limited variability. In contrast, DAYS, representing the curing age, displays a broader distribution, indicating diverse sample ages included in the dataset. The cement variables, OPC and PPC, also show consistent distributions, with OPC spanning a slightly wider range compared to PPC. Lastly, STRENGTH, representing material strength, exhibits significant variability between 20 and 60, reflecting the range of structural performance observed.
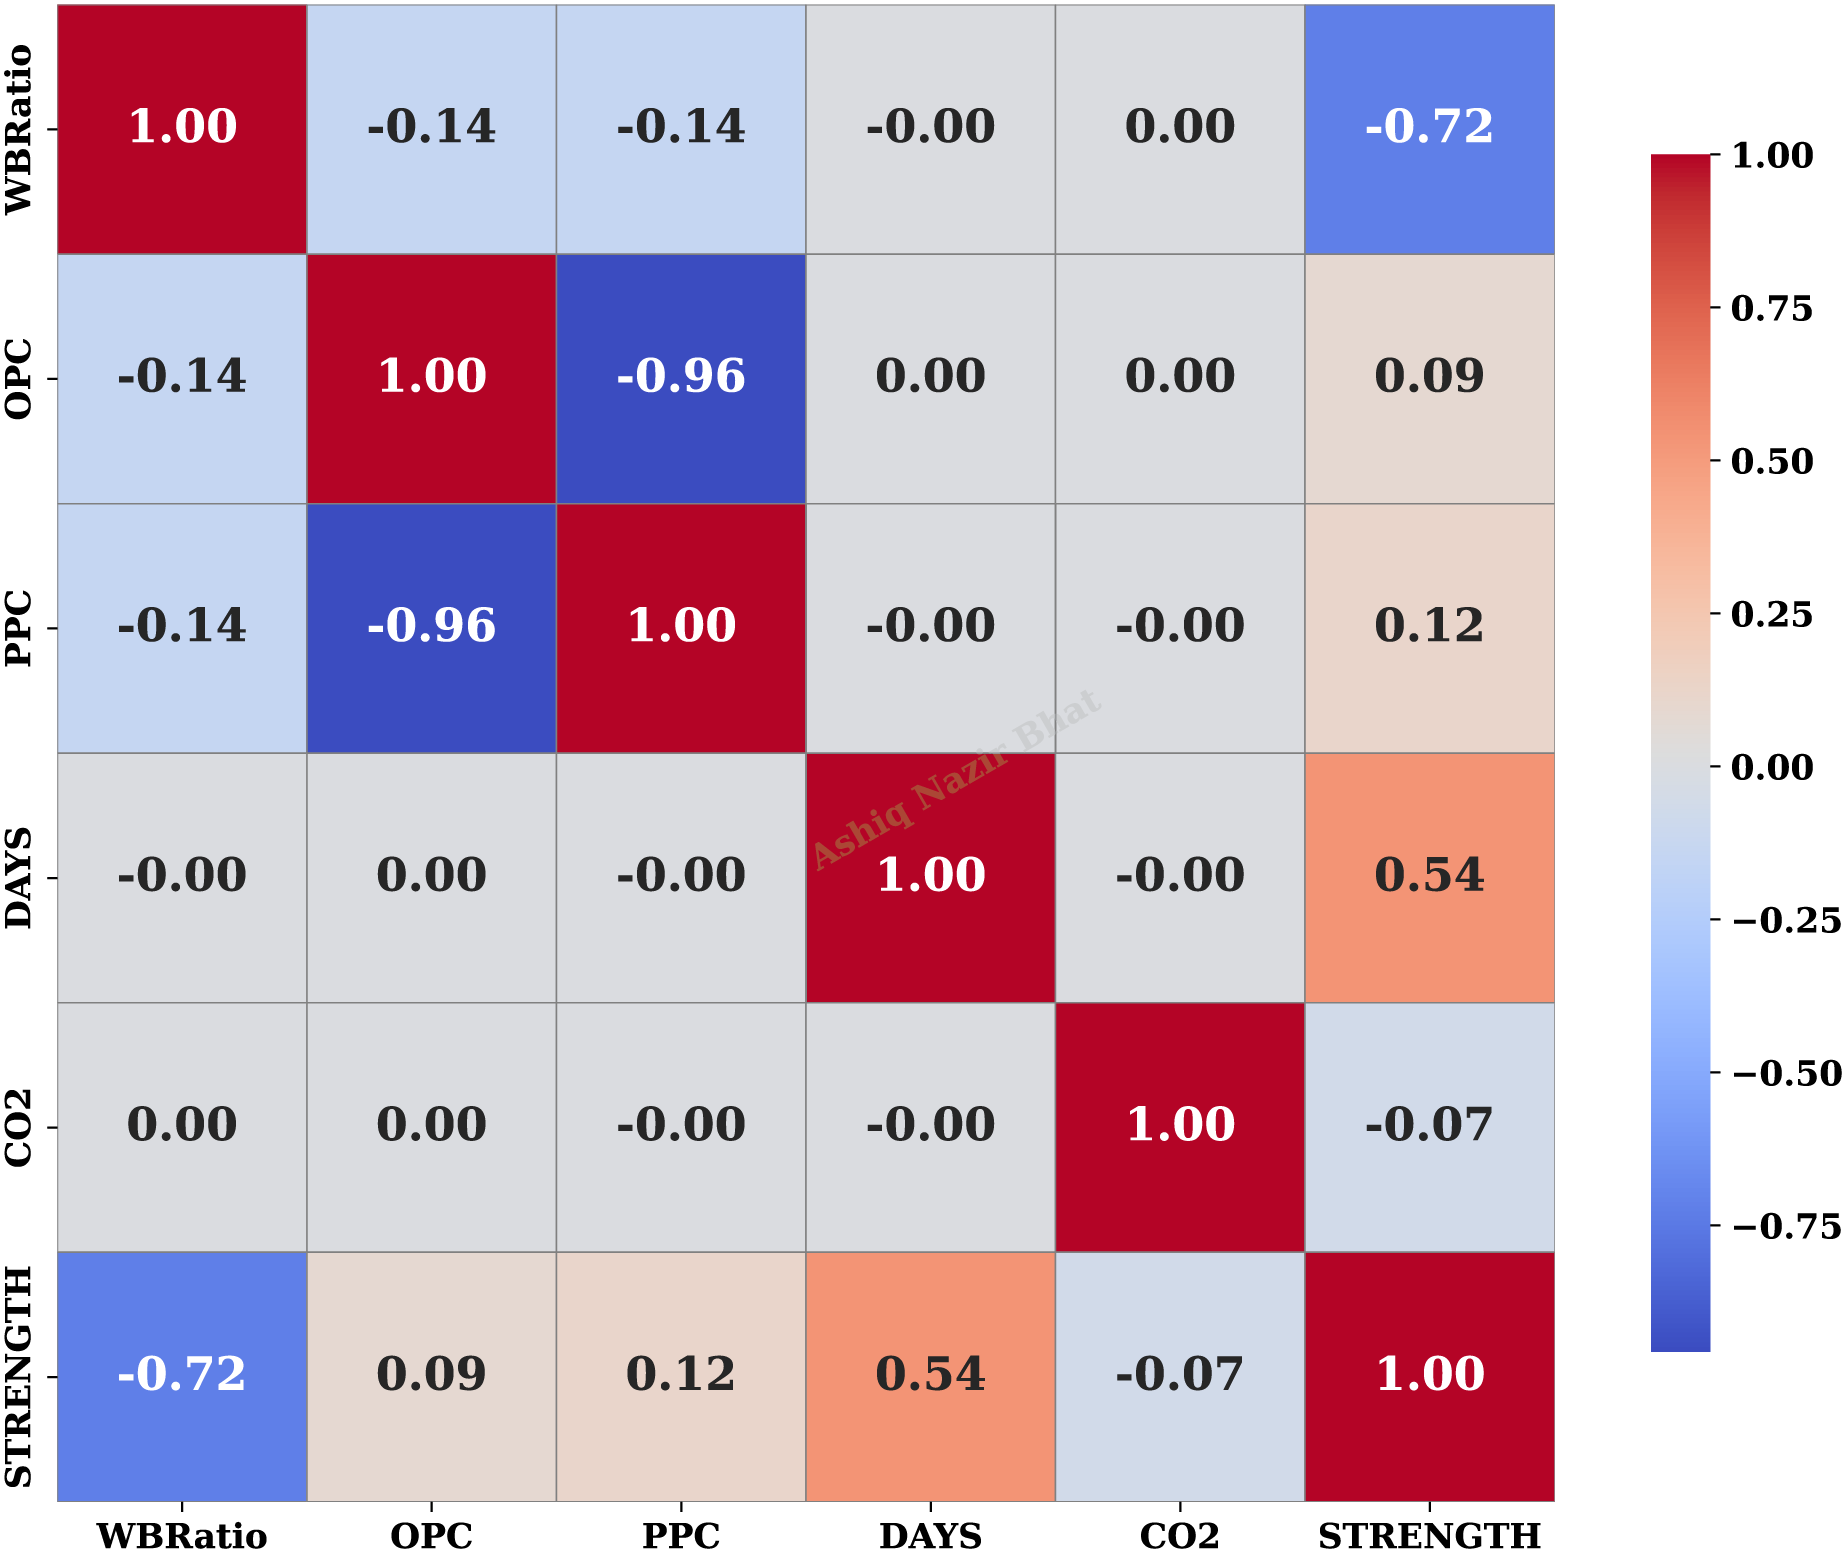
The correlation matrix in Fig. 3 reveals key relationships among the variables in the dataset. A strong negative correlation (−0.72) between the WBRatio and material strength (STRENGTH) indicates that higher water content reduces structural strength, aligning with known material science principles. Similarly, the strong inverse relationship (−0.96) between OPC and PPC reflects their complementary roles in material composition. The moderate positive correlation (0.54) between curing time (DAYS) and strength highlights the beneficial impact of extended curing on material performance. These findings emphasise the critical role of controlling the water-binder ratio and curing time to optimise material strength while highlighting the interplay between OPC and PPC in mixtures.

Figure 3: Correlation matrix of dataset features.
Data augmentation
The original dataset undergoes preprocessing, ensuring consistency and compatibility for subsequent steps. Small datasets often lead to models that are prone to overfitting, where the model learns specific patterns in the data rather than general trends, resulting in suboptimal performance. This can compromise the reliability of insights and predictions. To overcome data scarcity, CTGAN and TAVE are employed to generate synthetic data, which expands the dataset by producing samples that mimic the statistical properties of the original data. The process commenced with metadata detection using the Metadata method from the SDV library. Metadata serves as a critical component in preserving the structural integrity of synthetic data by capturing schema definitions, data types, and interdependencies among variables. This ensures that the generative model adheres to the logical and statistical constraints inherent in the original dataset. Both models were subsequently trained on the original data using 1,000 epochs to ensure convergence and learning of the underlying data distributions. The model generated 10,000 synthetic samples; the samples are filtered, and substantially high-quality data augment the dataset to enable more robust model development. The filtering process utilised Cook’s Distance to ensure the reliability of the generated synthetic data. Following the application of a linear regression model to the integrated real and synthetic dataset, we calculated Cook’s Distance for each synthetic sample to assess its impact on the model fit. Samples exhibiting a Cook’s Distance value exceeding 4/n were classified as high-influence outliers and subsequently excluded. This enabled the removal of synthetic samples that, although not definitive statistical outliers, had the potential to distort learning and diminish model robustness.
Synthetic data quality was evaluated through diagnostic and statistical similarity measures as shown in Table 3. Through data quality assessment reports for CTGAN and TVAE, it is evident that both models attain perfect scores in data validity, data structure, and general basic data quality, each scoring 100%. However, on closer examination of data structure elements, one finds notable variations. In both column shapes (97.42% vs. 85.79%) and column pair trends (94.59% vs. 62.97%), the TVAE model outperforms CTGAN. As a result, TVAE’s (96.01%) general data structure score is rather better than CTGAN’s (74.38%). Although both models preserve fundamental data integrity, TVAE generates synthetic data with a more accurate representation of feature distributions and relationships. Further, Column-wise data quality assessments, as in Table 4, confirm that TVAE consistently outperforms CTGAN across all evaluated criteria. The TVAE model demonstrates exceptional capability in maintaining the distributional integrity of the WBRatio (0.9978), OPC (0.9890), and CO2 (0.9823), achieving nearly perfect scores across the majority of columns. Conversely, CTGAN demonstrates challenges in capturing intricate relationships among these variables, evidenced by its relatively poor performance, particularly in the CO2 (0.7147) and STRENGTH (0.749) columns. The WBRatio exhibits the most significant disparity (0.656 vs. 0.9978), indicating that TVAE provides a more authentic synthetic representation of this crucial attribute. TVAE’s a superior ability to generate high-quality synthetic data that closely mirrors the statistical properties of the actual dataset. However, recognising that not all synthetic samples may accurately represent the original distribution. In such cases, outliers are removed, and only synthetic samples closely aligned with the original data distribution are retained.
| Evaluation metric | CTGAN (%) | TVAE (%) |
|---|---|---|
| Data validity | 100.0 | 100.0 |
| Data structure | 100.0 | 100.0 |
| Overall | 100.0 | 100.0 |
| Column shapes | 85.79 | 97.42 |
| Column pair trends | 62.97 | 94.59 |
| Overall | 74.38 | 96.01 |
| Column | Metric | CTGAN score | TVAE score |
|---|---|---|---|
| WBRatio | KSComplement | 0.765777 | 0.997833 |
| OPC | TVComplement | 0.985947 | 0.989000 |
| PPC | TVComplement | 0.966797 | 0.978800 |
| DAYS | TVComplement | 0.969233 | 0.951067 |
| CO2 | KSComplement | 0.714700 | 0.982300 |
| STRENGTH | KSComplement | 0.744969 | 0.946000 |
Note:
TVComplement, Total variation complement; KSComplement, Kolmogorov-Smirnov complement.
Machine learning modelling
Once the data preparation is complete, the final dataset obtained is split into training and testing sets in a (80:20) ratio. We utilised a 10-fold cross-validation strategy during the training phase to ensure robust model evaluation and prevent overfitting. This approach involves dividing the training data into ten subsets of equal size. In each iteration, nine folds are allocated for training, while the remaining fold serves for validation. This procedure is executed ten times, guaranteeing that each data point is utilised for validation precisely once. The resulting data is analysed using regression models, including a diverse range of ML models, including advanced algorithms such as Light Gradient Boosting Machine (LGBM), Gradient Boosting Regressor (GBR), RF, and K-nearest Neighbors Regressor (KNN). Ensemble techniques like AdaBoost Regressor (ADA) and Extra Trees Regressor (ET), along with Extreme Gradient Boosting (XGBoost), were also evaluated for their predictive performance. Traditional tree-based models, such as the Decision Tree (DT), were considered alongside linear models, including Linear Regression (LR) and Elastic Net (EN), to accurately estimate the compressive strength of -incorporated concrete. The models are rigorously evaluated using performance metrics, including MAE, RMSE, and .
The model performance using the original dataset is initially assessed to obtain the overall improvement in the model predictability after data augmentation. The Table 5 presents a comprehensive comparison of various regression models. The results highlight LGBM as the best-performing model across metrics, achieving the lowest MAE (2.5954) and RMSE (3.1579), as well as the highest R2 score (0.9356). This suggests LGBM’s superior ability to capture patterns in the data with minimal error. This suggests that LGBM not only reduced errors but also accounted for the greatest percentage of variance in the target variable, thereby illustrating its generalisation and robustness. GBR and RF also demonstrate strong performance, though slightly less optimal compared to LGBM. Ensemble models, such as ADA and ET, show moderate performance. On the other hand, simpler models like LR and EN exhibit significantly higher errors and lower R2 scores, indicating their limited capability. These results suggest that linear models struggled to capture the underlying relationships within the dataset.
| Model | MAE | RMSE | R2 |
|---|---|---|---|
| LGBM | 2.5954 | 3.1579 | 0.9356 |
| GBR | 2.6934 | 3.2865 | 0.9299 |
| RF | 2.8967 | 3.5157 | 0.9216 |
| KNN | 2.9203 | 3.5510 | 0.9171 |
| ADA | 3.0062 | 3.7472 | 0.9079 |
| ET | 3.1587 | 3.8622 | 0.9049 |
| XGBoost | 3.2000 | 3.8744 | 0.9042 |
| DT | 3.2426 | 3.9587 | 0.9003 |
| LR | 4.7495 | 5.7305 | 0.7850 |
| EN | 4.9119 | 6.0493 | 0.7528 |
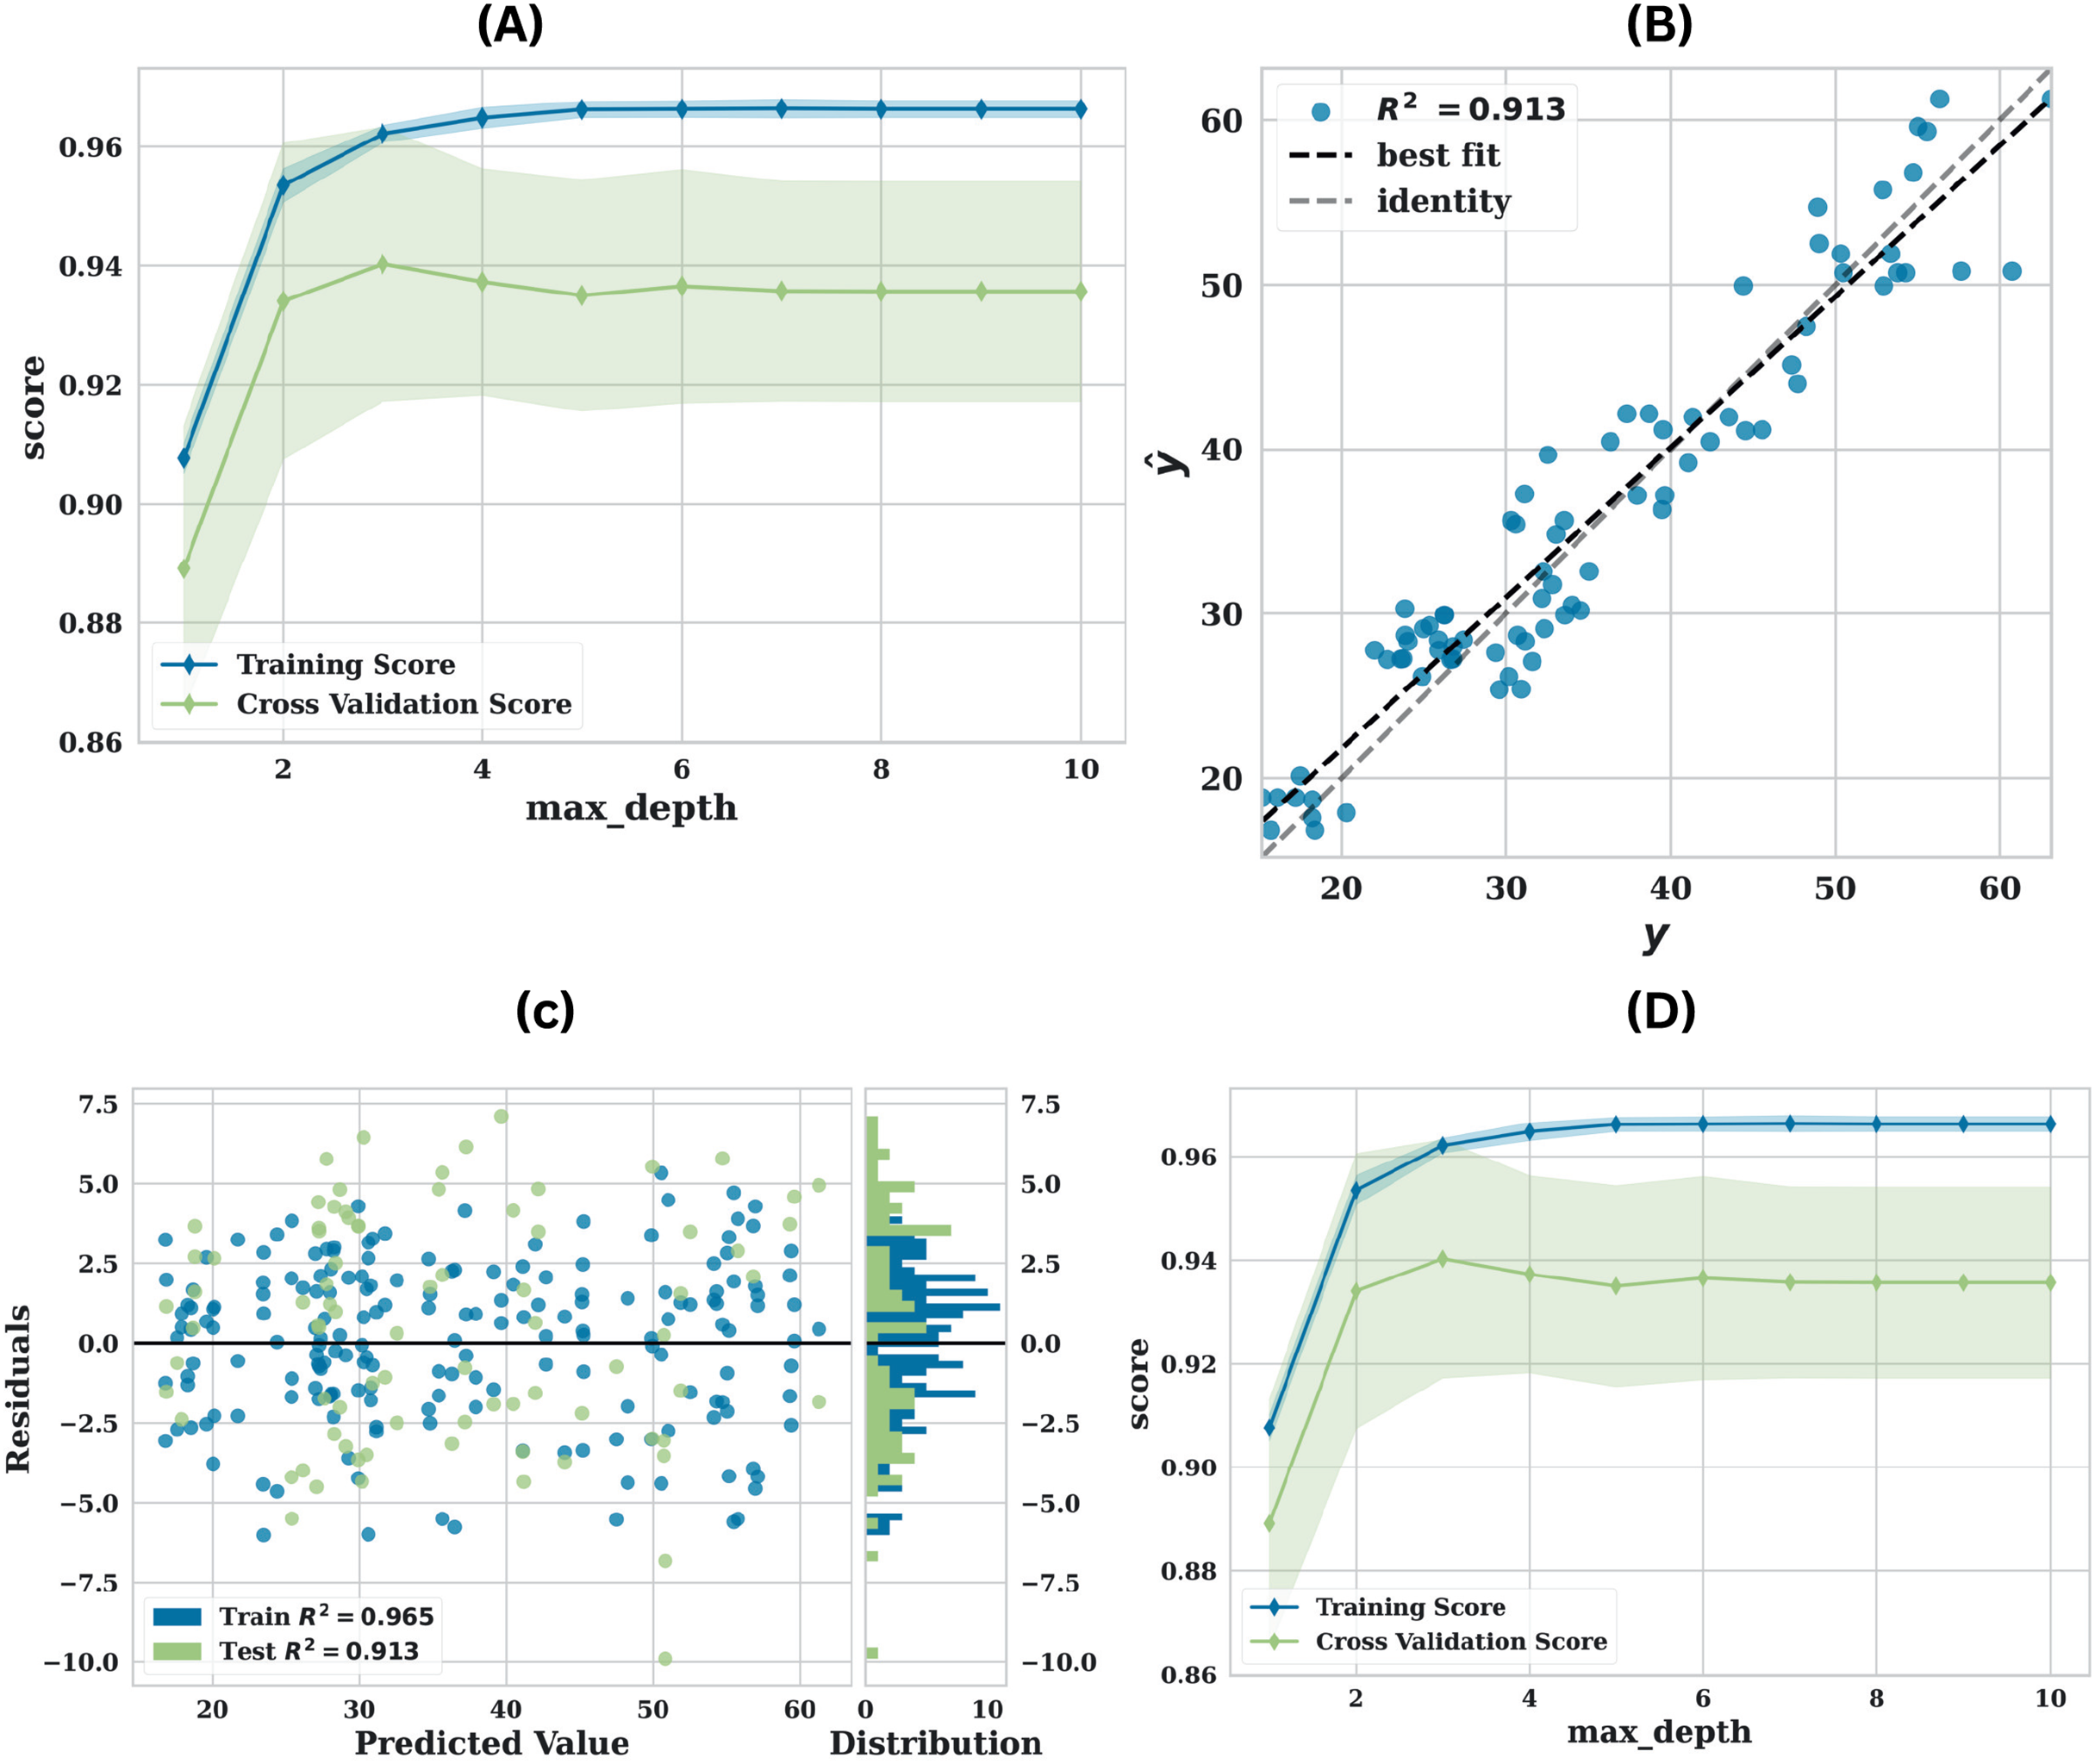
The LGBM model’s robust performance is collectively illustrated by the Fig. 4 that has been presented. The model’s performance is illustrated by the learning curve Fig. 4A, which demonstrates strong generalisation capability with minimal overfitting as the number of training epochs increases. This is evidenced by the convergence of training and validation scores. This equilibrium implies that the model is neither overfitting nor underfitting. The model’s strong predictive accuracy and calibration are further emphasised by the high value (0.913) and the tight clustering around the identity line in the prediction error plot Fig. 4B, which compares the predicted values ( ) to the actual values ( ). By visualising the distribution of prediction errors, the residuals diagram Fig. 4C provides an additional layer of diagnostic analysis. The model predictions show no significant bias, as evidenced by the random dispersion around the zero line. The histogram’s roughly normal error distribution suggests that the model performs well without systematic deviations. The validation curve Fig. 4D offers a comprehensive understanding of the impact of the max_depth hyperparameter on the model’s performance. It illustrates that the model obtains optimal performance at a max depth of approximately 4–6, the parameters utilised are presented in Table 6.
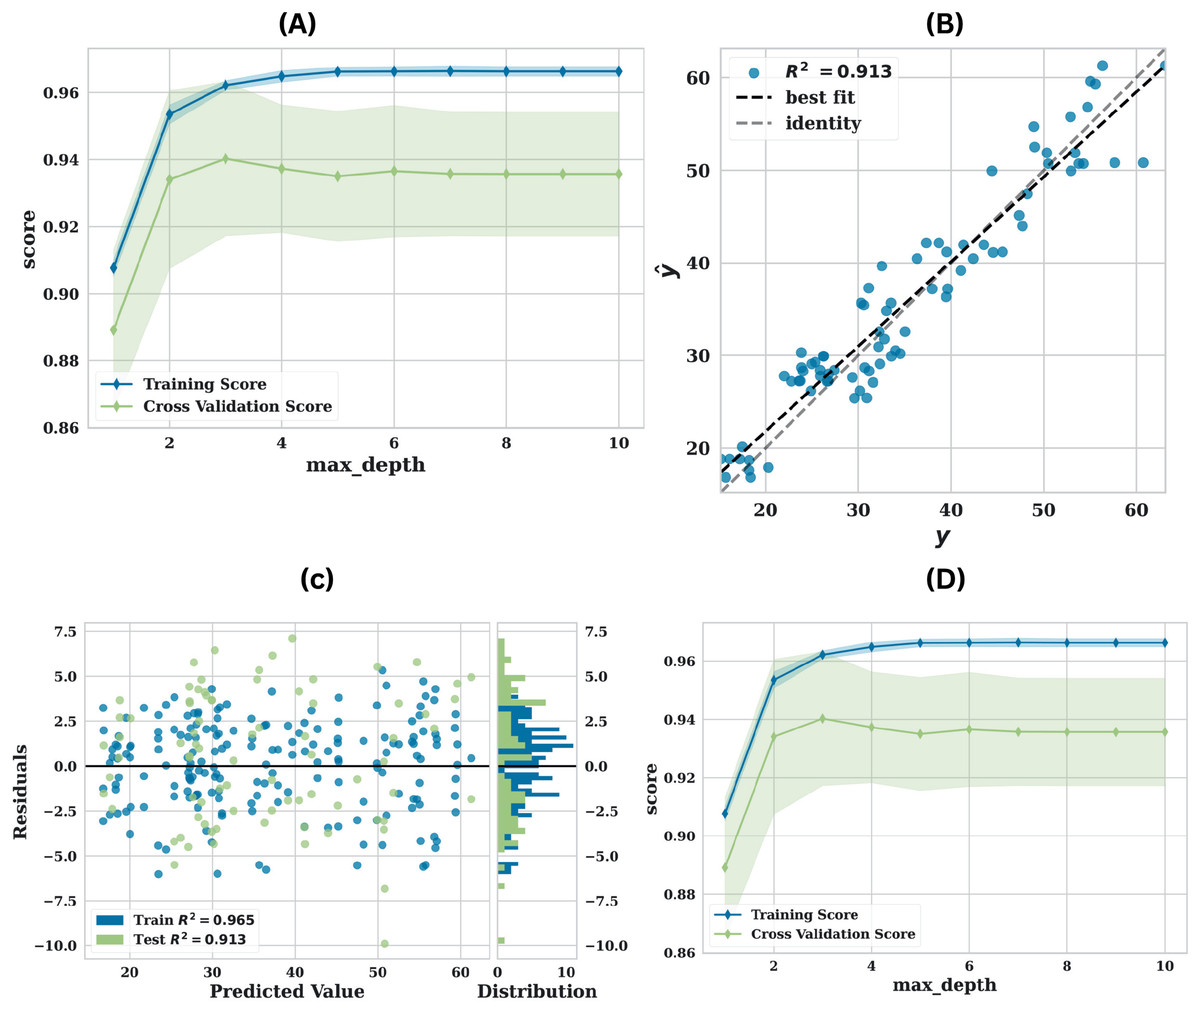
Figure 4: Performance of LGBM utilising original data (A) learning curve, (B) prediction error plot, (C) residuals plot and (D) validation curve.
| Parameter | Value | Description |
|---|---|---|
| boosting_type | gbdt | Boosting algorithm type (Gradient boosted decision trees) |
| learning_rate | 0.4 | Step size shrinkage to prevent overfitting |
| num_leaves | 150 | Maximum number of leaves per tree |
| max_depth | −1 | Maximum tree depth |
| n_estimators | 20 | Number of boosting iterations |
| feature_fraction | 0.5 | Fraction of features used in each iteration |
| bagging_fraction | 0.9 | Fraction of data used for bagging |
| bagging_freq | 3 | Frequency of bagging |
| min_child_samples | 6 | Minimum number of samples per leaf |
| min_child_weight | 0.001 | Minimum sum of instance weight per leaf |
| min_split_gain | 0.3 | Minimum loss reduction to make a split |
| reg_alpha | 0.005 | L1 regularization term on weights |
| reg_lambda | 0.0005 | L2 regularization term on weights |
| random_state | 123 | Random seed for reproducibility |
| folding_strategy | KFold(10) | 10-fold cross-validation |
In comparison to the original dataset, the performance of ML models on the augmented dataset exhibits a significant improvement in all evaluation metrics, as illustrated in Table 7. The augmented dataset improved the of the majority of models and reduced estimation errors. LGBM maintains its lead in performance, with an MAE of 1.1847, an RMSE of 1.3833, and an of 0.9872. In the same way, other ensemble models, including ET, GBR, and RF, exhibit robust performance, with values that are nearly identical, ranging from 0.9872 to 0.9848. Interestingly, KNN also demonstrates improved performance (MAE = 1.2665, RMSE = 1.5335, = 0.9843), which is a significant improvement from its original dataset performance. However, ADA exhibits less improvement, with an increase in from 0.9079 to 0.9616, but it continues to lag behind the dominant models. The weakest performers are linear models, including LR and EN, despite the augmentation of the dataset. Although the R2 of LR has slightly improved from 0.7850 to 0.8458, EN continues to struggle with an of 0.5851. This validates the idea that the data’s complexity still necessitates more advanced, non-linear modelling methods.
| Model | MAE | RMSE | R2 |
|---|---|---|---|
| LGBM | 1.1847 | 1.3833 | 0.9872 |
| GBR | 1.2657 | 1.5108 | 0.9848 |
| RF | 1.1849 | 1.3843 | 0.9872 |
| KNN | 1.2665 | 1.5335 | 0.9843 |
| ADA | 1.9324 | 2.3998 | 0.9616 |
| ET | 1.1850 | 1.3846 | 0.9872 |
| XGBoost | 1.1848 | 1.3842 | 0.9872 |
| DT | 1.1850 | 1.3847 | 0.9872 |
| LR | 3.9731 | 4.8093 | 0.8458 |
| EN | 5.6742 | 7.8864 | 0.5851 |
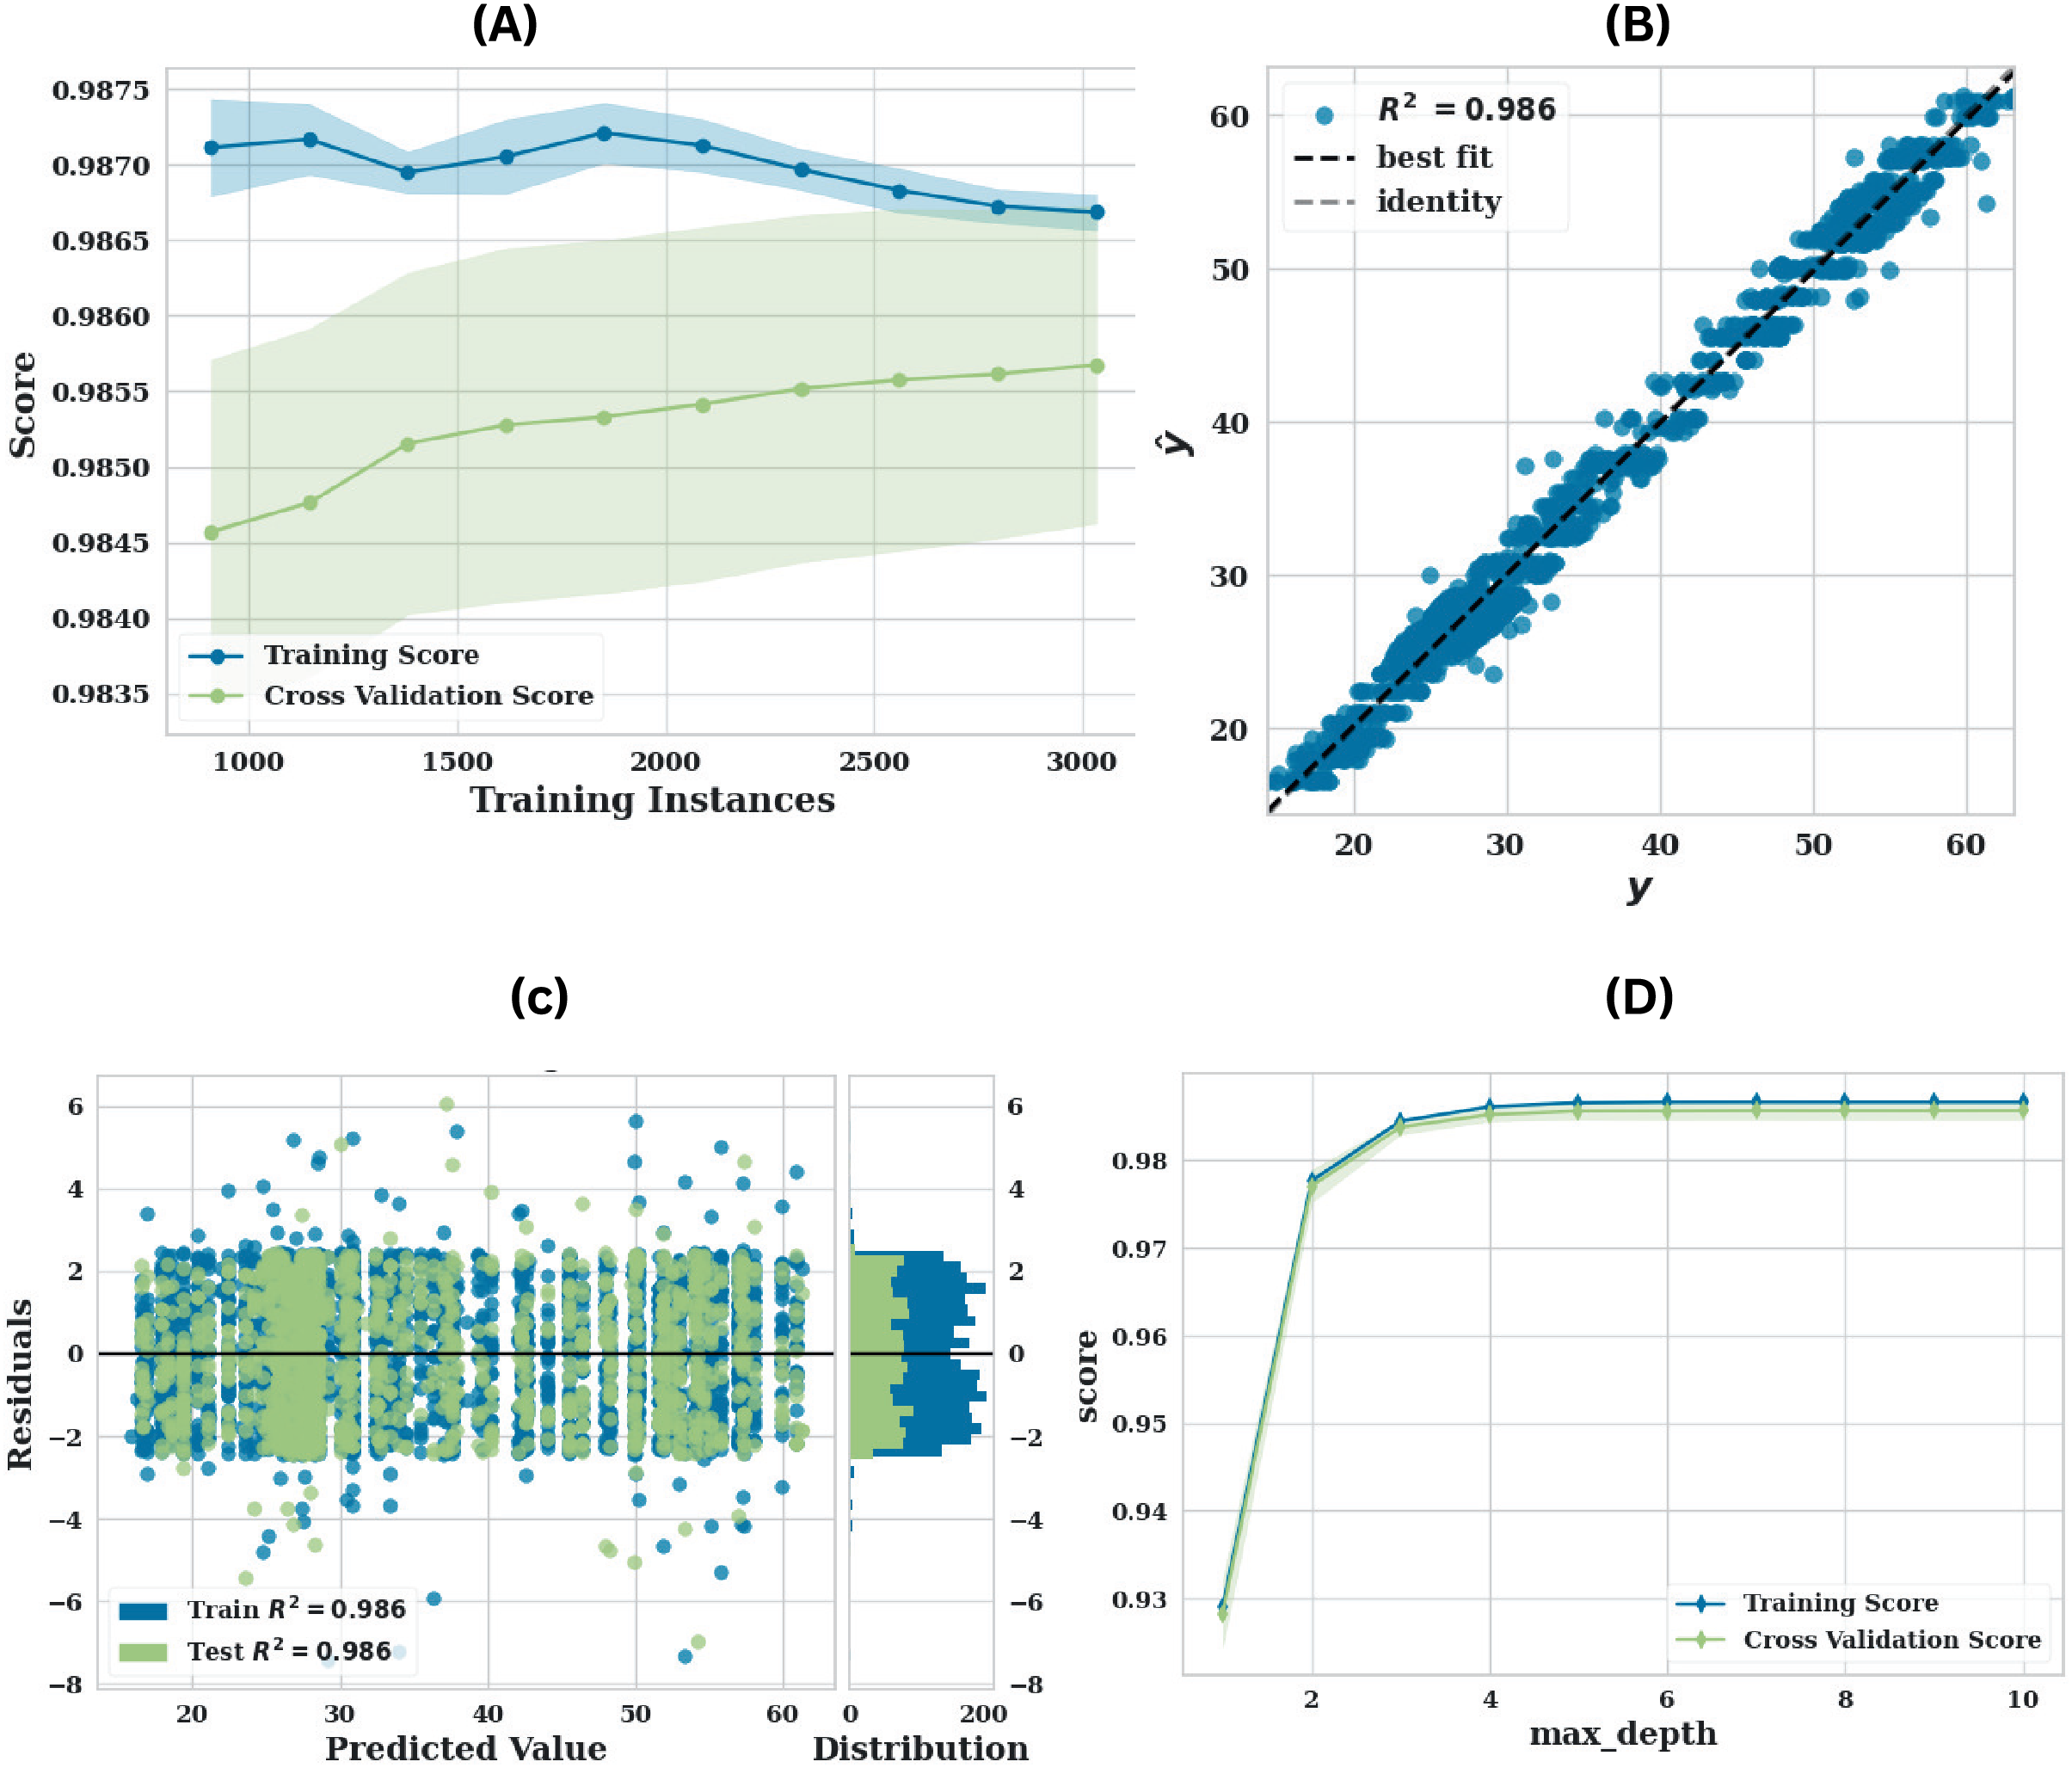
The LGBM model exhibits a significant improvement in performance against the original dataset on the augmented dataset, as illustrated in Fig. 5. The learning curve Fig. 5A emphasises a robust generalisation capability as the training and cross-validation scores closely converge. This improved performance is further substantiated by the prediction error plot Fig. 5B, which displays an value of 0.988. This enhancement suggests that the model trained on the augmented data is capable of predicting values with a significantly higher degree of precision. The model calibration is improved by the denser and more consistent distribution of points along the diagonal, which implies a reduced number of outliers. The distribution of residuals is more densely concentrated around the zero line in the residuals plot Fig. 5C than in the original dataset. Further, demonstrates a more concentrated and symmetrical distribution, while the residuals exhibit less variance. The validation curve Fig. 5D suggests that the model’s performance is less susceptible to fluctuations in the max-depth hyperparameter on the augmented dataset. The validation score remains high across a broader range of max-depth values, indicating that the augmented data not only enhanced performance but also increased model robustness and reduced the risk of overfitting.
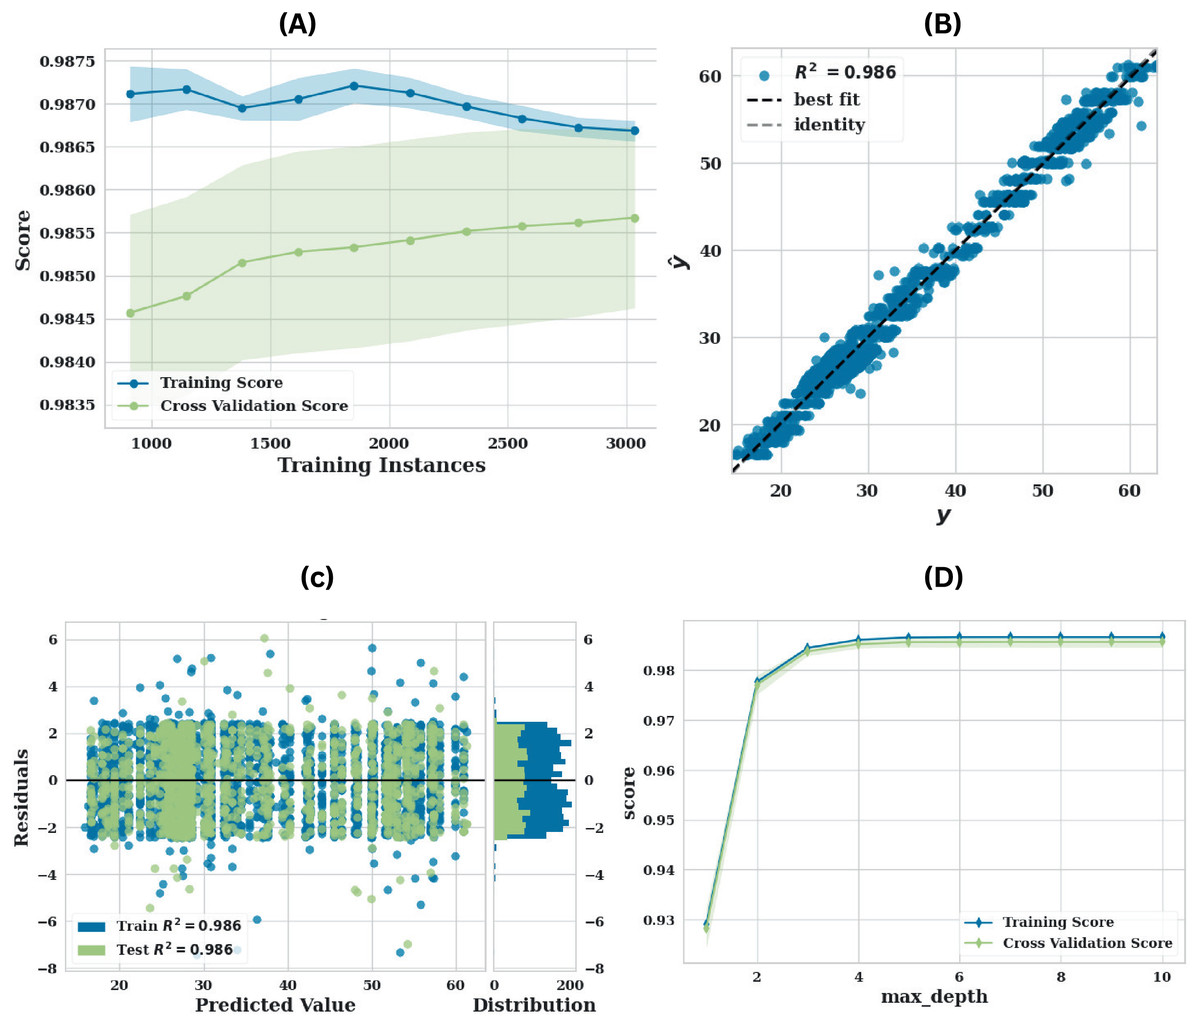
Figure 5: Performance of LGBM utilising augmented data (A) learning curve, (B) prediction error plot, (C) residuals plot and (D) validation curve.
Explainable artificial intelligence
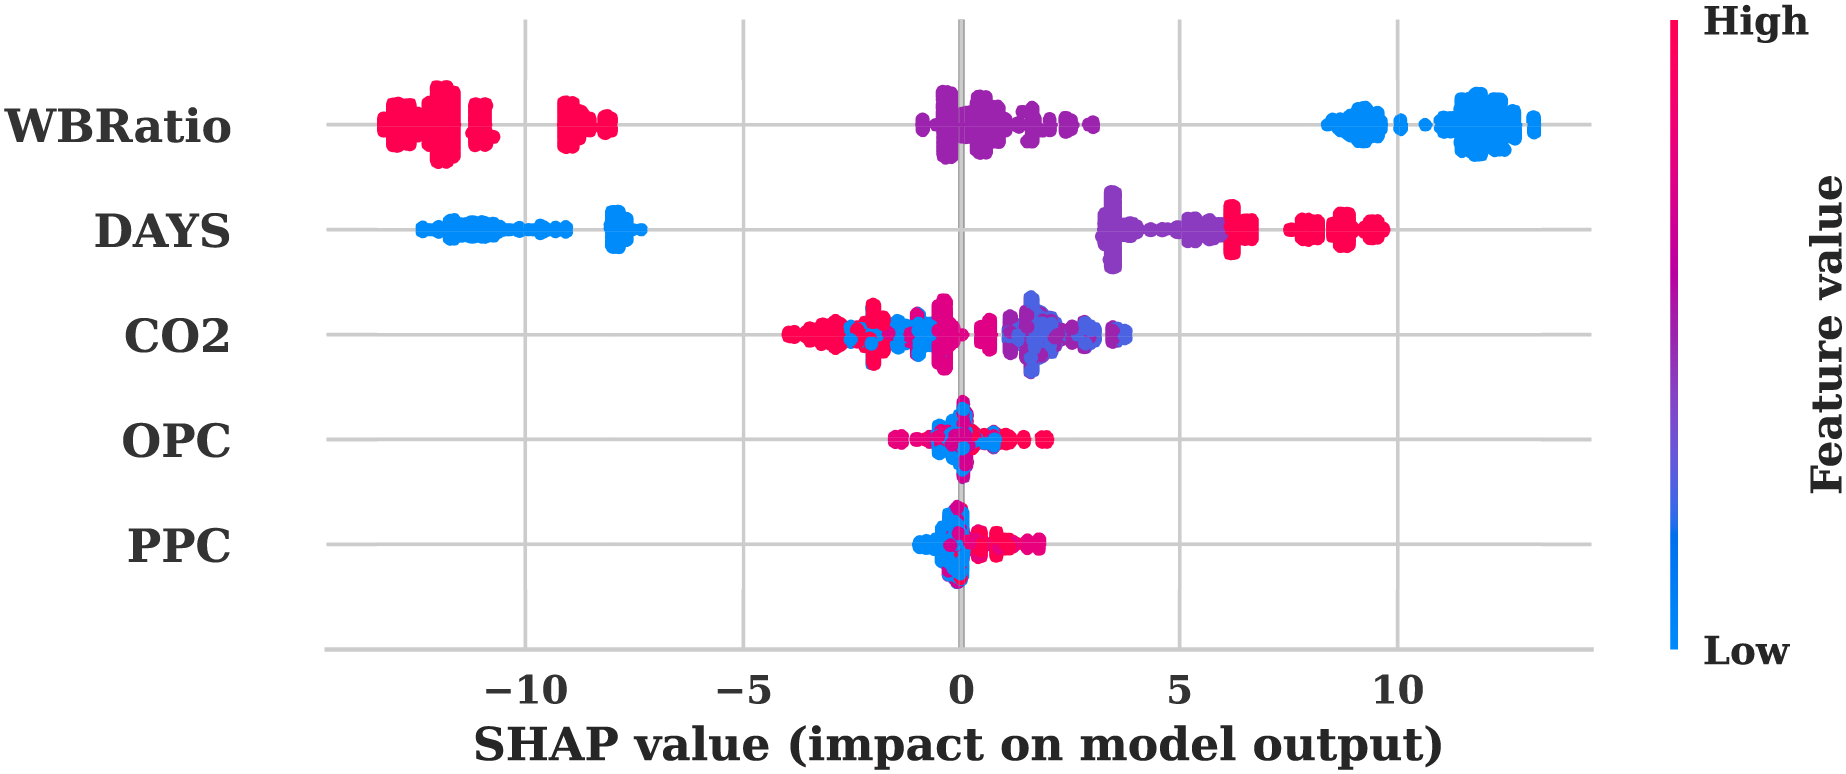
The SHAP summary graphs from both the original Fig. 6 and augmented data Fig. 7 provide a comprehensive visualisation of the significance of features and their influence on the model’s predictions. Consistency in the model’s interpretation of feature influences is indicated by the identical feature rankings and SHAP value distributions in the analysis of both plots. The most influential features of PPC, OPC, , DAYS, and WBRatio were analysed. The strong predictive power of the model is demonstrated by the broad distribution of SHAP values. OPC and exhibit substantial impacts, as evidenced by the extensive SHAP value ranges that indicate their critical roles in shaping the model output. In contrast, the SHAP value distributions of DAYS and WBRatio are more restricted, which indicates a more modest impact on predictions and potentially less predictive strength.
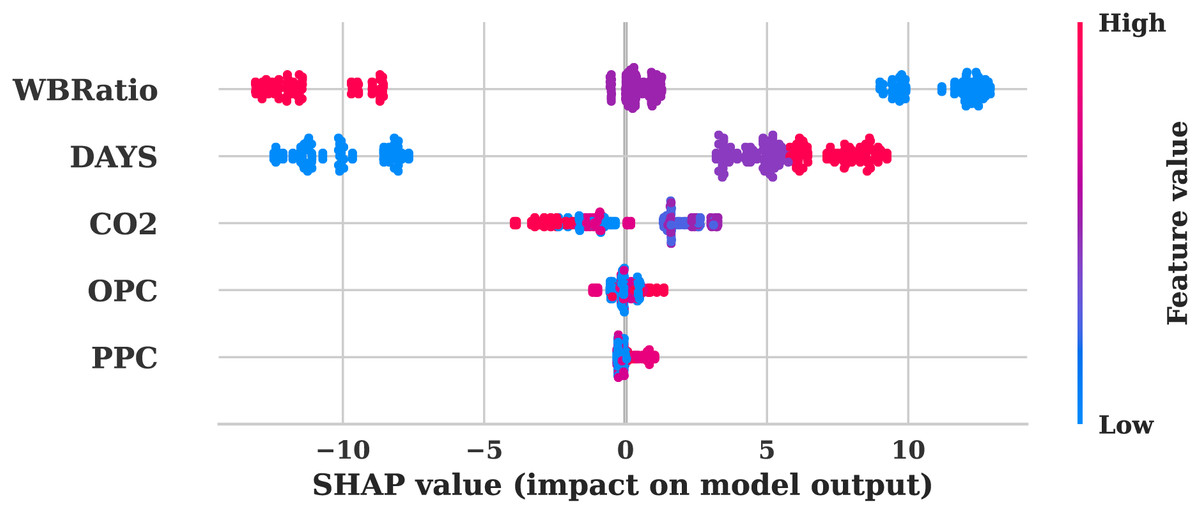
Figure 6: SHAP summary plot for the original dataset.
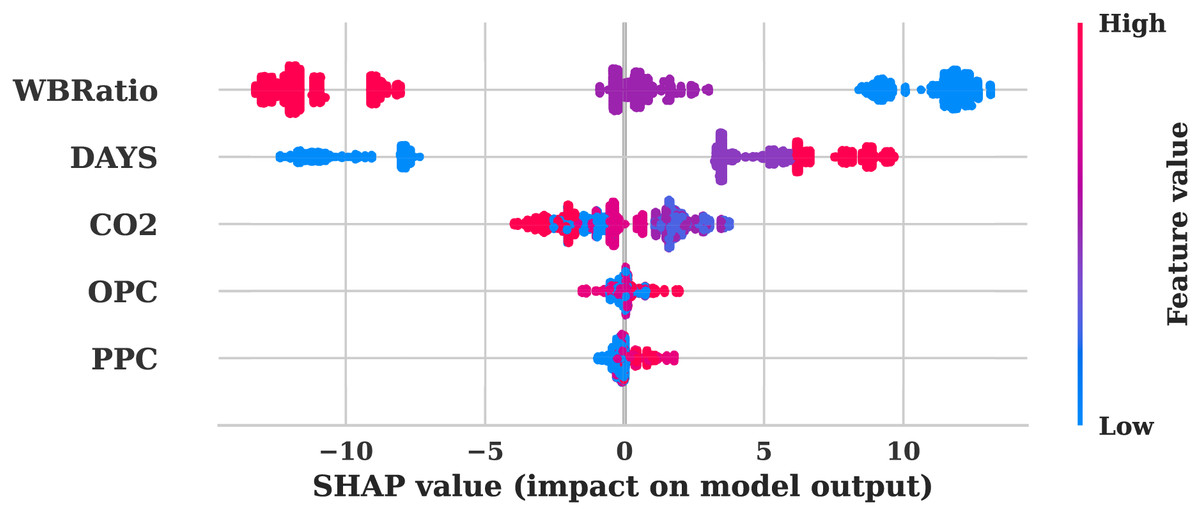
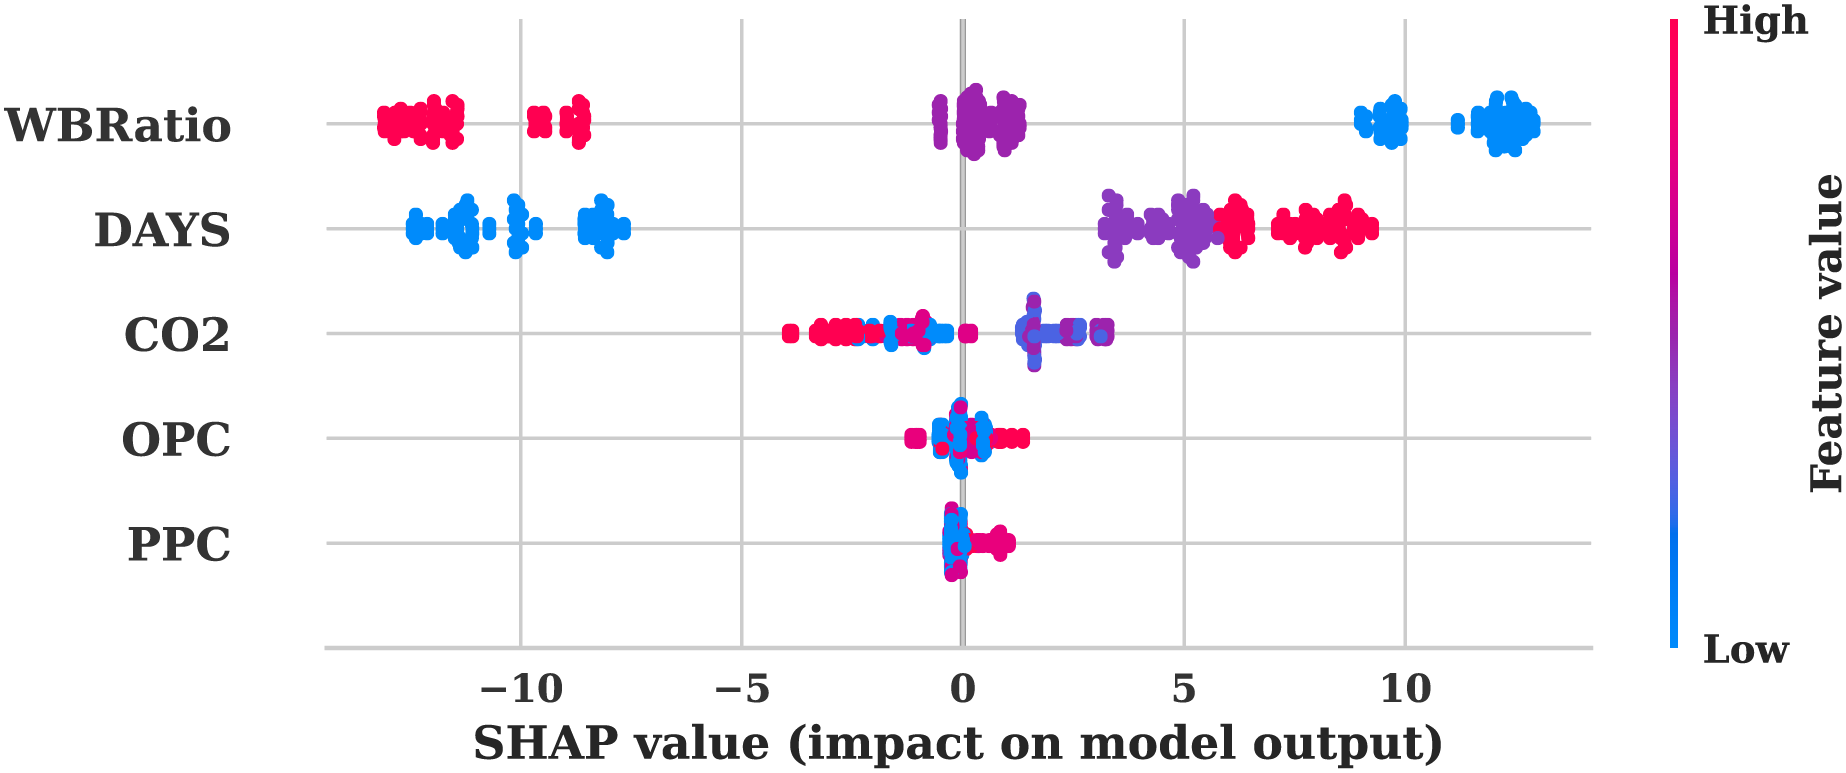
Figure 7: SHAP summary plot for the augmented dataset.
The uniform influence of features on model predictions in both scenarios is underscored by the consistent SHAP value range of −10 to 10 across plots. The correlation between the magnitude of the feature and the direction of the prediction is facilitated by the colour gradient from low to high feature values. For instance, positive SHAP values, indicated by darker colours, indicate a direct relationship with the model’s output. The vertical dispersion observed in PPC and OPC suggests potential feature interactions or non-linear influences effectively represented by the model, while the balanced SHAP value spread for suggests a linear or consistently influential relationship across its value range. The model’s feature attributions remain unaltered, as evidenced by the identical nature of both SHAP plots. This consistency suggests that the data augmentation procedure maintained the same feature distributions and relationships.
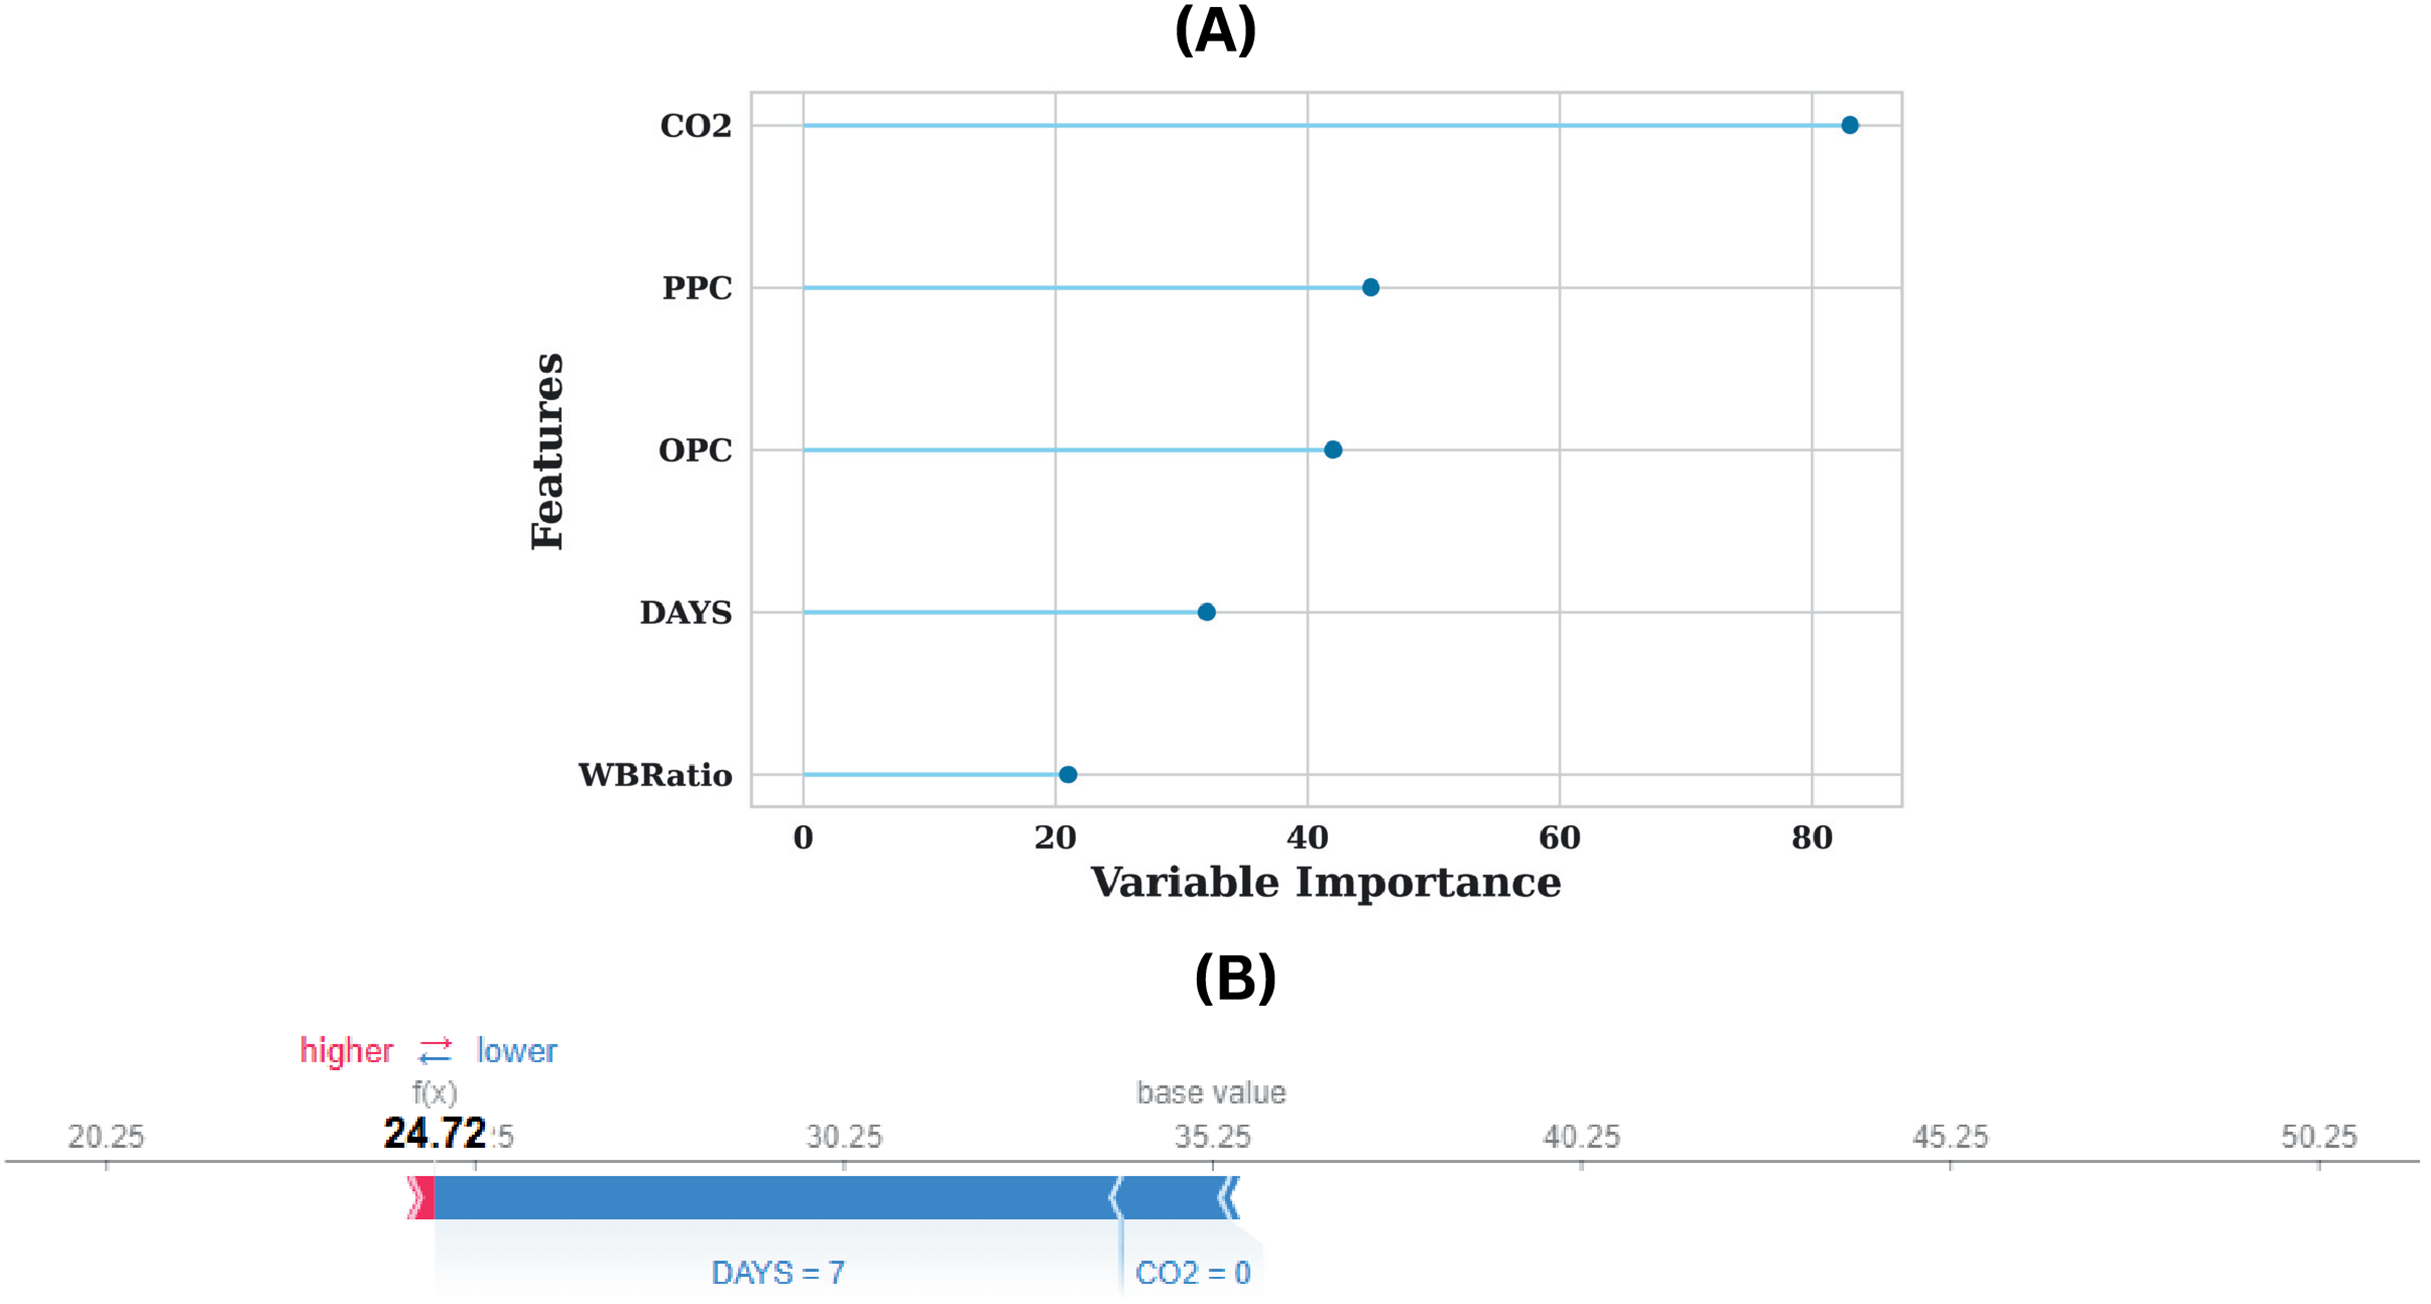
The interpretability and predictive capacity of the model, as illustrated in Fig. 8A, are considerably enhanced, as demonstrated by the feature importance plot for the augmented dataset. The feature’s dominance is the most significant observation, as it has a variable importance score of approximately 300, indicating that it has a substantial impact on the model’s predictions. Other features, including DAYS, WBRatio, OPC, and PPC, also influence the model’s decision-making to a lesser extent. The model’s comprehensive visualisation of the contribution of individual features to a specific estimation is illustrated in the SHAP force plot in Fig. 8B. The model anticipates a value of 24.72, which is significantly lower than the base value of approximately 35.25. The estimated value is substantially reduced by the most influential feature in this prediction, DAYS, which has a value of 7. The estimation is pushed toward a lower outcome as a result of the significant negative impact indicated by the blue bar associated with DAYS. This implies that the estimation value is significantly reduced by higher values of DAYS, underscoring the model’s sensitivity to this feature. Furthermore, the estimation is also adversely affected by the feature, which has a value of 0, although to a lesser extent than DAYS. The predicted value is further reduced by the narrower blue bar associated with , which reinforces its modest yet tangible impact.
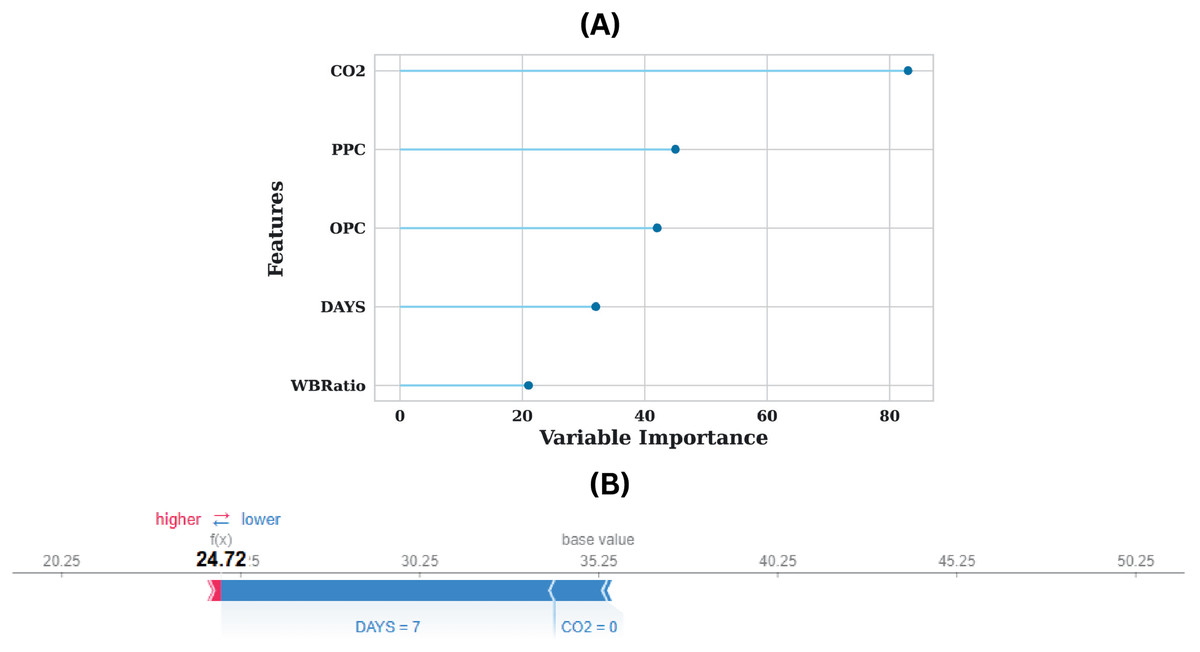
Figure 8: (A) Feature importance plot for the dataset and (B) SHAP force plot demonstrating feature contributions to model prediction.
The plot effectively distinguishes the direction of influence, with blue indicating features that contribute to a reduced estimation error. The absence of red bars indicates that no features in this instance influenced the prediction to a higher value, indicating a cumulative downward influence on the estimated output. The model’s prediction is reduced from the base value of 35.25 to 24.72 as a result of the combined effects of DAYS = 7 and = 0, which highlights the extent of these features’ influence. The plot improves the interpretability of the model by clarifying the impact of feature values on specific predictions from a practical standpoint. A DAYS value of 7 is indicative of an early-stage curing period, which is typically associated with lower strength values in applications such as concrete strength estimation. This value is consistent with the reduced estimation. Likewise, a value of 0 indicates that the environmental or compositional conditions are additional factors that contribute to the lower strength outcomes. The insights obtained from this force plot not only enhance comprehension of the model’s decision-making process but also offer practitioners actionable information. For example, strategies that involve changing feature values, such as optimising curing time (DAYS) or managing exposure, have the potential to enhance predicted outcomes.
Interpreting SHAP for concrete mix design
The SHAP analysis not only identifies the most significant variables in forecasting compressive strength but also offers prescriptive guidance for optimising concrete mixtures. The uniform feature rankings in both datasets indicate that the model is consistent in domain-specific correlations. Specifically, demonstrates the greatest SHAP value magnitudes, signifying a substantial impact on strength. Positive SHAP results at moderate concentrations show that regulated curing can improve strength; however, negative SHAP values at zero or minimal exposure imply a decline in performance. This suggests that implementing curing at optimised dosages enhances results, while preventing high amounts that may lead to declining strength. Likewise, curing time (DAYS) has an inverse correlation in the initial stages: substantial negative SHAP values for brief curing durations (e.g., 7 days) signify diminished strength, consistent with cement hydration dynamics. Prolonging curing beyond initial stages, especially for mixtures with significant early age sensitivity, can enhance forecasts favourably, therefore augmenting performance. Binders like OPC and PPC have extensive SHAP value distributions, indicating significant interaction effects with curing time and dosage.
Discussion
This study presented a framework for predicting the compressive strength, enhanced through synthetic data generation using the TVAE model. The approach addresses data scarcity challenges by augmenting limited experimental datasets with statistically validated synthetic samples. Further, integration of a filtering mechanism using Cook’s Distance to eliminate synthetic outliers that could compromise model reliability. The models demonstrated high predictive accuracy. These findings suggest that the proposed framework can serve as a scalable and efficient tool for early-stage mix design evaluation, potentially reducing the need for extensive laboratory testing in standard design scenarios. Despite the promising results, the study has certain limitations that warrant consideration. While the validity of the synthetic data was evaluated statistically and a small subset of generated mixes was experimentally verified. The experimental compressive strengths of selected synthetic designs were within of the predicted values. However, such partial validation does not account for more complex phenomena, such as carbonation-induced alterations in hydration kinetics. Furthermore, the models were trained exclusively on OPC and PPC-based concretes with defined water-to-binder ratios and curing regimes. As a result, the models are applicable primarily for interpolation within this domain, and extrapolation to high-performance concrete, ultra-high-performance concrete, self-compacting concrete, or varying environmental exposures (e.g., humidity and temperature) should not be assumed without retraining and independent validation using representative datasets. Future studies should incorporate multi-source experimental data that includes various binder systems, admixtures, and curing methods to improve generalizability.
Conclusion
This study focuses on the incorporation of during mixing as an effective carbon sequestration strategy, contributing to the reduction of atmospheric . The regulated integration of during mixing improves concrete compressive strength, with optimal results reported at 0.05–0.10% dosage. The improvement in strength is more significant in mixes with reduced water-cement ratios (0.35 and 0.45). Beyond 0.10% dosage leads to a decline in strength owing to carbonation-induced interference with hydration. OPC mixes demonstrate superior sensitivity to higher dosages compared to PPC, which is also depicted from ExAI results. Further, it successfully demonstrates a robust approach for estimating the compressive strength of incorporated concrete by integrating advanced ML techniques with synthetic data generation. The proposed framework effectively addresses the challenges associated with limited experimental data by generating and rigorously validating synthetic data. The exceptional predictive performance of the model, with an value of 0.9872 exhibiting 5.52% improvement, MAE of 1.1847 indicating 54.35% improvement, and RMSE of 1.3833 with 56.20% improvement, underscores the efficacy of combining synthetic data augmentation. The incorporation of XAI techniques bridges the gap between the model’s complexity and its interpretability, fostering confidence in its deployment within the construction, materials science and industries. Future research will focus on broadening the applicability of this framework to other domains facing similar data scarcity challenges, exploring its potential in diverse research and industrial applications.
Supplemental Information
Original Experimental Dataset.
Each data point speaks about the strength of the concrete.