
PGLD-YOLO: a lightweight algorithm for pomegranate fruit localisation and recognition
- Published
- Accepted
- Received
- Academic Editor
- Paulo Jorge Coelho
- Subject Areas
- Algorithms and Analysis of Algorithms, Artificial Intelligence, Computer Vision, Data Mining and Machine Learning, Neural Networks
- Keywords
- YOLOv10s, Fruit identification, Lightweight network, Attention mechanism
- Copyright
- © 2025 Lu et al.
- Licence
- This is an open access article distributed under the terms of the Creative Commons Attribution License, which permits unrestricted use, distribution, reproduction and adaptation in any medium and for any purpose provided that it is properly attributed. For attribution, the original author(s), title, publication source (PeerJ Computer Science) and either DOI or URL of the article must be cited.
- Cite this article
- 2025. PGLD-YOLO: a lightweight algorithm for pomegranate fruit localisation and recognition. PeerJ Computer Science 11:e3307 https://doi.org/10.7717/peerj-cs.3307
Abstract
Accurate localisation and recognition of pomegranate fruits in images with background interference are crucial for improving the efficiency of automated harvesting. To address the issues of excessive model parameters, high computational complexity, and inadequate detection accuracy of the existing pomegranate fruit detection algorithms, this study proposes a lightweight pomegranate fruit detection algorithm, You Only Look Once (YOLO) for Pomegranate Lightweight Detection (PGLD-YOLO), based on an enhanced YOLOv10s framework. First, to reduce the model’s size, parameter count, and computational complexity, the lightweight ShuffleNetV2 network is employed to reconstruct the YOLOv10s backbone, thereby substantially reducing the memory usage and computational cost while simultaneously enhancing the feature extraction. Second, to mitigate the impact of occlusion factors in the background and strengthen multi-scale feature fusion, the C2f_LEMA module is introduced into the neck network, combining partial convolution with an efficient multi-scale attention mechanism. This enhancement improves the model’s focus on the target regions, increases detection accuracy and localisation precision, and further bolsters the model’s robustness to some extent. Finally, to further reduce the model’s parameter count and size, the GroupNorm and Shared Head (GNSH) detection head is designed, incorporating shared convolutional layers and a fusion group normalisation strategy, thus effectively achieving architectural overhead. The experiment results demonstrate that the improved model achieves a mean average precision of 92.6% on the Pomegranate Images dataset, while the parameter count and computational complexity are reduced to 4.7M and 13.8G, respectively, resulting in a model size of 9.9 MB. The generalisation capability was simultaneously validated on the Apple Object Detection and PASCAL VOC 2007 datasets. Compared with other mainstream detection algorithms, it achieves a superior balance between detection accuracy, localisation precision, and model complexity, providing a robust and lightweight reference for pomegranate fruit.
Introduction
The pomegranate belongs to the Punicaceae family and is native to Western Asia. Its flowers are typically red or orange-yellow, while the fruit is generally spherical or pear-shaped, varying in colour from yellow to deep red when ripe (Ain et al., 2023). Pomegranate fruits are rich in vitamin C, folic acid, and other nutrients, and can be processed into juices, jams, and other products with significant commercial and economic value (Saparbekova et al., 2023). Pomegranates are widely cultivated in China; nevertheless, most orchards rely on manual assessment of fruit maturity and harvesting, resulting in low efficiency, high labour intensity, and a high rate of misjudgment, ultimately impacting fruit quality (Miranda et al., 2023). The development of intelligent picking robots facilitates the liberation of agricultural labour and the digital-intelligent transformation of industry, wherein advances in computer vision technology provide powerful support for the localisation and recognition of these robots (Shi et al., 2023), optimise harvesting timing, and hold significant research value for enhancing the accuracy and efficiency of picking operations.
In a natural orchard environment, the vision system of a fruit-picking robot achieves fruit recognition through image-processing technology, with detection accuracy and localisation precision serving as the primary metrics for assessing system performance (He, Qian & Niu, 2024). Owing to the batch-ripening characteristic of pomegranate fruits, detection algorithms must be capable of assessing ripeness to ensure harvesting accuracy. However, the marked variations in colour and size of pomegranates across different growth stages, combined with interfering factors such as mutual occlusion among fruits, branches, and leaves, complicate the identification process.
Traditional object detection methods predominantly rely on hand-crafted feature extractors to extract target characteristics such as colour, texture, and shape of the target, subsequently employing classifiers such as support vector machines (SVM), K-means clustering, and decision tree algorithms to categorise the target based on feature-matching outcomes. Abasi et al. (2020) employed a decision tree method to create an apple ripeness classifier by training a model using reflected light signals and ripeness measures obtained via visible/near-infrared spectroscopy. Fan et al. (2021) proposed an enhanced multi-feature block segmentation technique using the K-means clustering algorithm to efficiently segment apple images for robotic picking. Bhargava & Bansal (2021) proposed a model for apple quality classification utilising the GrabCut-FCM segmentation framework, wherein image segmentation is performed via GrabCut segmentation and the fuzzy C-means algorithm. Following multi-feature fusion and principal component analysis (PCA) dimensionality reduction, apple quality classification is executed using k-nearest neighbour (k-NN), logistic regression, SRC, and SVM. However, pomegranates grow in complex environments, and traditional machine-learning methods are cumbersome and susceptible to interference from variables such as lighting variations and background noise, thereby complicating their application in real-world scenarios.
Compared with traditional object detection algorithms, deep learning-based methods employ convolutional neural networks to autonomously extract multi-level image features, offering advantages such as high speed and accuracy and leading to their increasing adoption by researchers in the domain of fruit detection. The methods are primarily categorised into two types: two-stage and one-stage. Two-stage detection algorithms, including region-based convolutional neural network (R-CNN) (Girshick et al., 2014), fast region-based convolutional neural network (Fast R-CNN) (Girshick, 2015), and faster region-based convolutional neural network (Faster R-CNN) (Ren et al., 2016), initially employ a region proposal network (RPN) to generate candidate target regions and then complete the classification and precise adjustment of bounding boxes after feature extraction. For example, Wang et al. (2023b) proposed a Transformer-based convolutional neural network model for masked regions, attaining tomato detection and segmentation accuracies of 89.4% and 89.2%, respectively. Feng et al. (2023) embedded the CBAM module between successive bottleneck layers of Residual Network-50 (ResNet-50) to enhance the detection of mature daylily buds. Liu et al. (2023b) introduced a weighted ECA channel-attention mechanism into the DetNet backbone, combining max-pooling to fuse low-level features and optimising the Faster R-CNN model for green persimmon detection. Shiu, Lee & Chang (2023) employed the Faster R-CNN model to locate and count hooded fruits, using mask region-based convolutional neural network (Mask R-CNN) to segment the reticule-covered area and achieving a mean average precision (mAP) of 73.9% for counting. Two-stage detection methods exhibit high accuracy in fruit localisation; nevertheless, their complex algorithms result in slow detection speeds.
Consequently, researchers have employed single-stage detection methods for fruit localisation and recognition. One-stage object detection algorithms, such as Single Shot MultiBox Detector (SSD) (Liu et al., 2016) and the You Only Look Once (YOLO) series (Redmon et al., 2016; Redmon & Farhadi, 2017; Redmon, 2018; Bochkovskiy, Wang & Liao, 2020; Ultralytics, 2020; Wang, Bochkovskiy & Liao, 2023; Ultralytics, 2023; Wang et al., 2024a; Khanam & Hussain, 2024; Tian, Ye & Doermann, 2025), convert the object-detection problem into a regression task by predicting categories and bounding boxes on the feature map, without requiring separate region proposals. Agarwal & Bhargava (2024) used the Darknet-19 network as a feature extractor in combination with the SSD network to detect and localise mango fruits. Lin et al. (2024) enhanced the YOLO backbone using Next Generation Vision Transformer (Next-ViT) by integrating the Global Context Fusion Module (GCFM) to amalgamate local and global information, achieving a detection accuracy of 90.6% on the citrus-occlusion dataset and a detection speed of 34.22 frames per second. Nan et al. (2023) designed the WFE-C4 module to replace the YOLOv3 backbone and optimised multi-scale feature fusion through the GF-SPP module, which combines average pooling with global average pooling to achieve efficient detection of multi-class dragon fruit.
Despite improvements in detection accuracy and speed, the considerable parameter counts and computational complexity of these models continue to limit their deployment on resource-constrained edge devices. Consequently, researchers have been redirecting their study emphasis towards model lightweighting. For example, Zeng et al. (2023) substituted the original Focus layer with a downsampled convolutional layer and optimised the YOLOv5 backbone using the MobileNetV3 backbone module, resulting in a 78% reduction in model parameters and an 84.15% reduction in gigafloating-point operations per second (GFLOPs). Sun et al. (2023) presented the lightweight C3-light module alongside the SimAM attention mechanism to improve the apple detection algorithm, achieving a 45% reduction in model size, a 1.2-fold increase in inference speed, and a 15.56% decrease in floating-point operations. Zhao et al. (2023b) optimised YOLOv7 by employing GhostNet as the backbone, yielding a 20.58% reduction in model parameters; however, the mAP declined by 1.6% relative to the baseline. Liu et al. (2023a) introduced C3Ghost and GhostConv modules into the YOLOv5 backbone and employed the Depthwise Convolution (DWConv) module in the neck, achieving a 54% reduction in computational load and a 52.53% reduction in parameter count, albeit with a 0.2% decline in mAP. Wang et al. (2024b) proposed a lightweight detection model for unripe pomegranates based on YOLOv8. The model utilises ShuffleNetV2 to reconstruct the backbone and incorporates DWConv into the neck in place of standard convolution layers. This approach achieved an 89.9% reduction in model size and a 74.1% increase in detection speed, with a marginal 1.2% decrease in the mean average precision (mAP). While these models attain a measure of lightweight efficiency, they inadequately balance detection accuracy with model complexity, remain susceptible to background interference in natural environments, exhibit limited robustness, and require improvements in false and missed detection rates. Therefore, it is essential to design a lightweight algorithm that satisfies the deployment requirements of edge devices while achieving high-precision pomegranate detection in natural settings.
To reduce model complexity while maintaining detection accuracy and localisation precision in natural environments, this study proposes PGLD-YOLO, a lightweight pomegranate fruit localisation and recognition algorithm based on the YOLOv10s architecture. PGLD-YOLO balances detection accuracy, localisation precision, and model complexity to satisfy the deployment requirements on edge devices, such as picking robots, thereby enabling precise localisation and recognition of pomegranate fruits.
The main contributions of this study are as follows:
-
(1)
The lightweight ShuffleNetV2 network is employed to reconstruct the YOLOv10s backbone, yielding a model that significantly diminishes size, parameter count, and computational complexity while enhancing detection accuracy. The reconstructed model achieves a 22.2% decline in trainable parameters, a 37.9% decrease in FLOPs, and a 19.9% reduction in model size.
-
(2)
The Light_Block is constructed by integrating partial convolution with an efficient multi-scale attention mechanism to replace the Bottleneck structure within the C2f module, thereby forming the C2f_LEMA module. This newly formed module is subsequently employed to replace the original C2f module in the neck network. The C2f_LEMA module captures information from both channel and spatial dimensions simultaneously, enabling a more comprehensive feature representation. While maintaining the model’s lightweight characteristics, C2f_LEMA bolsters its ability to focus more precisely on target regions by effectively suppressing redundant information. This, in turn, mitigates the influence of noise and other environmental interferences prevalent in orchard settings, consequently enhancing the model’s robustness and detection accuracy.
-
(3)
To further curtail the number of parameters and the model size whilst safeguarding effective feature fusion, a lightweight detection head, termed GroupNorm and Shared Head (GNSH), is designed by incorporating shared convolutions and replacing the conventional Batch Normalisation with Group Normalisation. This design enhances detection efficiency while maintaining overall performance. The optimise model comprises only 4.7 million parameters, resulting in a compact model size of 9.9 MB.
The subsequent sections of this study are organised as follows: ‘Related Works’ reviews previous work relevant to this research. ‘Proposed Methods’ presents a comprehensive description of the proposed PGLD-YOLO model. ‘Experiments and Results’ outlines the experimental setup and analyses the experimental results. ‘Discussion’ provides heatmap visualisation, module comparisons, and robustness assessments of the enhanced model. ‘Conclusions’ concludes the article.
Related works
Algorithms for fruit recognition based on deep learning
In recent years, deep learning-based detection approaches have made significant advances in agricultural fruit recognition. These methods derive robust feature representations for complex scenarios and effectively enhance the accuracy of fruit recognition in natural environments. Jia et al. (2020) proposed an improved Mask R-CNN framework that integrates Residual Network (ResNet) and DenseNet, generating regions of interest through a region proposal network and employing a fully convolutional network to produce masks for apple localisation and segmentation. Parvathi & Selvi (2021) modified the Faster R-CNN architecture to detect coconut fruits in complex backgrounds, employing the ResNet-50 network for characteristic extraction to facilitate the assessment of coconut fruit ripeness under natural conditions. Chu et al. (2021) devised a novel suppression Mask R-CNN framework for apple identification, which mitigated the influence of non-apple features by incorporating suppression branches into a standard Mask R-CNN, achieving an F1-score detection score of 90.5%. These approaches achieved notable results in terms of fruit recognition performance; however, the parameter count and computational complexity remained high due to the adoption of two-stage detection architectures.
The YOLO series of algorithms has emerged as a leading approach among the object detection methods due to its combined advantages of high accuracy and low computational complexity. The architecture has undergone substantial evolution. In 2016, Redmon et al. (2016) introduced the YOLOv1 algorithm, which uniquely framed object detection as a regression problem. This enabled end-to-end detection by simultaneously predicting bounding boxes and class confidence scores, significantly accelerating detection speed. However, it exhibited limitations in multi-scale detection. Subsequent versions of YOLOv2 (Redmon & Farhadi, 2017) and YOLOv3 (Redmon, 2018) markedly refined detection accuracy and multi-scale capability by incorporating batch normalisation (BN), anchor box mechanisms, deeper feature extraction networks, and feature pyramid architectures. Later iterations further refined network structures and training strategies. For instance, YOLOv4 (Bochkovskiy, Wang & Liao, 2020) incorporated Cross Stage Partial Network (CSPNet) and spatial pyramid pooling (SPP) modules to optimise feature integration, while YOLOv5 (Ultralytics, 2020) refined the loss function and adopted adaptive anchor box calculation. YOLOv6 (Li et al., 2022) and YOLOv7 (Wang, Bochkovskiy & Liao, 2023) extended the backbone using EfficientRep and extended ELAN, respectively, to increase learning efficiency. YOLOv8 (Ultralytics, 2023) introduced the lightweight C2f module, derived from C3, and employed a decoupled head design to independently train category and bounding box regression branches, thus enhancing real-time detection performance. Most recently, YOLOv9 (Wang, Yeh & Mark Liao, 2024) proposed a programmable gradient information mechanism, which ensures the complete transmission of gradient signals through auxiliary reversible branches, augments learning efficiency, and detection accuracy.
YOLOv10 (Wang et al., 2024a) incorporated partial self-attention (PSA) modules and enhanced efficient inference efficiency by removing non-maximum suppression (NMS) and downsampling. By eliminating redundant computations, it enhances both system efficiency and precision. Compared with other versions of the YOLO series, it is more lightweight and particularly well-suited for real-time and edge deployment scenarios. Recent versions such as YOLOv11 (Khanam & Hussain, 2024), YOLOv12 (Tian, Ye & Doermann, 2025), and YOLOv13 (Lei et al., 2025) have achieved continuous improvements in detection performance. YOLOv11 integrated components such as C3K2 and C2PSA into YOLOv10 to enhance gradient flow. YOLOv12 and YOLOv13 incorporated regional attention mechanisms and hypergraph computation to strengthen attribute extraction and to improve identification performance. However, compared with YOLOv10, these newer versions introduced more complex network architectures, leading to increased framework complexity and higher inference latency on resource-constrained devices. Therefore, this study ultimately opts to build upon YOLOv10.
Based on the advantages of the YOLO series of models in terms of detection efficiency, researchers have applied them to fruit detection tasks. For example, Tang et al. (2023b) improved YOLOv4-tiny to develop a real-time oil tea fruit detection algorithm, refining the bounding box priors using the k-means++ clustering algorithm and enhancing the feature learning capacity of convolutional kernels to facilitate oil tea fruit detection and localisation in complex orchard environments. Jia et al. (2023) presented a green fruit detection method based on an optimised YOLOX-m network, incorporating a null-space pyramid pooling module to expand the receptive field. They achieved average accuracies of 64.3% and 74.7% on the apple and persimmon datasets, respectively, with detection speeds of 25.6 and 26.7 ms. Liu et al. (2025) enhanced the neck network of the YOLOv8n model by incorporating a P2 detection layer and integrating a bi-directional feature pyramid network (BiFPN) structure, while also introducing the WIoU loss function, thus developing the PerD-YOLOv8 model for detecting persimmon fruits in complex scenarios. Wang et al. (2025) introduced an improved lightweight detection architecture, named ELD-YOLO, based on YOLOv11, designed to detect citrus fruits in complex orchard environments. The architecture achieved an accuracy of 89.7% and a recall rate of 83.7% in citrus fruit detection by employing edge-aware processing and adaptive upsampling strategies to enhance feature representation capabilities.
Although the YOLO model series demonstrates commendable accuracy and speed in fruit detection, many approaches overlook deployment considerations for edge devices and involve considerable model complexity. As a result, researchers are increasingly exploring more lightweight modelling strategies. For example, Li et al. (2024) developed the PeachYOLO model for peach detection, which replaces conventional convolutions in the head and neck of the YOLO architecture with Partial Convolution (PConv) and deformable convolutions, thereby reducing computational and memory requirements. This model achieves 5.1 GFLOPs and contains 2.6M parameters. Shi et al. (2024) integrated YOLOv9s with the C2f, the universal inverted bottleneck (UIB) structure, and the RepNCSPELAN4 module to enhance the extraction of small-target features, and replaced AConv with the lightweight spatial-channel decoupled downsampling (SCDown) layer to maintain accuracy while reducing model complexity. Yu et al. (2024) introduced the MLG-YOLO model for jujube picking, adopting the MobileViT lightweight network in place of the YOLOv8 backbone, which effectively reduced both parameter count and computational burden. Yuan et al. (2025) integrated gate-controlled convolution into the C2f module of YOLOv10, creating a new C2f-gConv structure that significantly diminished model parameters and computational complexity.
Considering the necessity of model lightweighting for edge devices, such as agricultural picking robots in the pomegranate fruit detection task, alongside the dual requirements of detection accuracy and localisation capability in natural environments, this study adopted the YOLOv10s model as the baseline for lightweight improvement to meet the deployment needs of edge devices.
YOLOv10s model
YOLOv10 (Wang et al., 2024a), a member of the YOLO series, is optimised for detection efficiency and aims to accurately predict both the category and location of targets in an image with low latency, as illustrated in Fig. 1. It comprises three primary components: the backbone, neck, and head. The backbone centres on the C2f residual block, which is derived from YOLOv8. It replaces the conventional deep convolutional layer with a spatial-channel-separated SCDown structure and integrates cost-effective depthwise and pointwise convolutions to construct the C2fCIB hybrid residual block. A PSA is embedded at the end of the backbone, significantly enhancing model efficiency and feature representation through spatial-channel co-optimization and global feature enhancement. The neck adopts a path aggregation network (PAN) to fuse multi-scale features, producing feature maps of 80 × 80, 40 × 40, and 20 × 20, which correspond to the detection of small, medium, and large objects in the image, respectively. This enables multi-scale object detection by combining spatial detail with high-level semantic information. The head conducts feature regression to predict object categories and locations. In contrast to conventional heads, the YOLOv10 head employs a dual-assignment strategy without NMS, incorporating a one-to-one detection head. During training, both one-to-many and one-to-one assignment strategies are used concurrently to optimise supervisory signals and improve prediction robustness. At inference time, only the one-to-one branch is retained, eliminating the latency introduced by NMS post-processing and ensuring optimal detection results.
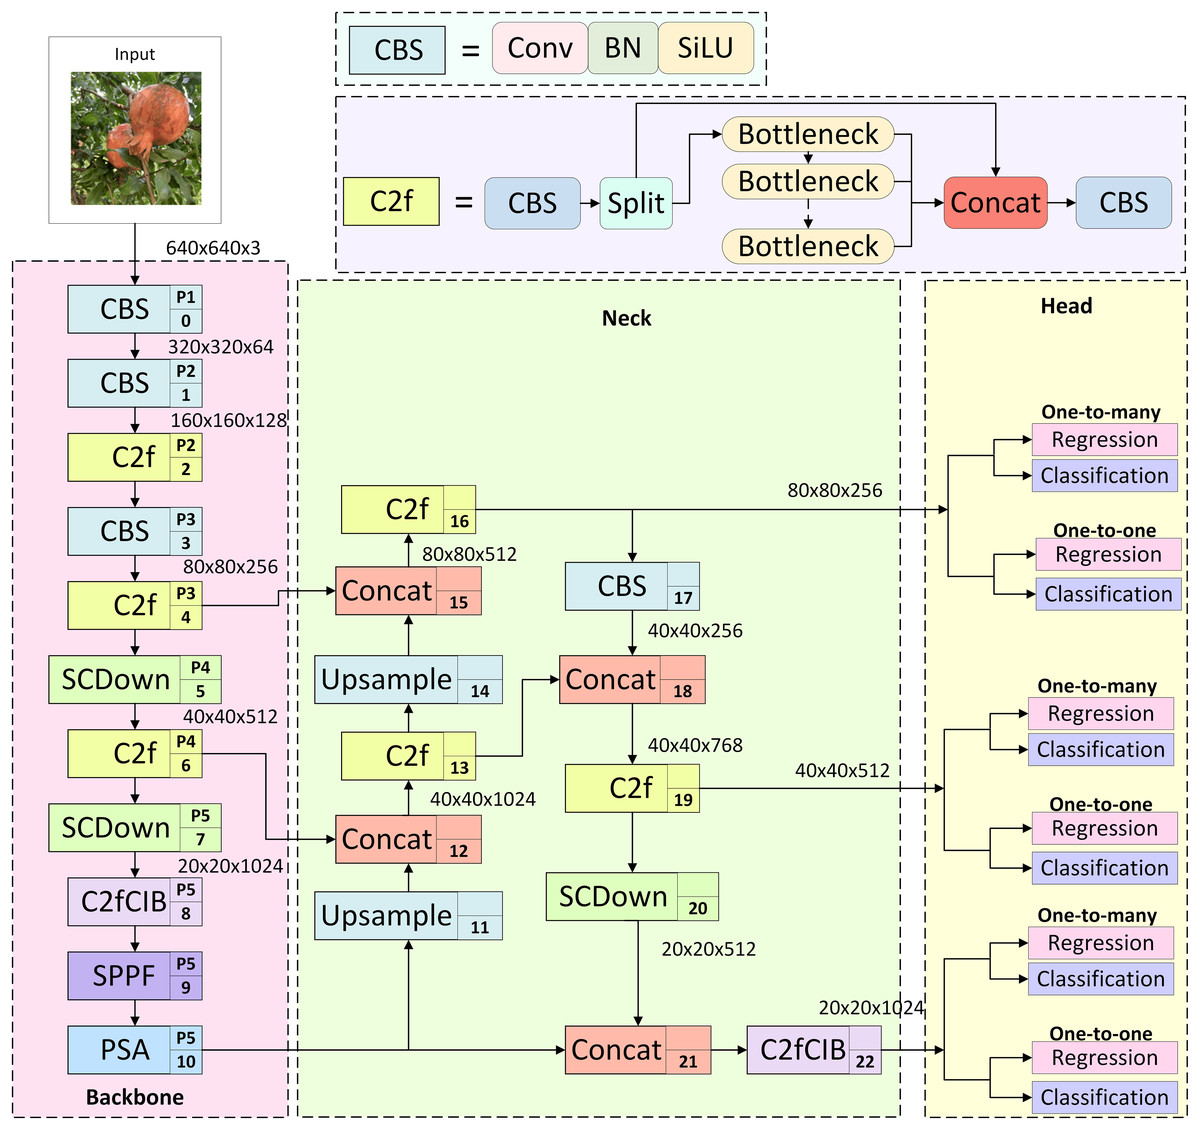
Figure 1: Structure of YOLOv10s.
The researchers designed models with different sizes—n, s, m, b, l, and x—according to network depth and width, enabling flexible selection based on specific requirements. Given the constraints on computational power, memory, and storage capacity of edge devices, YOLOv10s, which struck an effective balance between detection accuracy and model complexity, was adopted as the baseline model in this study.
Proposed methods
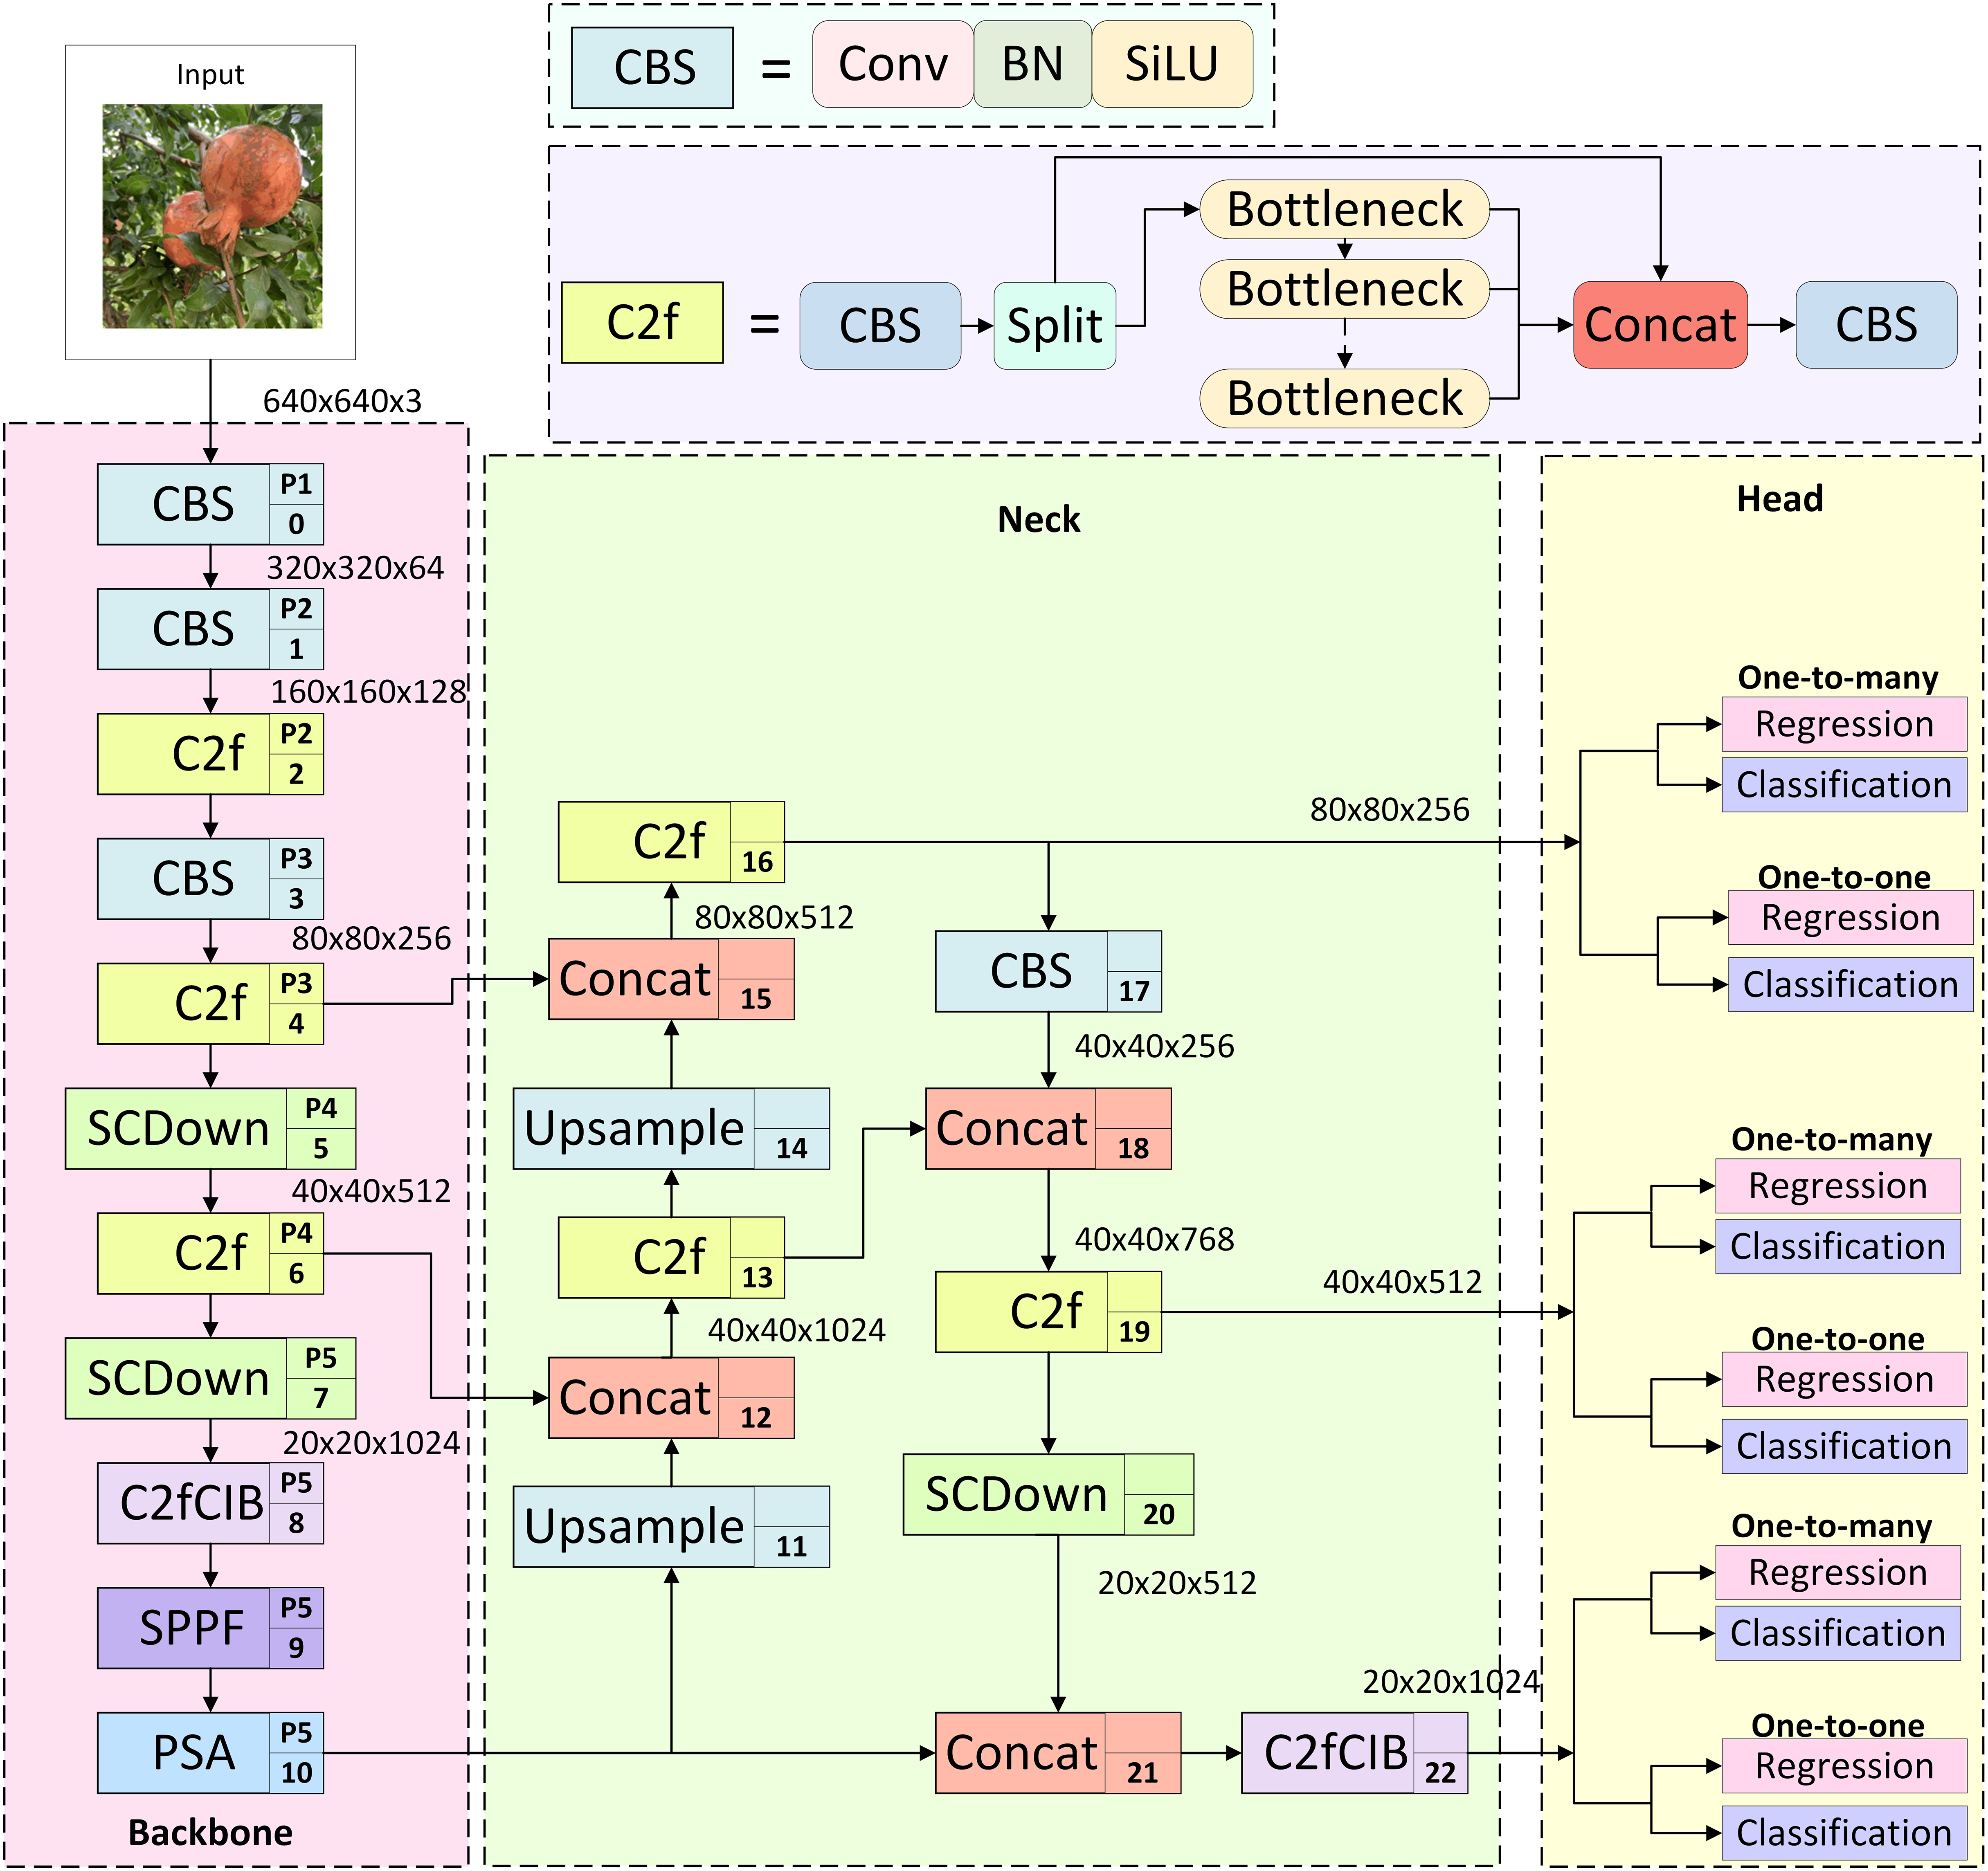
Although the YOLOv10s model achieves promising results in general object detection tasks, its performance in fruit identification within natural picking environments is adversely affected by various interference factors. These include fluctuations in light intensity, occlusion caused by branches, leaves, or overlapping fruits, and the challenges of long-distance localisation, all of which lead to reduced accuracy in fruit recognition and classification. Furthermore, the model’s relatively high complexity constrains its deployment on edge devices, hence limiting its practicality for real-world applications. To address these challenges, this study proposes a lightweight pomegranate fruit detection model, PGLD-YOLO, based on an enhanced YOLOv10s architecture. The proposed design aims to achieve accurate localisation and recognition of pomegranate fruits in natural environments, while minimising model complexity, lowering false and missed detection rates, and enhancing robustness against background interference. The improved model architecture is illustrated in Fig. 2, with the enhanced components highlighted by red dashed boxes.
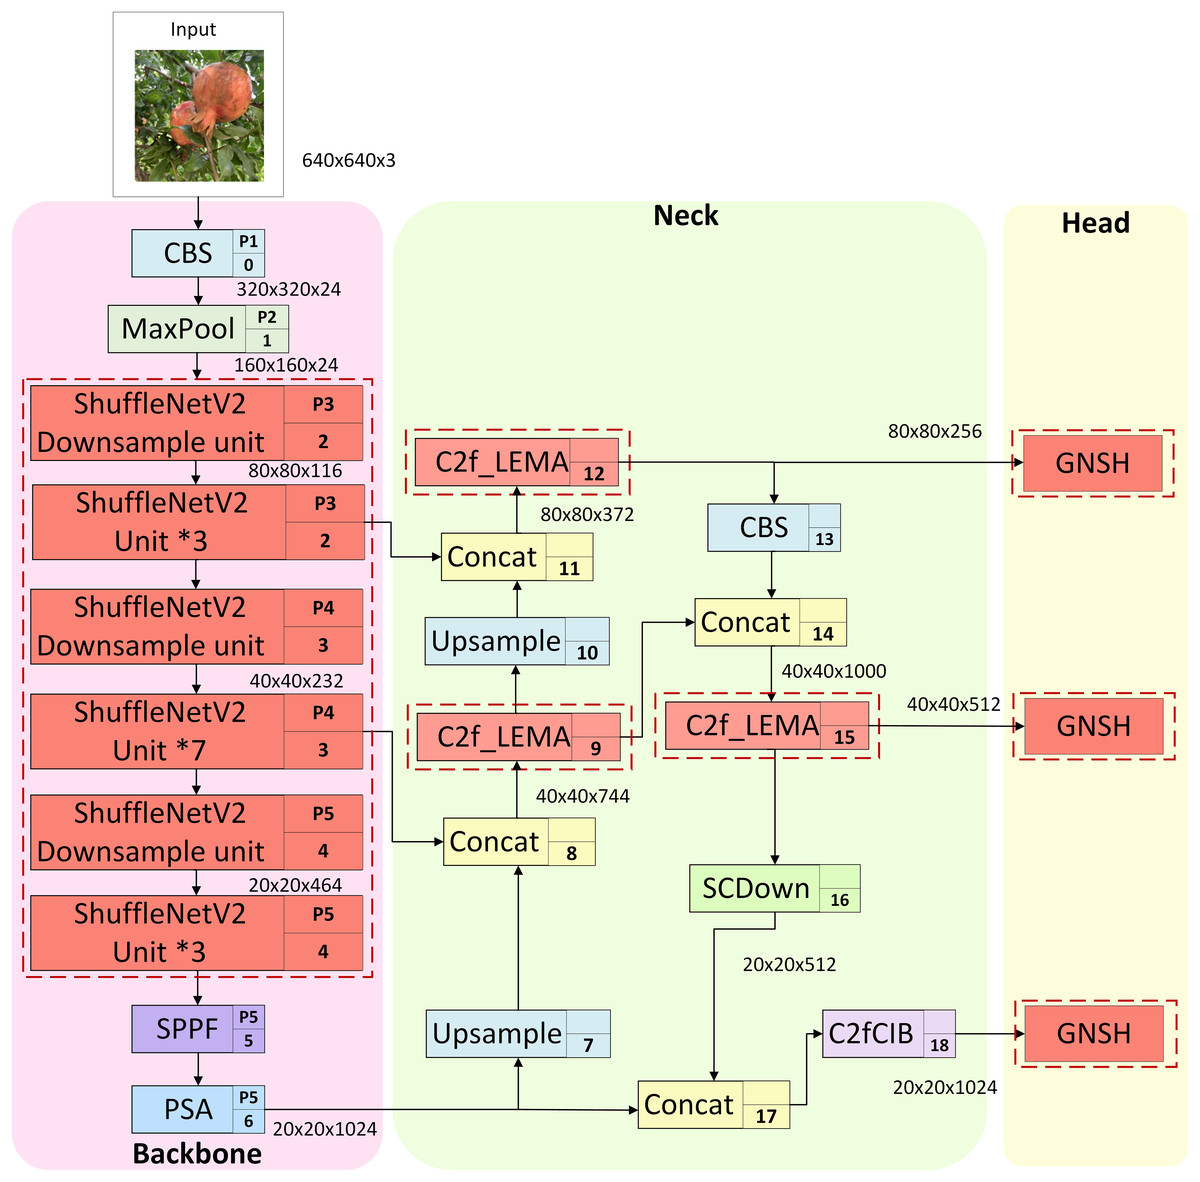
Figure 2: PGLD-YOLO network structure.
First, the backbone of YOLOv10s is restructured using the basic units of ShuffleNetV2 to decrease model size, parameter count, and computational complexity, enhancing the efficiency of feature extraction. Second, the PConv and efficient multi-scale attention mechanism (EMA) are integrated into the C2f_LEMA module, which replaces the original C2f module within the neck of YOLOv10s. The introduction of PConv effectively minimizes redundant computation and memory access costs. The efficient multi-scale attention mechanism incorporates contextual information across multiple spatial scales through cross-spatial learning, thus mitigating background interference and improving the architecture’s robustness. Finally, a lightweight detection head, named GNSH, is developed using group normalisation and shared convolution. This design significantly diminishes both parameter count and model size while enhancing localisation and classification performance. The overall enhancements within the model contribute to a marked reduction in size, parameter count, and computational complexity, while simultaneously improving detection accuracy and achieving a more favourable balance among detection accuracy, localisation precision, and model complexity.
Backbone network based on ShuffleNetV2
To satisfy the demands of edge devices for the localisation and recognition of pomegranate fruit, it is essential to develop a model that is both lightweight and capable of efficient feature extraction. Although the C2f architecture (Ultralytics, 2023) employed in the backbone of YOLOv10s demonstrates excellent recognition performance, its deep and complex network topology imposes substantial computational and memory burdens. To address this issue, the present study reconstructs the backbone using ShuffleNetV2 (Ma et al., 2018), a lightweight architecture specifically designed for mobile and embedded platforms, to ensure high efficiency and low computational overhead. ShuffleNetV2 is composed of a series of stacked basic units (ShuffleNet Unit), primarily comprising depthwise separable convolution (DSConv) (Chollet, 2017), 1 × 1 convolution, channel shuffle operation, and feature branches. In each unit, DSConv significantly decreases the parameter count, while 1 × 1 convolution adjusts channel dimensions to maintain computational efficiency.
The basic unit of ShuffleNetV2 consists of a standard basic unit and a specialised unit designed for spatial downsampling, with the network structure illustrated in Fig. 3. When the stride is set to 1, the basic unit shown in Fig. 3A is applied. The input feature map is first divided into two branches via a Channel Split operation: one branch remains unchanged through an identity connection, while the other sequentially passes through a 1 × 1 convolutional layer (including BN+ReLU), a depthwise convolutional layer (including BN only), and a further 1 × 1 convolutional layer (including BN+ReLU). The two branches are subsequently concatenated to restore the original number of channels. Finally, a Channel Shuffle operation is performed to enhance cross-channel feature interaction. When the stride is set to 2, the downsampling unit, illustrated in Fig. 3B, is utilised. While the right branch maintains a similar structure to the basic unit, the left branch incorporates an additional downsampling operation.
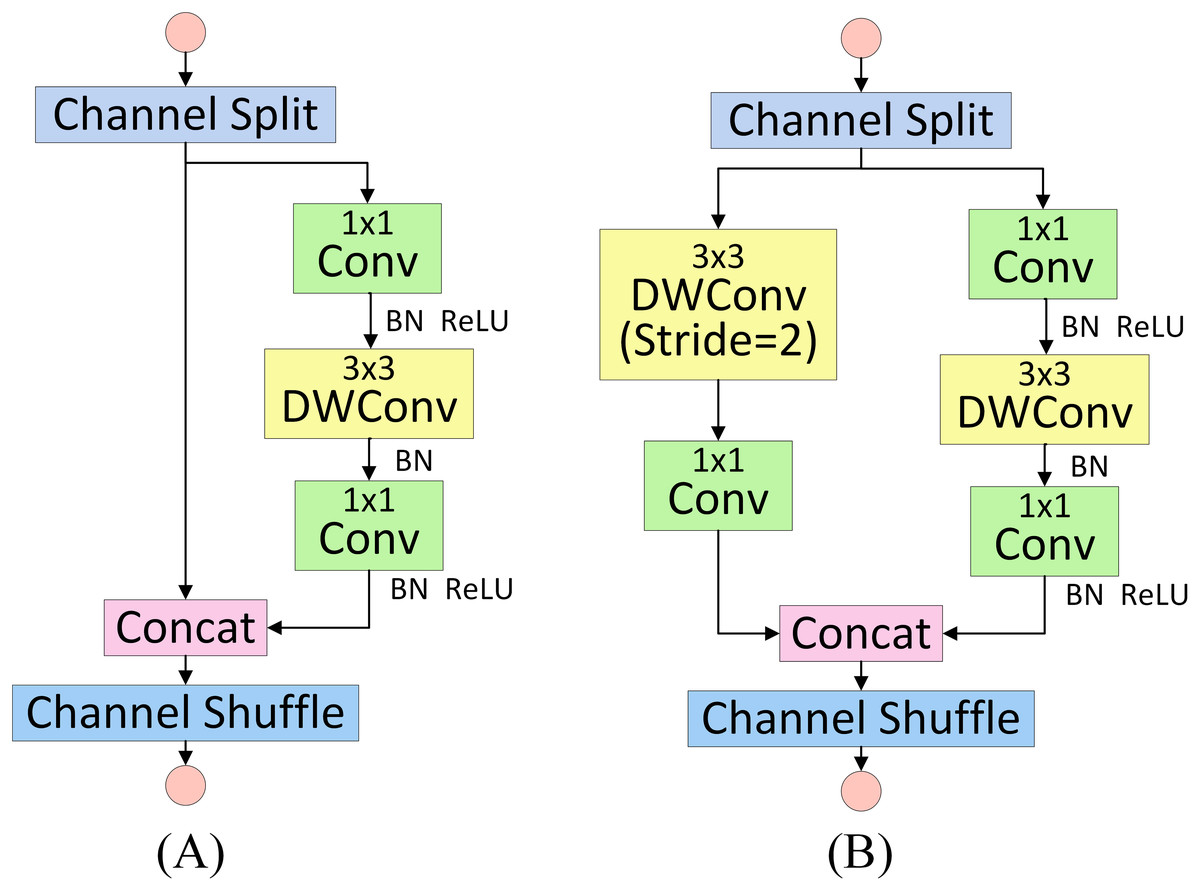
Figure 3: ShuffleNetV2 basic unit and ShuffleNetV2 downsampling unit.
(A) Basic Unit. (B) Downsampling unit.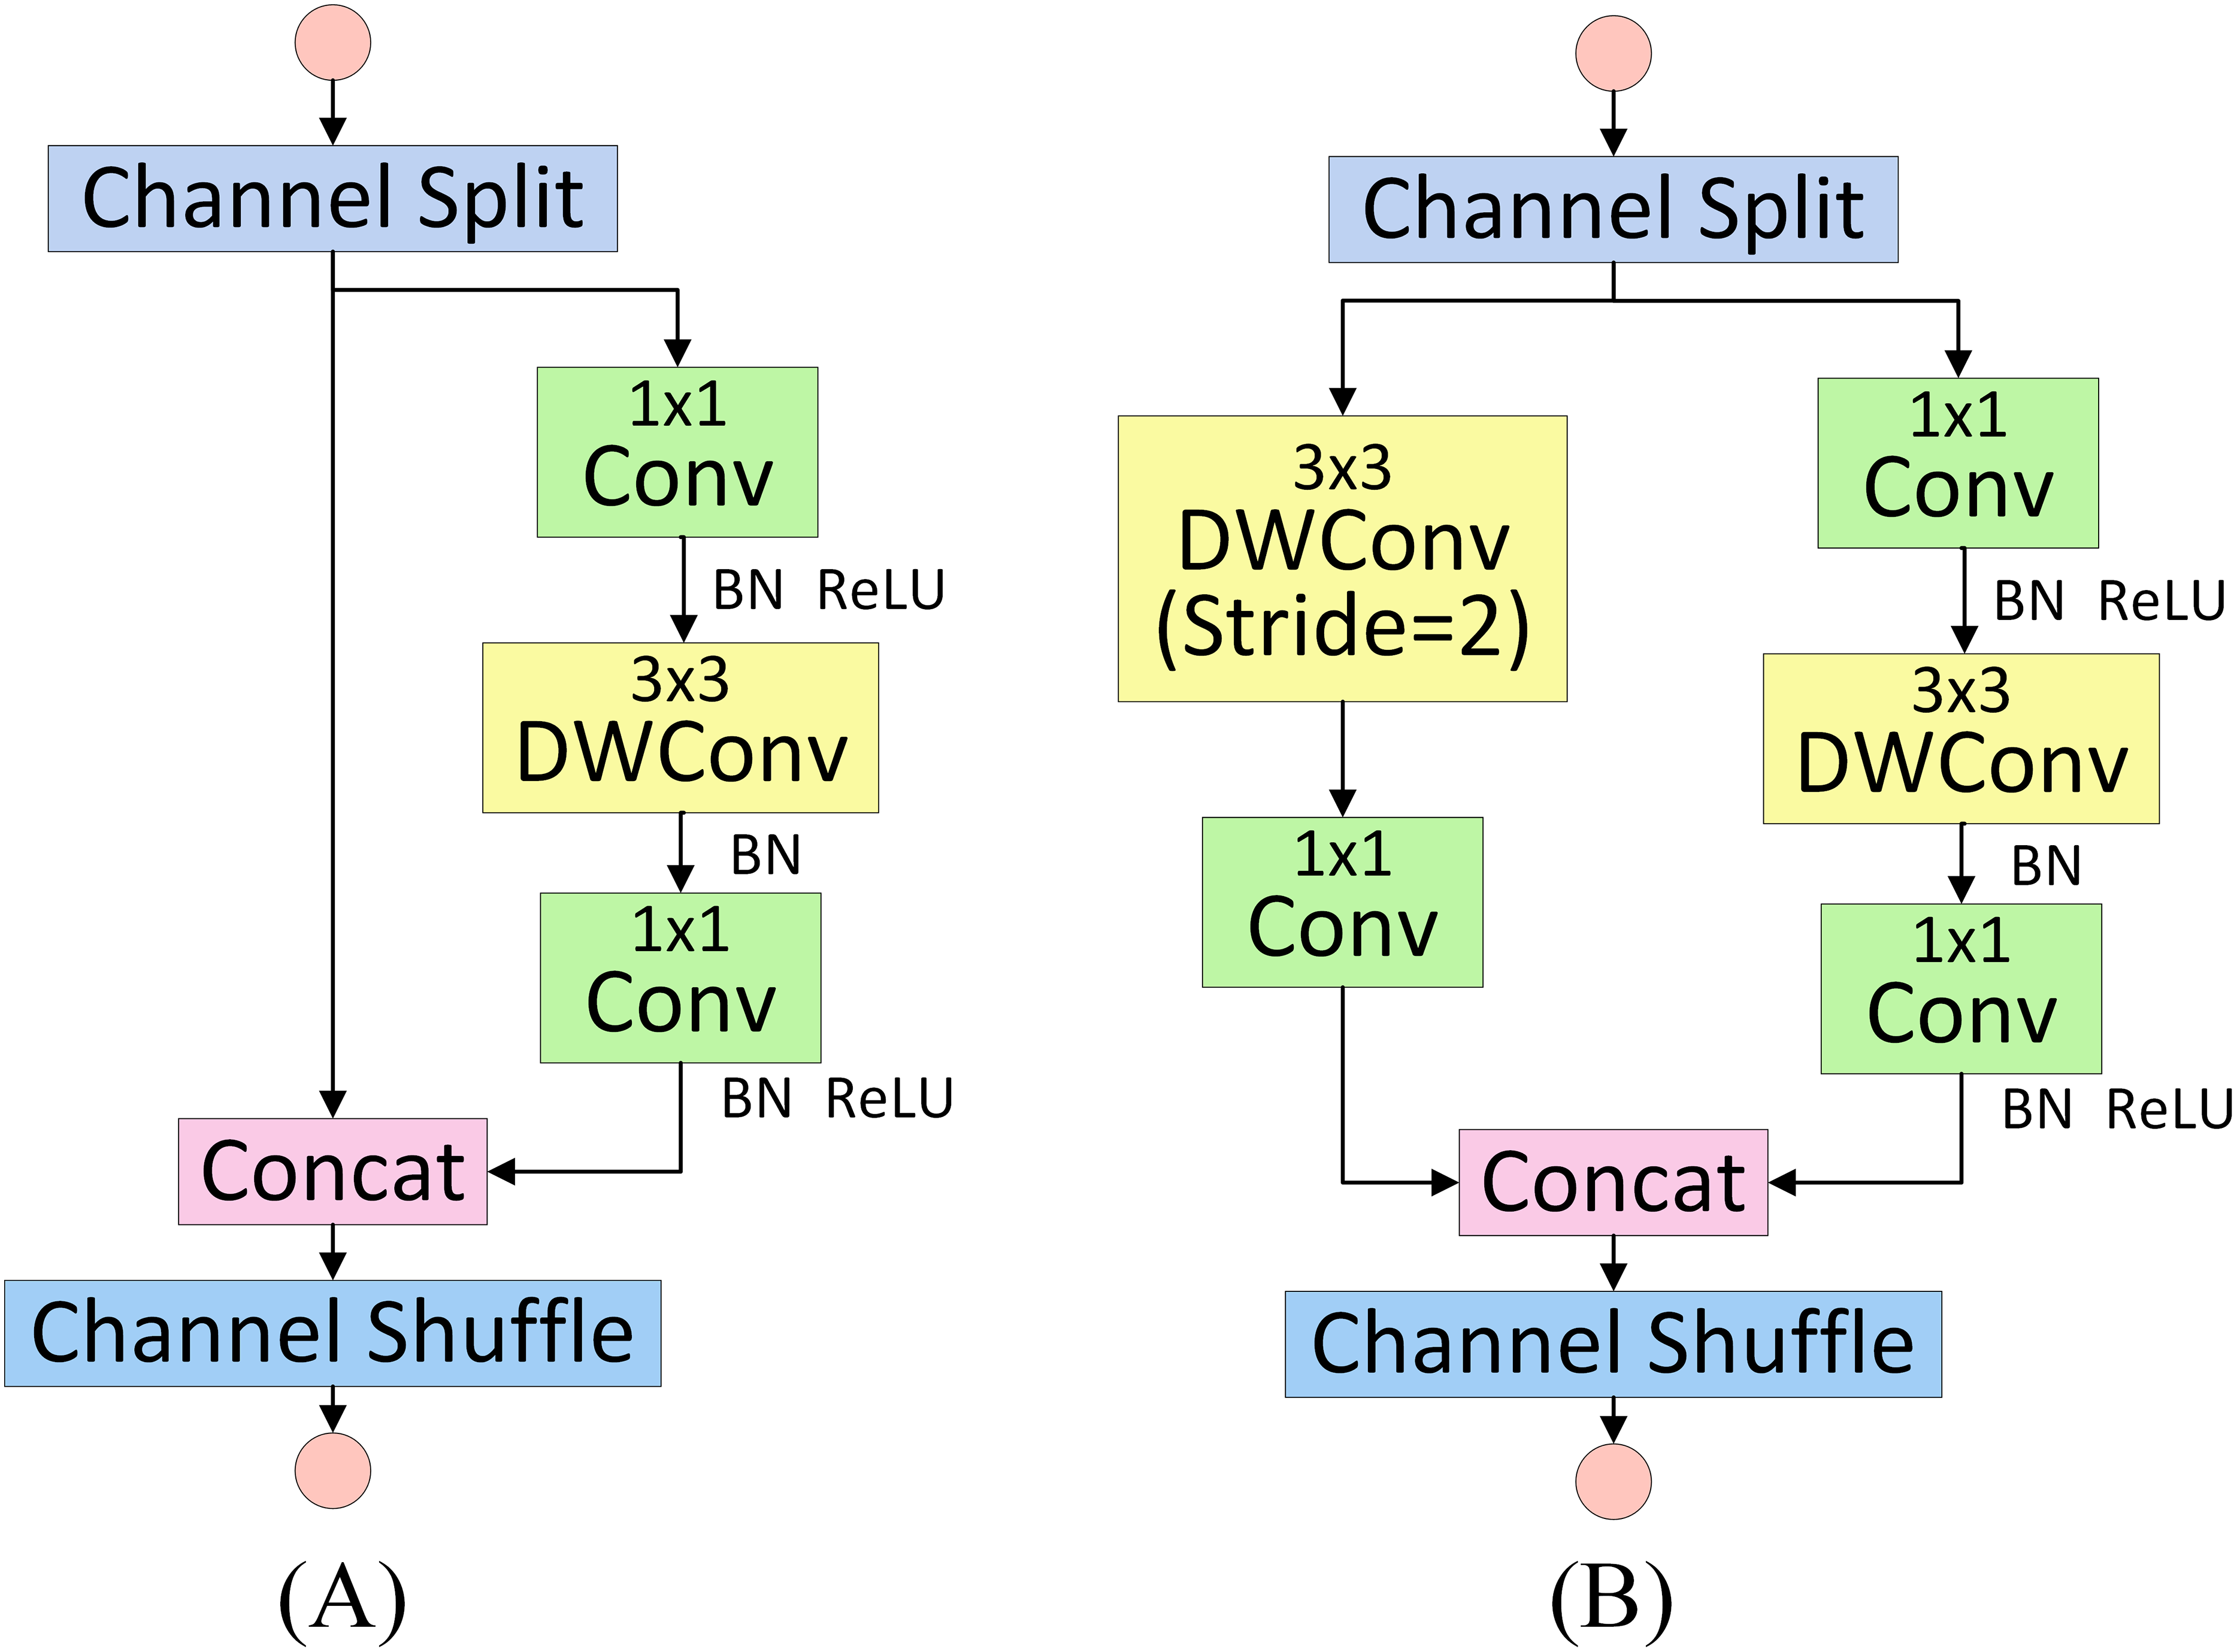
In contrast to the original backbone, ShuffleNetV2 introduces the Channel Shuffle operation to overcome channel isolation within groups, enhancing cross-group feature interaction and optimising information flow through a dual-branch structure. Moreover, its constrained design—based on group convolution and the elimination of redundant memory access—significantly improves computational efficiency on hardware. This architecture adheres to the principle of minimising redundant computations and enhancing channel representation, thus enabling efficient feature extraction under lightweight conditions.
C2f_LEMA module
The C2f module within the neck of YOLOv10s performs feature fusion through parallel branch processing and channel concatenation, thus generating more representative outputs (Wang et al., 2024a). However, the frequent use of the Bottleneck structure within this module considerably augments the parameter count and computational burden, which constrains its deployment and operational longevity on edge devices. To overcome this limitation, the present study introduces the C2f_LEMA module, derived from the original C2f structure, as illustrated in Fig. 4, with the enhancements highlighted in red dashed boxes. This module primarily adopts the custom-designed lightweight Light_Block in place of the conventional Bottleneck unit. The proposed C2f_LEMA module replaces the original C2f within the neck, effectively strengthening feature fusion capability while retaining the lightweight characteristics of the model.
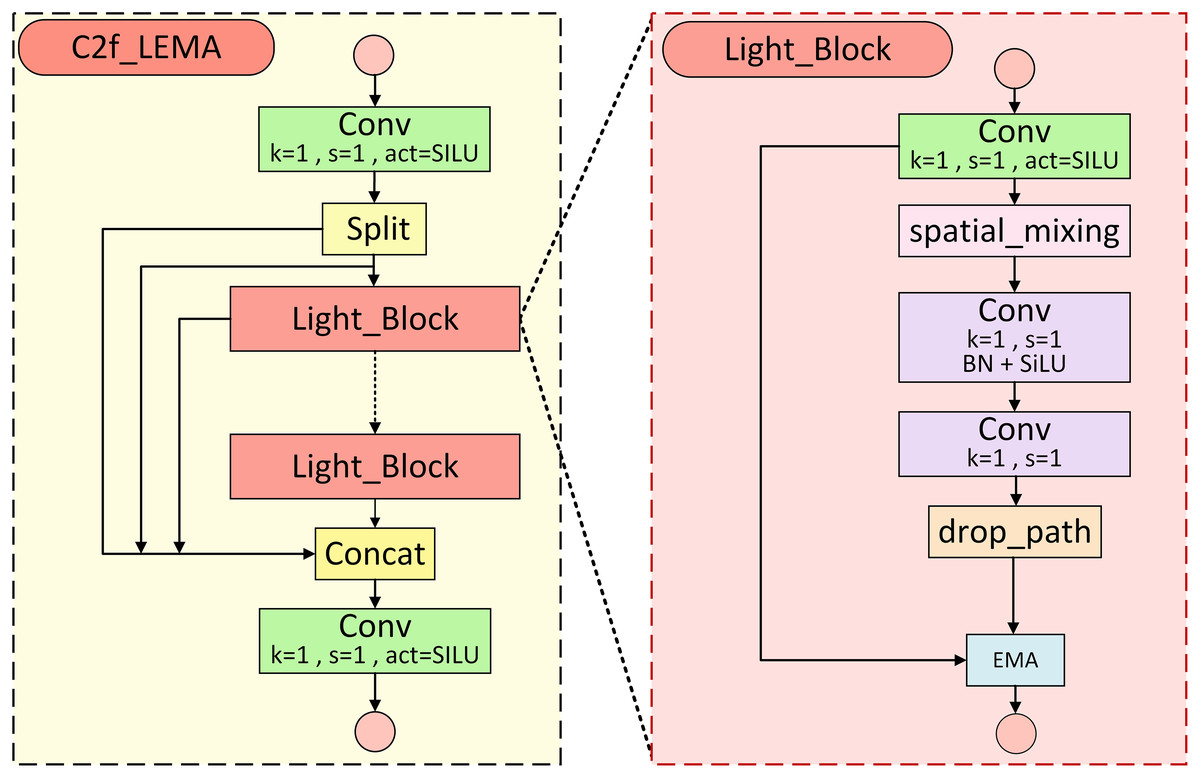
Figure 4: C2f_LEMA module structure.
(A) C2f_LEMA module structure. (B) Light_Block module structure.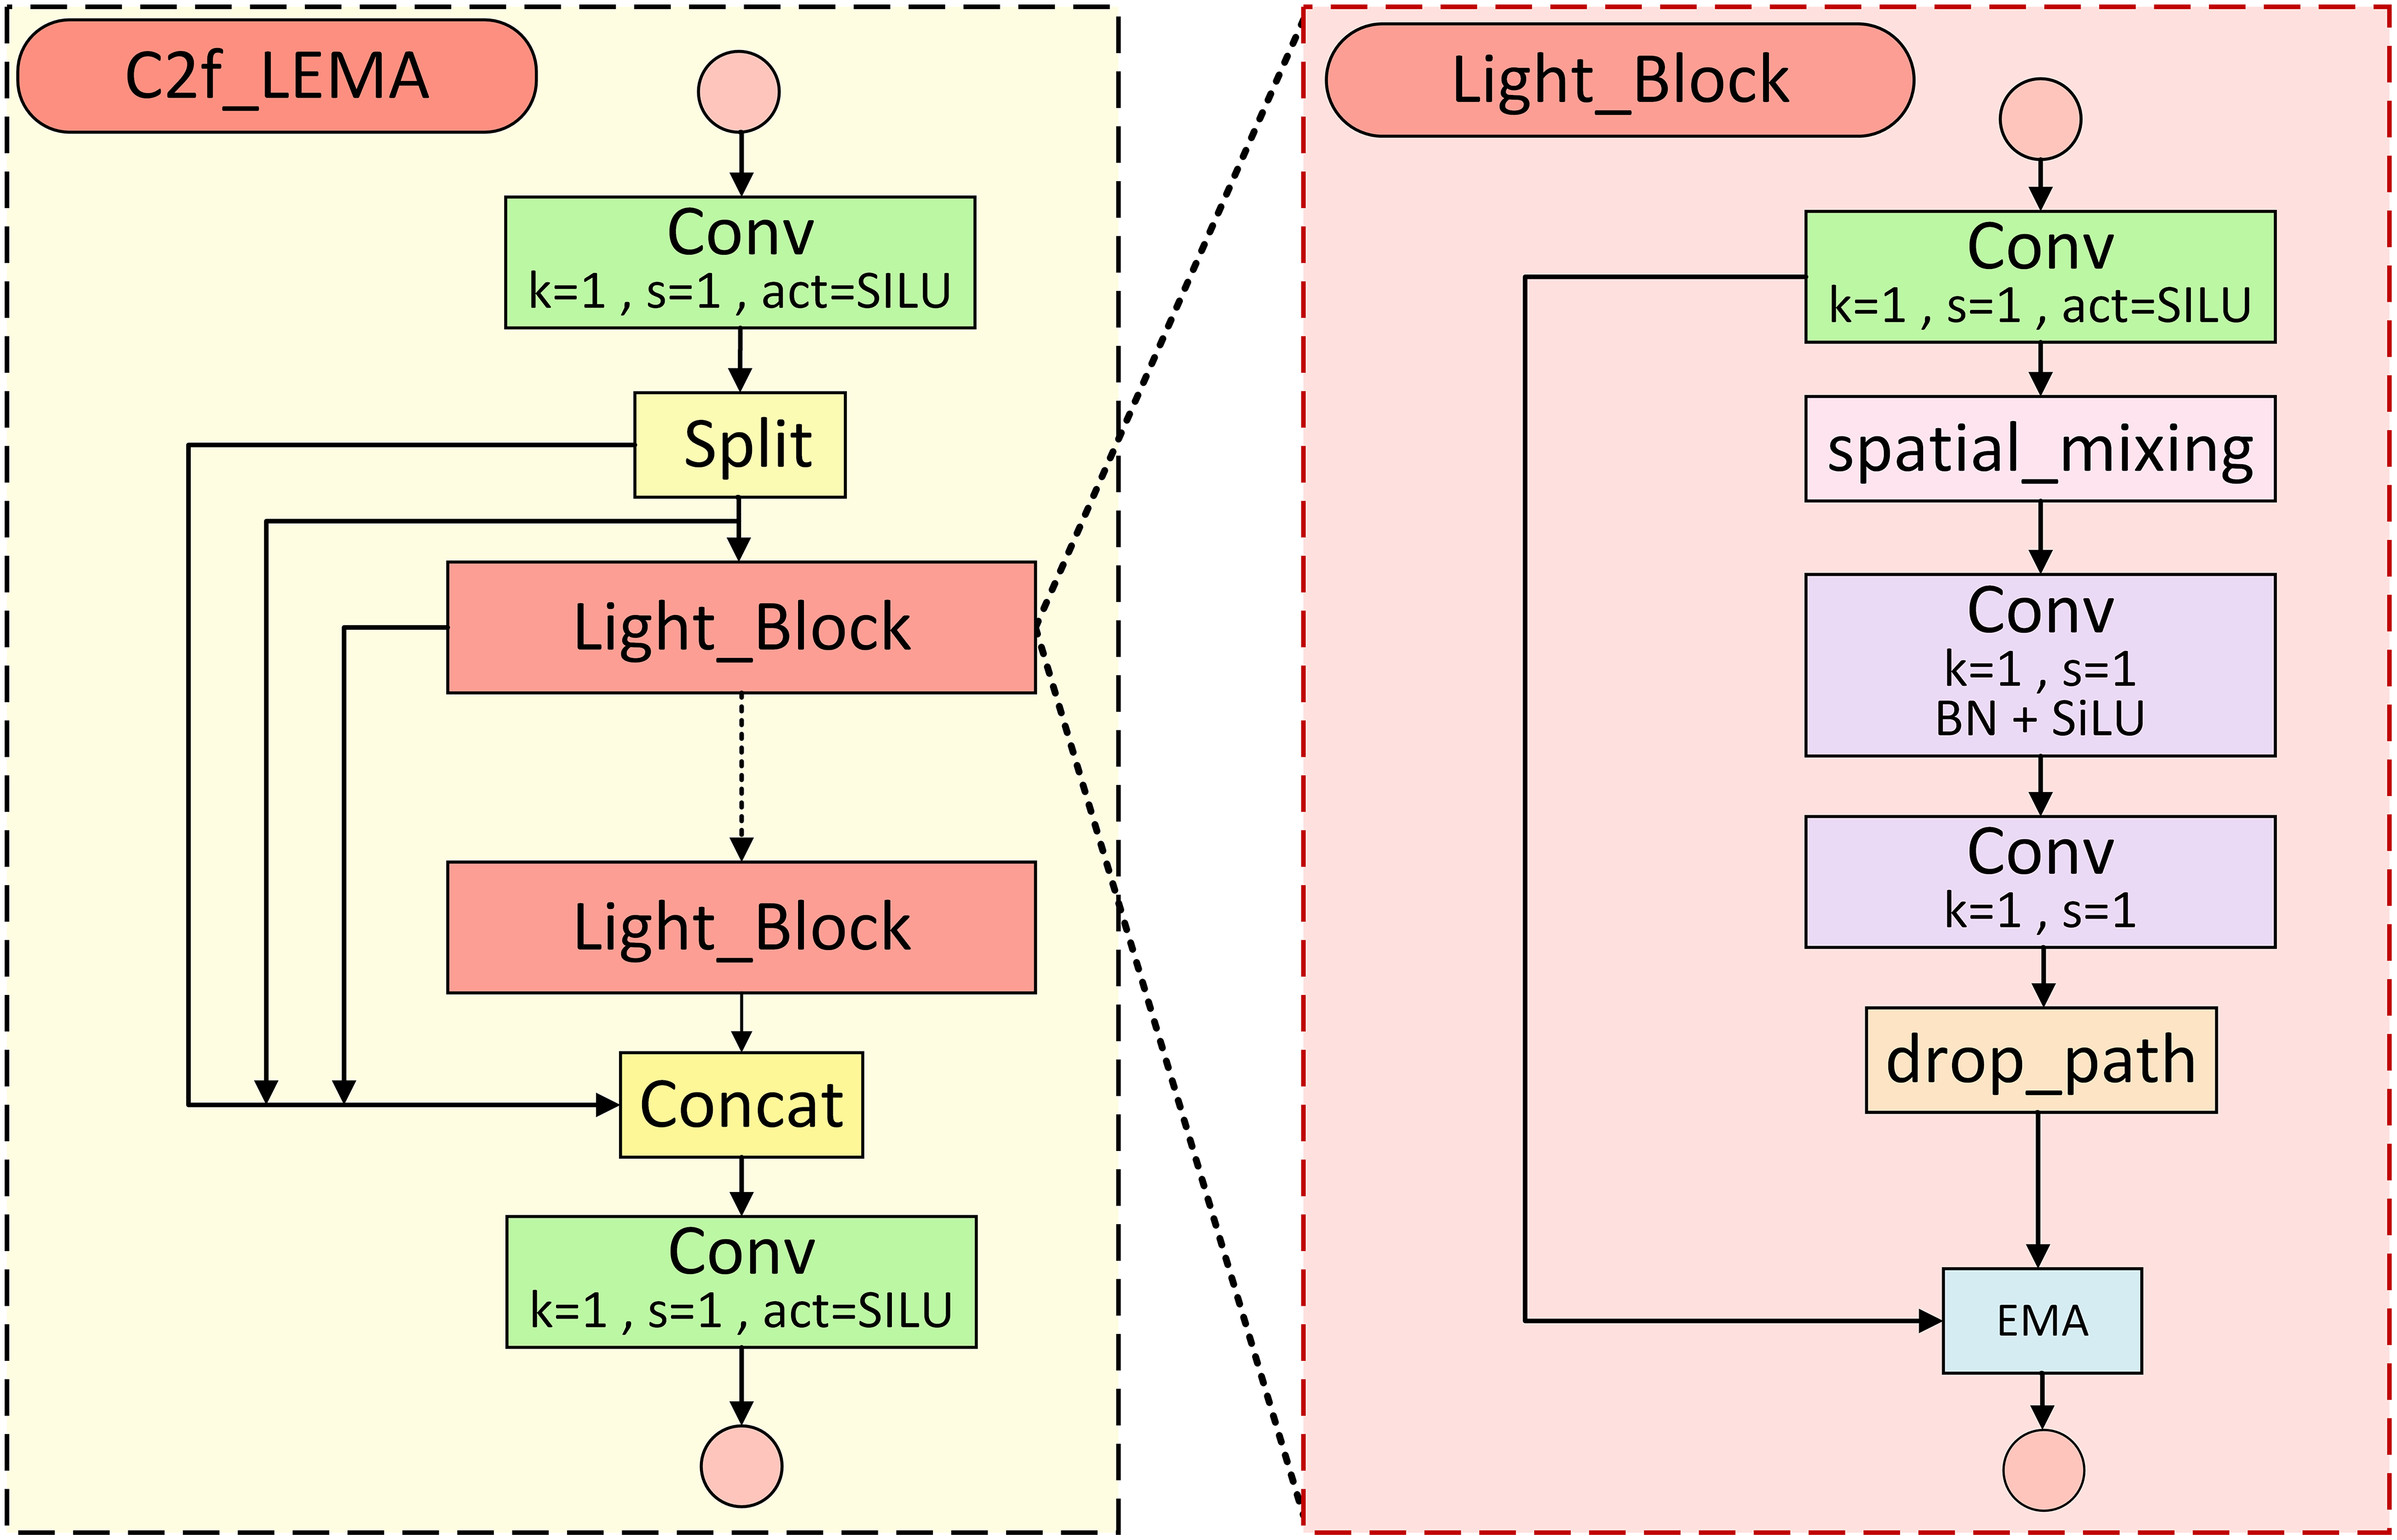
The network structure of the Light_Block module is illustrated in Fig. 4B. Within this module, PConv is applied in place of traditional convolution to diminish the model’s parameter count, while BN and SiLU activation are incorporated to mitigate vanishing gradients and bolster representational capacity. Thereafter, drop-path regularisation is implemented to mitigate overfitting. Finally, the EMA mechanism is embedded to suppress the influence of background interference, in turn improving detection accuracy and robustness. The subsequent section provides a detailed explanation of the PConv and EMA integrated in this module.
Partial convolution
Partial convolution (PConv) is an optimised convolution operation designed to extract features efficiently by minimising redundant computations. Its operational principle is illustrated in Fig. 5. Unlike standard convolution, PConv performs operations only on a subset of input channels, while the remaining channels are transmitted directly via identity mapping. This approach reduces unnecessary calculations and memory accesses, lowering computational complexity and rendering it particularly well-suited to devices with restricted memory and processing capacity. Accordingly, this study employs PConv in place of standard convolution within the Bottleneck architecture to achieve a reduction in model weight. The computational complexities of standard convolution and PConv are given in Eqs. (1) and (2), respectively:
(1)
(2) where h and w denote the height and width of the input feature map, respectively, and k represents the size of the convolution kernel. The symbol indicates the number of channels involved in the convolution operation. Typically, the number of used channels is one quarter of that in standard convolution, resulting in a computational complexity that is only one-sixteenth of that of standard convolution operation.
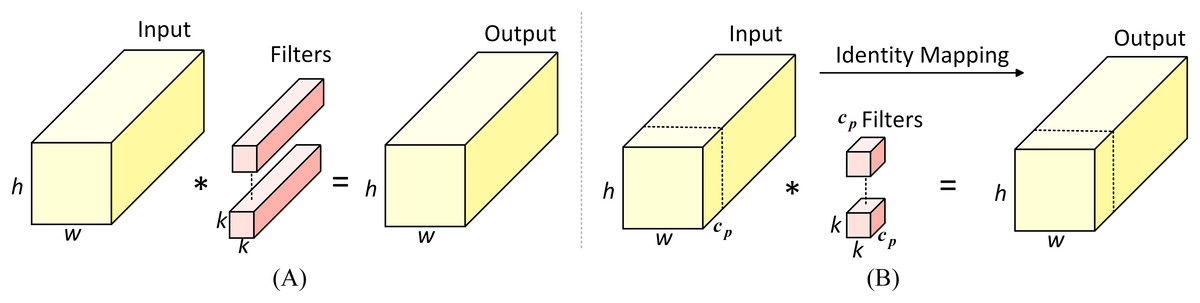
Figure 5: Standard convolution and partial convolution designs.
(A) Standard convolution. (B) Partial convolution.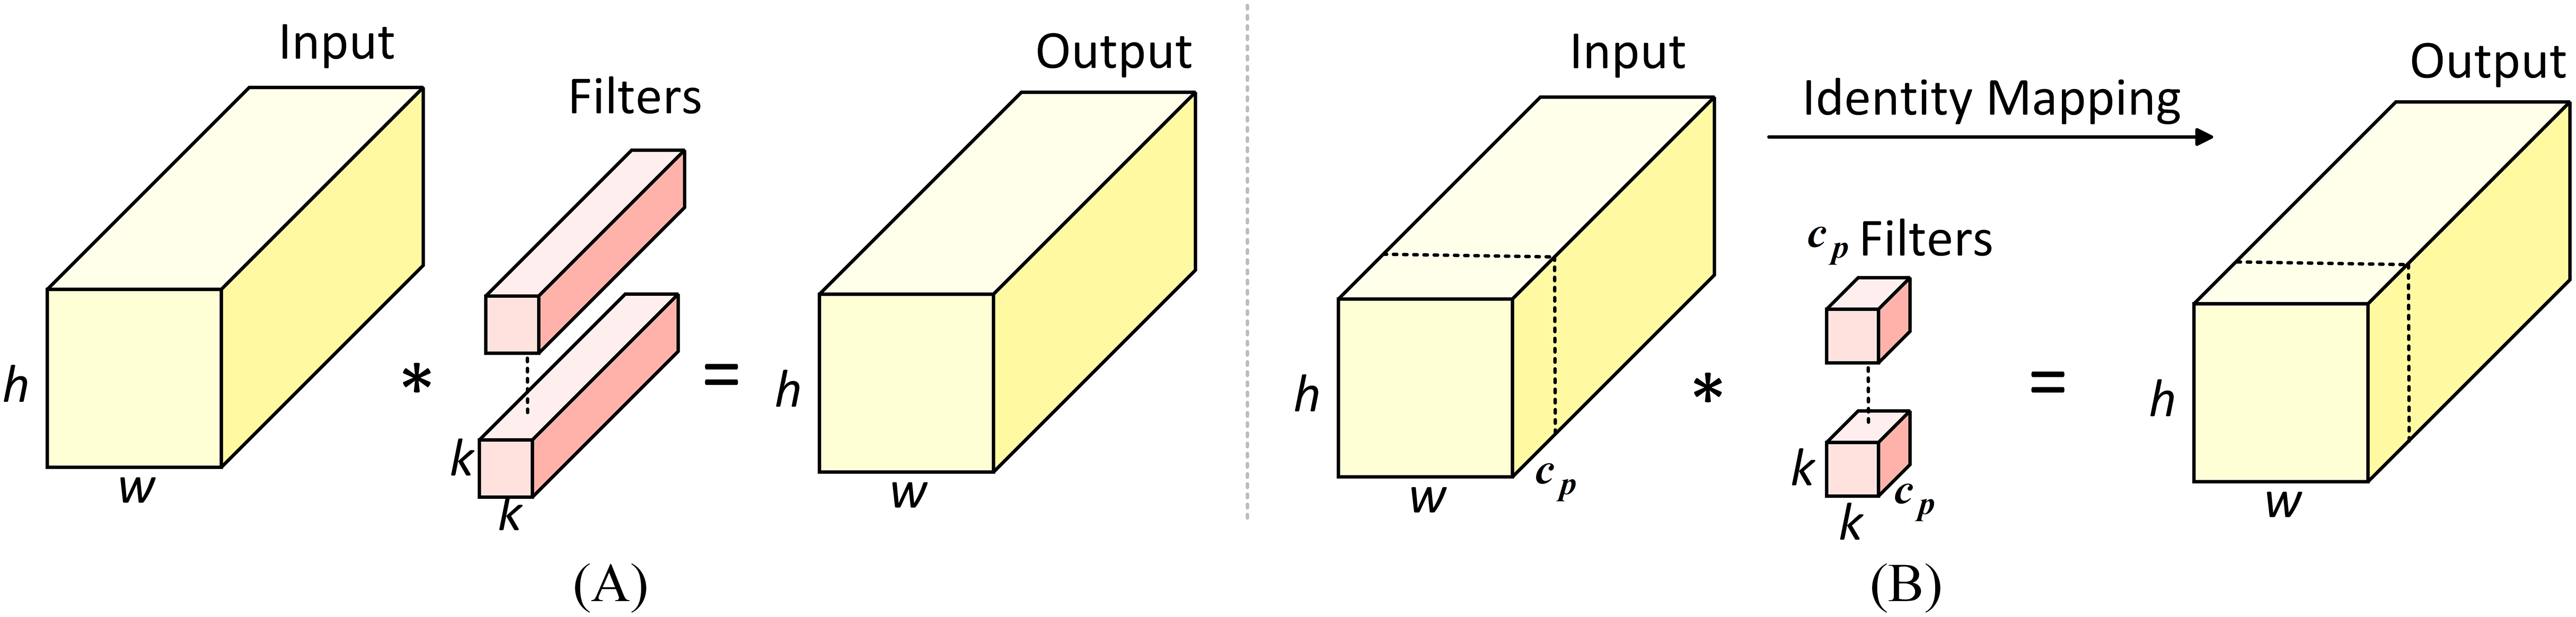
EMA mechanism
In natural environments, excessive or insufficient lighting can result in strong specular reflections and shadows on the fruit surface, therefore disrupting the consistency of colour and texture. This, as a consequence, obscures key fruit features and impairs the assessment of ripeness. When fruits are occluded by branches or leaves, the similarity in colour and texture complicates contour extraction, making it difficult for feature extraction algorithms to distinguish fruit boundaries, which may lead to missed detections. Furthermore, under long-distance detection, image resolution tends to degrade, often accompanied by blurring, and the intrusion of background elements becomes more frequent, increasing the complexity of image processing. Attention mechanisms function by generating feature weight distributions that allocate computational resources to the most relevant information for a given task. To this end, to mitigate the impact of natural environmental interference on information extraction, this study incorporates a plug-and-play cross-space learning EMA mechanism into the improved Light_Block module. This integration decreases the influence of background noise while maintaining the lightweight nature of the model and enhances the model’s focus on salient pomegranate fruit features, enhancing overall robustness.
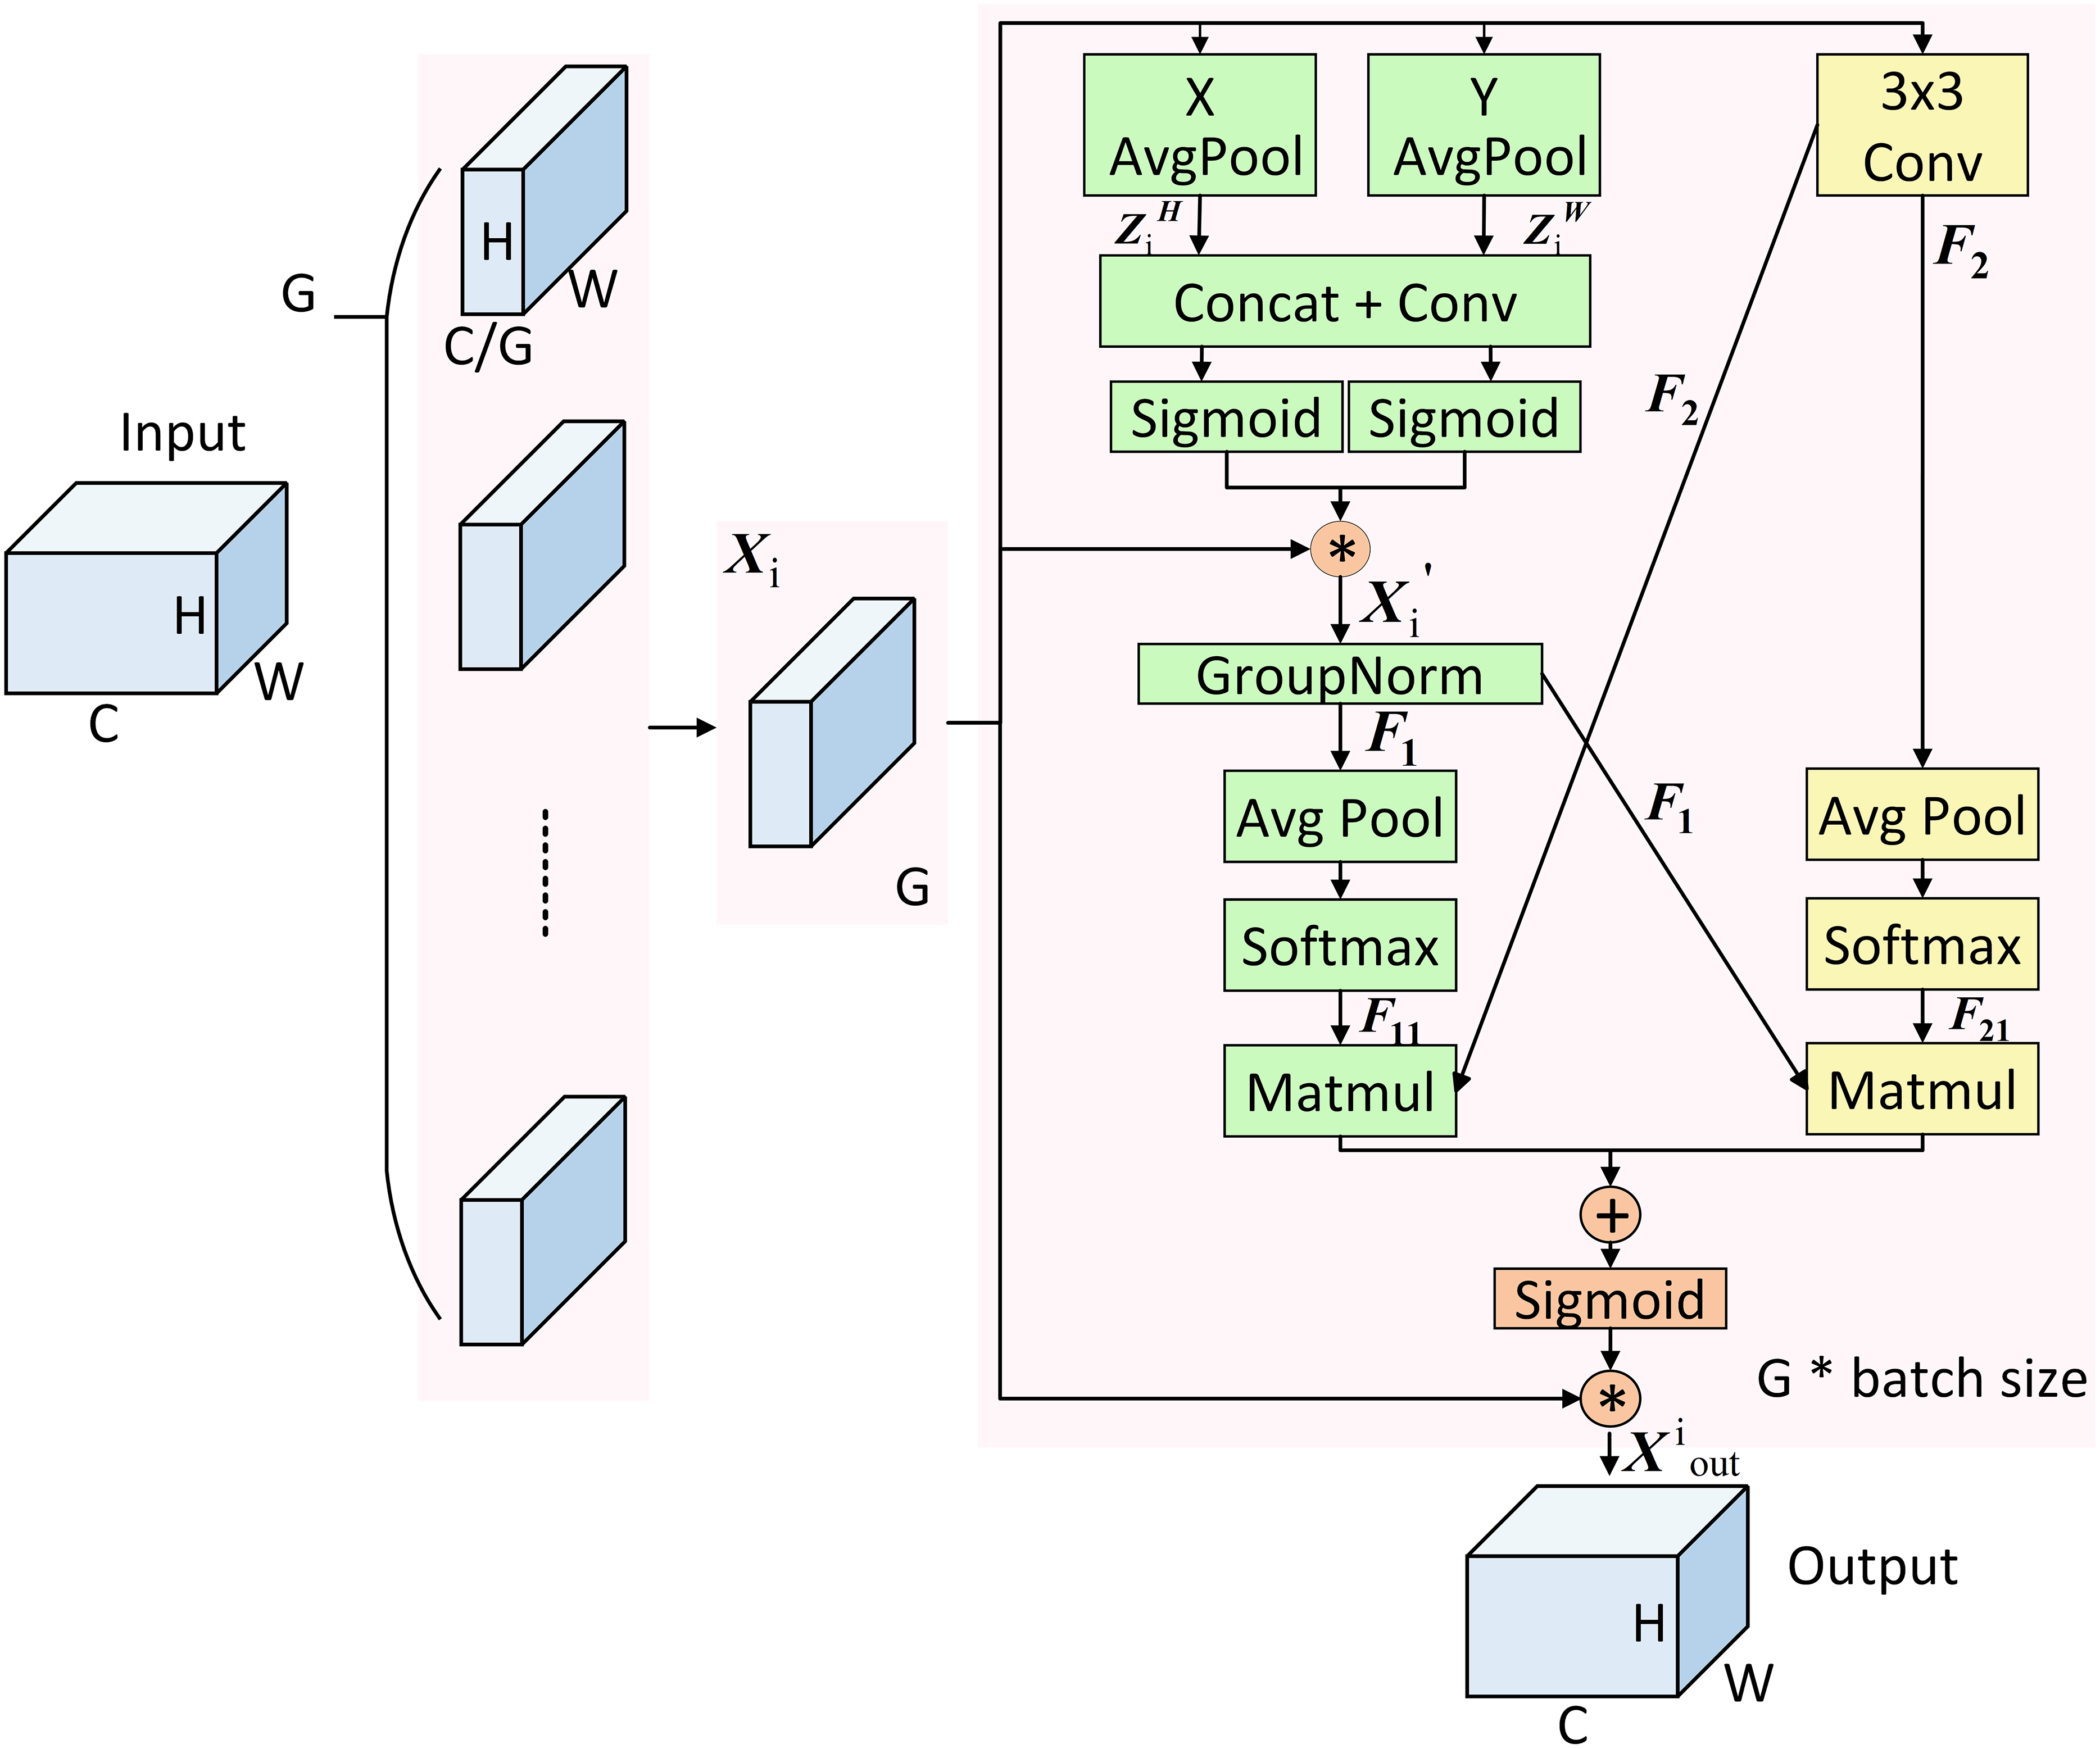
The core principle of the EMA mechanism is to augment the architecture’s capacity for feature processing by reorganising the channel and batch dimensions, encoding global information through parallel branches, recalibrating channel weights, and employing cross-dimensional interactions to capture pixel-level relationships. Specifically, within the EMA module, the input features are first grouped and then processed through two distinct branches: one performs one-dimensional global pooling, while the other conducts feature extraction through a 3 × 3 convolution. After applying Sigmoid activation and normalisation, the outputs from both branches undergo cross-dimensional interaction to achieve pixel-level relational modelling. Finally, feature modulation coefficients are generated through Sigmoid mapping, and the output is produced following the adjustment of the input features. The structure is shown in Fig. 6.
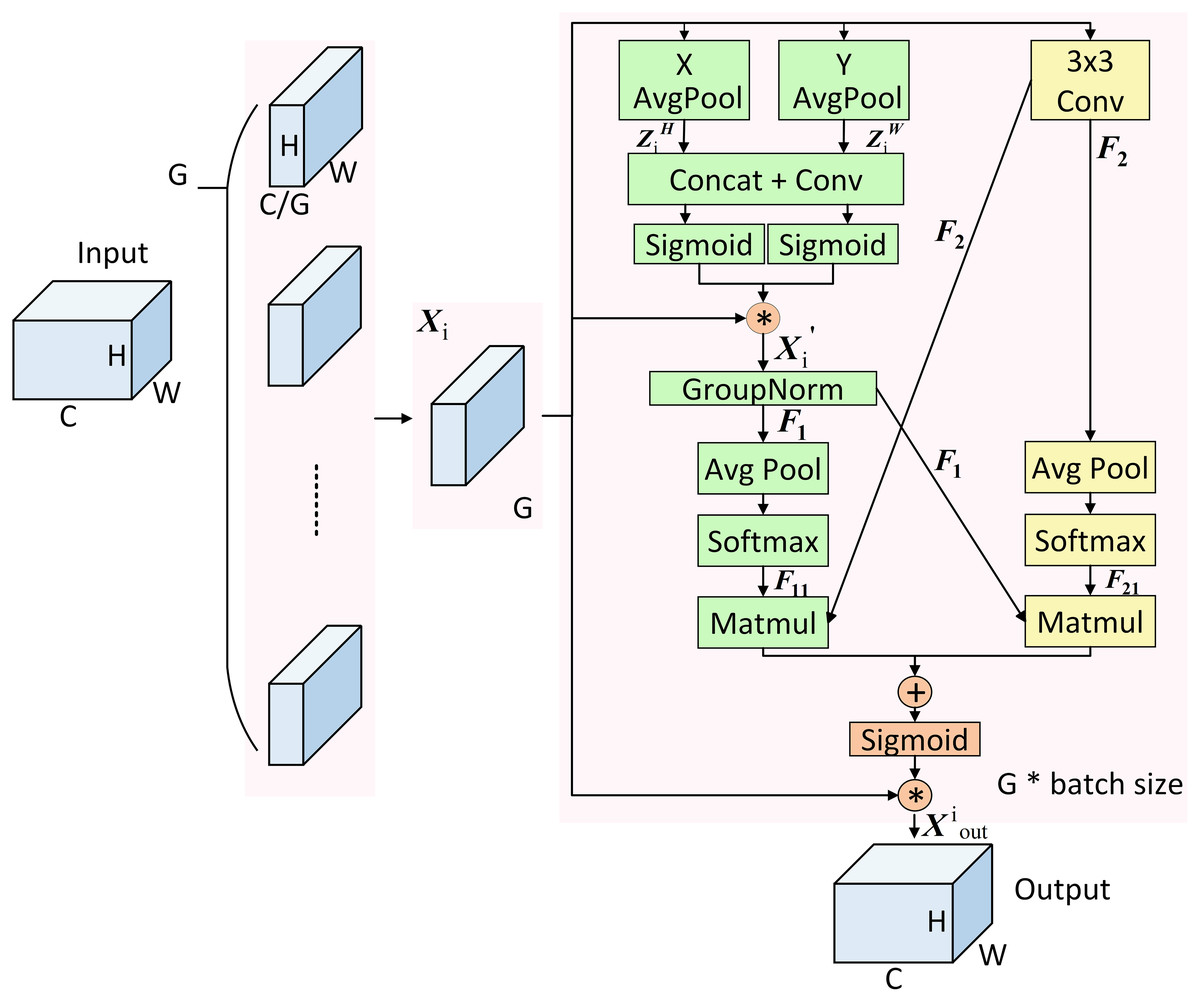
Figure 6: Structure of EMA mechanism.
According to the above, the implementation of the EMA mechanism comprises four primary components: feature grouping, parallel sub-networks, cross-space learning, and feature aggregation interaction (Garbin, Zhu & Marques, 2020). In the feature grouping stage, any input feature map is divided into G sub-feature maps along the cross-channel dimension to learn distinct semantic representations. These can be denoted as , .
In the parallel sub-network stage, the grouped feature maps are processed separately through the 1 × 1 and 3 × 3 branches. Within the 1 × 1 branch, two 1D global average pooling operations are applied along two directions to encode the channels, resulting in and , which are computed as shown in Eqs. (3) and (4).
(3)
(4) where denotes the i-th group of input features, H and W represent the height and width of the input feature map, respectively, and are the feature values at positions H, j, and k, W, respectively.
After applying Concat and a 1 × 1 convolution to features and , the resulting feature map is re-segmented along the height and width dimensions, respectively, with each segment undergoing a Sigmoid activation. The resulting weights are then aggregated and added to the sub-feature maps to produce . Subsequently, group normalisation is applied to to generate the intermediate feature representation , as computed in Eqs. (5) and (6):
(5)
(6) where denotes a 1 × 1 convolutional layer, represents the Sigmoid activation function, and GN denotes the group normalisation operation.
In the 3 × 3 branch, undergoes a 3 × 3 convolution to obtain the intermediate feature representation , as calculated in Eq. (7):
(7) where denotes a 3 × 3 convolutional layer.
In the cross-space learning stage, the intermediate features and are first subjected to 2D global average pooling. The resulting representations are then passed through the Softmax function to generate intermediate feature layers and , as defined in Eqs. (8) and (9).
(8)
(9)
Two spatial attention maps are generated by aggregating and , as well as and through matrix dot product operations. These maps are subsequently fused and processed using the Sigmoid function. A weighted summation with the original sub-features is then performed to obtain the output feature map of the i-th group, denoted as . Finally, the outputs from all G-groups are aggregated to generate the final output , which is computed as described in Eqs. (10) and (11):
(10)
(11)
GNSH module
To further reduce the model’s complexity, this study examines the detection head of YOLOv10s. The model adopts a dual-head architecture with a consistent dual allocation strategy, whereby the two heads are jointly optimised during training. During inference, only a single detection head is employed, therefore eliminating the reliance on NMS and markedly reducing inference overhead (Wang et al., 2024a). Although YOLOv10s refines the detection head structure for end-to-end deployment, redundant components remain, resulting in diminished detection performance and efficiency on edge devices.
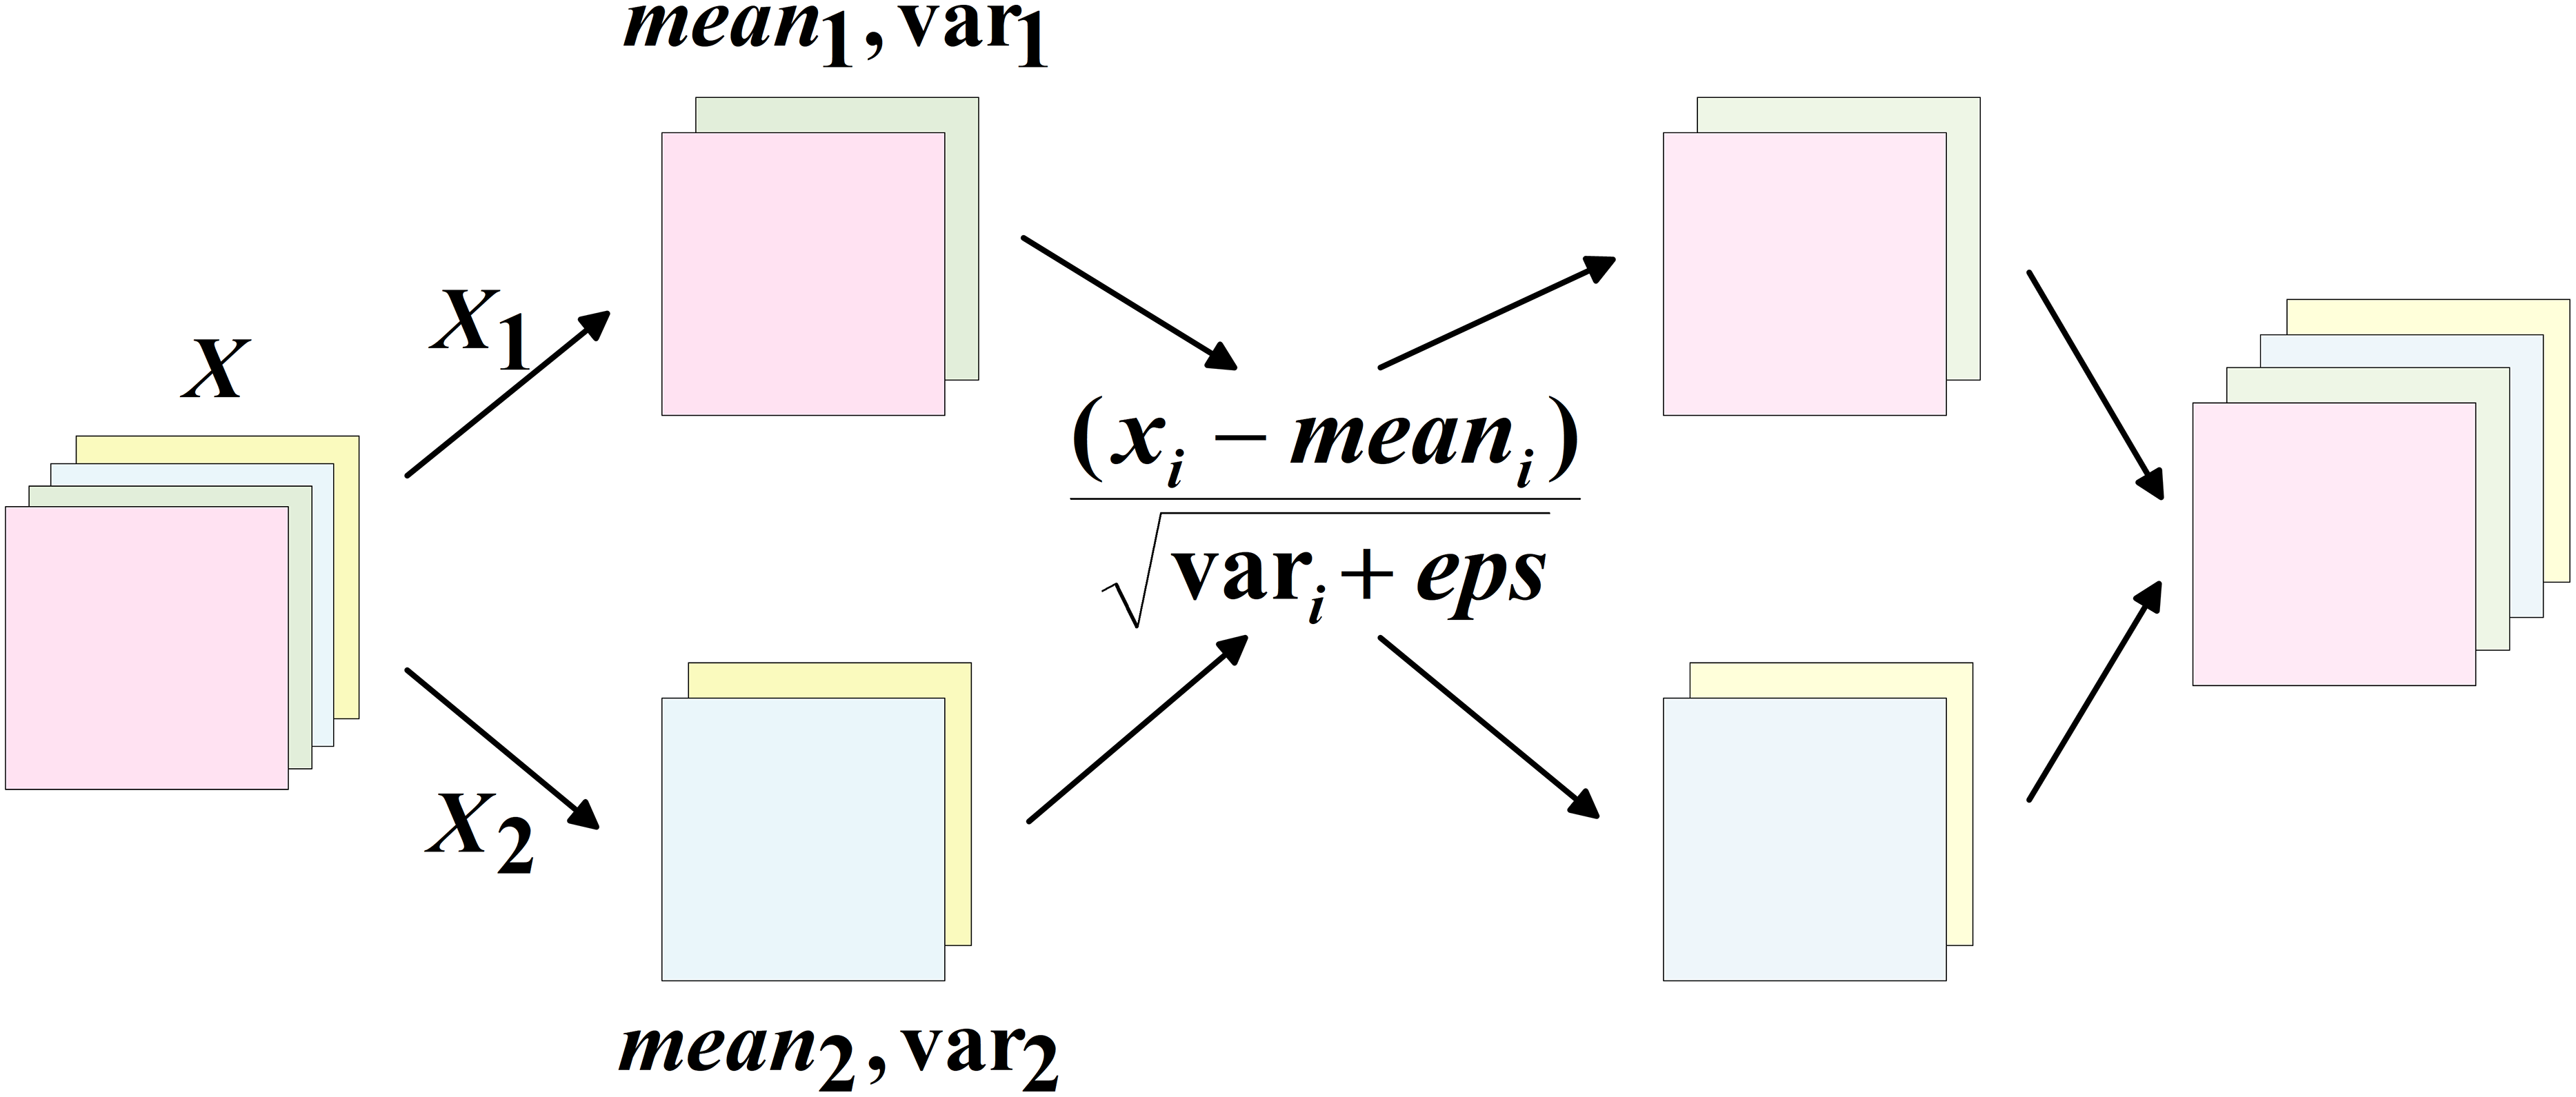
To overcome this issue, the present study proposes a lightweight detection head, GNSH (GroupNorm and Shared Head), which incorporates group normalisation and shared convolution. BN accelerates training convergence and introduces a regularisation effect by normalising layer inputs (Garbin, Zhu & Marques, 2020); however, it is sensitive to batch size variation, and inaccurate estimation of mean and variance during small-batch training may result in performance degradation. Consequently, Group Normalisation (GN) (Wu & He, 2018) is adopted in place of BN in this study. GN divides the input channels within a batch into multiple groups, and computes the mean and variance within each group to perform normalisation. This approach maintains high accuracy and stability across a range of batch sizes. The specific operation is shown in Fig. 7. For feature maps within the same batch, the channels are first divided into several groups. The mean and variance are then computed within each group, and these statistics are subsequently utilised to normalise the data in a memory-efficient manner, making it well-suited to resource-constrained environments.
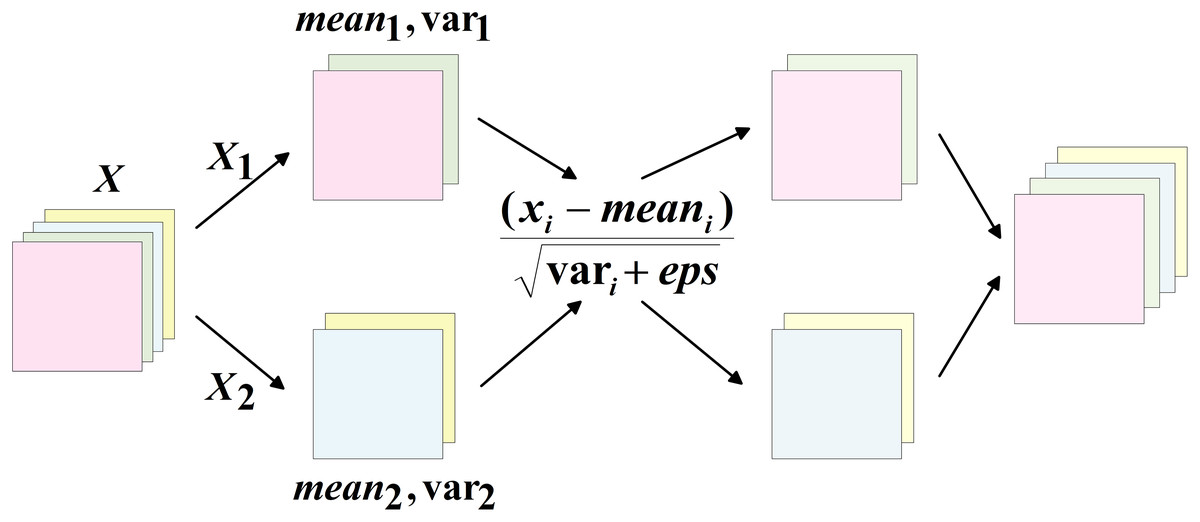
Figure 7: Schematic diagram of GN operation.
Shared convolution is a common operation in convolutional neural networks (CNNs), wherein the core concept is that different parts of the network utilise the same convolutional kernel parameters to extract features. In other words, the convolution weights are shared across all or part of the network. Building upon this principle, the present study employs two shared convolutional layers to replace the standard convolution, with the aim of unifying features across multiple detection layers, reducing parameter redundancy, and enhancing feature consistency. This design contributes to lowering both model complexity and computational demands.
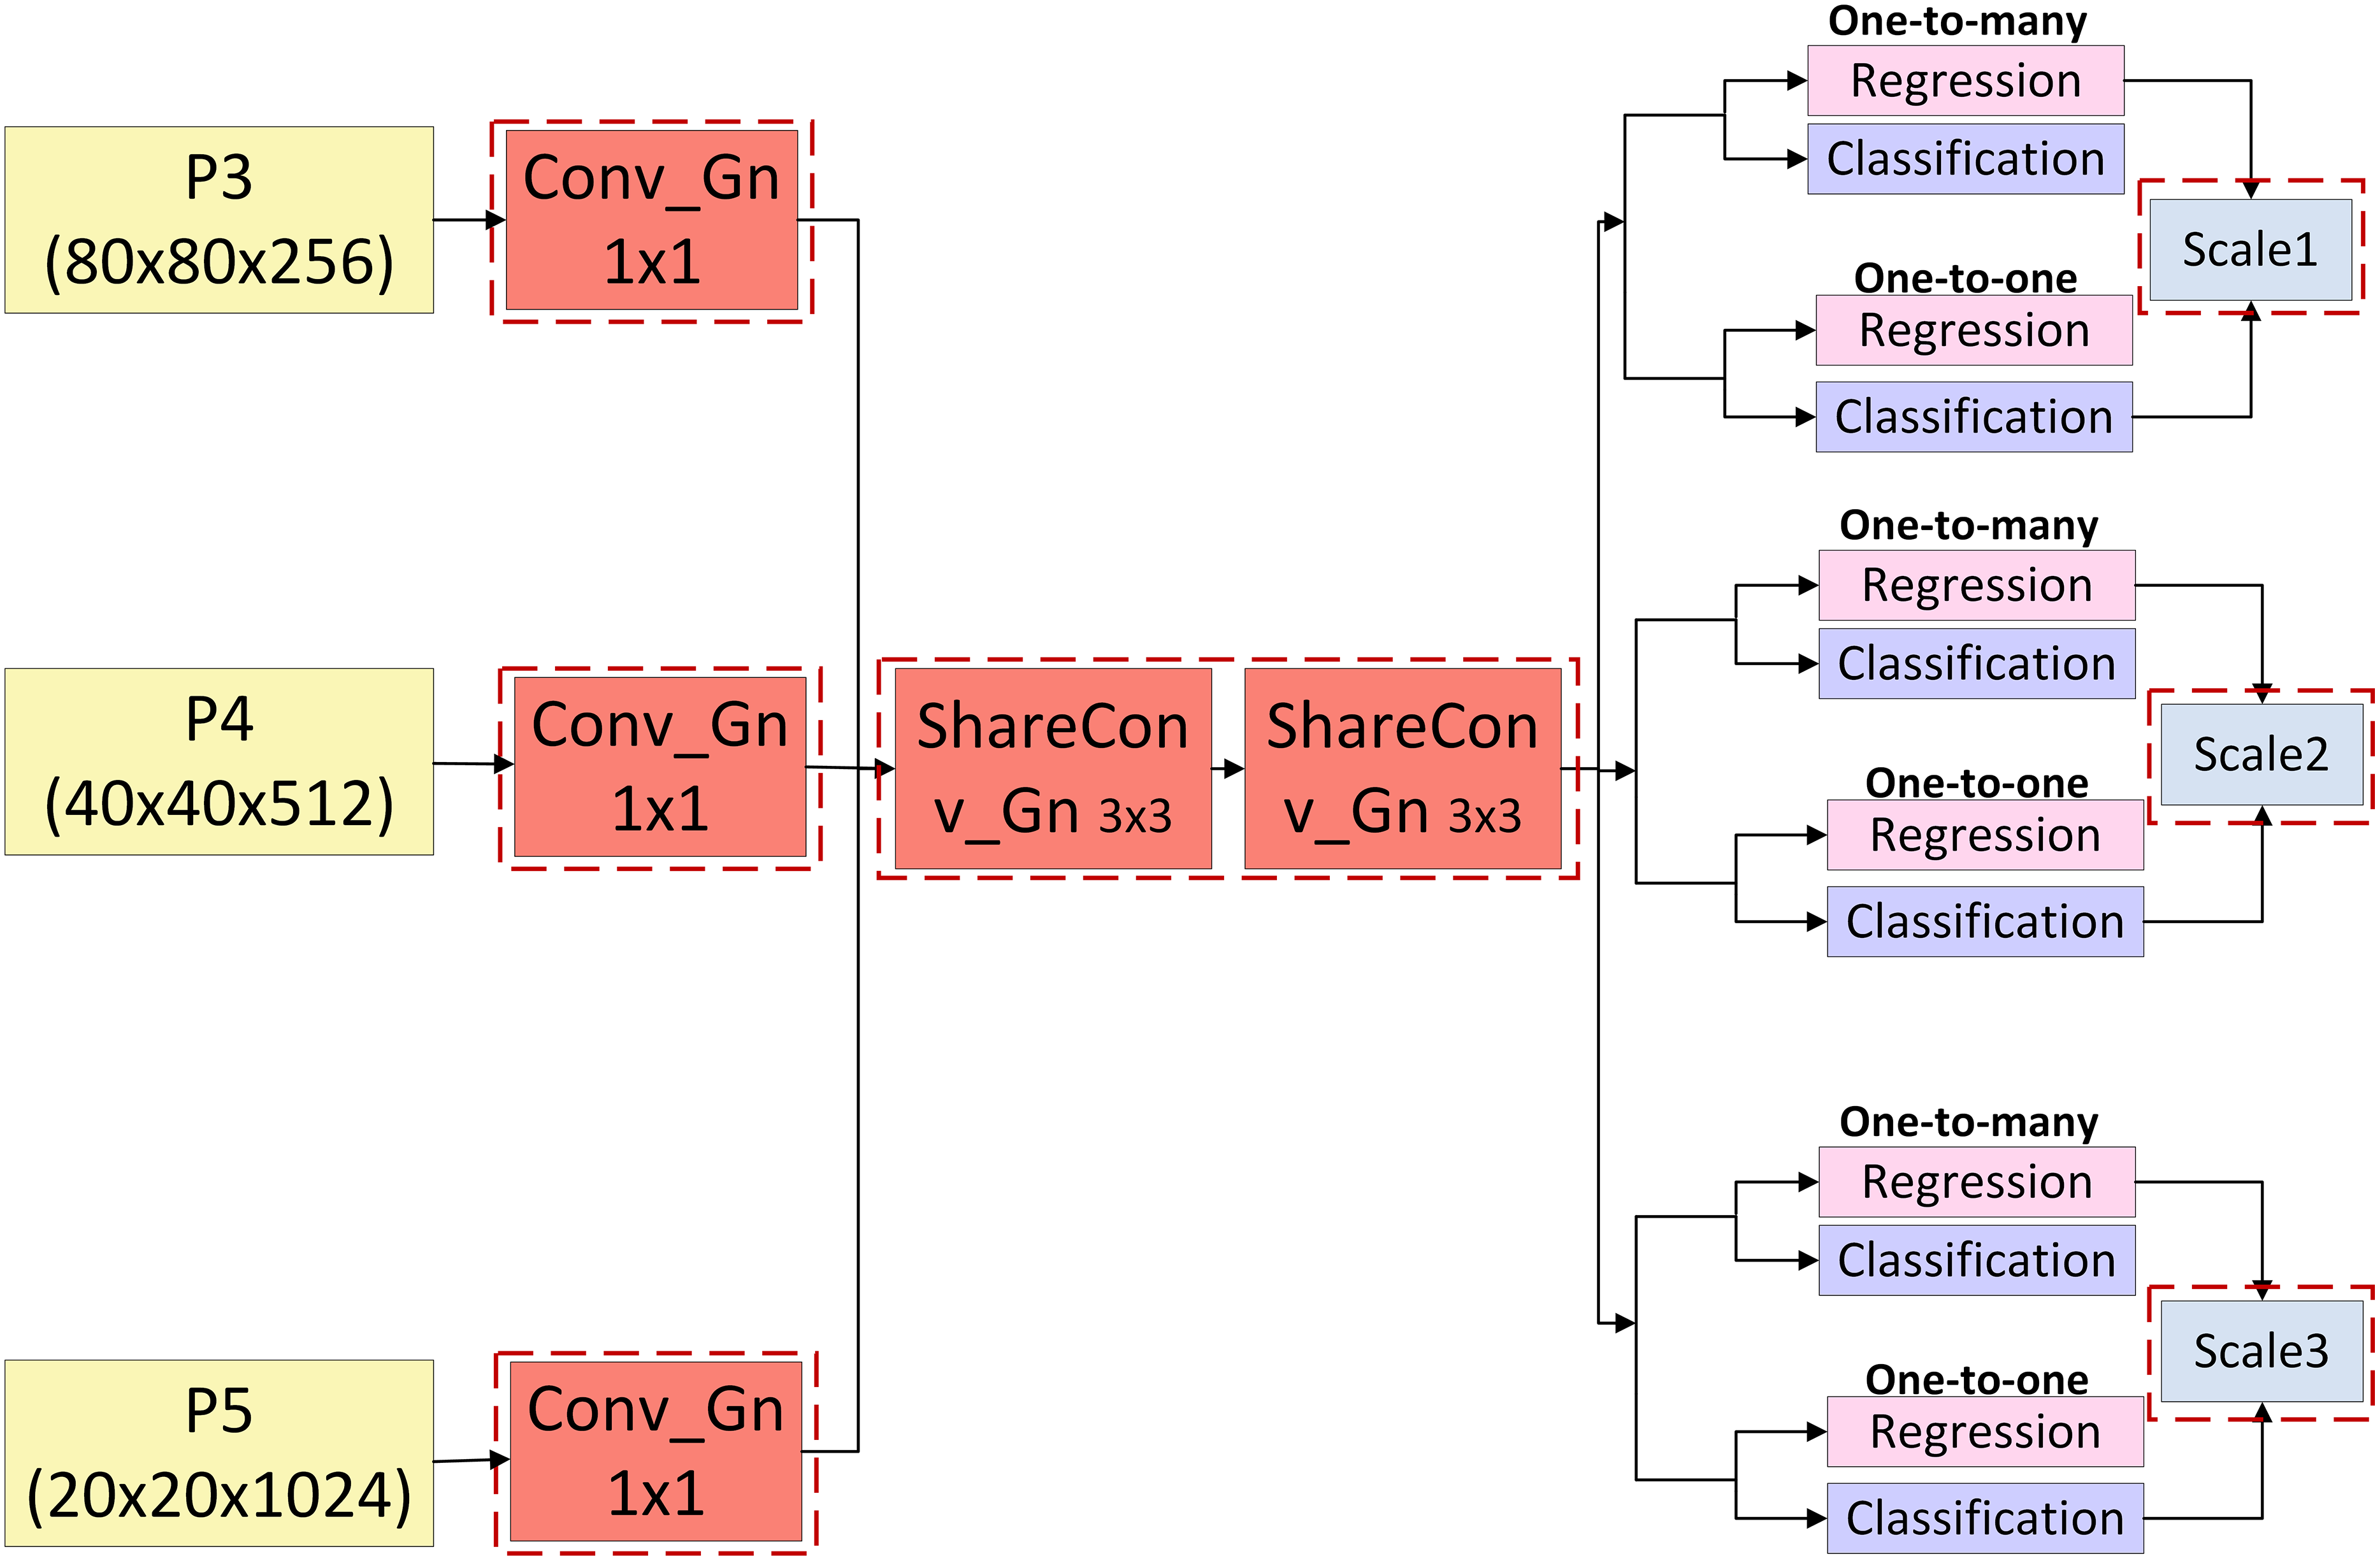
This study proposes the GNSH detection head, which combines the advantages of GN and shared convolution to reduce both parameter count and computational complexity while preserving effective feature information fusion. The network structure is illustrated in Fig. 8, with the enhancements indicated by red dashed boxes. The three multi-scale feature maps, generated from the fusion of features within the neck network, are sequentially processed through a group-normalised 1 × 1 convolution, followed by two group-normalised 3 × 3 convolutions. The latter operates as a shared convolution, substantially reducing the number of parameters. The processed features are directed to the detection head, where a decoupled architecture is adopted. One branch undergoes convolution for the regression task, projecting the bounding box regression values. A scale layer, shared across all detection layers, is employed to mitigate discrepancies in feature map outputs across different detection layers caused by scale variations resulting from shared convolution. This facilitates the accurate localisation of pomegranate fruits. The other branch performs convolution for the classification task, predicting category probabilities and enabling the classification of pomegranate fruit ripeness.
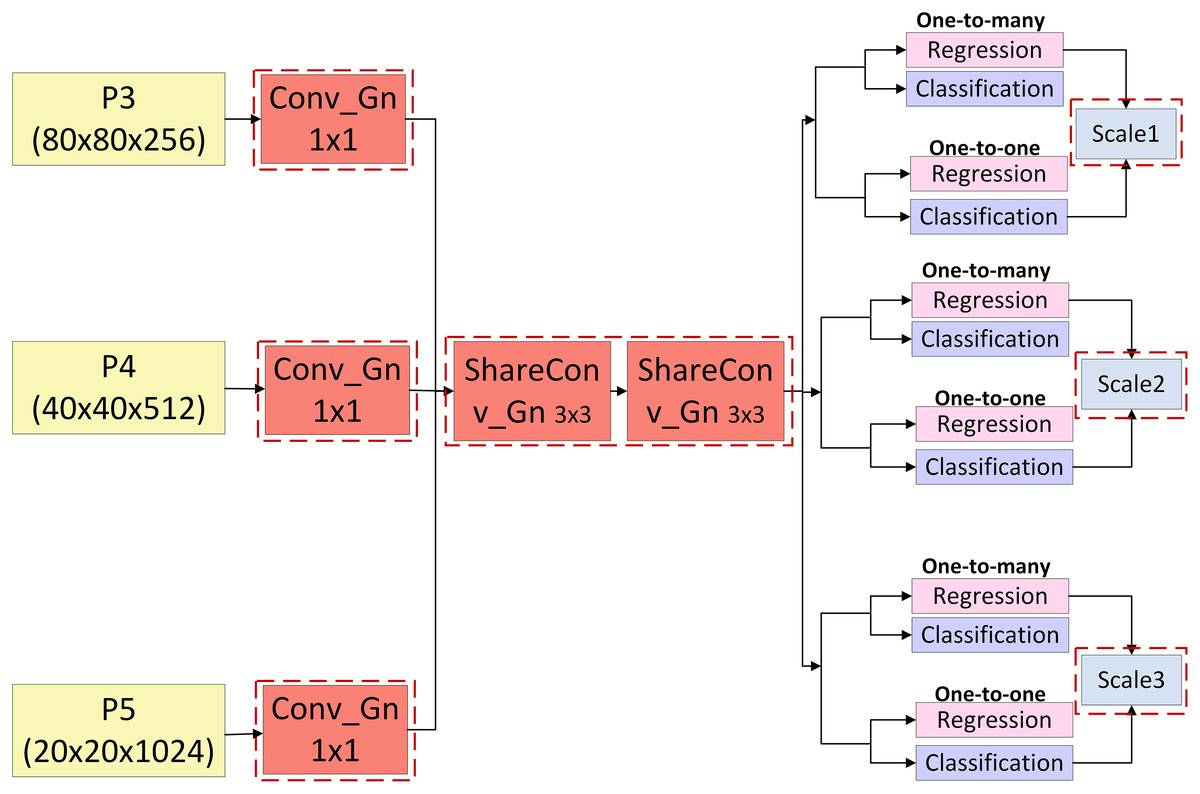
Figure 8: Structure of GNSH detection head.
Experiments and results
Experimental environment and setup
The parameters for this experiment are configured as follows: the learning rate is set to 0.01, the batch size is 16, and the input image resolution is 640 × 640. The number of training epochs is set to 350, the momentum is 0.937, and the weight decay is 0.0005. The YOLOv10s model is adopted as the baseline. The experimental environment configuration is detailed in Table 1.
| Name | Environment configuration |
|---|---|
| Operating system | Windows 10 × 64 |
| Processor | Intel (R) Xeon (R) Platinum 8362 |
| GPU | NVIDIA RTX 3090 |
| Programming language | Python3.9 |
| Deep learning framework | PyTorch2.0.0 |
Datasets and preprocessing
Pomegranate images dataset
To accurately assess the ripeness and precisely localise pomegranate fruits, the present study employs the Pomegranate Images Dataset (Zhao et al., 2023a), which is specifically collected to observe the developmental stages of pomegranates. The dataset comprises 5,857 images, categorised into five ripeness stages reflecting the pomegranate growth process: Bud (Bud stage), Flower (Flower stage), Early-fruit (Early-fruit stage), Mid-growth (Mid-term), and Ripe (Ripening stage). All images are in JPG format with a resolution of 640 × 480 pixels. Representative images of pomegranates at different developmental stages are shown in Fig. 9.
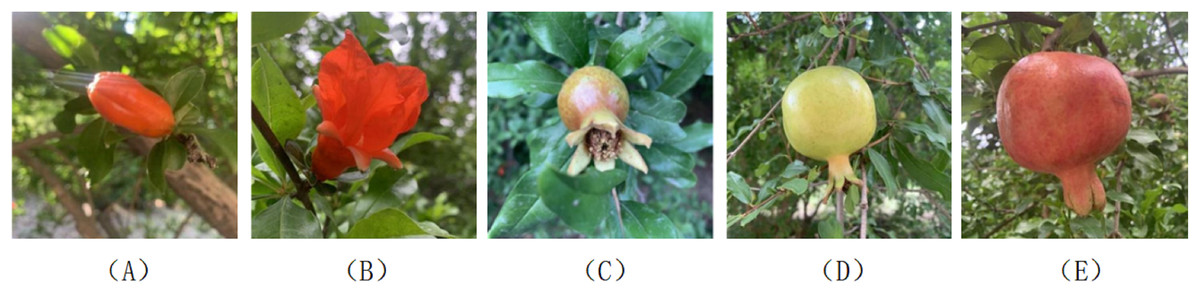
Figure 9: Images of pomegranates at different ripeness categories in the Pomegranate Images Dataset.
(A) Bud. (B) Flower. (C) Early-fruit. (D) Mid-growth. (E) Ripe.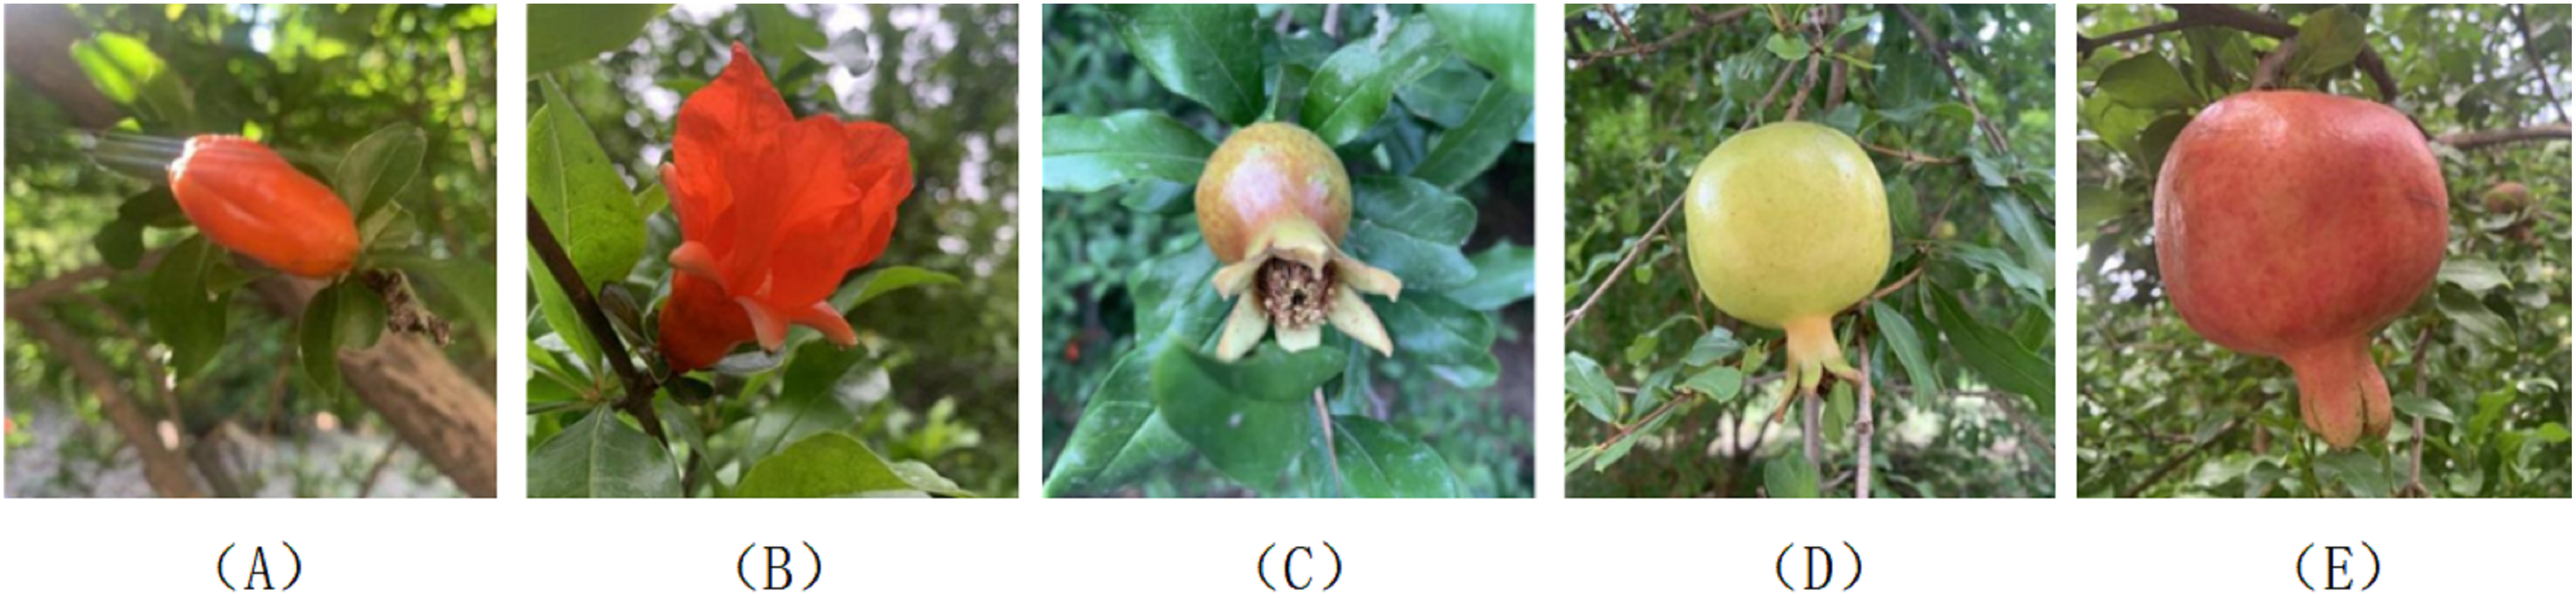
The dataset maintains a balanced number of samples across all categories, with the number of images in each class presented in Table 2. The dataset is partitioned into training, validation, and test sets using a 7:1:2 ratio, resulting in 4,099 images for training, 586 for validation, and 1,172 for testing. This dataset not only captures the characteristics of pomegranate fruits at various growth stages, but also includes several natural conditions within the orchard, such as strong lighting, backlighting, branch occlusion, leaf occlusion, fruit occlusion, and long-distance observation. Representative examples of these conditions are illustrated in Fig. 10.
| Class | Bud | Flower | Early-fruit | Mid-growth | Ripe | ALL |
|---|---|---|---|---|---|---|
| Number | 1,245 | 1,243 | 1,007 | 1,259 | 1,103 | 5,857 |
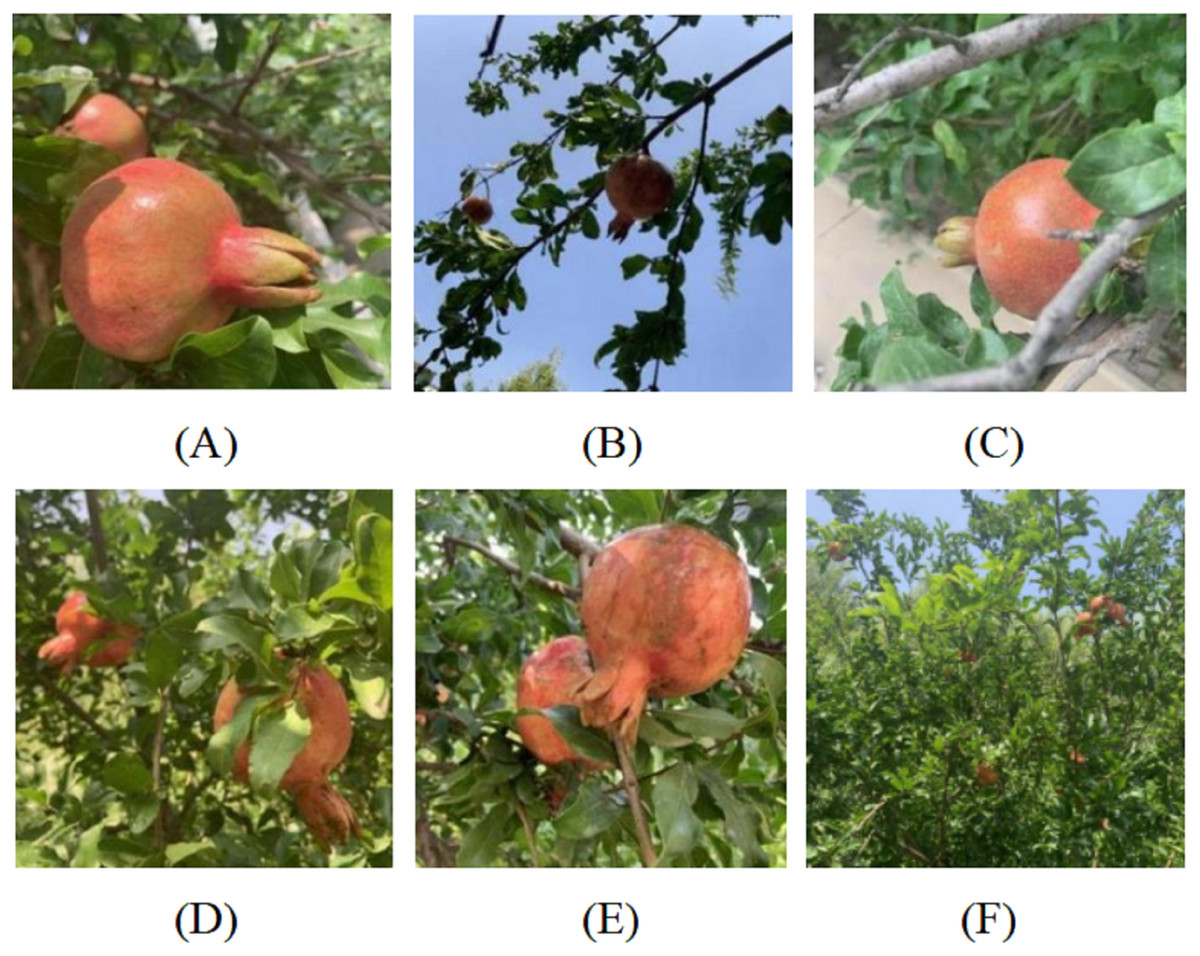
Figure 10: Images of different background conditions in the Pomegranate Images Dataset.
(A) Strong light. (B) Backlight. (C) Branch occlusion. (D) Leaf occlusion. (E) Fruit occlusion. (F) Long-distance.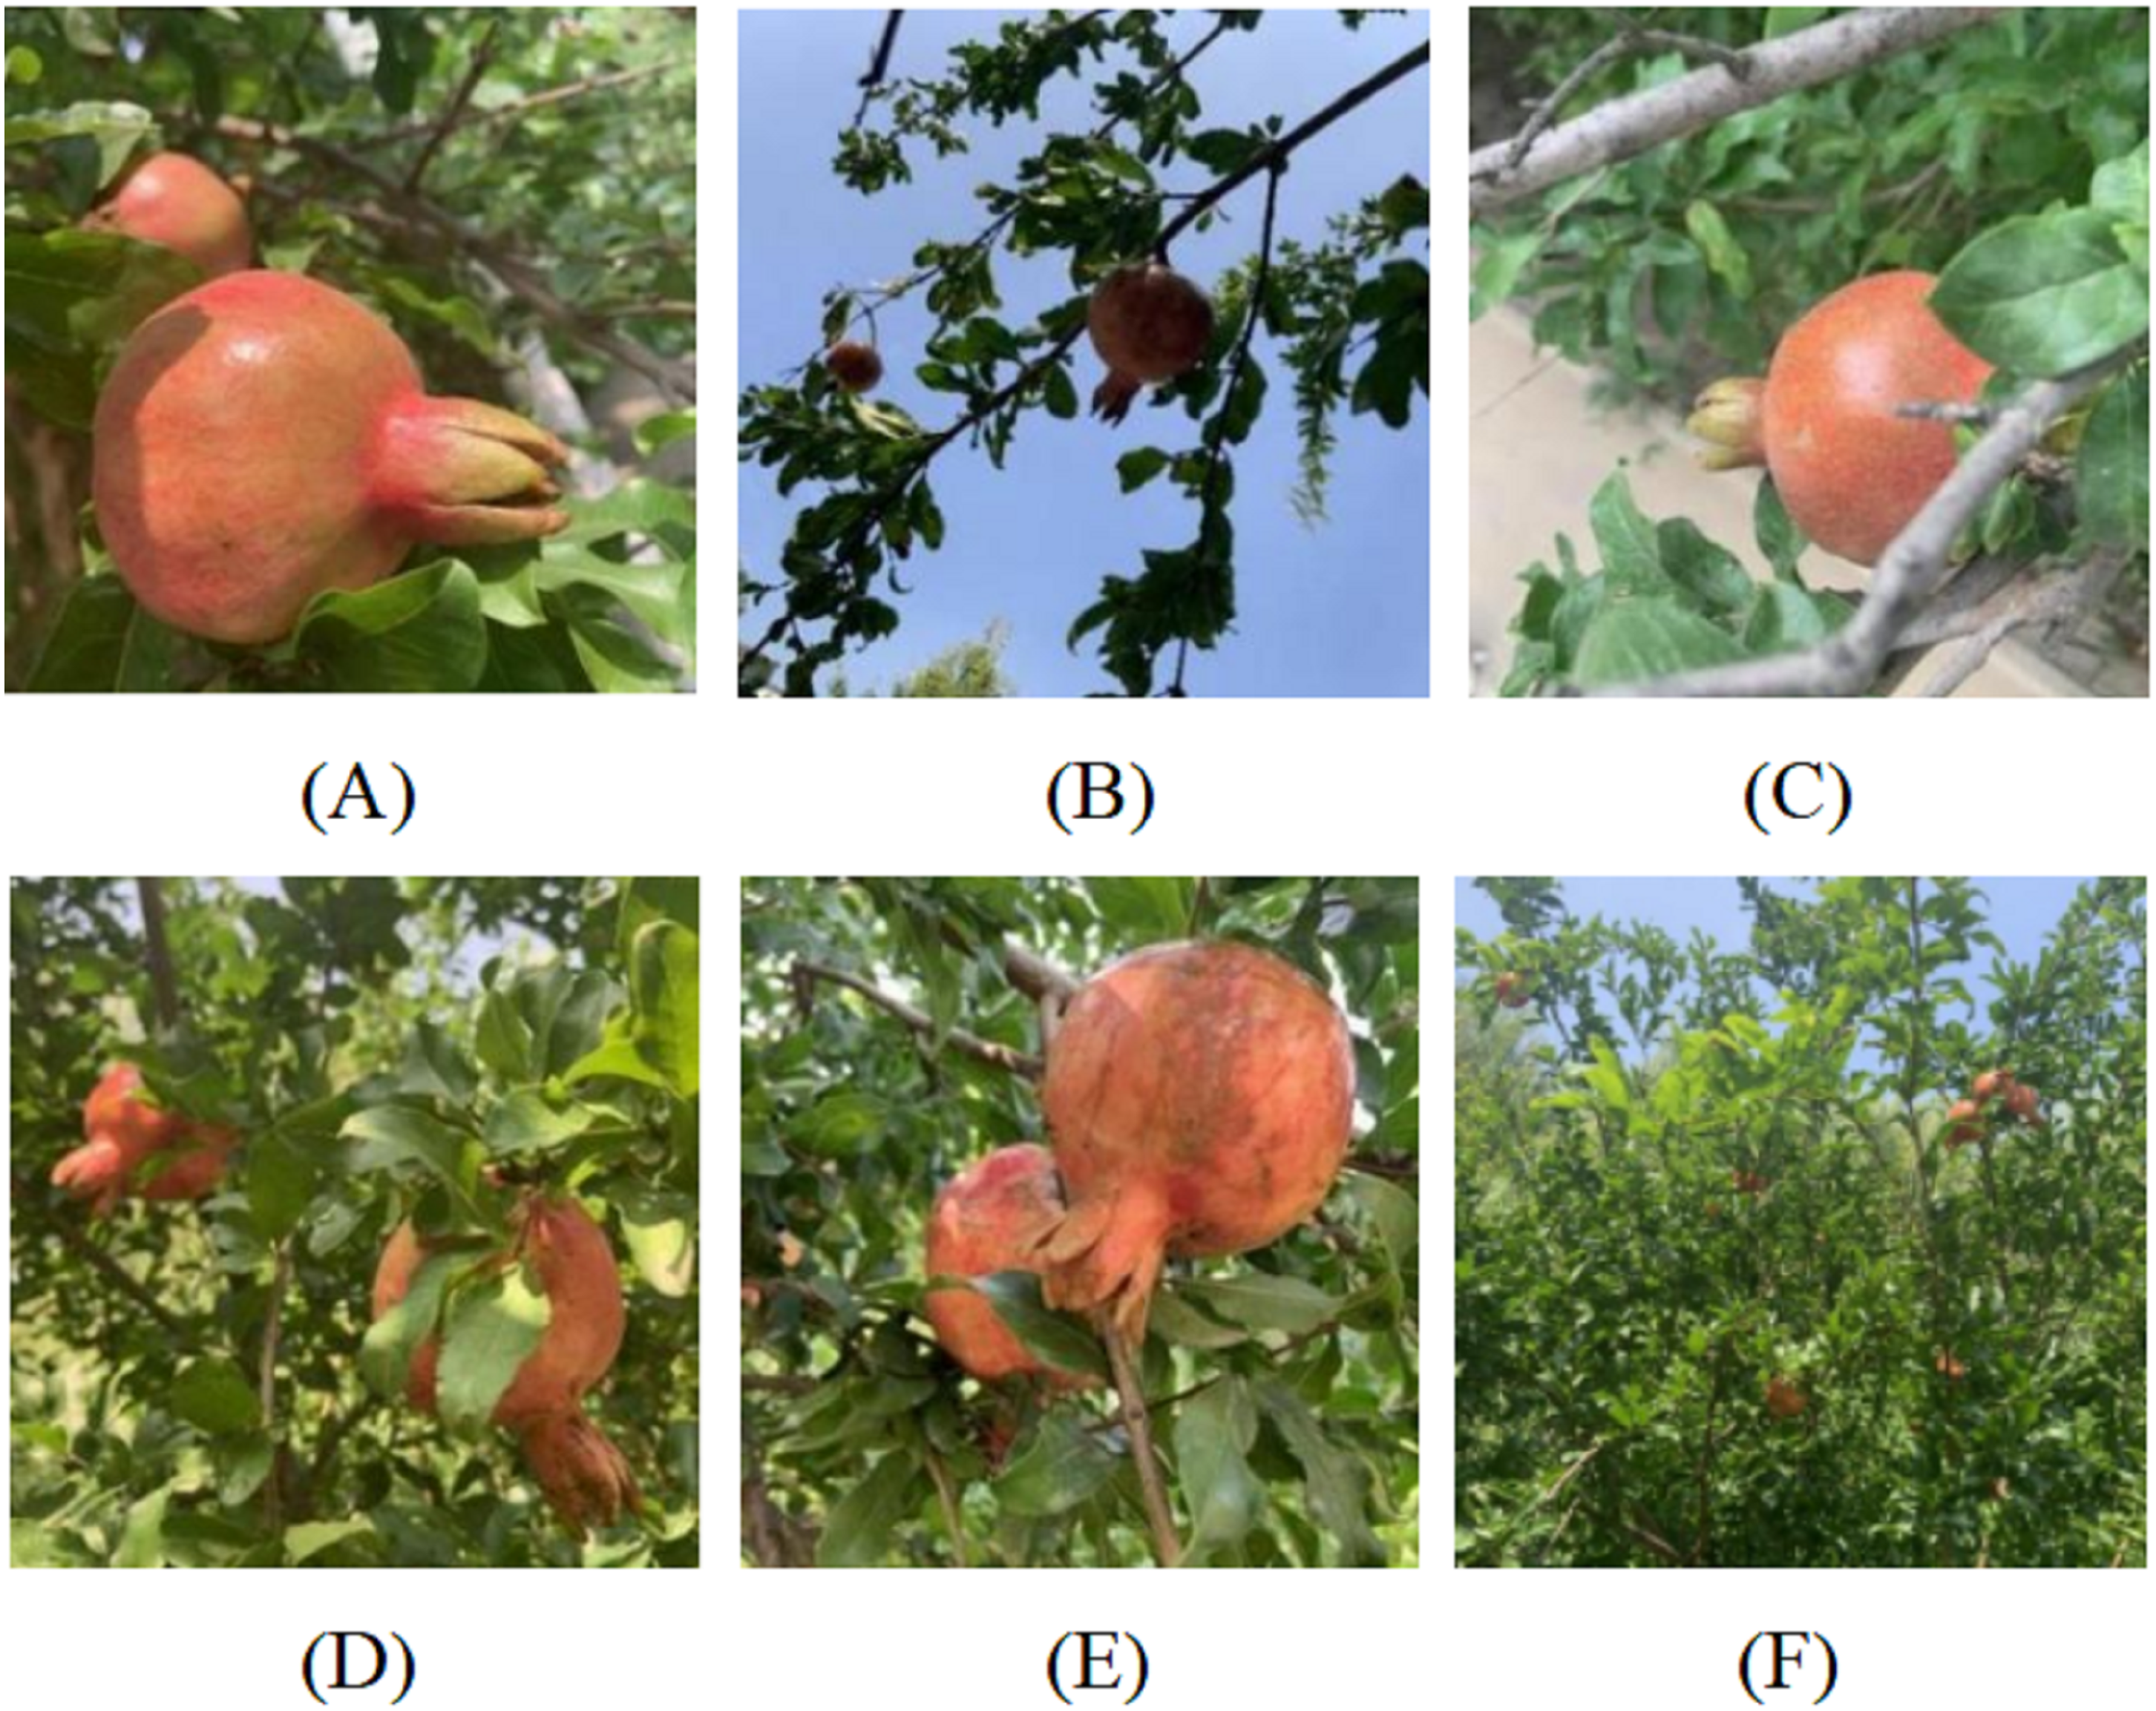
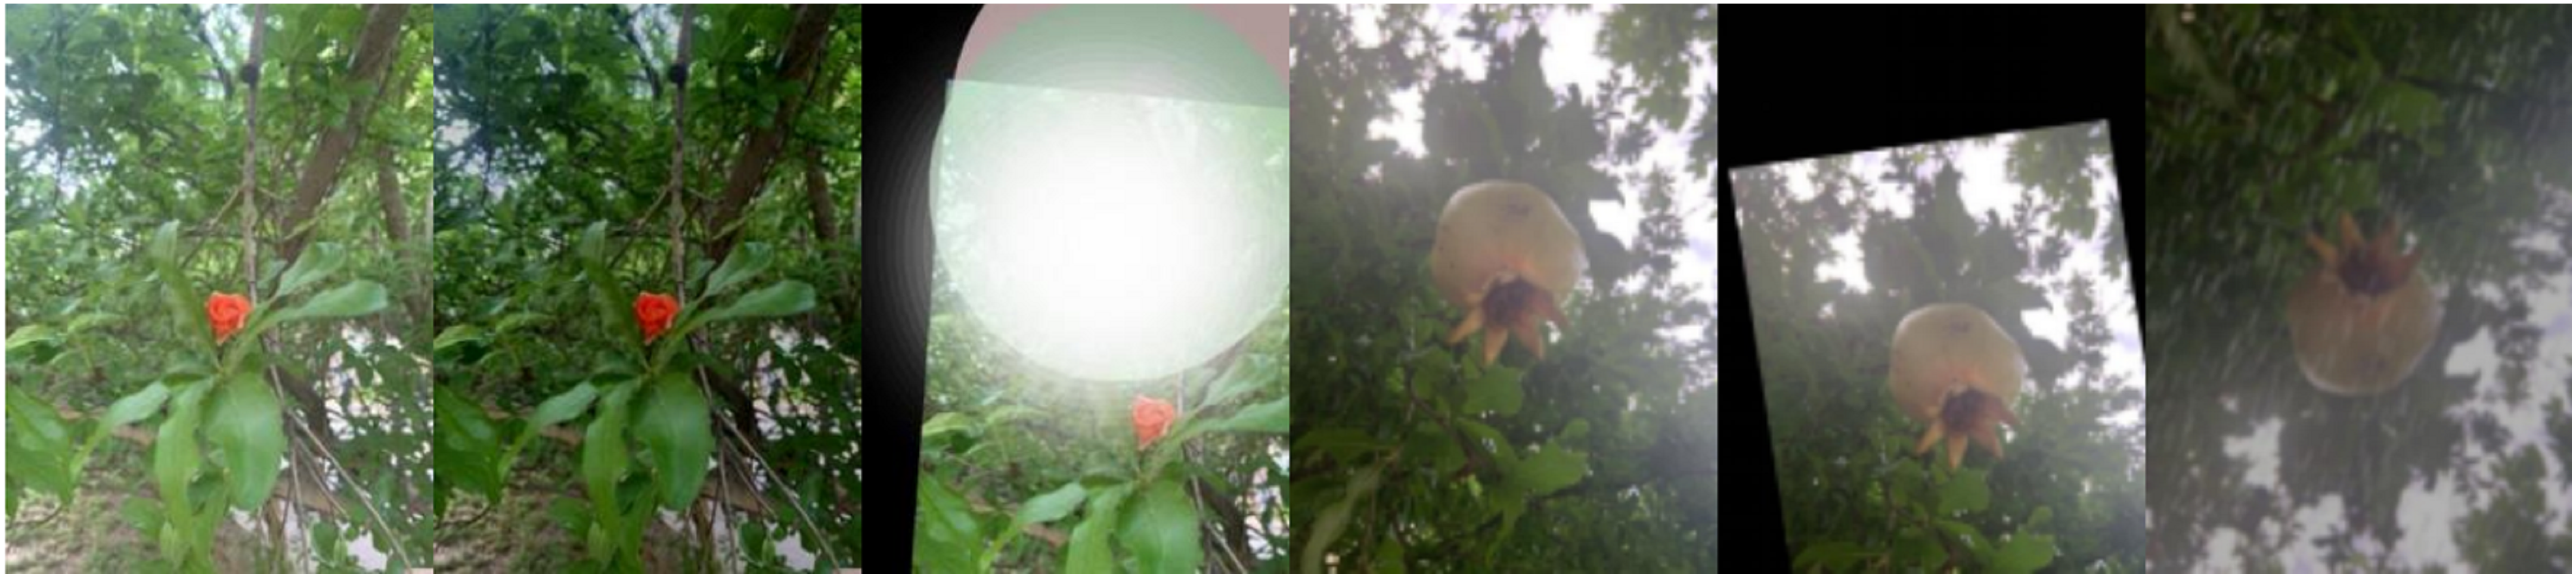
Although the dataset contains a rich variety of pomegranate fruit image features, it remains insufficient to encompass the full range of characteristics encountered in natural scenarios. To increase sample diversity and alleviate the risk of overfitting, this experiment employs the Albumentations library (Buslaev et al., 2020) to conduct offline data augmentation. A range of techniques is applied, including Affine (radial transform), Flip (horizontal, vertical, and diagonal), GaussNoise, RandomBrightnessContrast, RandomFog, RandomRain, RandomShadow, and lRandomSunFlare. These methods are designed to simulate complex real-world conditions such as lighting variations, occlusions, blurring, and weather changes, hence strengthening the mode’s robustness. To prevent data leakage and ensure consistency in data distribution, the aforementioned augmentation techniques are applied exclusively to the training set. This results in an expanded training set comprising 11,796 images, while the validation and test sets remain unchanged. Representative examples of the augmented images are shown in Fig. 11.
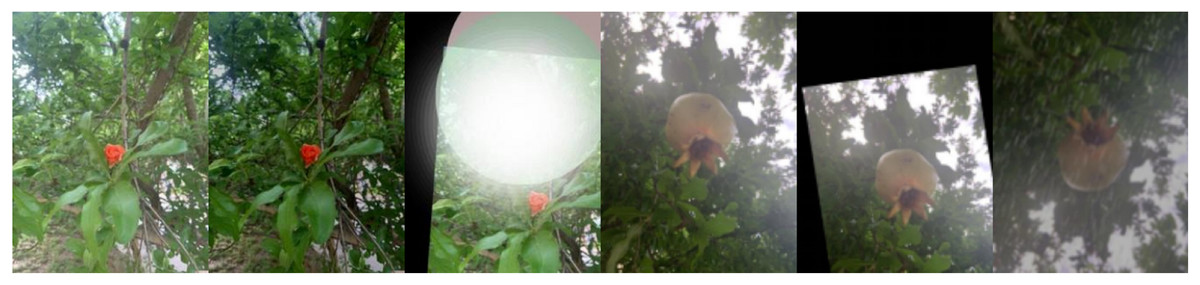
Figure 11: Pomegranate images dataset enhancement effect.
Generalised dataset Apple Object Detection Dataset
To further evaluate the generalisation capability of the model, additional experiments are conducted using the publicly available Apple Object Detection Dataset (Zhao, 2024). This dataset comprises 2,000 JPEG images of red Fuji apples captured in orchard environments, encompassing various natural conditions such as strong lighting, backlighting, branch, leaf, and fruit occlusions, as well as long-distance observations. Representative samples are presented in Fig. 12. To expand the dataset and improve model robustness, several data augmentation techniques are applied, including flipping, rotation, Gaussian blurring, shrinking, and the addition of Gaussian noise. The final dataset contains 6,179 images, which are divided into training, validation, and test sets using an 8:1:1 ratio. Specifically, the training set consists of 5,052 images, while both the validation and test sets contain 564 images each.
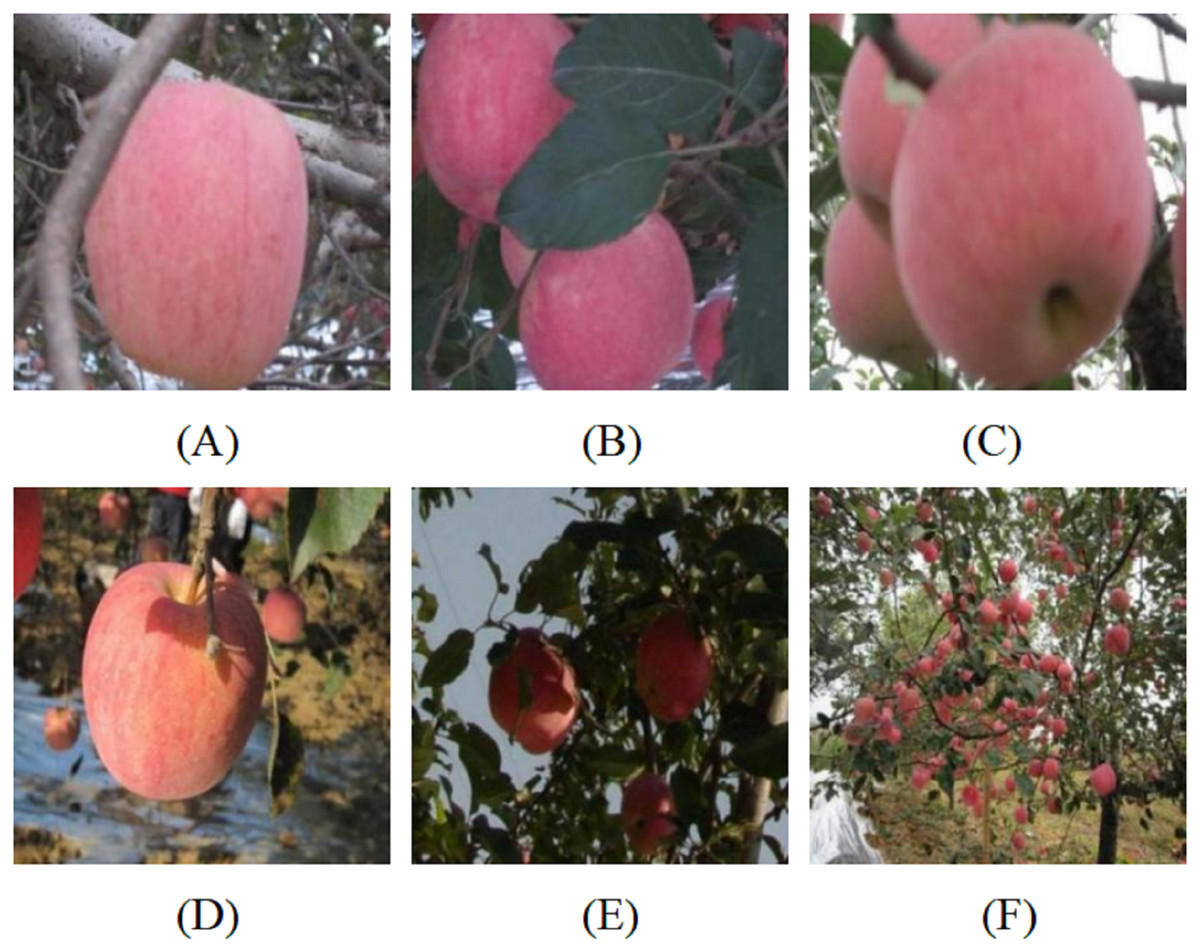
Figure 12: Different background images in the Apple Object Detection Dataset.
(A) Branch occlusion.(B) Leaf occlusion.(C) Fruit occlusion. (D) Strong light. (E) Backlight. (F) Long-distance.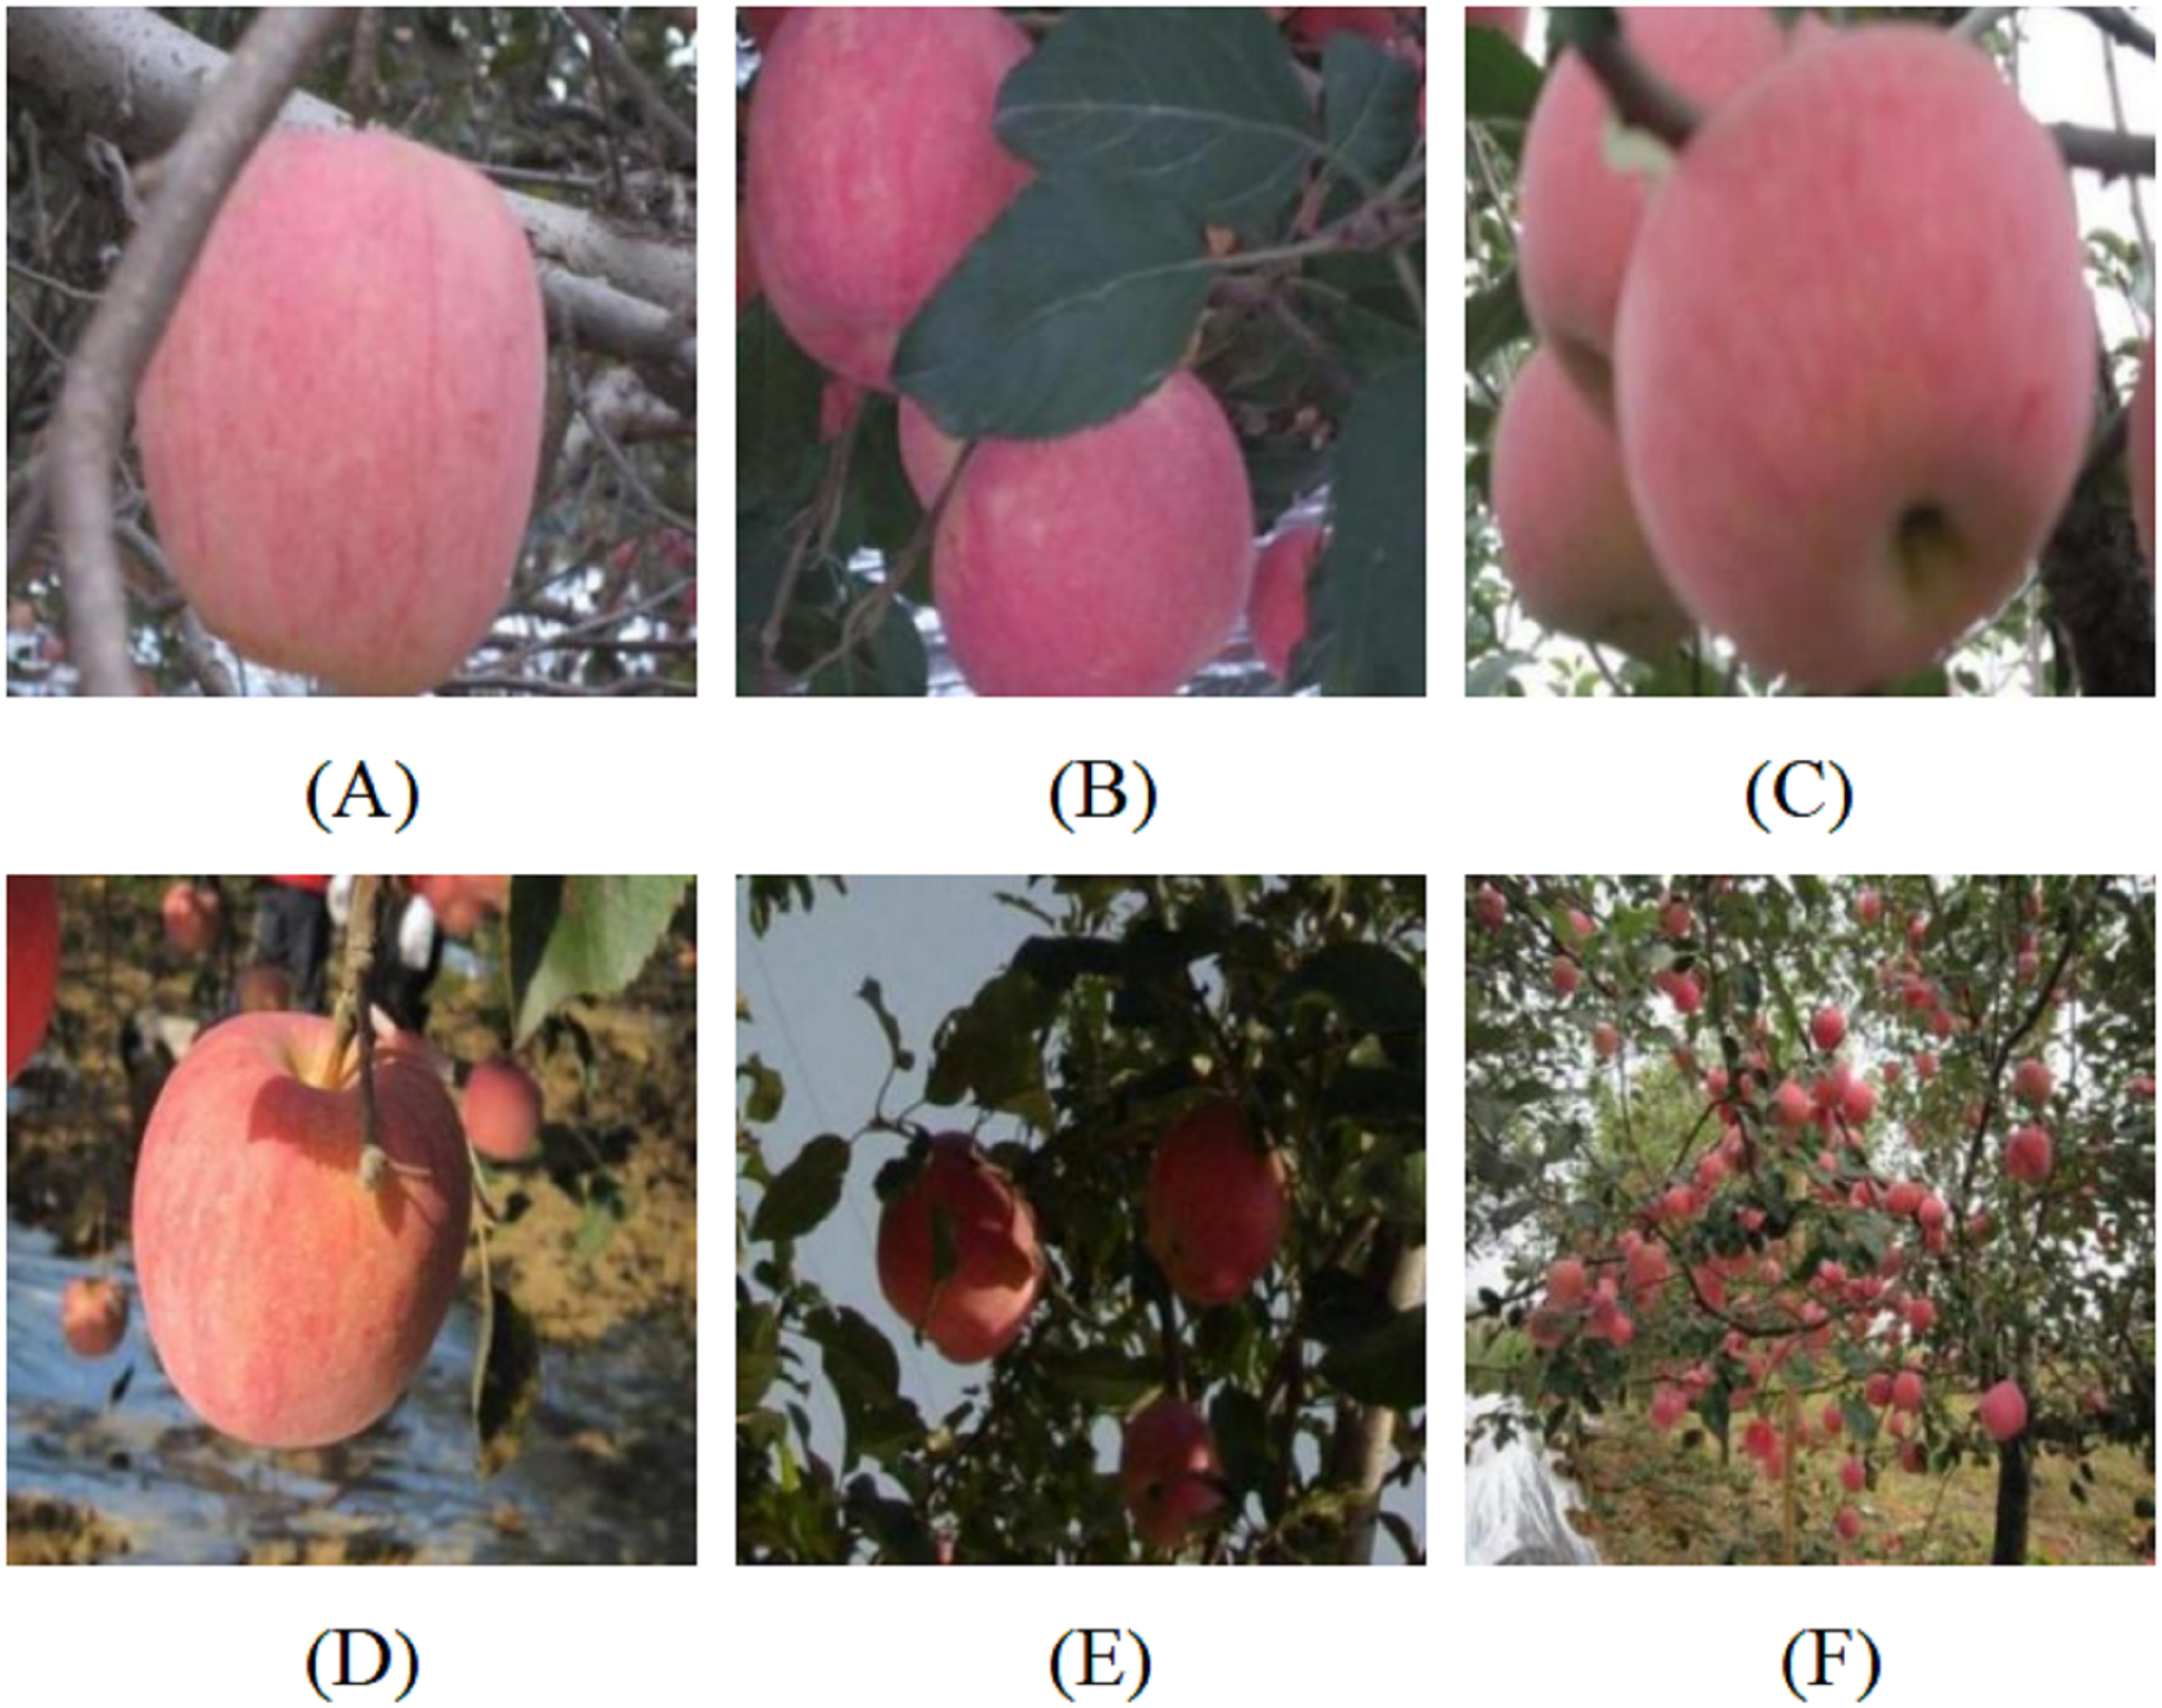
Generalised dataset PASCAL VOC 2007
The PASCAL VOC 2007 dataset (ZARAK, 2017) is a well-established benchmark in the field of object detection, commonly used to benchmark a model’s effectiveness and generalisation capability. It comprises 9,950 images depicting a range of real-world scenarios and covering 20 diverse object categories, including aeroplane, bicycle, bird, boat, bottle, bus, car, cat, chair, cow, diningtable, dog, horse, motorbike, person, pottedplant, sheep, sofa, train, and tvmonitor. To further assess the proposed model’s performance across diverse detection tasks, this study additionally employs the PASCAL VOC 2007 dataset as a generalisation benchmark. The experimental data are divided into training, validation, and test sets using a 7:1:2 ratio.
Evaluation metrics
To evaluate the detection accuracy of the proposed model, this study employs precision (P), recall (R), and mAP as the performance metrics for assessing the effectiveness of the PGLD-YOLO algorithm. Using pomegranate samples as an example, precision refers to the proportion of correctly classified pomegranate fruits among all predicted instances; a higher precision value indicates a lower false detection rate. Recall denotes the proportion of actual pomegranate fruits that are successfully detected and labelled by the model; a higher recall value reflects fewer missed detections. The corresponding calculation formulas are presented in Eqs. (12) and (13):
(12)
(13)
In Eq. (12), P denotes precision, where TP refers to the number of samples correctly predicted by the model as positive, and FP indicates the number of samples incorrectly predicted as positive. In Eq. (13), R denotes recall, where FN represents the number of samples incorrectly predicted by the model as negative.
The mAP refers to the average of the average precision (AP) values across all categories and serves to evaluate the overall performance of the model. It is computed as the area under the precision-recall curve for each category, reflecting the trade-off between precision and recall. In the context of pomegranate fruit detection, the AP for each class is calculated and subsequently averaged to obtain the mAP, as shown in Eqs. (14) and (15):
(14)
(15)
To meet the deployment requirements of edge devices, this study adopts three commonly used metrics to evaluate the lightweight characteristics of the model: model size (Size), number of parameters (Params), and total floating-point operations (FLOPs). The number of parameters reflects the quantity of parameters requiring training in the model, while the model size refers to the final weight file’s storage footprint. A reduction in either metric typically indicates a more lightweight model architecture, making it better suited for resource-limited environments. FLOPs are employed to assess the computational overhead during inference. Lower FLOPs suggest decreased reliance on computational resources, enhancing the model’s suitability for deployment on edge devices such as picking robots.
Analysis of experimental results
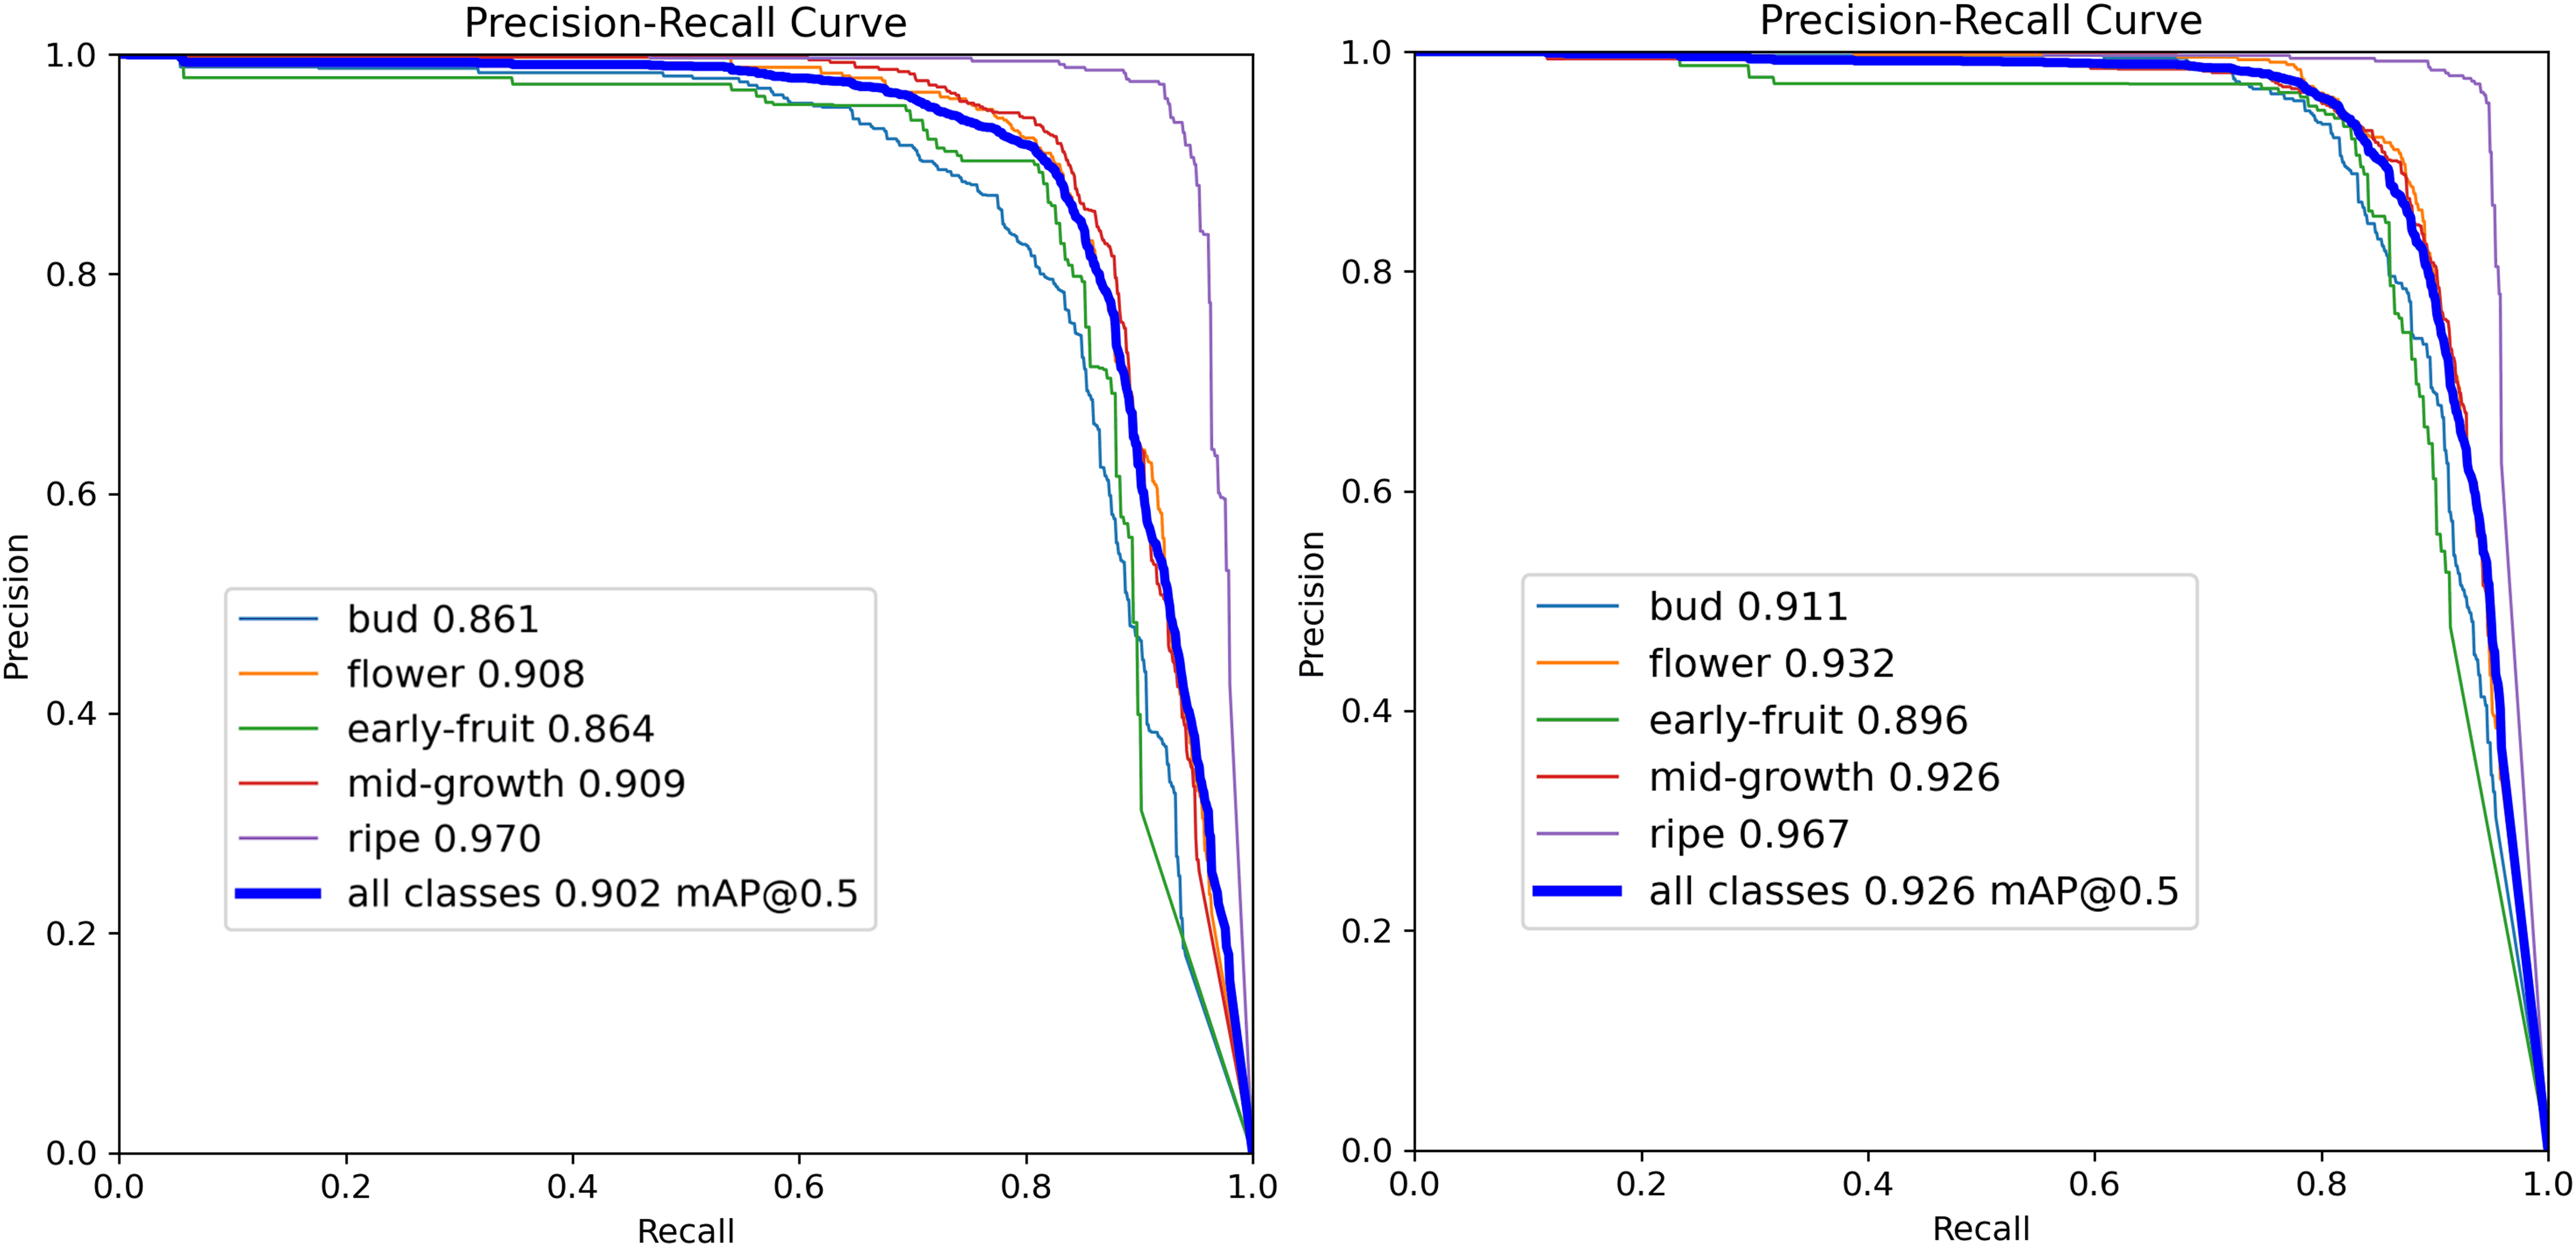
To verify the efficacy of the proposed improvements, this experiment maintains consistent settings to train and evaluate YOLOv10s and PGLD-YOLO separately on the Pomegranate Images Dataset. Figure 13 illustrates a comparison of the P-R curves for the original YOLOv10s and the enhanced PGLD-YOLO in detecting pomegranate fruits across five developmental stages. A larger area under the curve indicates greater detection performance. As shown in Fig. 13, except for the “Ripe” category—where the detection precision remains consistent with that of the original YOLOv10s—the enhanced model shows improved detection accuracy across the other four categories to varying extents. In addition, the mAP of the enhanced model reaches 92.6%, representing a 2% increase over the baseline. These results indicate that PGLD-YOLO effectively augments the accuracy of pomegranate fruit recognition.
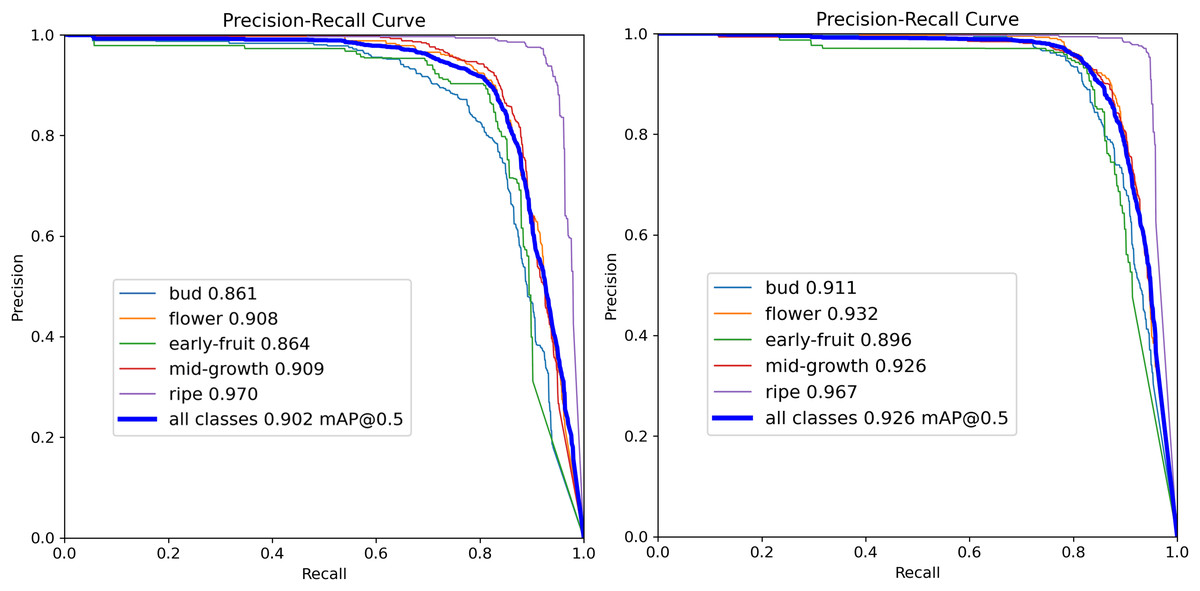
Figure 13: Comparison of P-R curves of YOLOv10s and PGLD-YOLO.
Table 3 presents the precision, recall, and mAP of PGLD-YOLO across five developmental categories and overall pomegranate fruit detection. The [email protected] achieved by the model for “Bud”, “Flower”, “Early-fruit”, “Mid-growth”, and “Ripe” categories is 91.1%, 93.2%, 89.6%, 92.6%, and 96.7%, respectively. Both precision and recall reach commendable levels, with values as high as 97.1%. Notably, the enhanced PGLD-YOLO achieves a precision of 97.1% and an mAP of 96.7% in detecting fruits at the ripe stage. These results suggest that the improved model precisely identifies pomegranate fruits at different stages of development and reliably determines their ripeness, thus supporting the mechanical harvesting of mature fruits.
| Class | Numbers | Precision (%) | Recall (%) | mAP (%) |
|---|---|---|---|---|
| All | 1172 | 92.3 | 85.8 | 92.6 |
| Bud | 312 | 92.2 | 81 | 91.1 |
| Flower | 362 | 91.5 | 86.1 | 93.2 |
| Early-fruit | 180 | 88.8 | 83.8 | 89.6 |
| Mid-growth | 309 | 92.1 | 84.5 | 92.6 |
| Ripe | 221 | 97.1 | 93.5 | 96.7 |
To further validate the efficacy of the proposed model, this study selects the metrics of precision, recall, mAP, Params, Size (MB), and FLOPs (G) to compare the original YOLOv10s with the enhanced PGLD-YOLO. The results are presented in Table 4. As shown in Table 4, the precision and recall of PGLD-YOLO exceed those of the baseline model by 0.9% and 2.8%, respectively, with an mAP improvement of 2%. The parameter count is 4.7M, representing a reduction of 34.7% compared to the original model. The model size is 9.9 MB, reflecting a decrease of 40.4%, while the FLOPs are lowered by 35.5%. The best-performing metrics are highlighted in bold. These results reveal that the enhanced model markedly optimises detection precision, recall, and mAP while notably reducing model complexity. As a result, it offers a lightweight solution for pomegranate fruit detection, particularly appropriate for deployment on edge devices to facilitate pomegranate fruit localisation and recognition.
| Model | Precision (%) | Recall (%) | mAP (%) | Params (M) | Size (MB) | FLOPs (G) |
|---|---|---|---|---|---|---|
| YOLOv10s | 91.4 | 83 | 90.6 | 7.2 | 16.6 | 21.4 |
| PGLD-YOLO | 92.3 | 85.8 | 92.6 | 4.7 | 9.9 | 13.8 |
Ablation experiments
This section adopts the YOLOv10s model as the baseline and incorporates the enhancements proposed in this study to conduct ablation experiments on the Pomegranate Images Dataset. These experiments aim to validate the validity of the ShuffleNetV2 backbone, the C2f_LEMA module, and the GNSH module in enhancing pomegranate fruit detection and diminishing model complexity. The findings of the ablation experiments are summarised in Table 5, where a “√” indicates that the corresponding component is applied.
| Model | YOLOv10s | ShuffleNetv2 | C2f_LEMA | GNSH | Recall (%) | mAP (%) | Params (M) | Size (MB) | FLOPs (G) |
|---|---|---|---|---|---|---|---|---|---|
| Model 1 | √ | 83 | 90.6 | 7.2 | 16.6 | 21.4 | |||
| Model 2 | √ | √ | 84 | 92 | 5.6 | 13.3 | 13.3 | ||
| Model 3 | √ | √ | 84.4 | 92.1 | 6.7 | 15.6 | 19.5 | ||
| Model 4 | √ | √ | 85.0 | 91.8 | 6.8 | 14.0 | 23.9 | ||
| Model 5 | √ | √ | √ | 85.3 | 92.8 | 5.1 | 12.4 | 11.3 | |
| Model 6 | √ | √ | √ | √ | 85.8 | 92.6 | 4.7 | 9.9 | 13.8 |
Table 5 indicates that Model 1 corresponds to YOLOv10s and serves as the baseline for subsequent examinations. Model 2 builds upon the original backbone by integrating multiple ShuffleNetV2 basic units. The enhanced model achieves a diminution in parameter count by 1.6M, model size by 3.3 MB, and FLOPs by 8.1G, while recall and mAP increase by 1% and 1.4%, respectively. This illustrates that the ShuffleNetV2 architecture, which employs grouped convolutions and channel reorganisation mechanisms, enhances feature extraction capabilities while effectively lessening computational complexity and memory access requirements. Model 3 replaces the C2f module in the neck with the C2f_LEMA module, resulting in an increase of 1.4% in recall and 1.5% in mAP in comparison with the baseline. This suggests that the integration of the EMA mechanism enables the model to focus more effectively on the features of pomegranate fruits while minimising the influence of background factors, thus enhancing detection accuracy. Furthermore, the model size, parameter count, and computational complexity are all curtailed, indicating that the introduction of PConv significantly lessens both model parameters and computational overhead. Model 4 applies the GNSH detection head in isolation. Following this modification, the recall increases by 2% and the mAP by 1.2%, along with diminutions in both model parameters and size. These findings indicate that shared convolution effectively decreases the model size, while the use of GN substantially enhances the model’s capability to localise and detect pomegranate fruits.
Model 5 incorporates both the ShuffleNetv2 and C2f_LEMA modules, resulting in an increase in mAP to 92.8% and a rise in recall to 85.3%. This indicates that the combination of the two modules significantly enhances the detection performance for pomegranate fruits, enhancing the model’s robustness. Model 6 integrates all three modules, achieving a recall of 85.8%. Simultaneously, the parameter count is diminished to 4.7M, representing a 34.7% curtailment relative to Model 1. The model size is reduced to 9.9 MB, and the FLOPs are 13.8G. The experimental outcomes indicate that each enhancement yields positive effects, satisfying both the accuracy requirements for pomegranate localisation and recognition, and the deployment constraints for edge devices.
Performance comparison of different algorithms
Performance comparison of mainstream object detection algorithms
To evaluate the effectiveness and generalisation capacity of the proposed PGLD-YOLO algorithm, comparative experiments are conducted on the Pomegranate, Apple Object Detection, and VOC2007 datasets against several representative models. These include the two-stage detector Faster R-CNN (Ren et al., 2016); mainstream one-stage detectors such as SSD (Liu et al., 2016), RT-DETR (Zhao et al., 2024), YOLOv5, YOLOv7, YOLOv8, YOLOv10, and YOLOv11; as well as lightweight detection models including EfficientDet-D0/D1 (Tan, Pang & Le, 2020) and MobileNetV3-SSD (Howard et al., 2019). The experimental findings are presented in Tables 6, 7, and 8.
| Model | Recall (%) | mAP (%) | Params (M) | Size (MB) | FLOPs (G) |
|---|---|---|---|---|---|
| Faster R-CNN | 63.9 | 61.4 | 136.8 | 521.7 | 401.8 |
| SSD | 86.7 | 92.8 | 24.1 | 92.1 | 274.9 |
| RT-DETR | 85.5 | 91.3 | 41.9 | 86.1 | 129.6 |
| YOLOv5 | 84.1 | 91.4 | 9.1 | 18.5 | 23.8 |
| YOLOv7 | 89.1 | 94.1 | 36.5 | 74.8 | 103.2 |
| YOLOv8 | 84.6 | 91.6 | 11.1 | 22.5 | 28.4 |
| YOLOv10 | 83 | 90.6 | 7.2 | 16.6 | 21.4 |
| YOLOv11 | 84.1 | 91.8 | 9.4 | 19.2 | 21.3 |
| EfficientDet-D0 | 75.5 | 71.9 | 3.8 | 15.0 | 3.7 |
| EfficientDet-D1 | 79.1 | 74.8 | 6.6 | 25.6 | 5.8 |
| MobileNetV3-SSD | 70.6 | 52.0 | 2.7 | 10.5 | 0.3 |
| PGLD-YOLO | 85.8 | 92.6 | 4.7 | 9.9 | 13.8 |
| Model | mAP (%) | Params (M) | Size (MB) | FLOPs (G) |
|---|---|---|---|---|
| Faster R-CNN | 58.2 | 136.7 | 521.4 | 401.7 |
| SSD | 86.9 | 23.6 | 90.1 | 273.2 |
| RT-DETR | 89.3 | 41.9 | 86.1 | 129.5 |
| YOLOv5 | 88.5 | 9.1 | 18.6 | 23.8 |
| YOLOv7 | 90.3 | 36.5 | 74.8 | 103.2 |
| YOLOv8 | 88.9 | 11.1 | 22.5 | 28.4 |
| YOLOv10 | 88.9 | 7.2 | 16.6 | 21.4 |
| YOLOv11 | 88.8 | 9.4 | 21.3 | 19.2 |
| EfficientDet-D0 | 71.2 | 3.8 | 15.0 | 3.7 |
| EfficientDet-D1 | 76.8 | 6.6 | 25.6 | 5.8 |
| MobileNetV3-SSD | 46.0 | 2.7 | 10.5 | 0.3 |
| PGLD-YOLO | 89 | 4.7 | 9.9 | 13.8 |
| Model | mAP (%) | Params (M) | Size (MB) | FLOPs (G) |
|---|---|---|---|---|
| Faster RCNN | 66.4 | 136.7 | 521.4 | 401.7 |
| SSD | 60.2 | 23.6 | 90.1 | 273.2 |
| RT-DETR | 69.9 | 41.9 | 86.1 | 129.6 |
| YOLOv5 | 70.6 | 9.1 | 18.6 | 23.8 |
| YOLOv8 | 71.5 | 11.1 | 22.5 | 28.4 |
| YOLOv10 | 71.0 | 7.2 | 16.6 | 21.4 |
| YOLOv11 | 71.4 | 9.4 | 21.3 | 19.2 |
| PGLD-YOLO | 71.3 | 4.7 | 9.9 | 13.8 |
Table 6 shows that the proposed PGLD-YOLO exhibits better performance regarding model parameter count, size, and computational complexity in comparison to previous object detection algorithms. The two-stage object detection algorithm Faster R-CNN has substantially higher parameter counts, model size, and FLOPs, making it challenging to deploy effectively on resource-constrained edge devices due to its large computational complexity and memory requirements. Relative to the popular single-stage object detection algorithms SSD, RT-DETR, YOLOv5, YOLOv7, YOLOv8, YOLOv10, and YOLOv11, the PGLD-YOLO attains a parameter number of merely 4.7M, a model size of only 9.9 MB, and FLOPs of only 13.8G, indicating that it achieves the best results for all three complexity metrics. In addition, when in comparison with RT-DETR, YOLOv5, YOLOv8, YOLOv10, and YOLOv11, PGLD-YOLO records higher recall values of 0.3%, 1.7%, 1.2%, 2.8%, and 1.7%, respectively, and higher mAP values of 1.3%, 1.2%, 1.0%, 2.0%, and 0.8%, respectively. These results suggest PGLD-YOLO has better detection performance at lower missed detection rates, accurate and efficient localisation of pomegranate fruits, and classification of ripeness levels in an orchard setting.
Although the recall and mAP values of PGLD-YOLO are lower than those of the SSD and YOLOv7 algorithms, its parameter count is reduced by 80.5% and 87.1% respectively, with model size decreases by 82.2 and 64.9 MB, and FLOPs lessened by 261.1G and 89.4G, respectively. Conversely, although the EfficientDet-D0/D1 and MobileNetV3-SSD algorithms offer advantages in terms of parameter count, model size, and FLOPs, their mAP values—71.9%, 74.8%, and 52.0%, respectively—are insufficient to meet the high-precision requirements of pomegranate fruit detection. Overall, these results indicate that the PGLD-YOLO algorithm surpasses other mainstream object detection methods in terms of overall performance. It accurately assesses fruit maturity under natural backgrounds, achieves precise localisation and recognition of pomegranate fruits, effectively minimises missed detections and model complexity, and is therefore well-suited for application and deployment in embedded devices such as pomegranate harvesting robots.
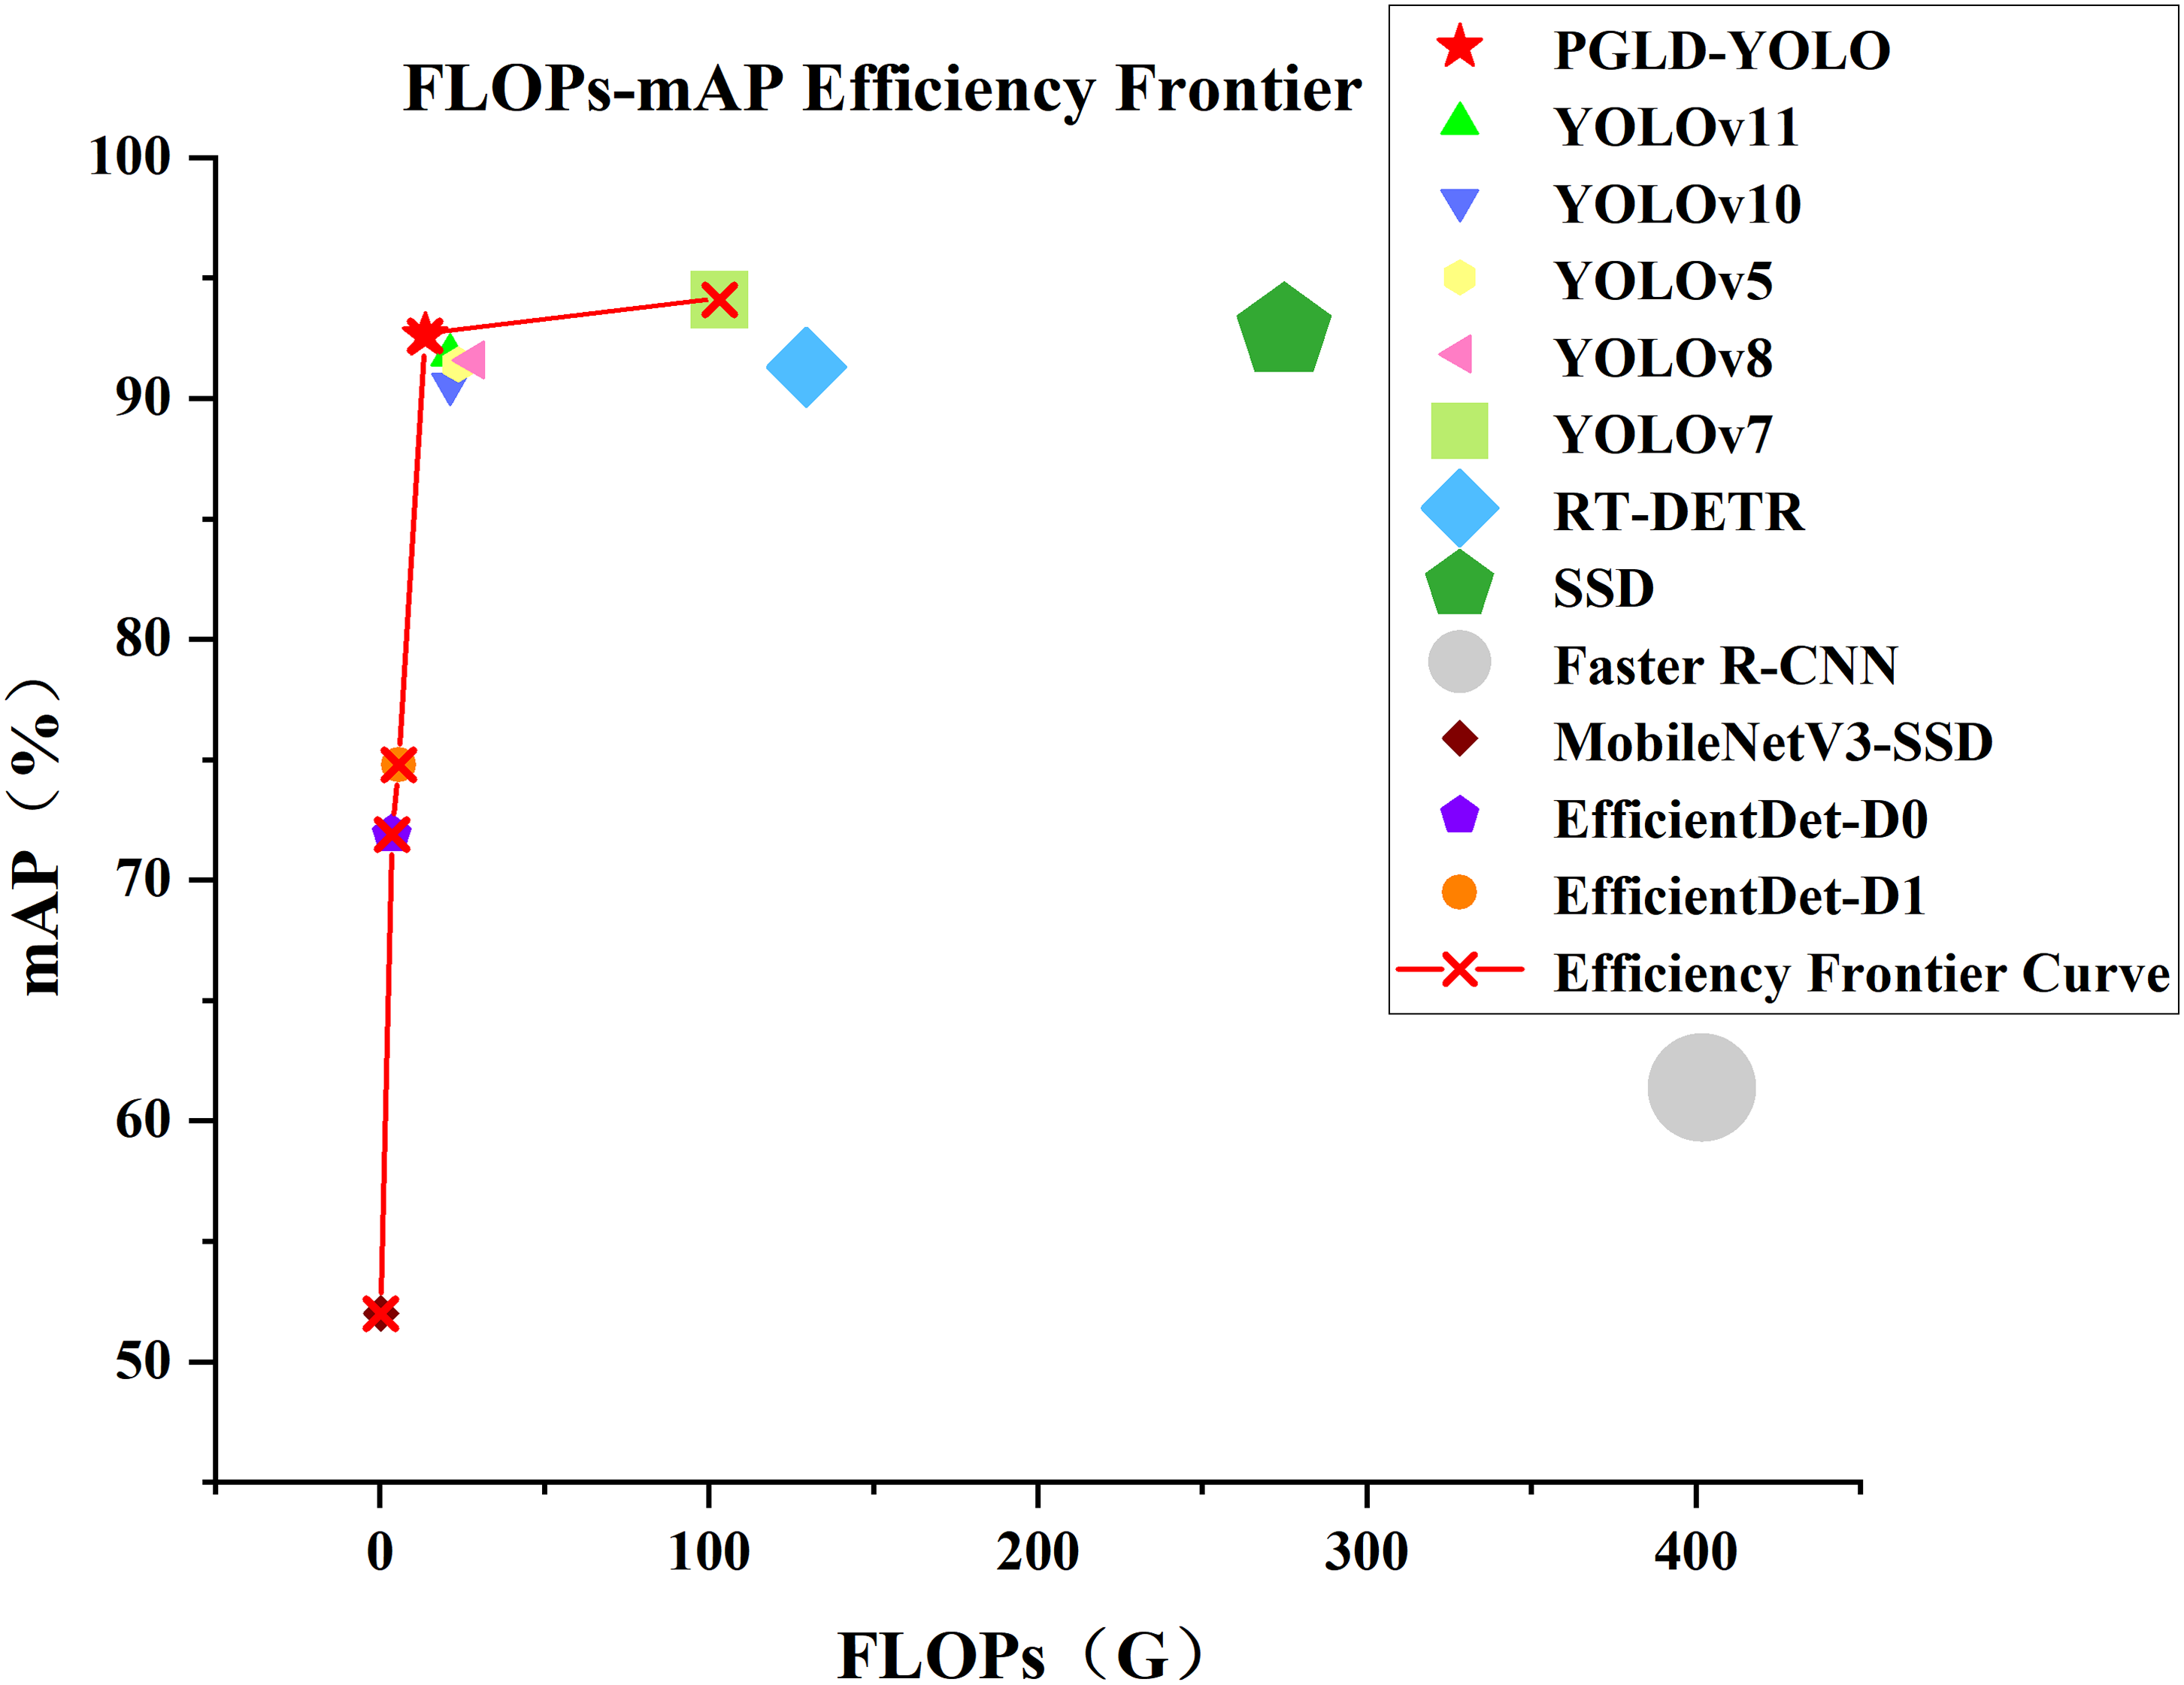
Figure 14 shows the FLOPs-mAP efficiency frontier of PGLD-YOLO relative to other mainstream object detection techniques. The size of each label in the figure corresponds to the model’s FLOPs value, with larger regions signifying higher FLOPs. The red line denotes the efficiency frontier curve, connecting points on the Pareto frontier, where no other model achieves a higher mAP under the same or lower FLOPs conditions. This signifies that these models attain the optimal balance between performance and resource consumption. As shown in Fig. 14, the PGLD-YOLO algorithm lies on the efficiency frontier curve, further substantiating the superiority and effectiveness of the proposed model in balancing accuracy and computational efficiency.
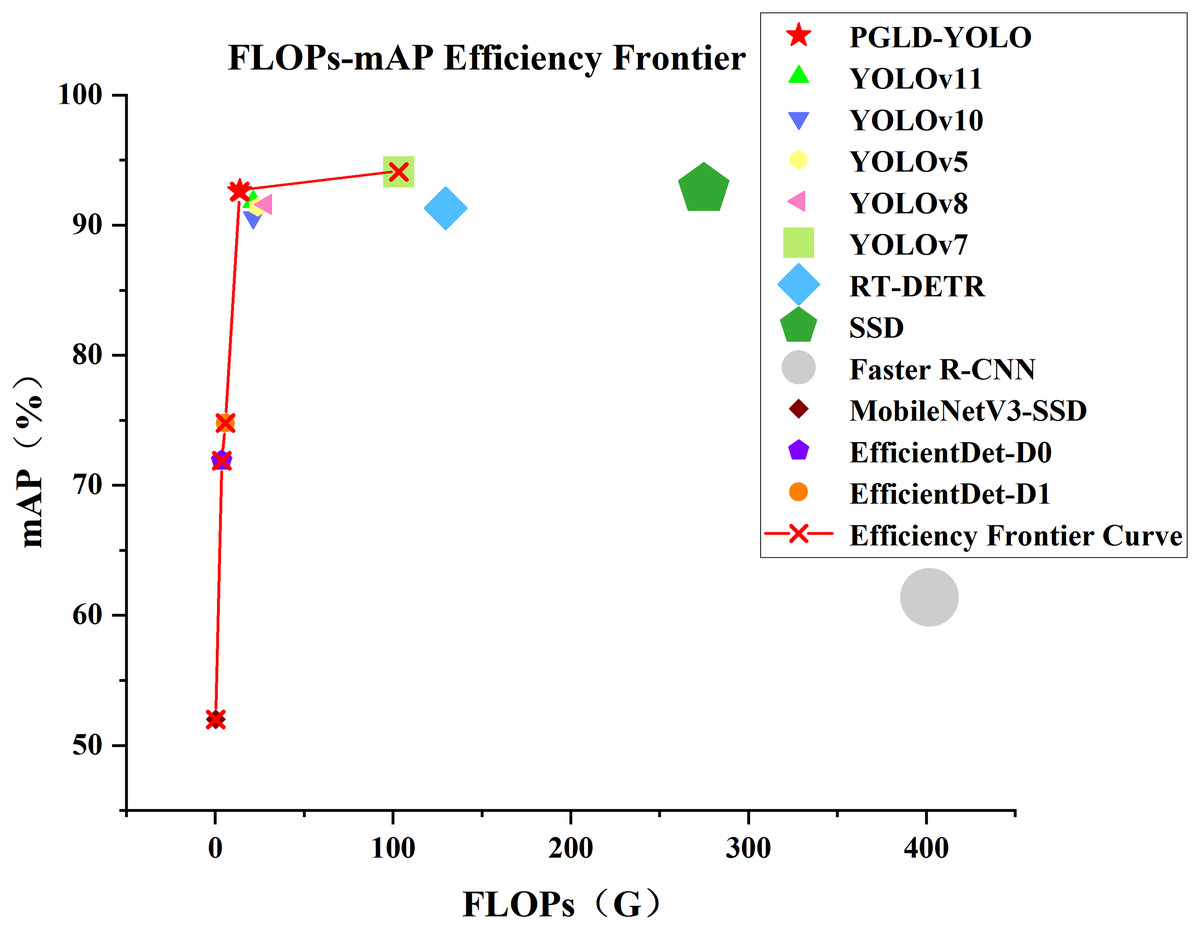
Figure 14: Efficiency frontiers of various object detection models.
Tables 7 and 8 show that the PGLD-YOLO proposed in this study achieves a slight enhancement in mAP relative to the YOLOv10s algorithm on the Apple Object Detection and VOC2007 generalisation datasets, despite substantial diminutions in parameter count, model size, and FLOPs. The findings in Table 8 show that PGLD-YOLO outperforms the other detection methods across three key metrics. Although the parameters and FLOPs of PGLD-YOLO in Table 7 exceed those of EfficientDet-D0/D1 and MobileNetV3-SSD, its mAP is significantly higher, indicating that PGLD-YOLO achieves an effective balance between detection accuracy and a lightweight design. These findings further confirm that the lightweight strategy introduced in this study maintains strong performance in both intra-domain fruit detection and cross-domain object detection, highlighting considerable generalisation capability.
Performance comparison of fruit recognition detection algorithms
To further assess the practical utility and application value of the PGLD-YOLO algorithm in the fruit detection tasks, this experiment compares it with several existing fruit detection models. These include CA-YOLOv5 (Yang et al., 2024) and AD-2023 (Kong et al., 2024) for apple detection; YOLOv7-plum (Tang et al., 2023a) for plum detection; YOLO-Jujube (Xu et al., 2023) for jujube detection; YOLOv7-Peach (Liu & Yin, 2023) for peach detection; DSW-YOLO (Du et al., 2023) for strawberry detection; YOLOv7-CBAM (Wang et al., 2023a) for tomato detection; HAT-YOLOV8 (Tang, Yu & Shao, 2025) for fruit ripeness detection; and SCD-YOLOv5s (Zhou et al., 2025) for passion fruit detection. The comparative outcomes are presented in Table 9.
| Model | Recall (%) | mAP (%) | Params (M) | Size (MB) | FLOPs (G) |
|---|---|---|---|---|---|
| CA-YOLOv5 | 82.7 | 89.8 | 7.8 | – | 16.6 |
| AD-2023 | – | 94.1 | 43.96 | – | 93.6 |
| YOLOv7-plum | 93.2 | 94.9 | – | 71.4 | – |
| YOLO-Jujube | 81.7 | 88.8 | 5.2 | – | 11.7 |
| YOLOv7-Peach | 73 | 80.4 | – | 51.9 | – |
| DSW-YOLO | 82.1 | 86.7 | 32.4 | – | 99.5 |
| YOLOv7-CBAM | – | 87.8 | 36.58 | – | 103.8 |
| HAT-YOLOV8 | – | 88.9 | – | 35.7 | – |
| SCD-YOLOv5s | 84.7 | 88.4 | – | 12.6 | 14.3 |
| PGLD-YOLO | 85.8 | 92.6 | 4.7 | 9.9 | 13.8 |
In Table 9, compared with the algorithms proposed in previous studies (Yang et al., 2024; Xu et al., 2023; Liu & Yin, 2023; Du et al., 2023; Wang et al., 2023a; Tang, Yu & Shao, 2025; Zhou et al., 2025), PGLD-YOLO exhibits significant advantages in terms of model parameters, model size, and FLOPs, while also achieving improvements in detection precision and recall to varying degrees. These findings suggest that the model proposed in this study shows lower missed and false detection rates for pomegranate fruits under natural conditions and provides superior performance in both detection accuracy and computational efficiency. Compared with AD-2023 and YOLOv7-plum, although the PGLD-YOLO algorithm achieves a slightly lower mAP, it substantially reduces the parameter count, model size, and FLOPs. This suggests that the proposed PGLD-YOLO algorithm is better suited for deployment on edge devices, while maintaining an acceptable level of detection accuracy, an aspect of critical importance in practical applications. Overall, the results indicate that PGLD-YOLO outperforms other mainstream models and is capable of accurately localising and recognising pomegranate fruits in natural environments, demonstrating strong potential for real-world deployment.
Visual comparison of results
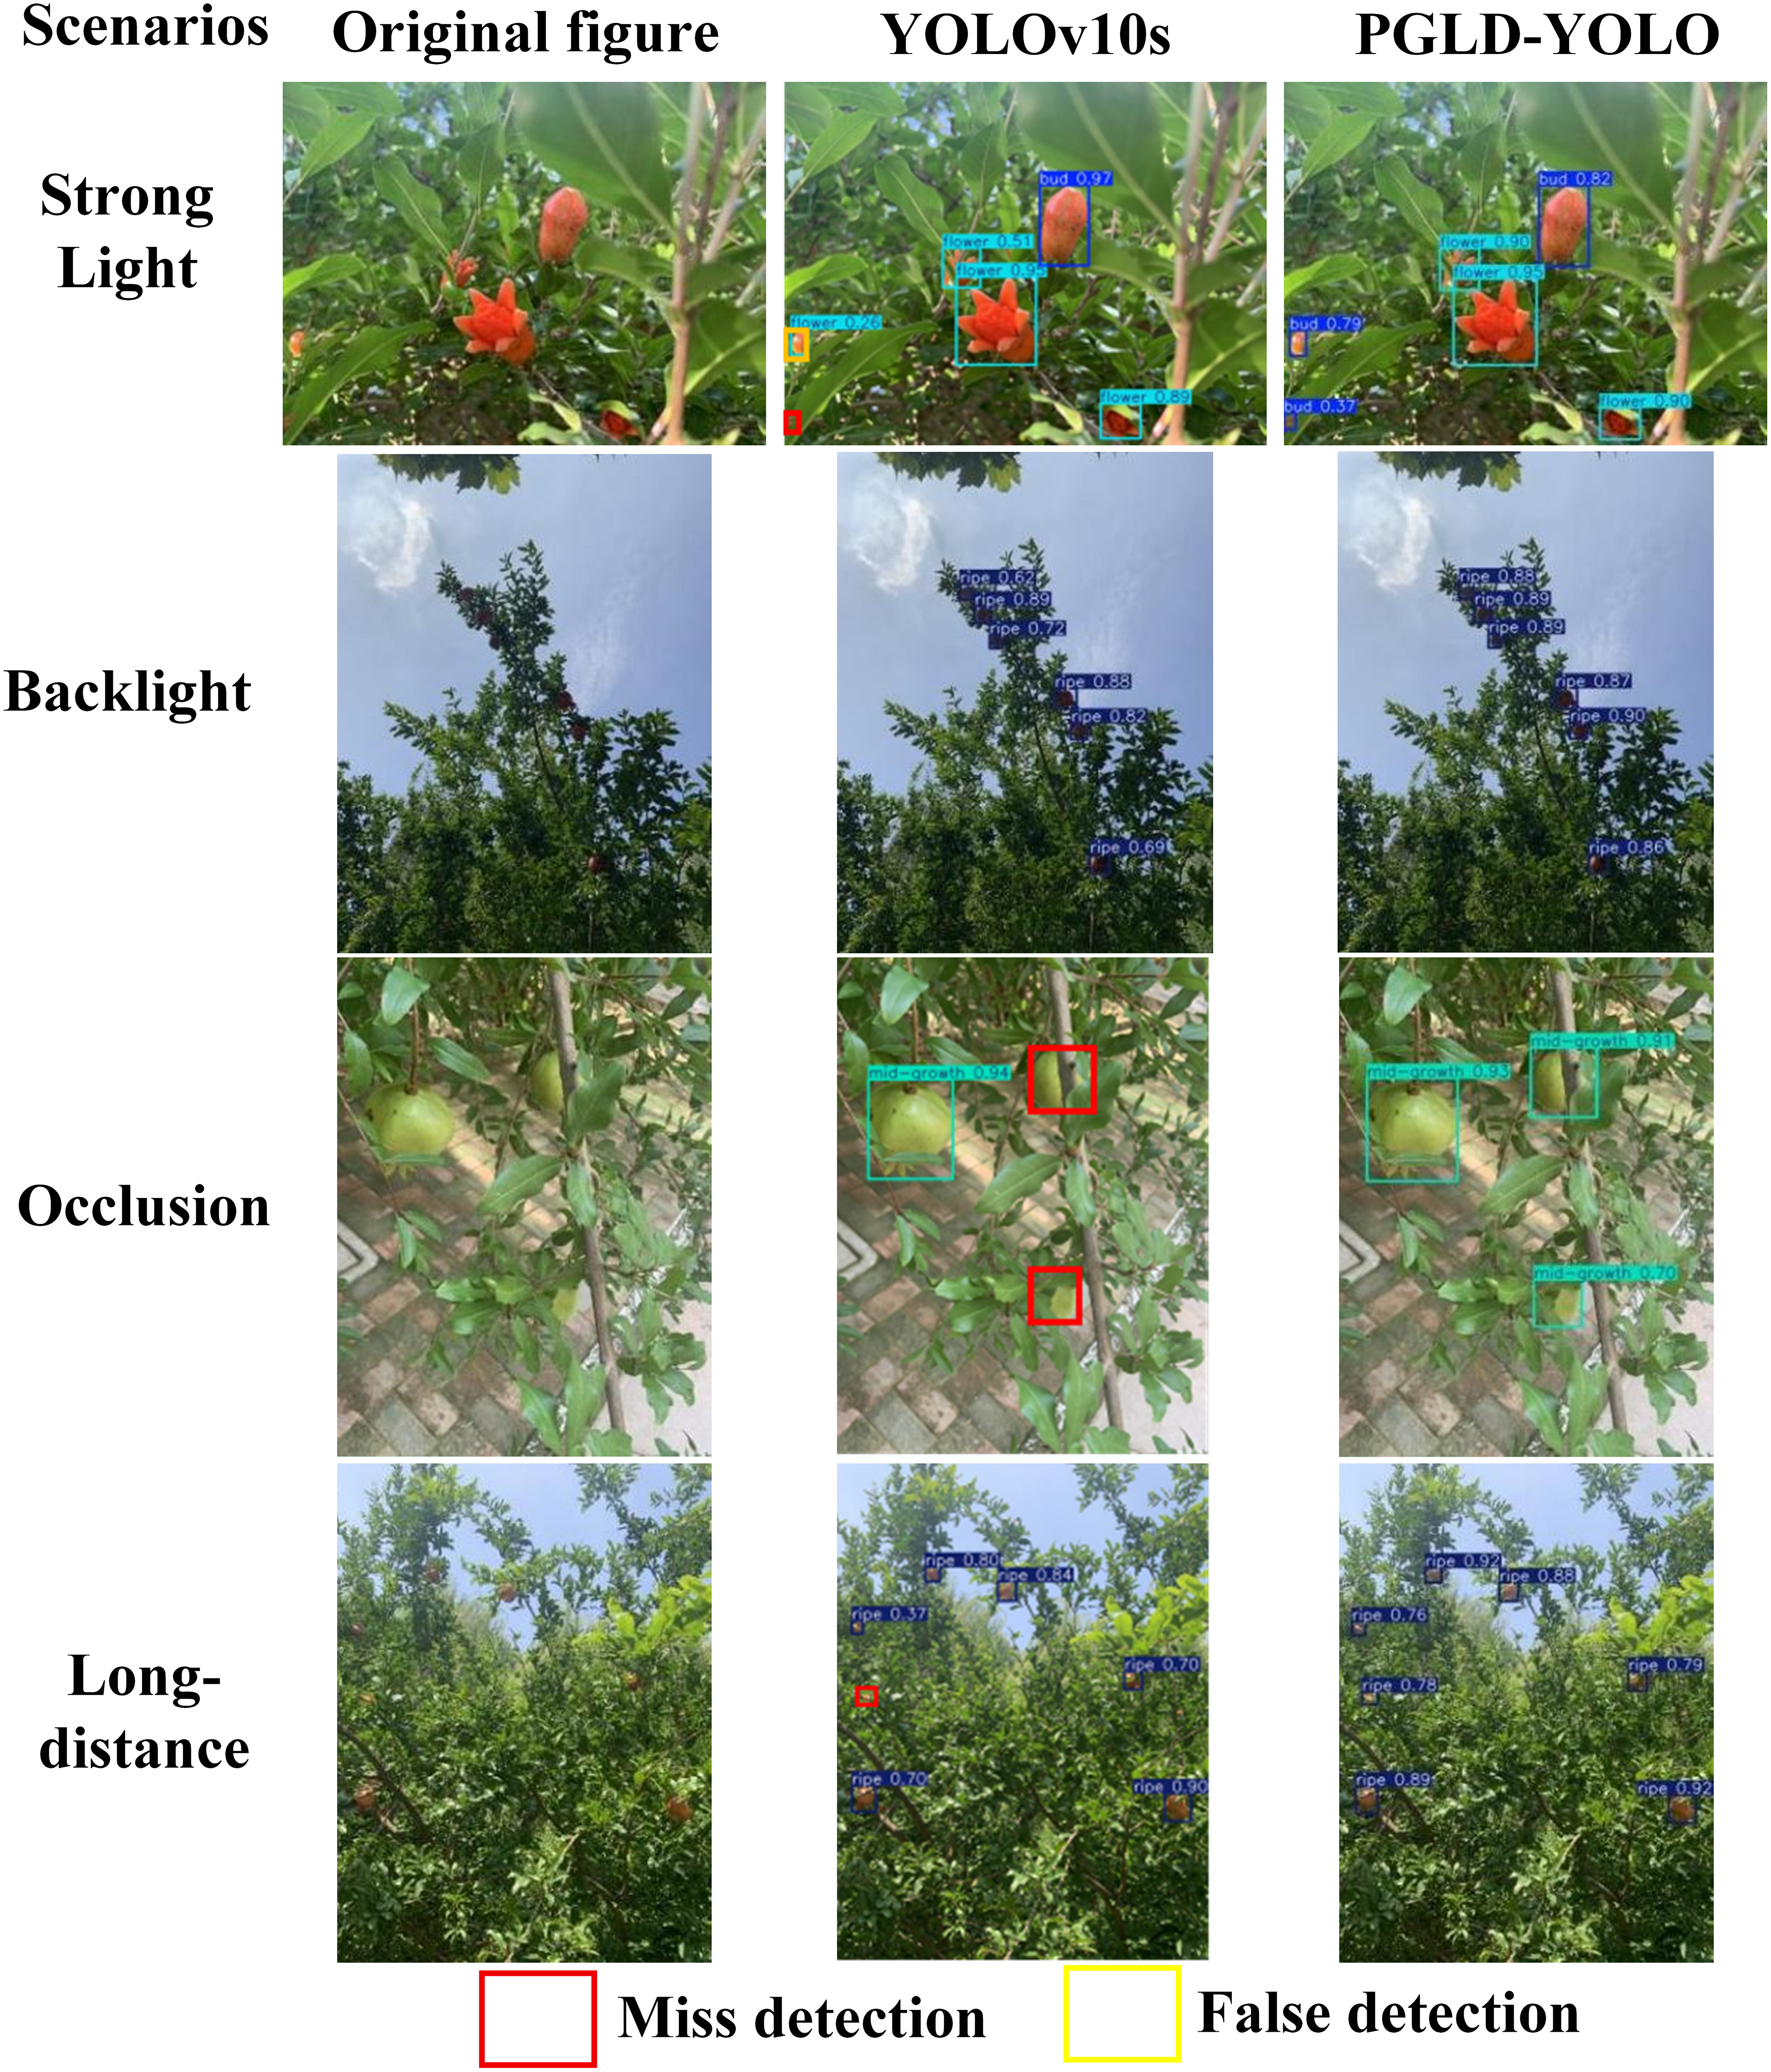
In orchard environments, variations in lighting and occlusion from branches and leaves present a dual challenge. Fluctuating illumination leads to fruit colour distortion and the loss of surface detail, hindering the accurate assessment of ripeness. Occlusion, on the other hand, results in missing contour features, blurring fruit boundaries, and reducing the accuracy of localisation and recognition. Consequently, the pomegranate fruit detection algorithm must exhibit both localisation capability and high precision in ripeness classification. To more clearly illustrate the improvement in detection performance offered by the PGLD-YOLO algorithm, this study evaluates and compares the performance of the YOLOv10s model and the enhanced PGLD-YOLO across four challenging conditions: strong light, backlight, occlusion, and long-distance scenes. The evaluation is conducted using both the Pomegranate Images Dataset and the Apple Object Detection Dataset. The findings are presented in Figs. 15 and 16, which display the predicted bounding boxes, ripeness categories, and confidence scores.
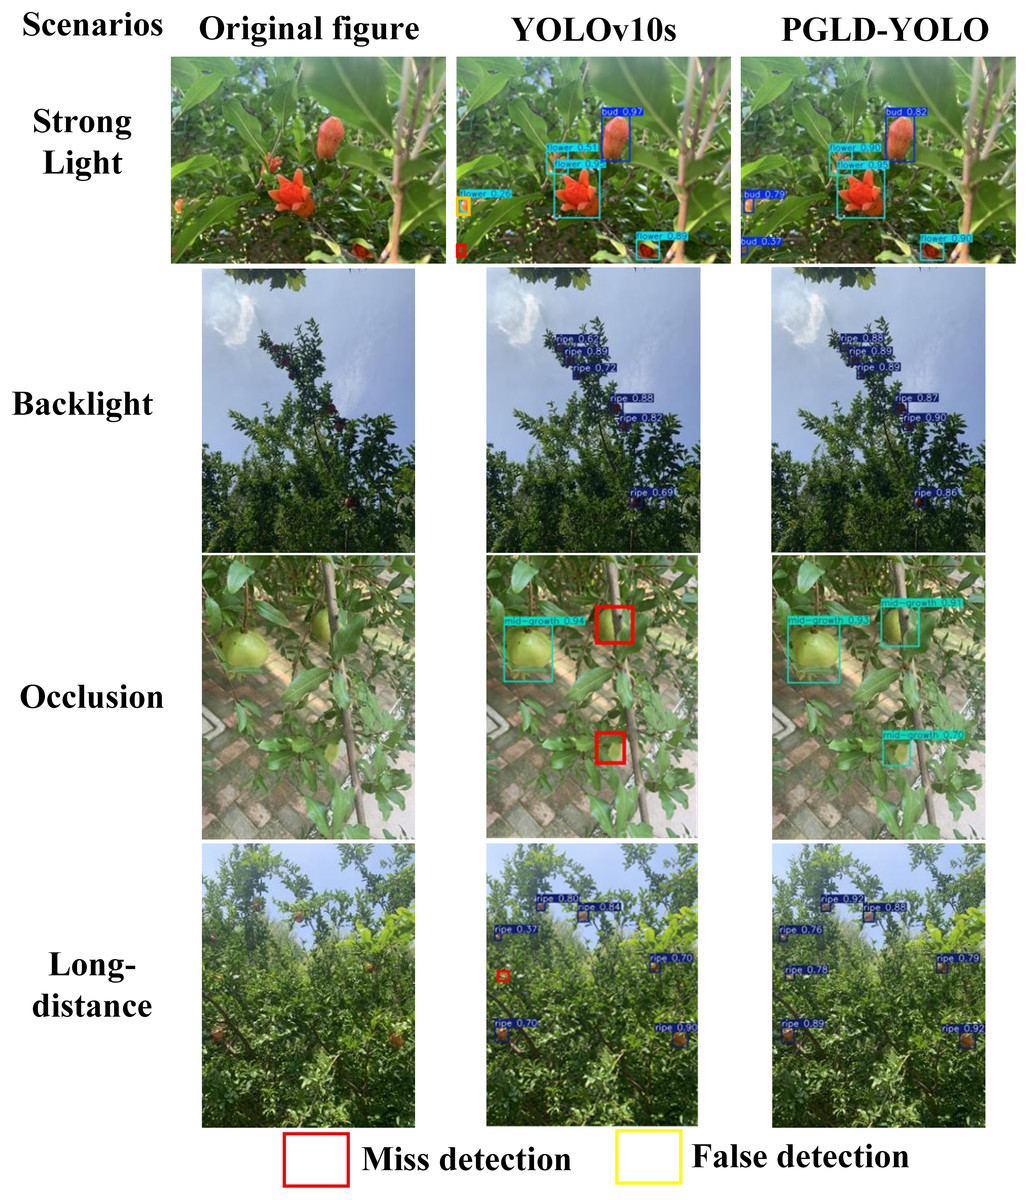
Figure 15: YOLOv10s and PGLD-YOLO models on the Pomegranate Images Dataset for visualisation comparison.
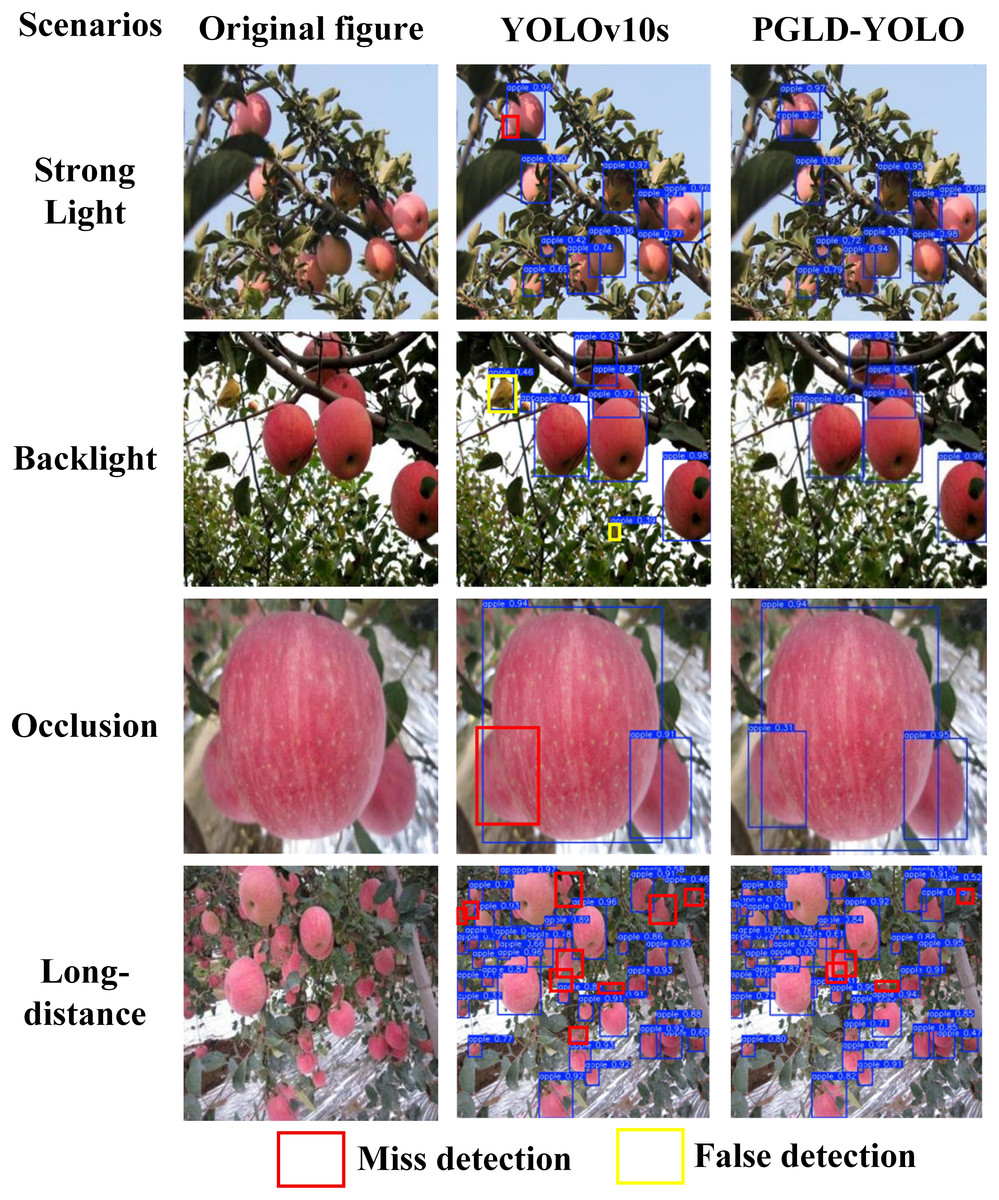
Figure 16: YOLOv10s and PGLD-YOLO models on the Apple Object Detection Dataset for visualisation comparison.
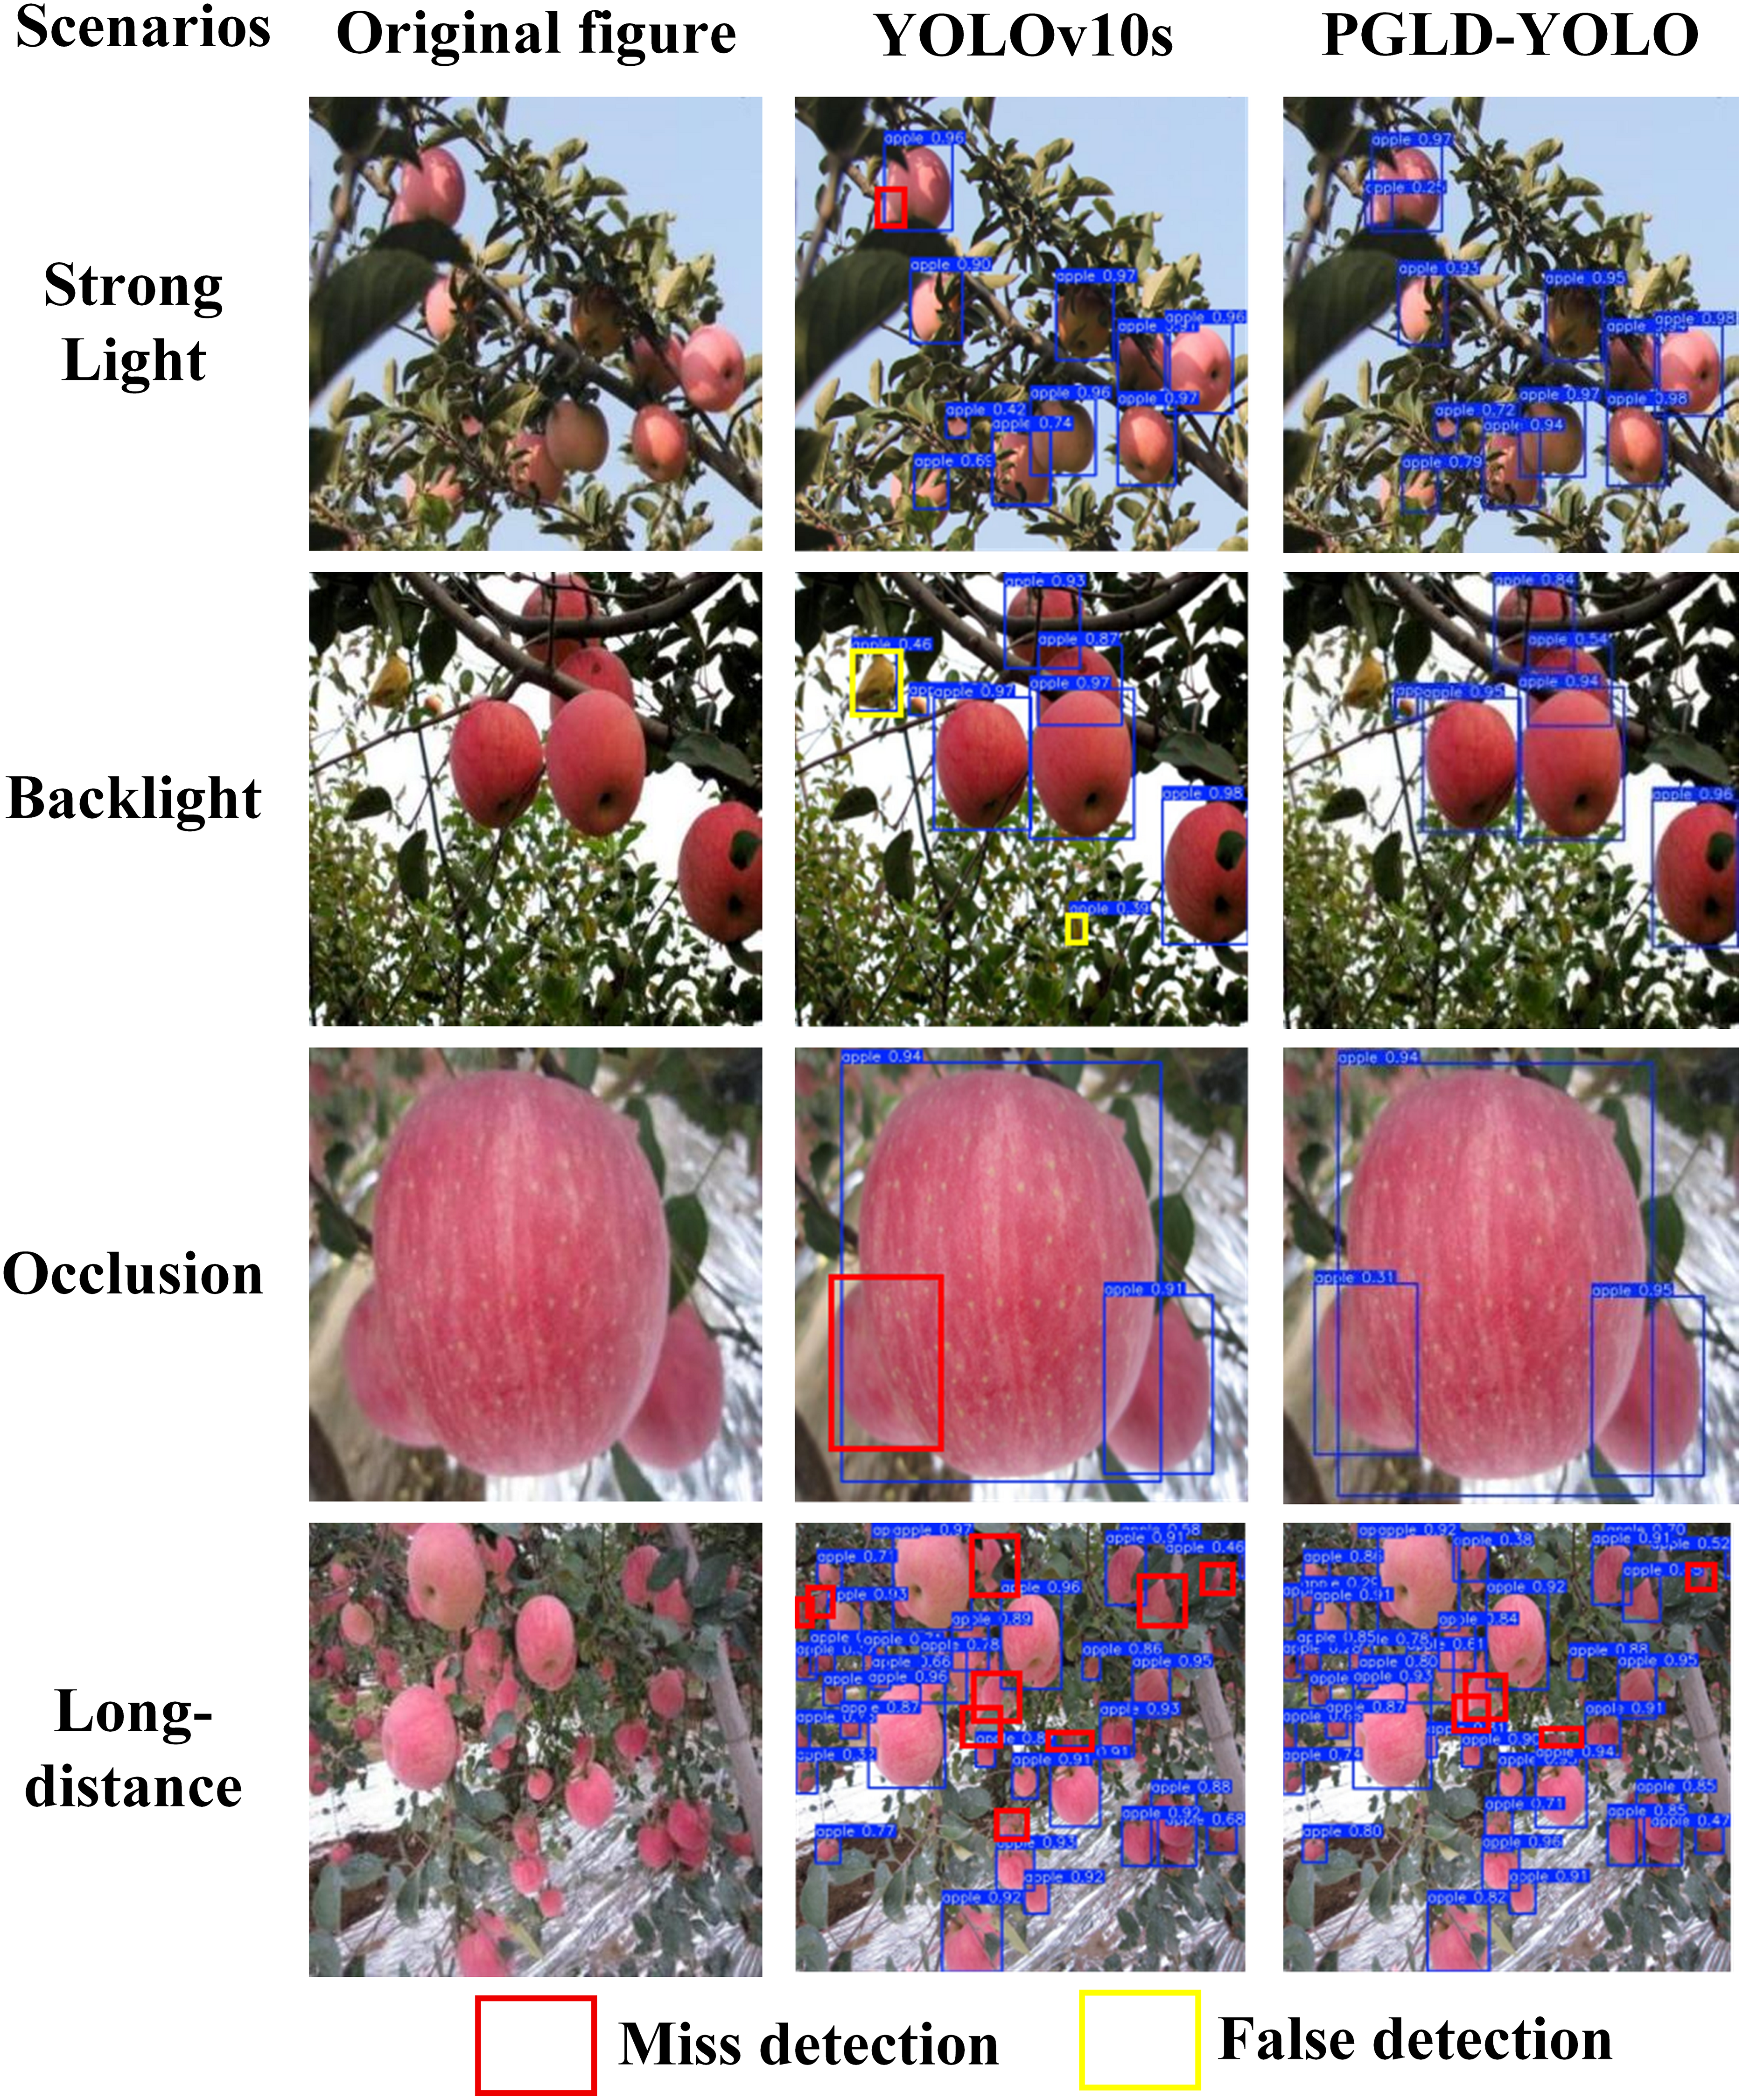
Figures 15 and 16 show that the YOLOv10s model exhibits varying degrees of missed detections on both the Pomegranate Images Dataset and Apple Object Detection Dataset. Figure 15 presents the visualisation outputs under four different background conditions within the Pomegranate Images Dataset, where YOLOv10s registers four missed detections and one false detection, misclassifying a “Bud” as a “Flower” under strong lighting. In contrast, PGLD-YOLO records neither missed nor false detections, achieves higher confidence scores, and generates bounding boxes that more accurately align with the pomegranate fruit contours. Figure 16 displays the visualisation output for the Apple Object Detection Dataset, revealing eleven missed detections by YOLOv10s and four by PGLD-YOLO. In the backlight scenario, the similarity in colour between fruit and foliage leads YOLOv10s to falsely detect two leaves as apples, whereas PGLD-YOLO makes no such errors. Taken together, these results demonstrate that PGLD-YOLO surpasses the original YOLOv10s in both pomegranate localisation and ripeness assessment under natural conditions, offering improved confidence scores and substantially minimising occurrences of missed and false detections.
Discussion
Comparative experiments on attentional mechanisms
To enhance the model’s focus on the key feature information of pomegranate fruits and reduce the interference of background factors, this study incorporates attention mechanisms into the baseline model, thereby improving its robustness to environmental distractions. Different attention mechanisms offer varying levels of improvement to the model’s performance. To investigate which mechanism is most suitable for the pomegranate fruit detection task, comparative experiments are conducted by integrating several approaches: Coordinate Attention (CA) (Hou, Zhou & Feng, 2021), Simple Attention Module (SimAM) (Yang et al., 2021), Squeeze-and-Excitation (SE) (Hu, Shen & Sun, 2018), Enhanced Squeeze-and-Excitation (eSE) (Lee & Park, 2020), and EMA (Ouyang et al., 2023). The findings are presented in Table 10, with the optimal metrics highlighted in bold.
| Model | Precision (%) | Recall (%) | mAP (%) | Params | Size (MB) | FLOPs (G) |
|---|---|---|---|---|---|---|
| YOLOv10s | 91.4 | 83 | 90.6 | 7,219,935 | 16.6 | 21.4 |
| YOLOv10s+CA | 93.1 | 83.1 | 91 | 6,732,967 | 15.6 | 19.3 |
| YOLOv10s+SimAM | 93.8 | 83.1 | 91.4 | 6,724,575 | 15.6 | 19.3 |
| YOLOv10s+SE | 93.8 | 83.2 | 91.5 | 6,729,183 | 15.6 | 19.3 |
| YOLOv10s+eSE | 94 | 82.6 | 91.7 | 6,761,759 | 15.6 | 19.3 |
| YOLOv10s+EMA | 94.1 | 83.5 | 92.1 | 6,730,495 | 15.6 | 19.5 |
The comparison results in Table 10 indicate that incorporating an attention mechanism significantly enhances the model’s detection performance. Among the tested mechanisms, embedding EMA yields gains of 2.7%, 0.5%, and 1.5% in precision, recall, and mAP, respectively, while incurring only a minimal increase in parameter count and computational cost, demonstrating its superiority over other mechanisms. This suggests that EMA effectively mitigates the influence of background noise and irrelevant regions such as branches and leaves, strengthens the discriminative capacity of pomegranate fruit feature regions, minimises inter-channel information loss, and enhances both localisation and ripeness assessment. Accordingly, this study integrates the EMA mechanism—identified as having the best overall performance—into the C2f_LEMA module, enabling the model to better focus on pomegranate fruit regions and increase both detection accuracy and localisation precision.
To provide an intuitive illustration of the model’s attention to different regions following the integration of various attention mechanisms, this study generates heat maps for visual analysis. In these maps, variations in colour intensity represent the distribution of the model’s attention: warmer colours signify higher attention to the target. The results, presented in Fig. 17, show that the model exhibits greater attention to the target fruits in their natural environment after the introduction of an attention mechanism. Compared with the baseline and those incorporating the CA, SimAM, SE, and eSE mechanisms, the heat maps with EMA display higher and more concentrated brightness in the principal regions and local features, indicating that the model with EMA can identify pomegranate fruits with greater accuracy. Accordingly, EMA exhibits superior performance.
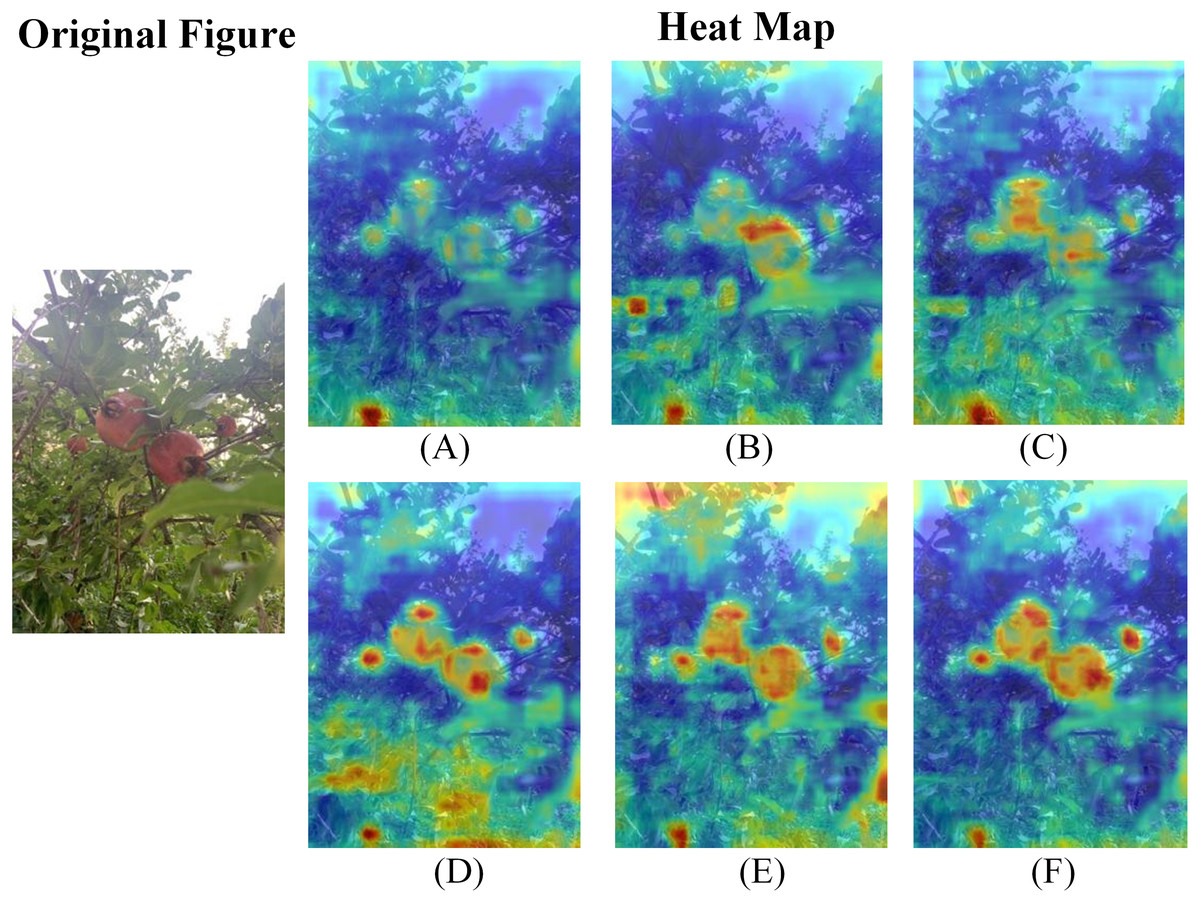
Figure 17: Comparison of heat maps with different attention mechanisms.
(A) YOLOv10s. (B) YOLOv10s+CA. (C) YOLOv10s+SimAM. (D) YOLOv10s+SE. (E) YOLOv10s+eSE. (F) YOLOv10s+EMA.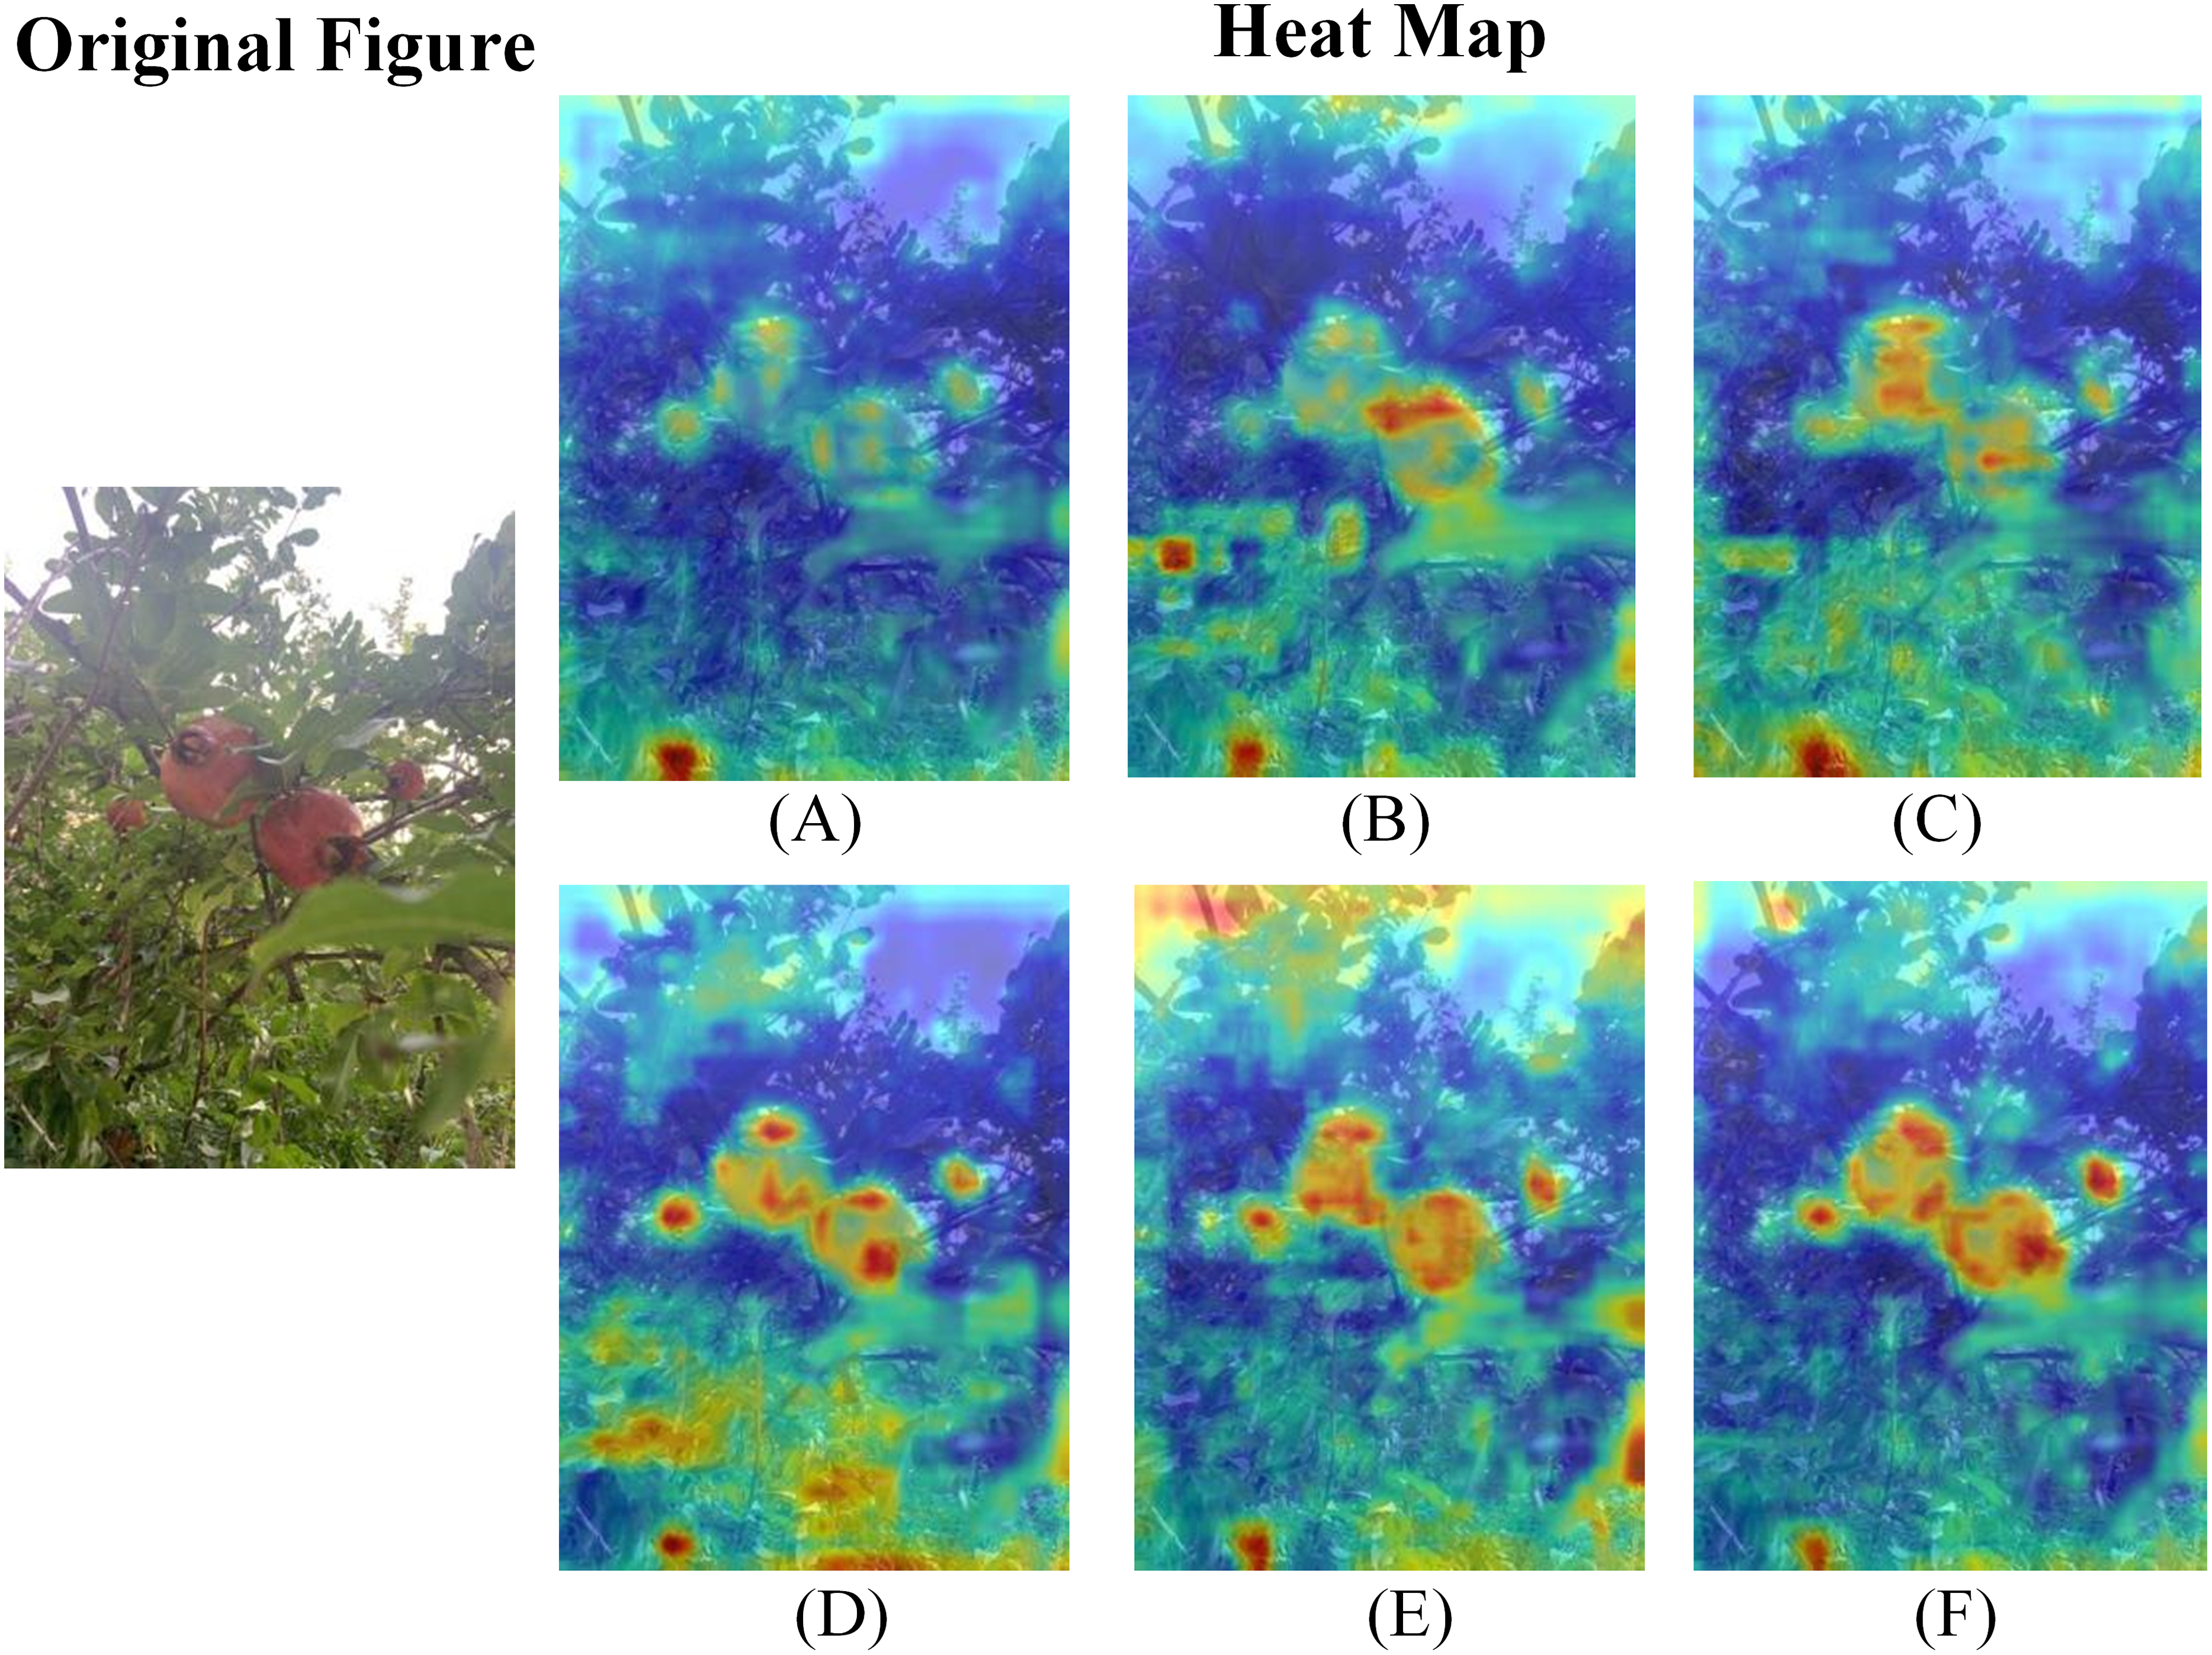
Performance comparison of different lightweight network detection
To verify the efficacy of reconstructing the backbone using the ShuffleNetV2 network, this study compares its performance with that of other lightweight networks, namely MobileNetV4 (Qin et al., 2025), FasterNet (Chen et al., 2023), EfficientNet (Tan & Le, 2019), and GhostNetV2 (Tang et al., 2022). Each network is employed to reconstruct the backbone, and the comparative findings are presented in Table 11. As shown in Table 11, employing ShuffleNetV2 to construct the backbone yields gains of varying magnitudes across multiple performance metrics relative to the original YOLOv10s backbone.
| Model | mAP (%) | Params (M) | Size (MB) | FLOPs (G) |
|---|---|---|---|---|
| YOLOv10s | 90.6 | 7.2 | 16.6 | 21.4 |
| YOLOv10s+MobileNetV4 | 90.1 | 8.9 | 20.0 | 28.6 |
| YOLOv10s+FasterNet | 91.1 | 6.9 | 15.9 | 16.4 |
| YOLOv10s+EfficientNet | 91.3 | 8.3 | 18.6 | 16.7 |
| YOLOv10s+GhostNetV2 | 91.3 | 6.6 | 15.5 | 14.1 |
| YOLOv10s+ShuffleNetV2 | 92 | 5.6 | 13.3 | 13.3 |
Upon analysing the data in Table 11, it is evident that the model employing ShuffleNetV2 as the backbone network achieves the highest mAP value. Notably, relative to YOLOv10s integrated with MobileNetV4, FasterNet, EfficientNet, and GhostNetV2, the model based on ShuffleNetV2 also exhibits clear advantages across all three model-complexity metrics. In comparison with YOLOv10s+MobileNetV4, it reduces the parameter count by 3.3M, the model size by 6.7MB, and FLOPs by 15.3G. The experimental results indicate that the ShuffleNetV2 network maintains higher detection accuracy while markedly reducing computational complexity through techniques such as grouped convolution and channel shuffle. Relative to other lightweight networks, it outperforms them in four key metrics and is therefore more suitable for resource-limited scenarios. Consequently, ShuffleNetV2 is selected to restructure the backbone for the pomegranate fruit detection task.
Evaluation and comparative analysis of anti-interference capability
To evaluate the enhancement in robustness provided by the C2f_LEMA module and the anti-interference capability of the PGLD-YOLO algorithm, this study introduces varying levels of noise into the test set and compares the detection performance of three models: the baseline YOLOv10s, YOLOv10s enhanced solely with the C2f_LEMA module, and the complete PGLD-YOLO approach. Specifically, different levels of Gaussian noise, salt-and-pepper noise, and a combination of both are added to the test set of the Pomegranate Images Dataset. The mAP values of the three algorithms are obtained through experimental evaluation, with the results presented in Tables 12–14, where the optimal values are highlighted in bold and suboptimal values are underlined.
| Noise level | 0.005 | 0.01 | 0.015 | 0.02 | 0.025 |
|---|---|---|---|---|---|
| YOLOv10s | 90.2% | 90.1% | 90% | 89.9% | 89.7% |
| YOLOv10s+C2f_LEMA | 92.2% | 92.2% | 92.1% | 91.9% | 91.7% |
| PGLD-YOLO | 91.7% | 91.7% | 91.5% | 91.4% | 91.3% |
| Noise Level | 0.005 | 0.01 | 0.015 | 0.02 | 0.025 |
|---|---|---|---|---|---|
| YOLOv10s | 88.9% | 86.5% | 83.6% | 80.2% | 74.2% |
| YOLOv10s+C2f_LEMA | 91.2% | 88.6% | 85.7% | 81.2% | 76.7% |
| PGLD-YOLO | 90.6% | 88.2% | 84.7% | 79.7% | 76.1% |
| Noise Level | 0.005 | 0.01 | 0.015 | 0.02 | 0.025 |
|---|---|---|---|---|---|
| YOLOv10s | 89.2% | 87.8% | 85.8% | 83.4% | 80.6% |
| YOLOv10s+C2f_LEMA | 91.4% | 89.9% | 87.8% | 84.8% | 81.7% |
| PGLD-YOLO | 91% | 89.2% | 86.9% | 83.6% | 80.9% |
Tables 12, 13, and 14 present the comparative mAP values for the YOLOv10s, YOLOv10s+C2f_LEMA, and PGLD-YOLO approaches under varying levels of Gaussian noise, salt-and-pepper noise, and combinations of both, introduced into the test set of the Pomegranate Images Dataset. The corresponding curves are shown in Fig. 18. The results in Tables 12–14 and Fig. 18 indicate that the detection accuracy of all three approaches declines to varying extents as noise levels increase. Among them, the YOLOv10s+C2f_LEMA method achieves the highest mAP values in all three comparative experiments involving different noise levels, while the PGLD-YOLO method records a total of 14 suboptimal mAP values. These findings suggest that the improved C2f_LEMA module in this study markedly strengthens the model’s resistance to noise-induced interference. Notably, in all three comparative experiments—except under salt-and-pepper noise with a density of 0.02—the mAP values of the PGLD-YOLO method exceed those of the baseline YOLOv10s, yet remain slightly lower than those of the YOLOv10s+C2f_LEMA method. This is attributable to the fact that, in addition to incorporating the C2f_LEMA module, PGLD-YOLO also replaces the backbone with a lightweight architecture and adopts the GNSH detection head, diminishing overall model complexity. These findings indicate that the PGLD-YOLO improves robustness and resilience to noise disturbances while maintaining a lightweight design. Furthermore, Fig. 18 shows that, under all noise conditions, the mAP curves of both PGLD-YOLO and YOLOv10s enhanced solely with the C2f_LEMA module decline more gradually than those of the baseline YOLOv10s. This suggests a slower deterioration in detection accuracy under noise interference, accordingly corroborating the efficacy of the improved C2f_LEMA module in strengthening model robustness.
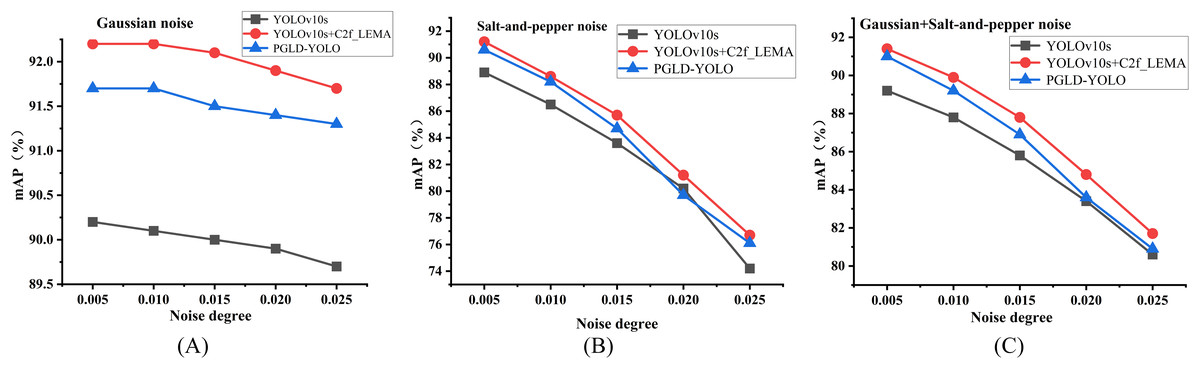
Figure 18: Comparison of mAP for the three methods on test sets with varying levels of Gaussian noise, salt-and-pepper noise, and combinations of both noise types.
(A) Gaussian noise. (B) Salt-and-pepper noise. (C) Gaussian+salt-and-pepper noise.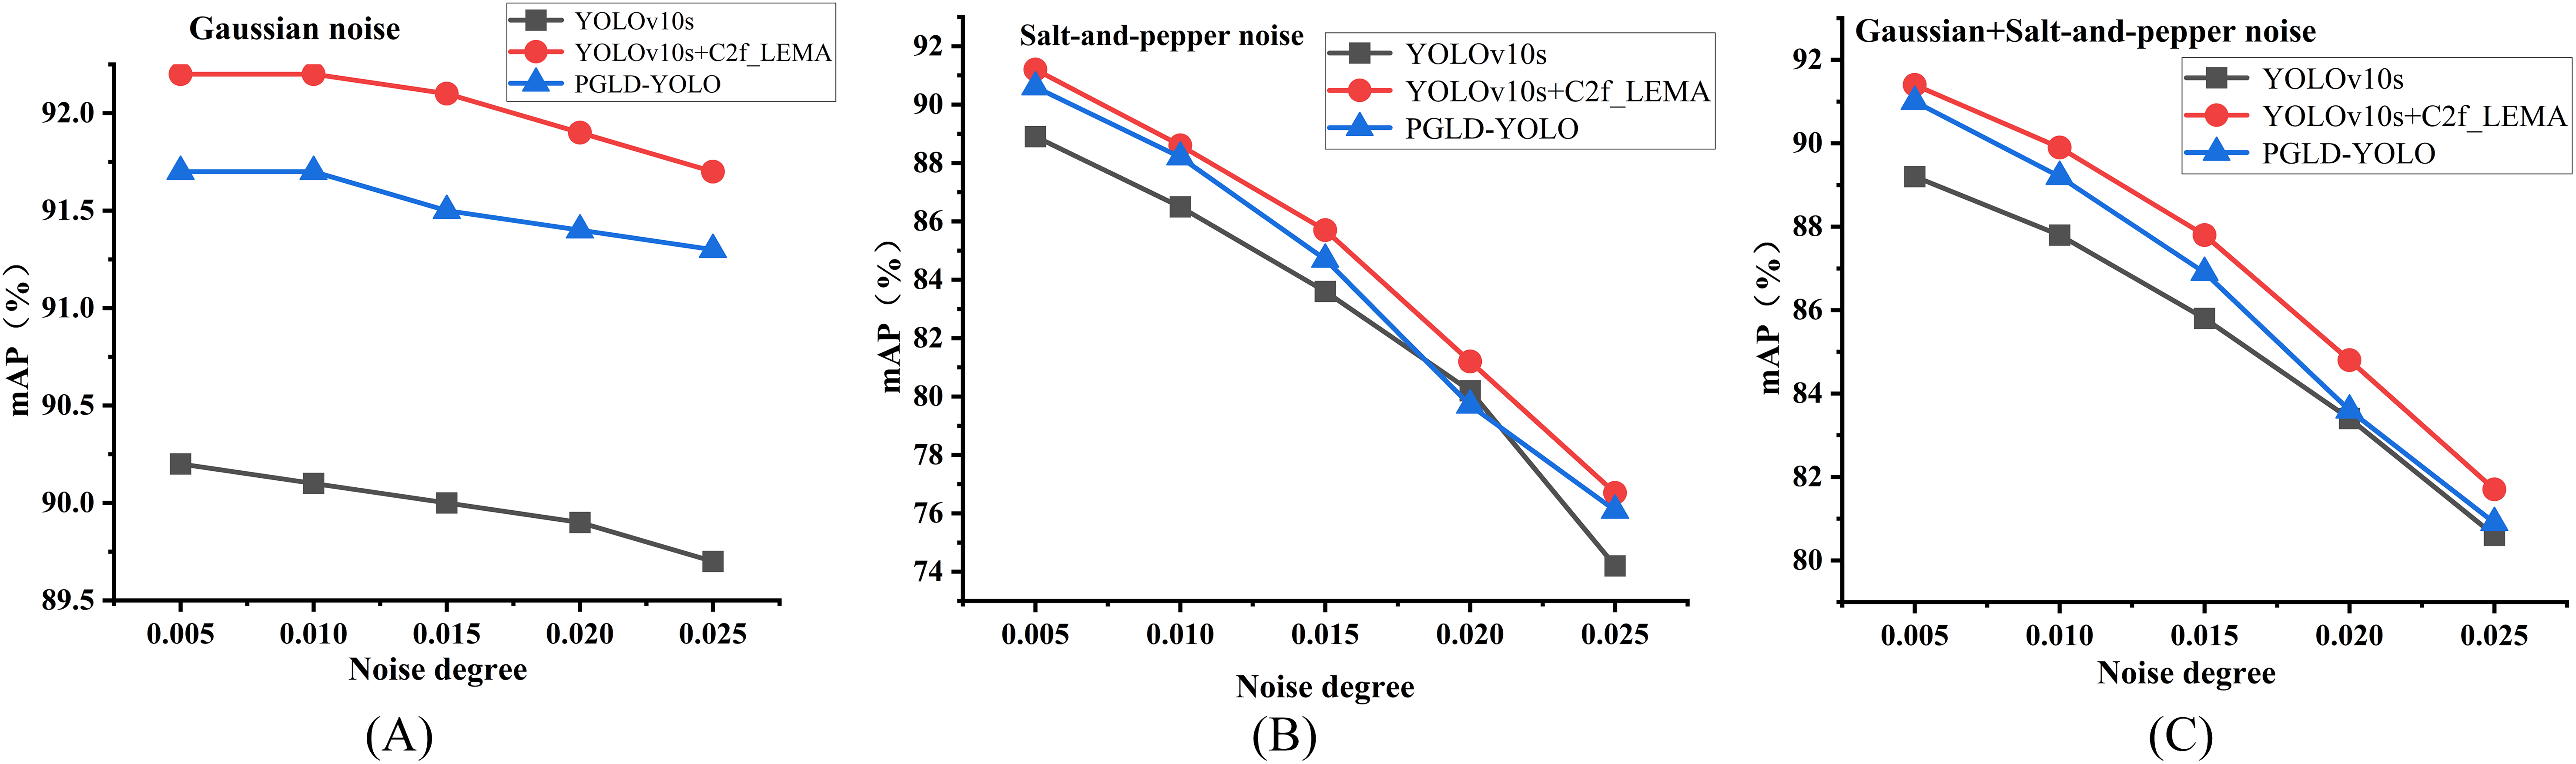
In summary, this study proposes the PGLD-YOLO method, which demonstrates enhanced robustness and anti-interference capability while concurrently minimising model size, parameter count, and computational complexity. It effectively mitigates background distractions and sustains high detection accuracy in the localisation and recognition of pomegranate fruits in natural environments.
Although the model proposed in this study attains a commendable balance between detection accuracy and lightweight design, and shows a degree of robustness against varying levels of Gaussian and salt-and-pepper noise interference, certain limitations remain. In particular, in the detection of small-scale and densely distributed fruits, both accuracy and robustness still require improvement. Moreover, the model has not been trained through multiple independent runs, thus lacking an evaluation of its stability. Future research will therefore focus on small fruit targets, aiming to incorporate feature extraction methods capable of withstanding environmental interference to augment the model’s applicability. In parallel, the model’s stability will be assessed through repeated experiments and statistical analyses. Additionally, collaboration with agricultural experts is planned to deploy the proposed model on agricultural drones or integrated picking systems for testing and evaluation, to verify its performance in real orchard environments and to strengthen its practical utility in precision agriculture.
Conclusions
To address the challenges of low accuracy, large parameter size, and high computational complexity in existing pomegranate detection algorithms, this study proposes PGLD-YOLO, a lightweight fruit localisation and recognition algorithm based on an improved YOLOv10s architecture for natural environments. First, ShuffleNetV2 is employed as a lightweight backbone for feature extraction, significantly minimising model complexity while improving detection accuracy. Second, a C2f_LEMA module is designed to refine the neck, improving feature representation while maintaining model lightweightness. This effectively minimises false and missed detections of pomegranate fruits in natural environments, augmenting the model’s robustness. Finally, a lightweight detection head, GNSH, is proposed to replace the original detection head, further decreasing the model size and parameter count, as well as lowering the missed detection rate. Relative to the baseline YOLOv10s model, PGLD-YOLO achieves an mAP of 92.6% on the data-enhanced Pomegranate Images Dataset, accompanied by a 34.7% reduction in parameters to 4.7MB, and reductions in model size and FLOPs of 40.4% and 35.5%, respectively. The proposed model also demonstrates improved detection accuracy on the public Apple Object Detection and the VOC2007 datasets compared with the baseline, while retaining a lightweight architecture, thereby indicating strong generalisation capability and practical applicability. Comparative experiments with other mainstream object detection algorithms reveal that the proposed approach achieves a favorable balance among detection accuracy, localisation precision, and model complexity, thus meeting the requirements for real-world deployment. Visualisation results further indicate that the proposed method can effectively localise and recognise pomegranate fruits in natural environments, providing a technical reference for its implementation and practical application on embedded devices.