
Spatiotemporal evolution and forecasting of public attention to special education: a GIS and SARIMA-LSTM based analysis
- Published
- Accepted
- Received
- Academic Editor
- Siddhartha Bhattacharyya
- Subject Areas
- Artificial Intelligence, Data Mining and Machine Learning, Social Computing, Spatial and Geographic Information Systems, Sentiment Analysis
- Keywords
- Spatiotemporal, Forecasting, SARIMA-LSTM, GIS, Baidu Index, Public attention, Special education
- Copyright
- © 2025 Xu et al.
- Licence
- This is an open access article distributed under the terms of the Creative Commons Attribution License, which permits unrestricted use, distribution, reproduction and adaptation in any medium and for any purpose provided that it is properly attributed. For attribution, the original author(s), title, publication source (PeerJ Computer Science) and either DOI or URL of the article must be cited.
- Cite this article
- 2025. Spatiotemporal evolution and forecasting of public attention to special education: a GIS and SARIMA-LSTM based analysis. PeerJ Computer Science 11:e3293 https://doi.org/10.7717/peerj-cs.3293
Abstract
Understanding public attention to special education is vital for promoting educational equity and achieving the Sustainable Development Goals (SDGs). This study aims to examine the spatiotemporal patterns of public attention to special education in China and to develop and evaluate a hybrid forecasting model to anticipate trends in such attention. Temporal trends and spatial disparities were assessed using geographic information system (GIS) techniques and spatial autocorrelation analysis. A hybrid forecasting approach combining Seasonal Autoregressive Integrated Moving Average (SARIMA) and long short-term memory (LSTM) models was applied, and its accuracy was evaluated using multiple performance metrics. The results suggest that public attention to special education remains stronger in the developed eastern regions and lags in the west. There are clear regional disparities and seasonal peaks in public attention, with the hybrid model outperforming single-model approaches in forecasting accuracy. This study integrates big data analytics, spatiotemporal modeling, and hybrid forecasting, contributing to future assessments of public attention to special education. The findings illustrate a framework for effectively improving responsiveness to educational policies, enhancing the efficiency of educational resource allocation, and promoting equitable and sustainable development in education.
Introduction
The Sustainable Development Goals (SDGs) have become central to global policy discourse. SDG 4 calls for inclusive and equitable quality education and lifelong learning opportunities for all (Adams, Jameel & Goggins, 2023). Special education plays a critical role in achieving this goal, serving as a pathway to educational equity and social inclusion (Cooc & Yang, 2016). While inclusive education policies and greater recognition of the rights of individuals with special needs have heightened attention to this field, students with special educational needs still face barriers such as uneven resource allocation, societal prejudice, and limited policy implementation (Kolbe, Dhuey & Doutre, 2023). Increasing public attention to special education contributes to building a more inclusive and equitable educational ecosystem, serving as a key driver in advancing the realization of the SDGs (Sulasmi, Prasetia & Rahman, 2023).
Traditional research methods, such as surveys and interviews, provide valuable insights but lack the timeliness needed to track rapid changes in public sentiment (Amer-Mestre, Ayarza-Astigarraga & Lopes, 2024). In contrast, internet-based behavioral data, particularly search engine indices, enable real-time and continuous monitoring of attention trends, offering an innovative resource for capturing shifts in public interest (Ikegwu et al., 2022). Such data have been widely applied in education, healthcare, environmental awareness, and social policy studies to capture patterns of public attention (Havranek & Zeynalov, 2021; Sycinska-Dziarnowska et al., 2021; Han et al., 2024; Rahdari et al., 2024; Urman & Makhortykh, 2024). They also provide a dynamic lens for interpreting public engagement with special education (Simionescu & Cifuentes-Faura, 2022; Tubadji, Boy & Webber, 2023), serving as a valuable direction in educational research (Zhao, Li & Liu, 2024). Meanwhile, public attention to special education shows both temporal fluctuations and regional disparities. Differences in economic development, educational resources, and cultural context contribute to spatial clustering or dispersal of attention (Fegert et al., 2020; Li et al., 2022; Qi et al., 2023).
However, despite the growing use of search engine data in educational research, few studies have systematically examined public attention to special education from both temporal and spatial perspectives. Existing work often focuses on single events, policy evaluation, or limited geographic contexts (Tefera & Fischman, 2020), without revealing long-term dynamics or regional disparities. Moreover, the integration of advanced forecasting techniques—particularly hybrid models combining statistical and deep learning methods—into this field remains rare, limiting the ability to anticipate shifts in public interest and inform timely policy action. Addressing these gaps is essential for developing a data-driven framework that explains current attention patterns and generates actionable forecasts to guide equitable resource allocation and awareness strategies.
Geographic information system (GIS) tools enable visualization of spatial distribution and identification of regional disparities in public attention (Rovetta, 2021). Forecasting methods, from time series analysis to machine and deep learning, have been widely applied in public health, socioeconomic research, and finance (Rahdari et al., 2024). These techniques provide a feasible pathway for integrating spatial analysis with temporal forecasting models, enabling a comprehensive exploration of public attention to special education.
Accordingly, this study pursues two research objectives (ROs):
RO1: To examine the spatiotemporal variation in public attention to special education and identify its evolutionary patterns.
RO2: To construct and evaluate a forecasting model to accurately capture public attention to special education.
To achieve these objectives, the study combines GIS technology with a Seasonal Autoregressive Integrated Moving Average (SARIMA)-LSTM hybrid model. It employs tools such as Excel, GeoDa, ArcGIS, SPSS, and Python to analyze the spatiotemporal evolution and forecasting of public attention to special education in China, using data from the Baidu Index. By employing web-based big data, it enriches the literature and promotes interdisciplinary integration between education and data sciences. The findings reveal temporal and spatial evolution patterns, providing evidence for inclusive education policy, resource allocation, and public engagement, thereby supporting SDGs in education. Furthermore, the study develops a framework that combines time series forecasting with spatial analysis, enhancing monitoring accuracy and offering a replicable approach for studying public attention in other social science contexts.
Literature review
Special education
Special education aims to offer fair and inclusive learning opportunities for children with special educational needs (McLaughlin, Krezmien & Zablocki, 2009; Snozzi, Carmen & Müller, 2024). Currently, public attention to special education has continued to rise, and societal understanding of children with special needs has gradually shifted from viewing them as “disabled” to recognizing them as having “special learning needs.” Increasing attention is also being given to non-traditional groups (Garner et al., 2020; Keles, ten Braak & Munthe, 2024).
At the same time, social media and public-interest campaigns have enhanced public awareness and contributed to greater societal support for special education (Bakombo, Ewalefo & Konkle, 2023; Bitman, 2023; Clegg & Lansdall-welfare, 2024). Developments in technologies such as artificial intelligence, remote education, and assistive devices have not only broadened the avenues through which special education can be delivered, but have also stimulated public interest in the concept of technology-enabled special education (Chen et al., 2022; Marino et al., 2023; Yang et al., 2024). These trends suggest that special education research is increasingly oriented towards inclusive and intelligent education, with related topics becoming focal points of interest for the public and scholars.
Public attention
With the advancement of big data analytics, researchers have begun to utilize online behavioral data (such as search engine indices and social media activity) as proxies for public interest, treating public attention as a key indicator of societal awareness and engagement with specific issues (Nghiem et al., 2016). Eysenbach was among the first to explore the concept of “infodemiology” in public health using web-based data, a concept that was later extended to educational research (Eysenbach, 2009).
Search engine indices, as important digital indicators reflecting the level of public concern for social issues, are increasingly offering data-driven, quantitative methodologies for studies in education (Kansal et al., 2021). Previous studies have employed Google Trends to examine shifts in educational models and trends in public interest (Phelan et al., 2017; Brody et al., 2024), as well as to analyze public attention to various forms of education, including higher education, online education, artificial intelligence in education, adult education, and lifelong learning (Zhao, Li & Wang, 2021; Tan et al., 2022; Artyukhov et al., 2023; Tan et al., 2024; Jiang & Fu, 2025).
In addition, some scholars have investigated how changes in education policy affect public attention to special education, using search engine data as the analytical foundation (Long et al., 2022). These studies indicate that identifying and forecasting public interest trends in education through search engine indices has become a new direction in educational big data research.
Spatial analysis
Although the application of search engine indices in studying public attention has established a solid foundation, there remains a lack of systematic investigation into the spatial distribution characteristics of public concern. Public behavior often exhibits distinct patterns of clustering and heterogeneity within geographic space, and relying solely on temporal analysis is insufficient to uncover regional disparities and underlying mechanisms of dissemination.
Spatial autocorrelation tools have been widely employed in fields including public health, urban planning, and regional economics (Rovetta, 2021; Lin et al., 2023; Vardopoulos et al., 2023; Musikhin & Karpik, 2023) to identify behavioral patterns and clustering trends across geographic areas (Yousefi et al., 2020). These tools enable the quantification of spatial relationships among variables, revealing hotspots, cold spots, and anomalies in spatial distribution (Pászto, Burian & Macků, 2020).
In the context of educational research, spatial analysis methods have also demonstrated considerable value. For instance, in exploring paradigm shifts in education during the age of artificial intelligence (AI), mapping the environments of students engaging in online learning, and examining topological structures in educational systems (Du et al., 2022; Lingard, 2022; Zhong & Zhao, 2025). Empirical studies have shown that GIS technologies and spatial autocorrelation analysis can effectively reveal regional disparities and distributional characteristics in public attention to education (Konstantakatos & Galani, 2023). As such, the integration of spatial analysis methods into the study of public attention offers valuable insights into regional differences in educational awareness, policy receptiveness, and information dissemination effectiveness.
Forecasting model
Autoregressive Integrated Moving Average (ARIMA) based models, such as SARIMA, have been widely used in educational forecasting research. For instance, prior studies have applied such models to forecast higher education quality, the cost of educational facilities, and trends in teacher demand (Jeong, Koo & Hong, 2014; Kharitonov et al., 2021; Reyes Reyes et al., 2022; Zhu, 2023). However, these linear models present certain limitations when dealing with the non-linear characteristics and context-sensitive patterns frequently observed in real-world public attention data.
To address these shortcomings, recent research has increasingly incorporated deep learning methods, particularly long short-term memory (LSTM) networks, due to their ability to identify long-range patterns and handle intricate non-linear dynamics within time series data (Bousnguar, Najdi & Battou, 2022). LSTM models are especially suited to handling dynamic sequences influenced by multiple factors, such as public behavior and educational feedback, owing to their ability to retain historical information across multiple time layers (Van Houdt, Mosquera & Nápoles, 2020).
Further studies have shown that hybrid forecasting models integrating traditional statistical approaches (such as SARIMA) with LSTM architectures can significantly enhance both forecasting accuracy and robustness, outperforming the performance of single models (Tuğba Önder, 2024; Bilgili, Pinar & Durhasan, 2025). These hybrid models are particularly effective in managing complex datasets characterized by external shocks, time lags, and trend reversals, making them well-suited to highly dynamic social science contexts such as education policy evaluation and public opinion analysis.
Although SARIMA and LSTM models have been widely used for temporal forecasting, and Moran’s I has revealed spatial clustering patterns, few studies have integrated these methods within a unified framework to analyze public attention to special education. Approaches that combine spatiotemporal modeling with hybrid forecasting techniques remain underexplored. This study aims to enrich existing research by integrating the SARIMA-LSTM hybrid model with spatial autocorrelation analysis, offering a robust methodology for understanding and forecasting the public attention to special education. This approach not only facilitates the analysis of public perceptions and needs regarding special education but also enhances the sociological understanding of the field. Furthermore, it provides a scientific foundation for the optimization of special education policies, public awareness initiatives, and the advancement of educational equity, thereby carrying both theoretical significance and practical value.
Methodology
Date source
This study covers 31 provinces across China, with Hong Kong, Macau, and Taiwan excluded due to data limitations. The base map used for spatial visualization was sourced from the Amap Open Platform (Amap, 2025). Data were collected from Baidu Index, with the sample comprising Chinese internet users. Baidu is the first search engine in China (Xie et al., 2024), and the Baidu index has been extensively applied in studies on public attention. To enhance data completeness, this study employed the Baidu Index’s keyword accumulation function for data collection (Shu et al., 2020). In line with the platform’s limitation of three keywords per query (Baidu, 2025), the following selection strategy was adopted: “special education” was chosen as the core keyword; related candidate terms were identified using Baidu Index demand map based on semantic relevance; the two most frequently occurring terms over the past year were then selected as supplementary keywords.
As a result, “special education major” (特殊教育专业) and “special education schools” (特殊教育学校) were identified as supplementary terms. These, along with “special education” (特殊教育), formed the final keyword combination. The Baidu Index data for these keywords, covering the period from 2020 to 2024, were retrieved and used as the primary dataset for measuring public attention.
Research method
This methodological framework addresses the gap identified in the preceding sections, namely the limited integration of temporal–spatial analysis and advanced hybrid forecasting in studies on public attention to special education. By combining GIS-based spatial analysis with a SARIMA-LSTM model, the study captures both regional disparities and complex temporal patterns.
The selection of methods was informed by their proven suitability in similar research contexts. GIS-based spatial analysis has been widely applied to identify and visualize spatial disparities in education-related studies (Konstantakatos & Galani, 2023), while SARIMA effectively models linear and seasonal patterns in time series data (Kumar Dubey et al., 2021). LSTM networks are well suited to capturing non-linear dependencies and long-term temporal relationships (Van Houdt, Mosquera & Nápoles, 2020). The hybrid SARIMA-LSTM model leverages the complementary strengths of both approaches, as supported by prior studies showing its superior forecasting performance in complex social datasets (Peirano, Kristjanpoller & Minutolo, 2021; Bilgili, Pinar & Durhasan, 2025).
The data analysis in this study utilized software including Excel, SPSS, ArcGIS, GeoDa, and Python, and adopted a quantitative research approach. First, the temporal trends of public attention to special education in China are examined. Subsequently, GIS-based spatial analysis is utilized to examine the spatial variation, and visual maps are generated to present its spatial evolution. Finally, a SARIMA-LSTM hybrid model is used to construct a forecasting model of public attention to special education, and the model’s forecasting accuracy is evaluated. The selection of analytical tools was aligned with the study’s dual focus on spatial pattern detection and temporal forecasting. Excel was used for data preprocessing and initial calculations, SPSS for statistical and regression analysis, ArcGIS for spatial visualization, GeoDa for spatial autocorrelation analysis, and Python for implementing SARIMA, LSTM, and hybrid models. This combination ensures methodological robustness and replicability.
The following subsections detail the spatial correlation analysis and forecasting model construction adopted in this study.
Spatial correlation analysis
Moran’s I is a common indicator in spatial statistical analysis (Balash et al., 2020). It is typically categorized into Global and Local (Mathur, 2015). In this study, Moran’s I values are computed and visualized using GeoDa software to conduct a comprehensive analysis of the spatial correlation of public attention at both the overall and local levels. This enables the identification of spatial clustering patterns and regional disparities in public interest. The equations are:
(1) (2) where I and IL denote the Global and Local indices, respectively, X represents the observed indicator of interest, and Xi and Xj refer to the values of X in regions i and j. n is the number of regions under investigation, and Wij is the spatial weight. In this study, Wij is set to 1 if regions i and j share a geographical boundary, and zero otherwise.
To ensure the validity of the index, a Z-score is typically used to conduct a significance test. The equation is:
(3)
Here, Z(I) represents the standardized test statistic for significance, E(I) denotes the expected value of the Moran’s I index, and VAR(I) is its variance. According to the 95% confidence interval criterion, if |Z| exceeds 1.96, the spatial autocorrelation is considered statistically significant; conversely, if |Z| is less than 1.96, the observed values are regarded as randomly distributed (Ohana-Levi et al., 2019).
Local spatial autocorrelation analysis can be used to identify spatial clustering patterns within regions (Appice & Malerba, 2014), which are typically categorized into: High–High (H–H), Low–Low (L–L), High–Low (H–L), and Low–High (L–H). Among these, H–H and L–L indicate spatial association in public attention levels, while H–L and L–H reflect spatial heterogeneity. In this study, visual representations of local clustering patterns are generated using GeoDa software to illustrate the spatial distribution and evolution of public attention towards special education.
Forecasting model
(1) SARIMA model
The Autoregressive Integrated Moving Average (ARIMA) model is applied for forecasting non-stationary data in real-world applications (Box et al., 2015). It has been extensively applied across various domains in both the social and natural sciences. The idea of ARIMA is to eliminate local levels or trends in a non-stationary series through differencing, thereby transforming it into a stationary series that can be modeled using an ARMA structure (Fattah et al., 2018). The equation is:
(4)
Here, yt denotes the value of the differenced time series X at time t, μ is the constant term, while p and q indicate the respective orders of the autoregressive (AR) and moving average (MA) components. The term et indicates the error term, γi refers to the autoregressive coefficients, and θi represents the moving average coefficients.
On this basis, the SARIMA model integrates seasonal effects, which is suitable for analyzing and forecasting time series with cyclical temporal behavior (Kumar Dubey et al., 2021). It captures linear and seasonal structures in the data, which are essential for understanding recurring patterns in public attention.
The SARIMA model is usually expressed as SARIMA(p, d, q) × (P, D, Q)s, where p, d, and q correspond to the orders of the non-seasonal autoregressive term, differencing, and moving average term, respectively. Meanwhile, P, D, and Q refer to the seasonal counterparts of these parameters, and s signifies the seasonal cycle length. The equation is:
(5)
In this equation, yt represents the observed value of the time series at time t, and εt corresponds to the white noise at that point in time. The constant term is denoted by c. The operator B is the backshift (or lag) operator, where applying Bs to yt yields yt−s, indicating a shift of s time steps. The terms ϕp(B) and θq(B) refer to the polynomials for the non-seasonal AR and MA components of orders p and q, respectively. Similarly, ΦP(Bs) and ΘQ(Bs) denote the seasonal AR and MA polynomials of orders P and Q, constructed based on the seasonal lag s. The SARIMA framework is defined by seven key parameters: p, d, q, P, D, Q, and s. Selecting suitable values for these parameters is known as the model identification or order selection process.
The construction of a SARIMA model generally follows a sequence of critical steps, including data preprocessing, stationarity assessment, white noise verification, parameter identification, model diagnostics, and ultimately, forecasting. In this study, the Augmented Dickey–Fuller (ADF) test is applied to evaluate the stationarity of the series, while the Ljung–Box Q test is utilized to determine if the model residuals exhibit the characteristics of a white noise process (Paparoditis & Politis, 2018; Hassani & Yeganegi, 2019).
(2) LSTM model
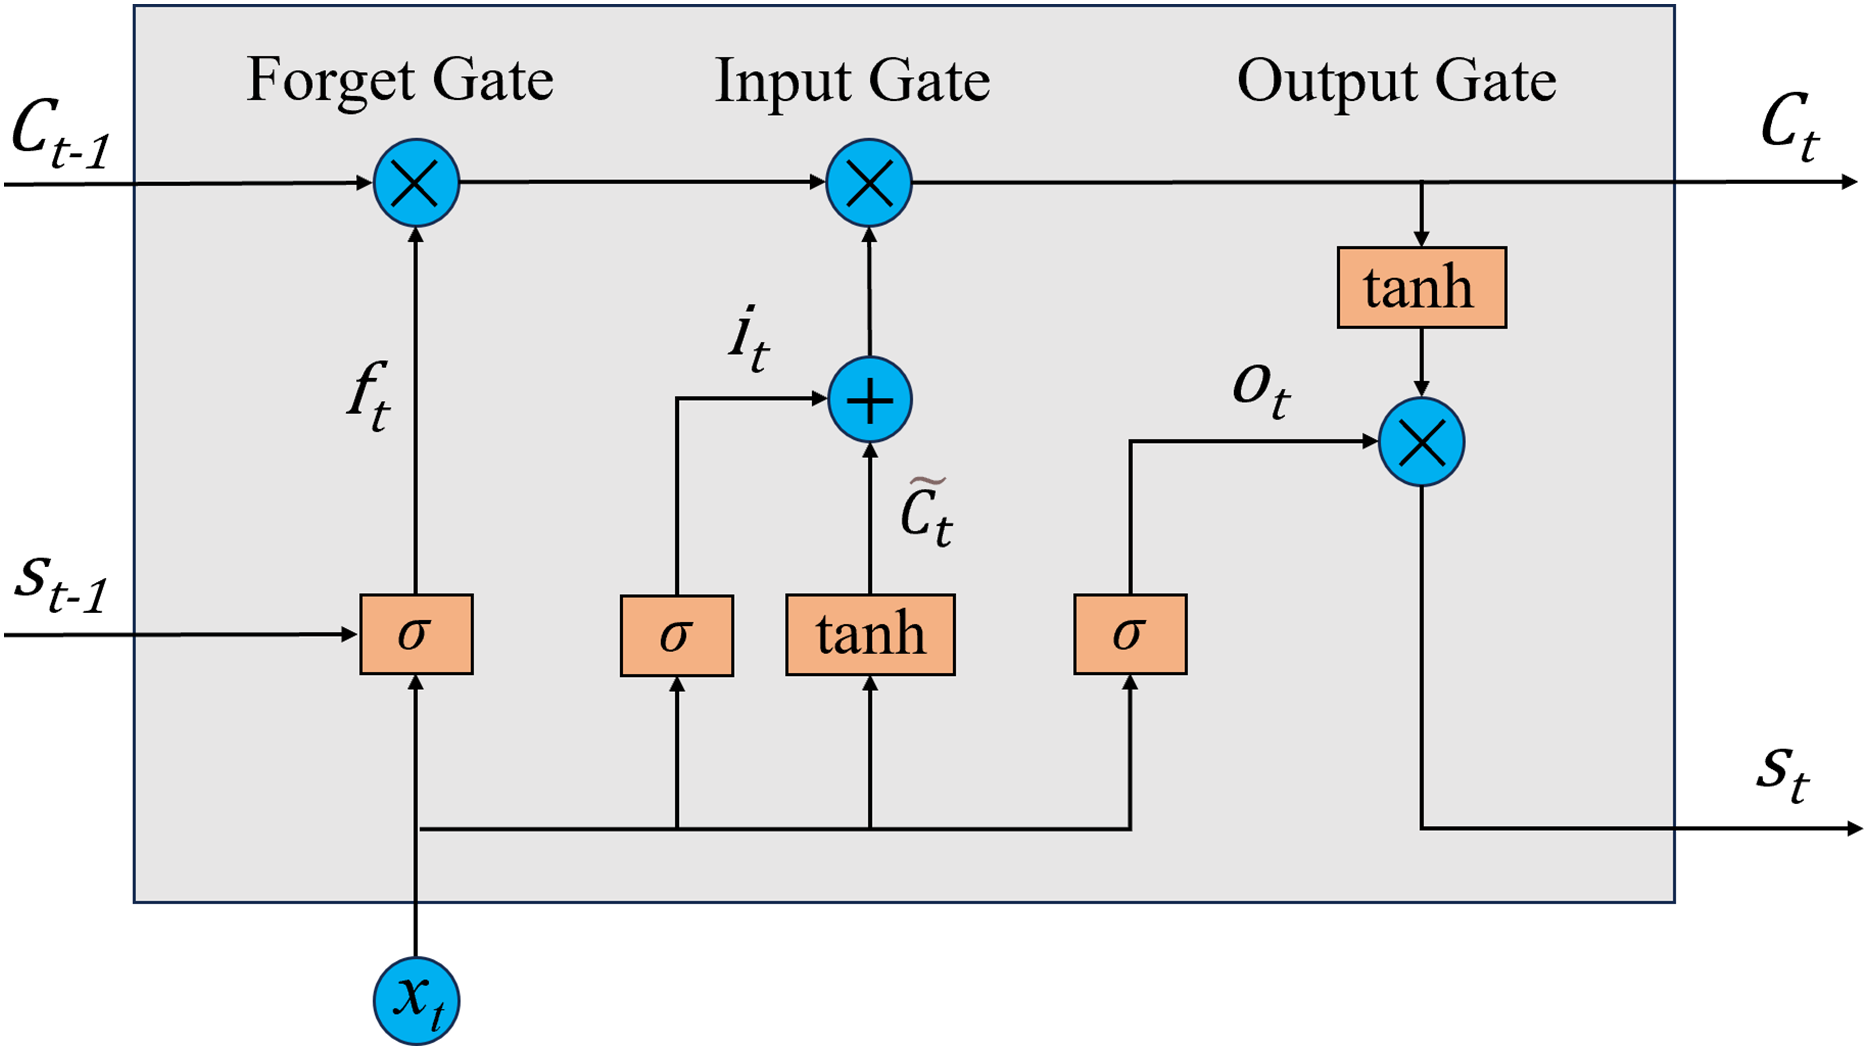
The LSTM network is a type of recurrent neural network (RNN) specifically designed to capture long-term dependencies in sequential data. It incorporates three gating mechanisms—input, forget, and output gates—that regulate information flow and mitigate the vanishing and unstable gradient problems common in conventional RNNs (Gers, Schmidhuber & Cummins, 2000), making it effective for modeling complex, non-linear fluctuations in public attention data.
Its structure processes information from three inputs: the current input (xt), the previous hidden state (st−1), and the previous cell state (Ct−1) (see Fig. 1). Its core components include the input gate (it), forget gate (ft), output gate (ot), and memory cell (Ct). These gates regulate information flow within the network, enabling it to retain essential data and discard irrelevant details, thereby supporting the modeling of long-term dependencies (Sherstinsky, 2020).
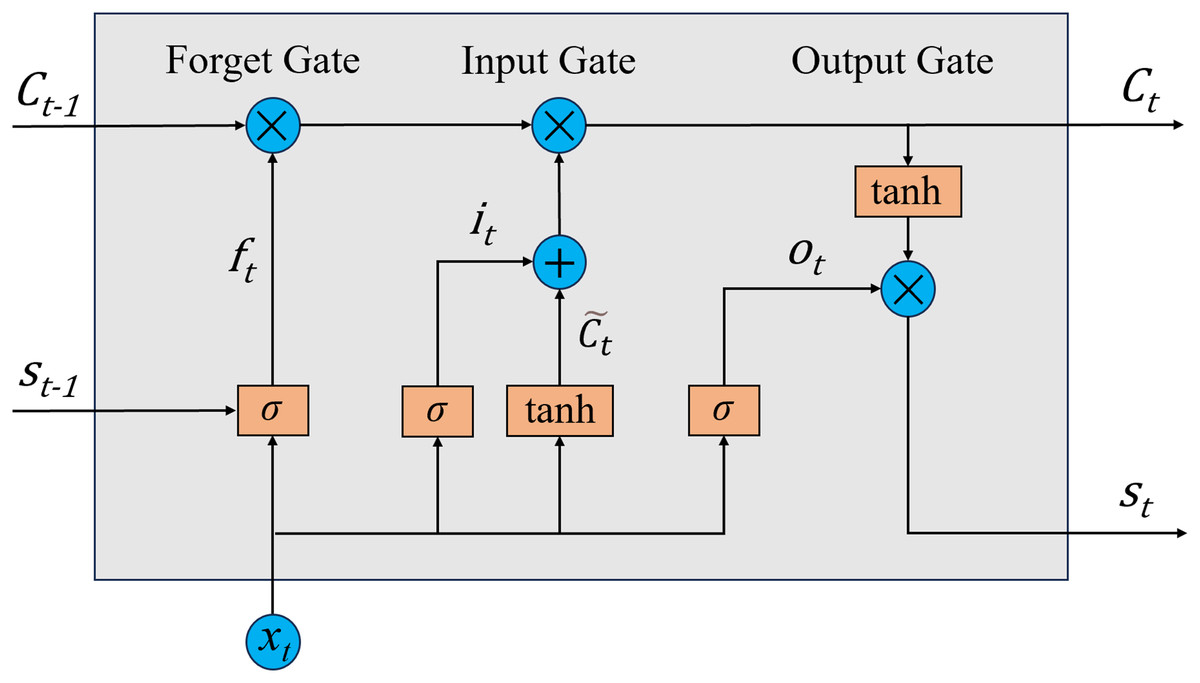
Figure 1: Structure of LSTM model.
The forget gate controls the proportion of past cell state information that is maintained or eliminated. The equation is defined as:
(6)
In this context, σ(·) represents the sigmoid activation function, Wf denotes the weight matrix corresponding to the forget gate, and bf is its associated bias vector.
The input gate determines which new information is added to the cell’s memory. The equation is defined as:
(7)
(8)
In this equation, Wi and Wc denote the weight matrices associated with the input gate and the candidate memory vector, respectively, while bi and bc are their corresponding bias terms. denotes the candidate memory cell state.
The updated cell state Ct is obtained by combining the outputs from the forget gate (ft), input gate (it), and the candidate memory . This process performs a gated update, blending previous memory with newly processed information to support long-term dependency learning. The equation is as:
(9)
The output gate controls what information from the memory cell is sent forward to influence subsequent computations. The equation is given as:
(10)
Here, Wo refers to the weight matrix associated with the output gate, while bo denotes its corresponding bias term.
To produce the hidden state st at the current time step, the model integrates ot with Ct, modulated through a non-linear transformation. This operation determines the information passed on to subsequent time steps or network layers, as described by the following equation:
(11)
(3) SARIMA-LSTM model
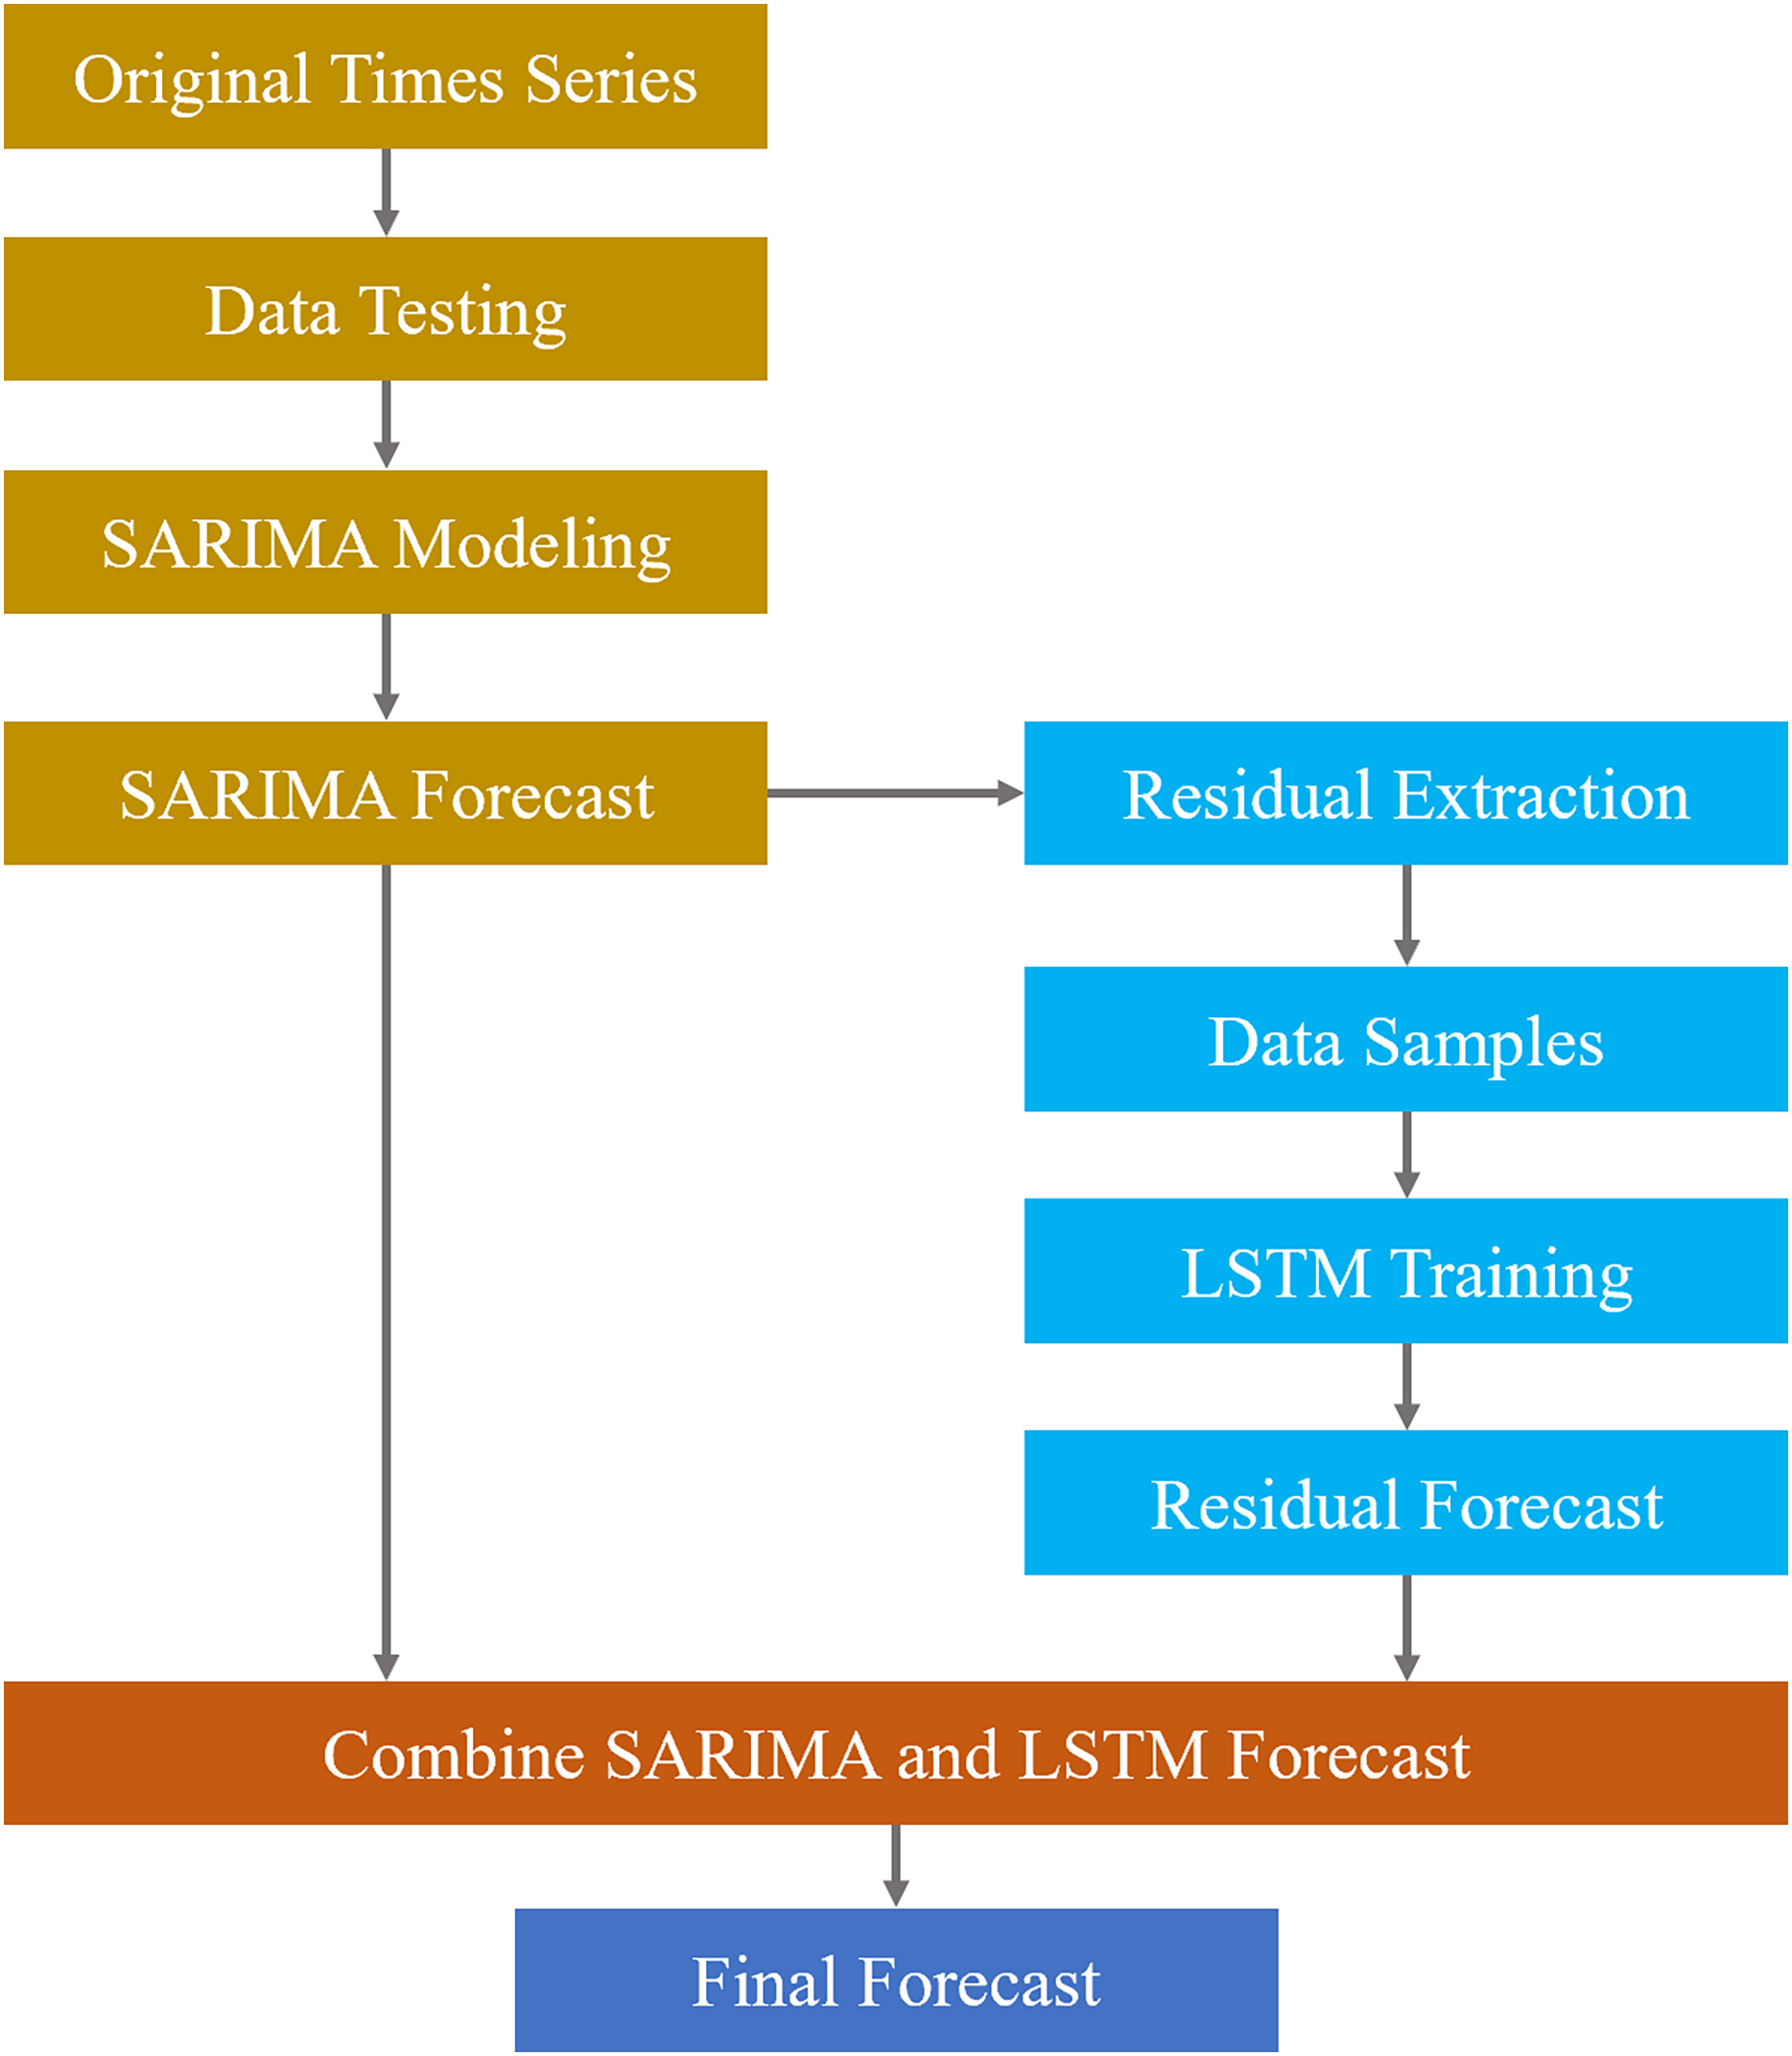
To improve forecasting accuracy, this study constructs a model that combines the SARIMA with LSTM. This integrated approach is designed to address the limitations of using a single forecasting model (Peirano, Kristjanpoller & Minutolo, 2021). The SARIMA-LSTM model has been shown to produce more robust and accurate results across various application domains (Bilgili, Pinar & Durhasan, 2025).
Figure 2 illustrates the key steps of the workflow, including data preparation, data testing, SARIMA modeling and forecasting, residual extraction, LSTM modeling of the residual series, and the final combination of outputs to produce the complete forecast.
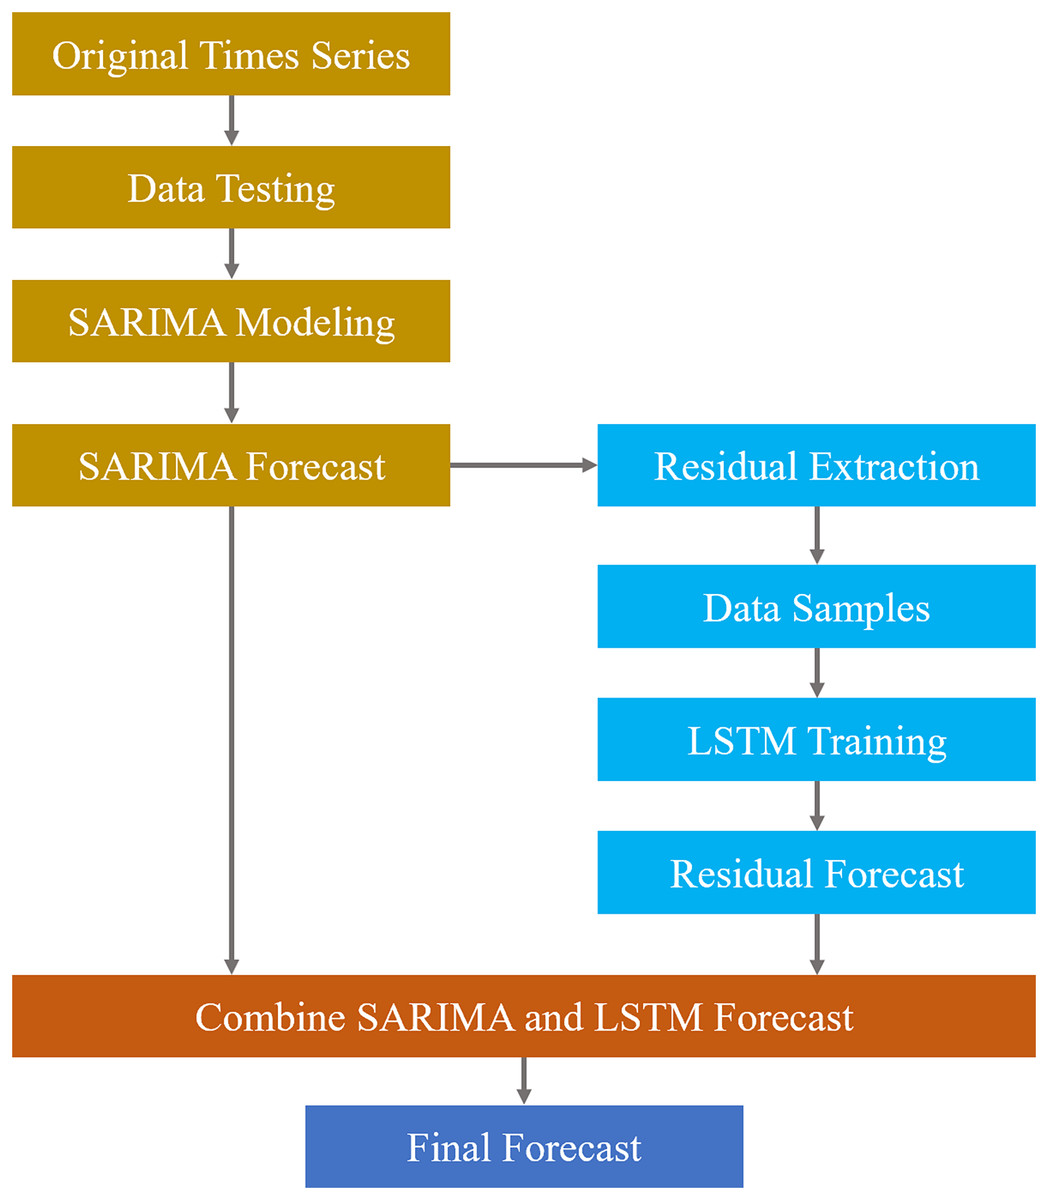
Figure 2: Workflow of the SARIMA-LSTM model.
(4) Model evaluation
To provide a clear understanding of each method, a brief comparison is offered: ARIMA is simple and interpretable but performs poorly with seasonality and non-linear patterns; SARIMA captures seasonality and improves accuracy over ARIMA yet remains less effective for abrupt or complex non-linear changes; and SARIMA-LSTM handles both seasonal and non-linear dynamics, commonly achieving the highest accuracy though with greater computational cost.
The reliability of forecasting results is largely evaluated by comparing forecast values with actual observations. To evaluate the effectiveness of the model, a set of commonly used metrics is applied, including mean absolute percentage error (MAPE), root mean squared error (RMSE), directional accuracy (DA), and the coefficient of determination (R2) (Vivas, Allende-Cid & Salas, 2020; Chicco, Warrens & Jurman, 2021). These indicators provide quantitative insight into the precision, consistency, and trend-following ability of the forecasting model. The equations are:
(12)
(13)
(14)
where,
(15)
In these equations, n refers to the total number of observations. The symbols yi and represent the actual and forecast values for the i-th data point, respectively, while yi−1 and correspond to the actual and forecast values from the previous time step (i−1). The term ȳ indicates the average of all actual values in the dataset. Lower values of MAPE and RMSE indicate better forecasting performance. A DA value closer to 1 suggests that the model more accurately captures the direction of change in comparison to the actual observations.
In this study, MAPE and RMSE indicate the magnitude of forecast errors, with lower values reflecting higher accuracy. DA measures the proportion of correctly predicted directional changes, which is important for timely policy responses to shifts in public attention. R2 reflects how well the model explains variability in the observed data, indicating its explanatory power. Together, these metrics provide a balanced evaluation of forecasting precision, trend detection, and practical applicability for decision-making in educational policy.
Results
Temporal evolution of public attention
Yearly variation analysis
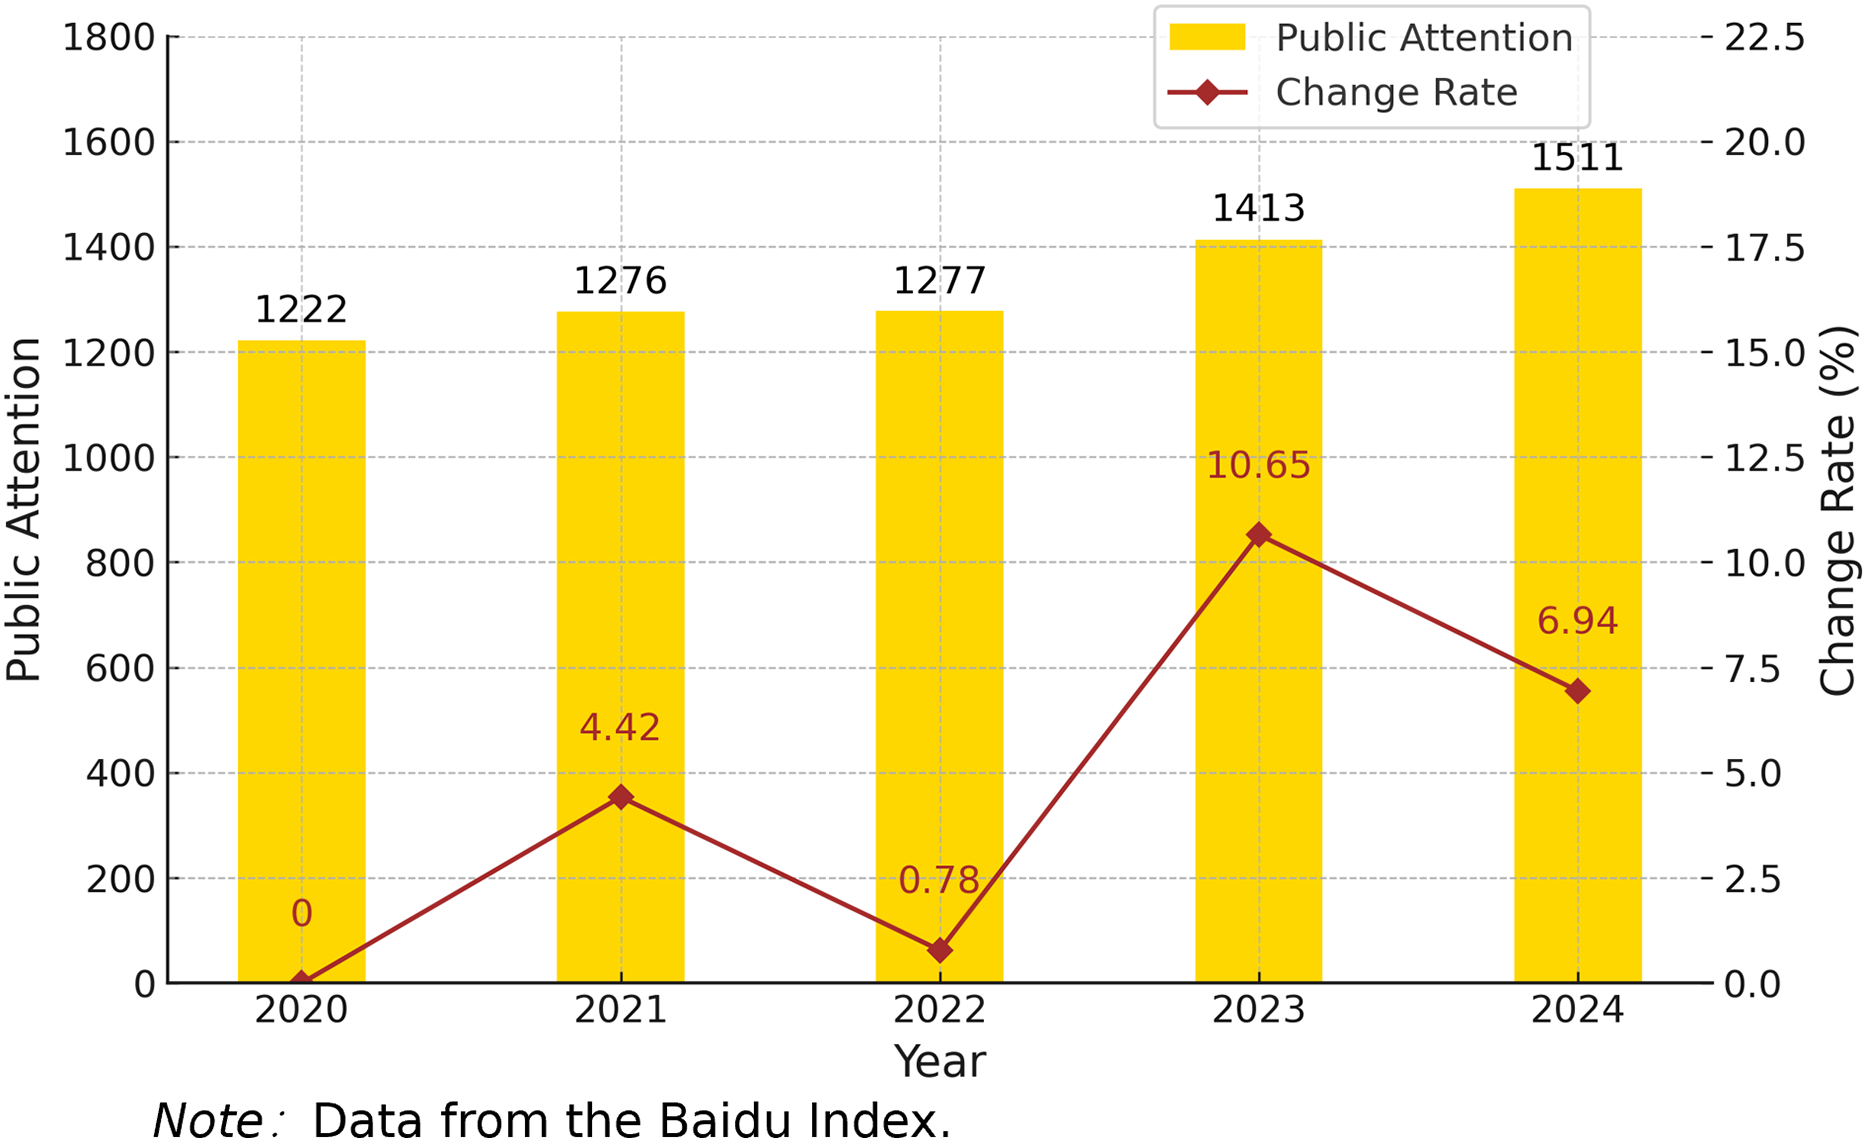
The yearly variation in public attention to special education from 2020 to 2024 shows a steady upward trend overall (see Fig. 3). The annual average value increased from 1,222 in 2020 to 1,277 in 2022, with relatively modest growth rates of 4.42% and 0.78%, respectively, indicating a period of relative stability in public interest. A significant increase was observed in 2023, with the annual average rising to 1,413, representing the highest growth rate over the 5 years at 10.65%, possibly driven by policy initiatives or concentrated media coverage. In 2024, although the growth rate declined modestly to 6.94%, public attention to special education continued to stay at a relatively high level. This trend reflects a sustained increase in societal concern for special education in recent years, with a particularly notable surge beginning in 2023. Such a pattern offers a solid data foundation for developing forecasting models and the formulation of relevant policy interventions.
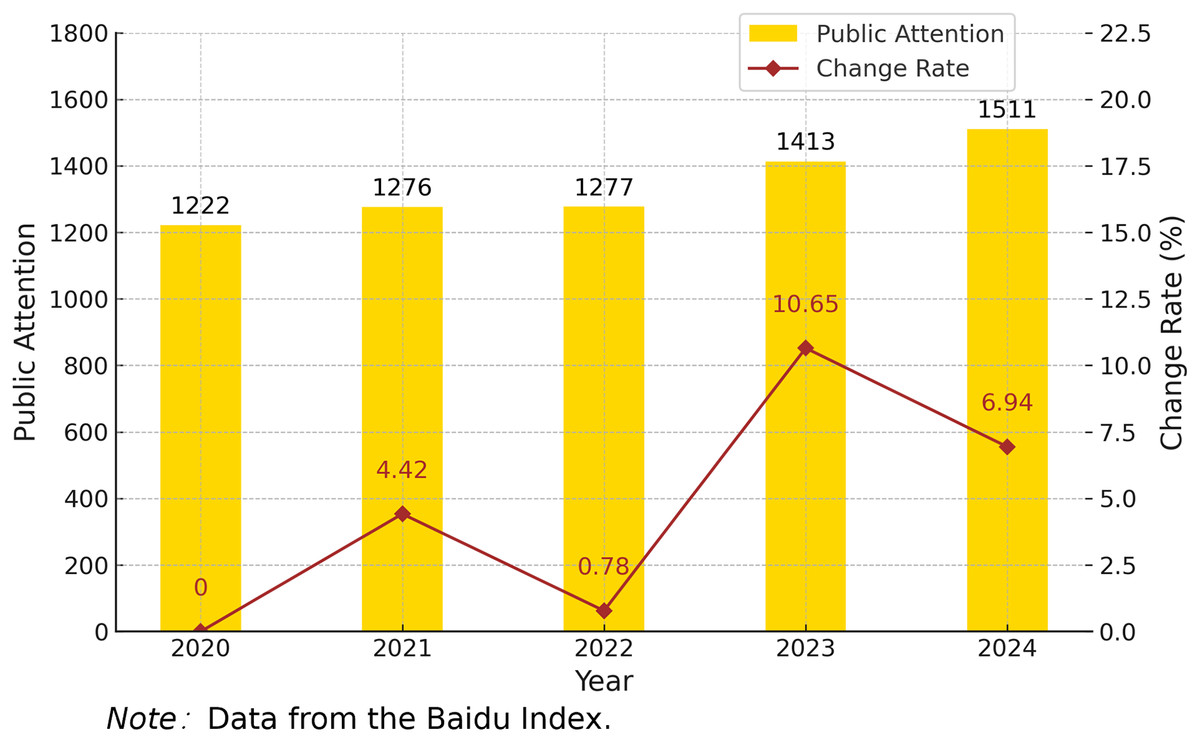
Figure 3: Yearly public attention to China’s special education (2020–2024).
To examine the temporal pattern of public attention to special education between 2020 and 2024, an ordinary least squares (OLS) regression analysis was performed. The regression yielded a coefficient of 71.5, with an R2 of 0.904 and a p-value of 0.0131, demonstrating a statistically meaningful upward trend at the 5% level. These results provide strong evidence of a consistent rise in public concern over the 5 years. Fluctuations in the annual growth rate may reflect the impact of various factors, including policy developments, major social events, and intensified media exposure. Future studies could delve deeper into these dynamics to better understand their effects and improve the ability to anticipate and respond to shifts in public engagement.
Monthly variation analysis
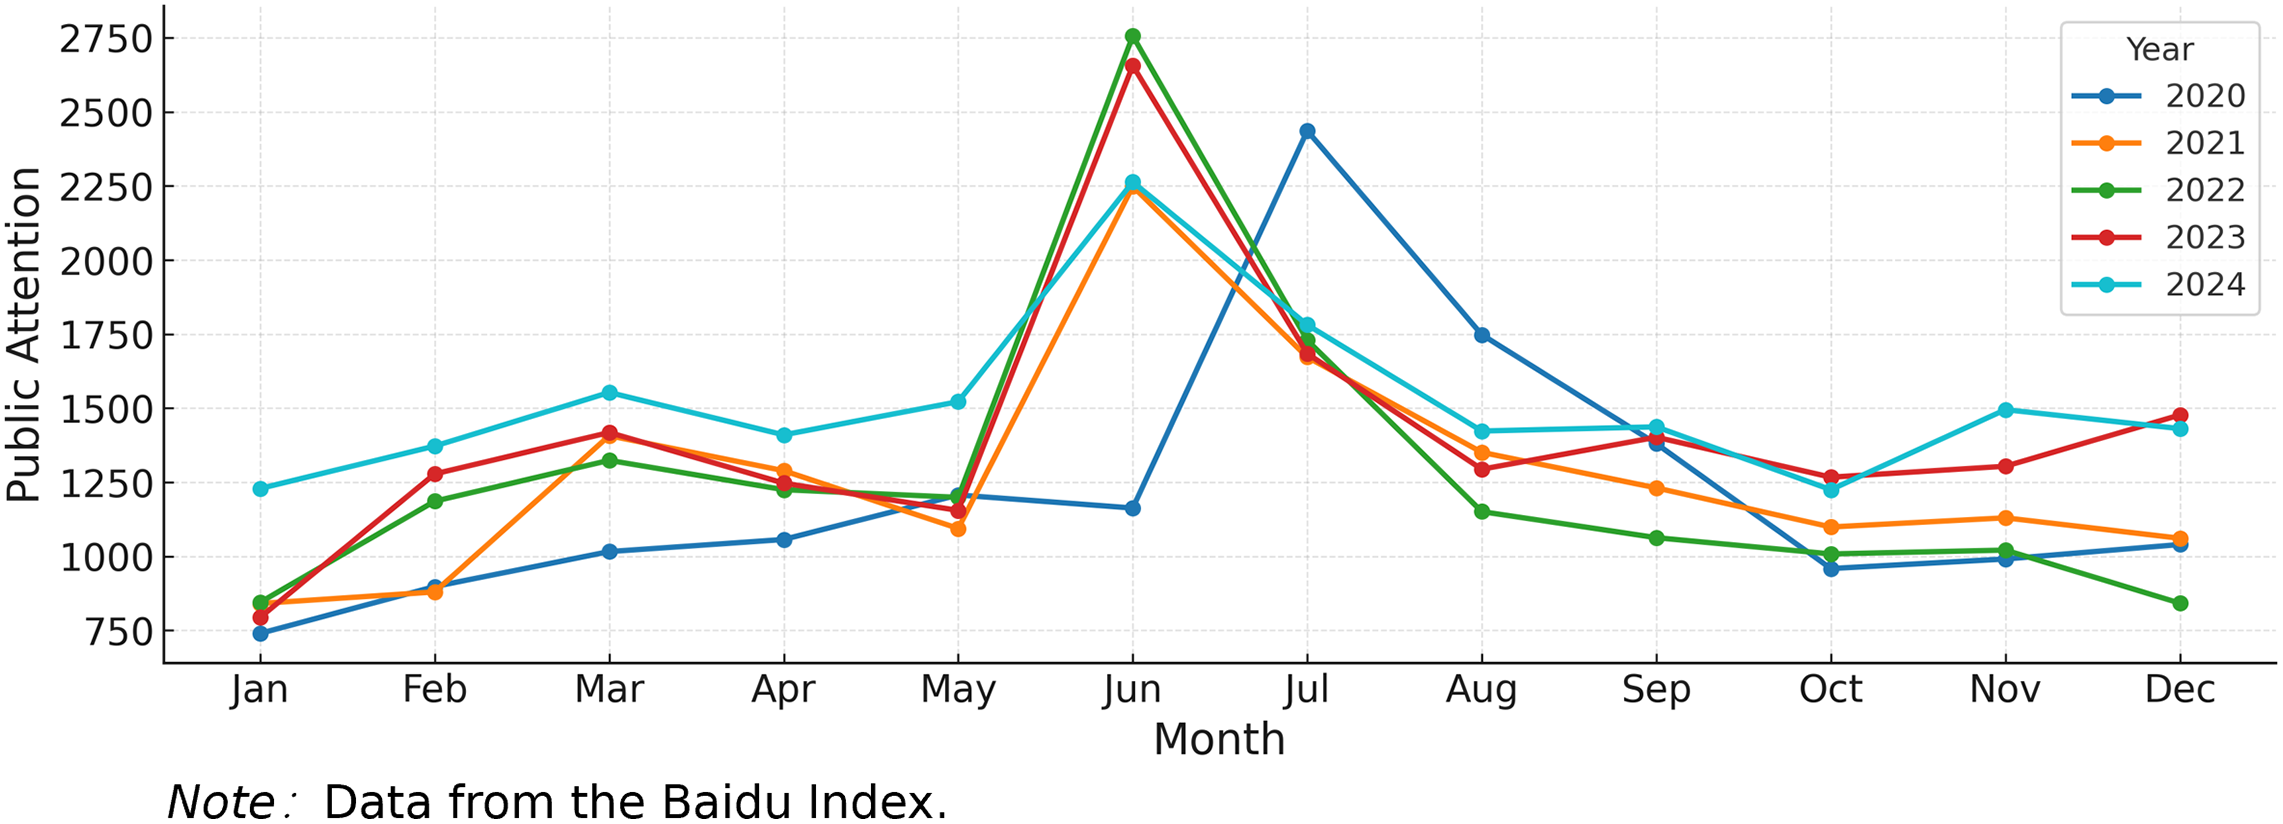
Figure 4 presents the monthly variation in public attention to special education in China during the period from 2020 to 2024. This forms a distinctive trend marked by a rapid increase in attention, immediately succeeded by a sharp drop, an annual rhythm that remains consistent throughout the observed period. A comparison of the monthly curves across different years shows that, despite varying annual contexts, public interest generally increases steadily from January to May, reaches its peak in June, declines during the July to September period, and in some years experiences a slight rebound after October. Notably, while the peak in 2020 occurred in July, the peaks from 2021 to 2024 consistently appeared in June, aligning with the timing of the national college entrance examination (Gaokao) in those years. These peaks also coincide with related events such as national policy announcements and the release of education-related reports, which may temporarily intensify public interest.
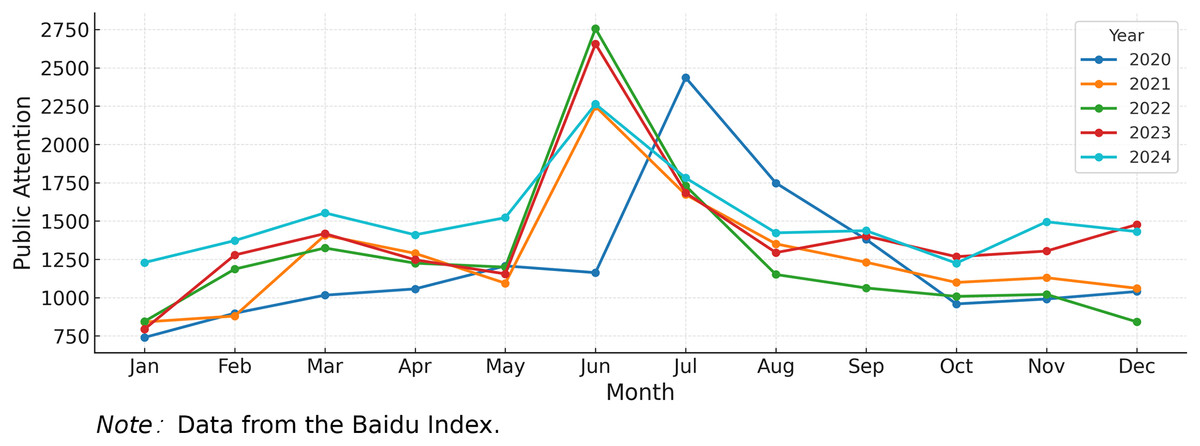
Figure 4: Monthly public attention to China’s special education (2020–2024).
This structural fluctuation reflects the concentrated impact of specific events such as policy announcements, school entry assessments, and focused media campaigns. It also highlights the influence of public discourse and communication rhythms in driving attention. These observed trends provide a theoretical foundation for forecasting models such as SARIMA and SARIMA-LSTM, supporting the improvement of timeliness in educational communication and the scientific allocation of resources.
To investigate the trend over time, a regression model was fitted using the OLS approach. The results yielded an R2 value of 0.008, a regression coefficient of 2.19, and a p-value of 0.495. These findings reveal that public attention has exhibited only a marginal upward trend over time, indicating a lack of statistical significance (p = 0.495 > 0.05). Public attention appears to vary without following a clear upward or downward linear pattern. Instead, it reflects fluctuations primarily driven by seasonal factors or specific annual events, rather than a monotonic temporal evolution.
Temporal evolution of public attention
Spatial distribution analysis
Based on Baidu Index data from 2020–2024, public attention to special education shows significant spatial disparities across Chinese provinces. Five provinces (Guangdong, Shandong, Zhejiang, Jiangsu, and Sichuan) recorded average values above 300, while regions such as Hainan, Ningxia, Qinghai, and Xizang remained below 100. Using the quartile method (Xu et al., 2024), attention values were classified into four levels: Level I (high) ranges from 262 to 399; Level II (relatively high) from 201 to 261; Level III (relatively low) from 166 to 200; and Level IV (low) from 15 to 165. Spatial distribution maps of attention levels across 31 provinces were generated using ArcGIS and Dycharts (see Fig. 5).
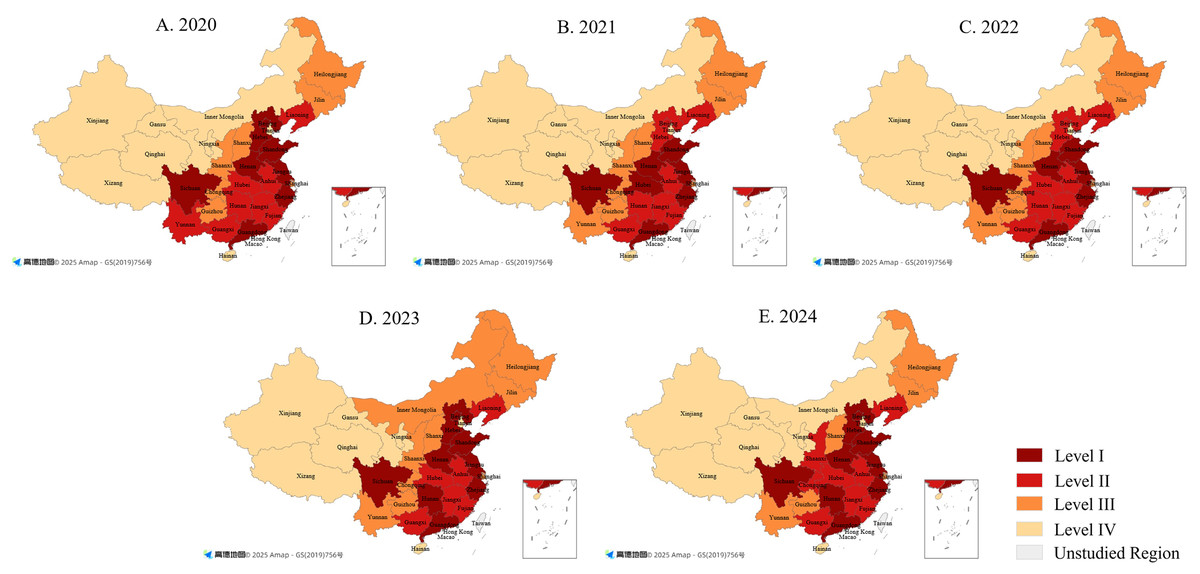
Figure 5: Spatial distribution patterns of public attention to China’s special education (2020–2024).
(A) 2020; (B) 2021; (C) 2022; (D) 2023; (E) 2024. Base maps sourced from Amap (© 2025 Amap), generated using Dycharts, and modified by the authors for academic publication.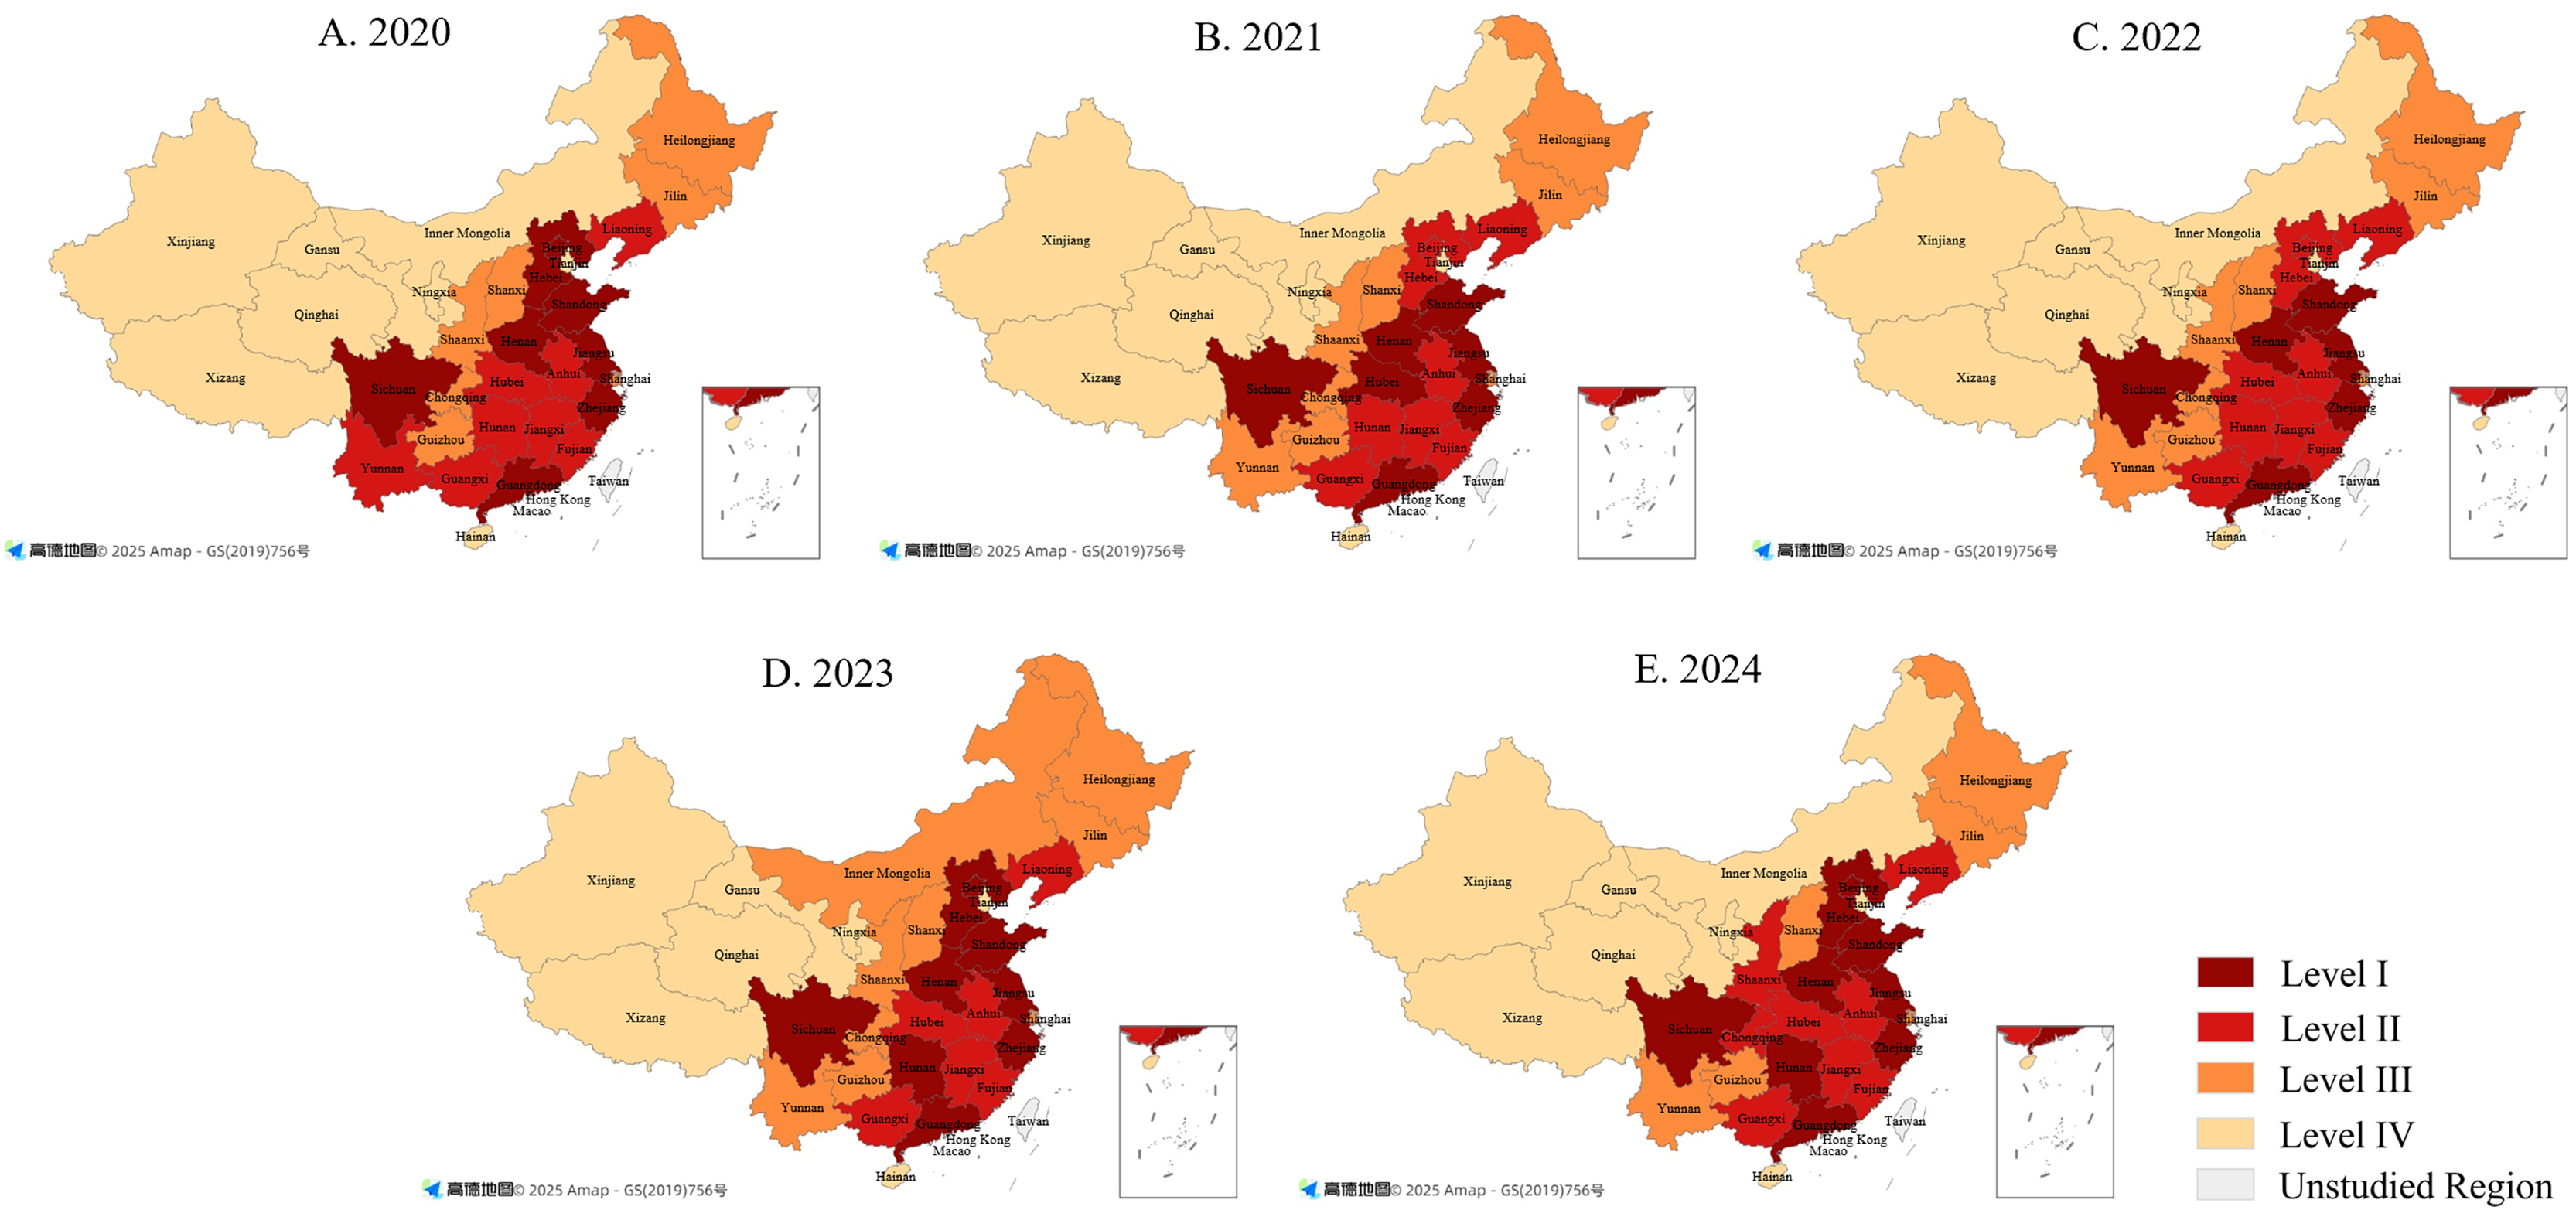
The map highlights pronounced disparities and evolutionary trends in public attention between 2020 and 2024. Higher levels are concentrated in the eastern and central regions, while lower levels are typical of western and peripheral provinces, reflecting the influence of economic development and population distribution.
Level I provinces are mainly found in the eastern coastal and central regions, including Guangdong, Jiangsu, Zhejiang, Shandong, Sichuan, and Henan. By contrast, Level IV regions such as Xizang, Xinjiang, Qinghai, and Ningxia remain at the lowest levels of attention. Provinces in Levels II and III, mostly in central and western China, show moderate levels with gradual improvement in some cases, such as Shaanxi. Sichuan stands out in the west, reflecting strong information sharing and active public engagement, while Henan, with its large population, shows a broad base of awareness. In comparison, Xizang and Xinjiang show little growth, which may be linked to smaller populations, lower internet access, and fewer educational resources.
Overall, the spatial pattern can be described as “higher in the east, lower in the west.” To narrow this gap, more efforts should be directed to western regions by improving internet access, distributing educational resources more fairly, and strengthening advocacy for special education. These measures would help promote balanced regional development of inclusive education.
Spatial correlation analysis
Based on Eqs. (1) and (3), the global spatial autocorrelation of public attention to special education across 31 provinces from 2020 to 2024 was calculated and tested for statistical significance (see Table 1). The results show that spatial correlation first increased and then declined. Moran’s I reached its highest values in 2021 and 2022 (above 0.22, p < 0.05), indicating clear positive spatial autocorrelation, but fell afterwards and was no longer significant in 2024. This points to a shift from regional concentration to a more balanced national distribution, likely supported by wider information channels and growing awareness campaigns.
| Year | Global Moran’s I | Z-score | p-value |
|---|---|---|---|
| 2020 | 0.1541 | 1.5613 | 0.0660 |
| 2021 | 0.2305 | 2.2269 | 0.0190 |
| 2022 | 0.2272 | 2.1908 | 0.0210 |
| 2023 | 0.1697 | 1.7083 | 0.0490 |
| 2024 | 0.1271 | 1.3295 | 0.0990 |
Local Moran’s I analysis shows further changes in clustering (see Fig. 6). H–H clusters were mainly found in eastern and central provinces such as Shandong, Jiangsu, and Anhui, but by 2024 Jiangsu had dropped out of this group, suggesting weaker clustering as national attention became more balanced. L–L clusters continued in western provinces such as Xinjiang and Gansu, though Qinghai moved out of this category in 2024, showing some improvement in public awareness. Sichuan consistently displayed an H–L pattern, reflecting its strong influence compared with neighboring provinces. In contrast, Shanghai and Hainan at times showed L–H clustering, meaning lower attention than nearby regions.
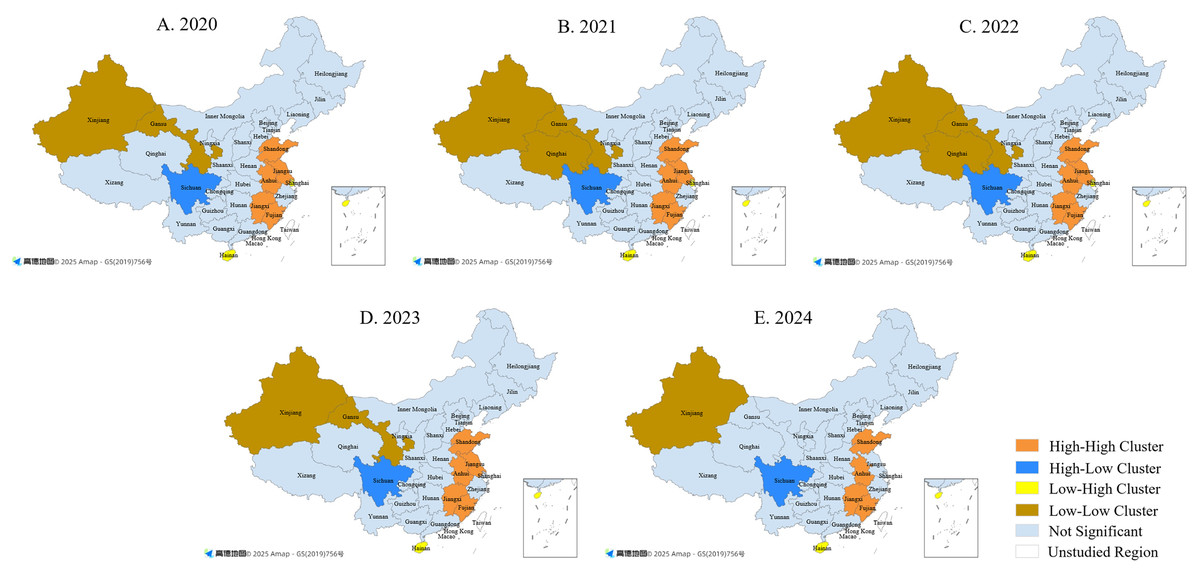
Figure 6: Local spatial correlation of public attention to China’s special education (2020–2024).
(A) 2020; (B) 2021; (C) 2022; (D) 2023; (E) 2024. Base maps sourced from Amap (© 2025 Amap), generated using Dycharts, and modified by the authors for academic publication.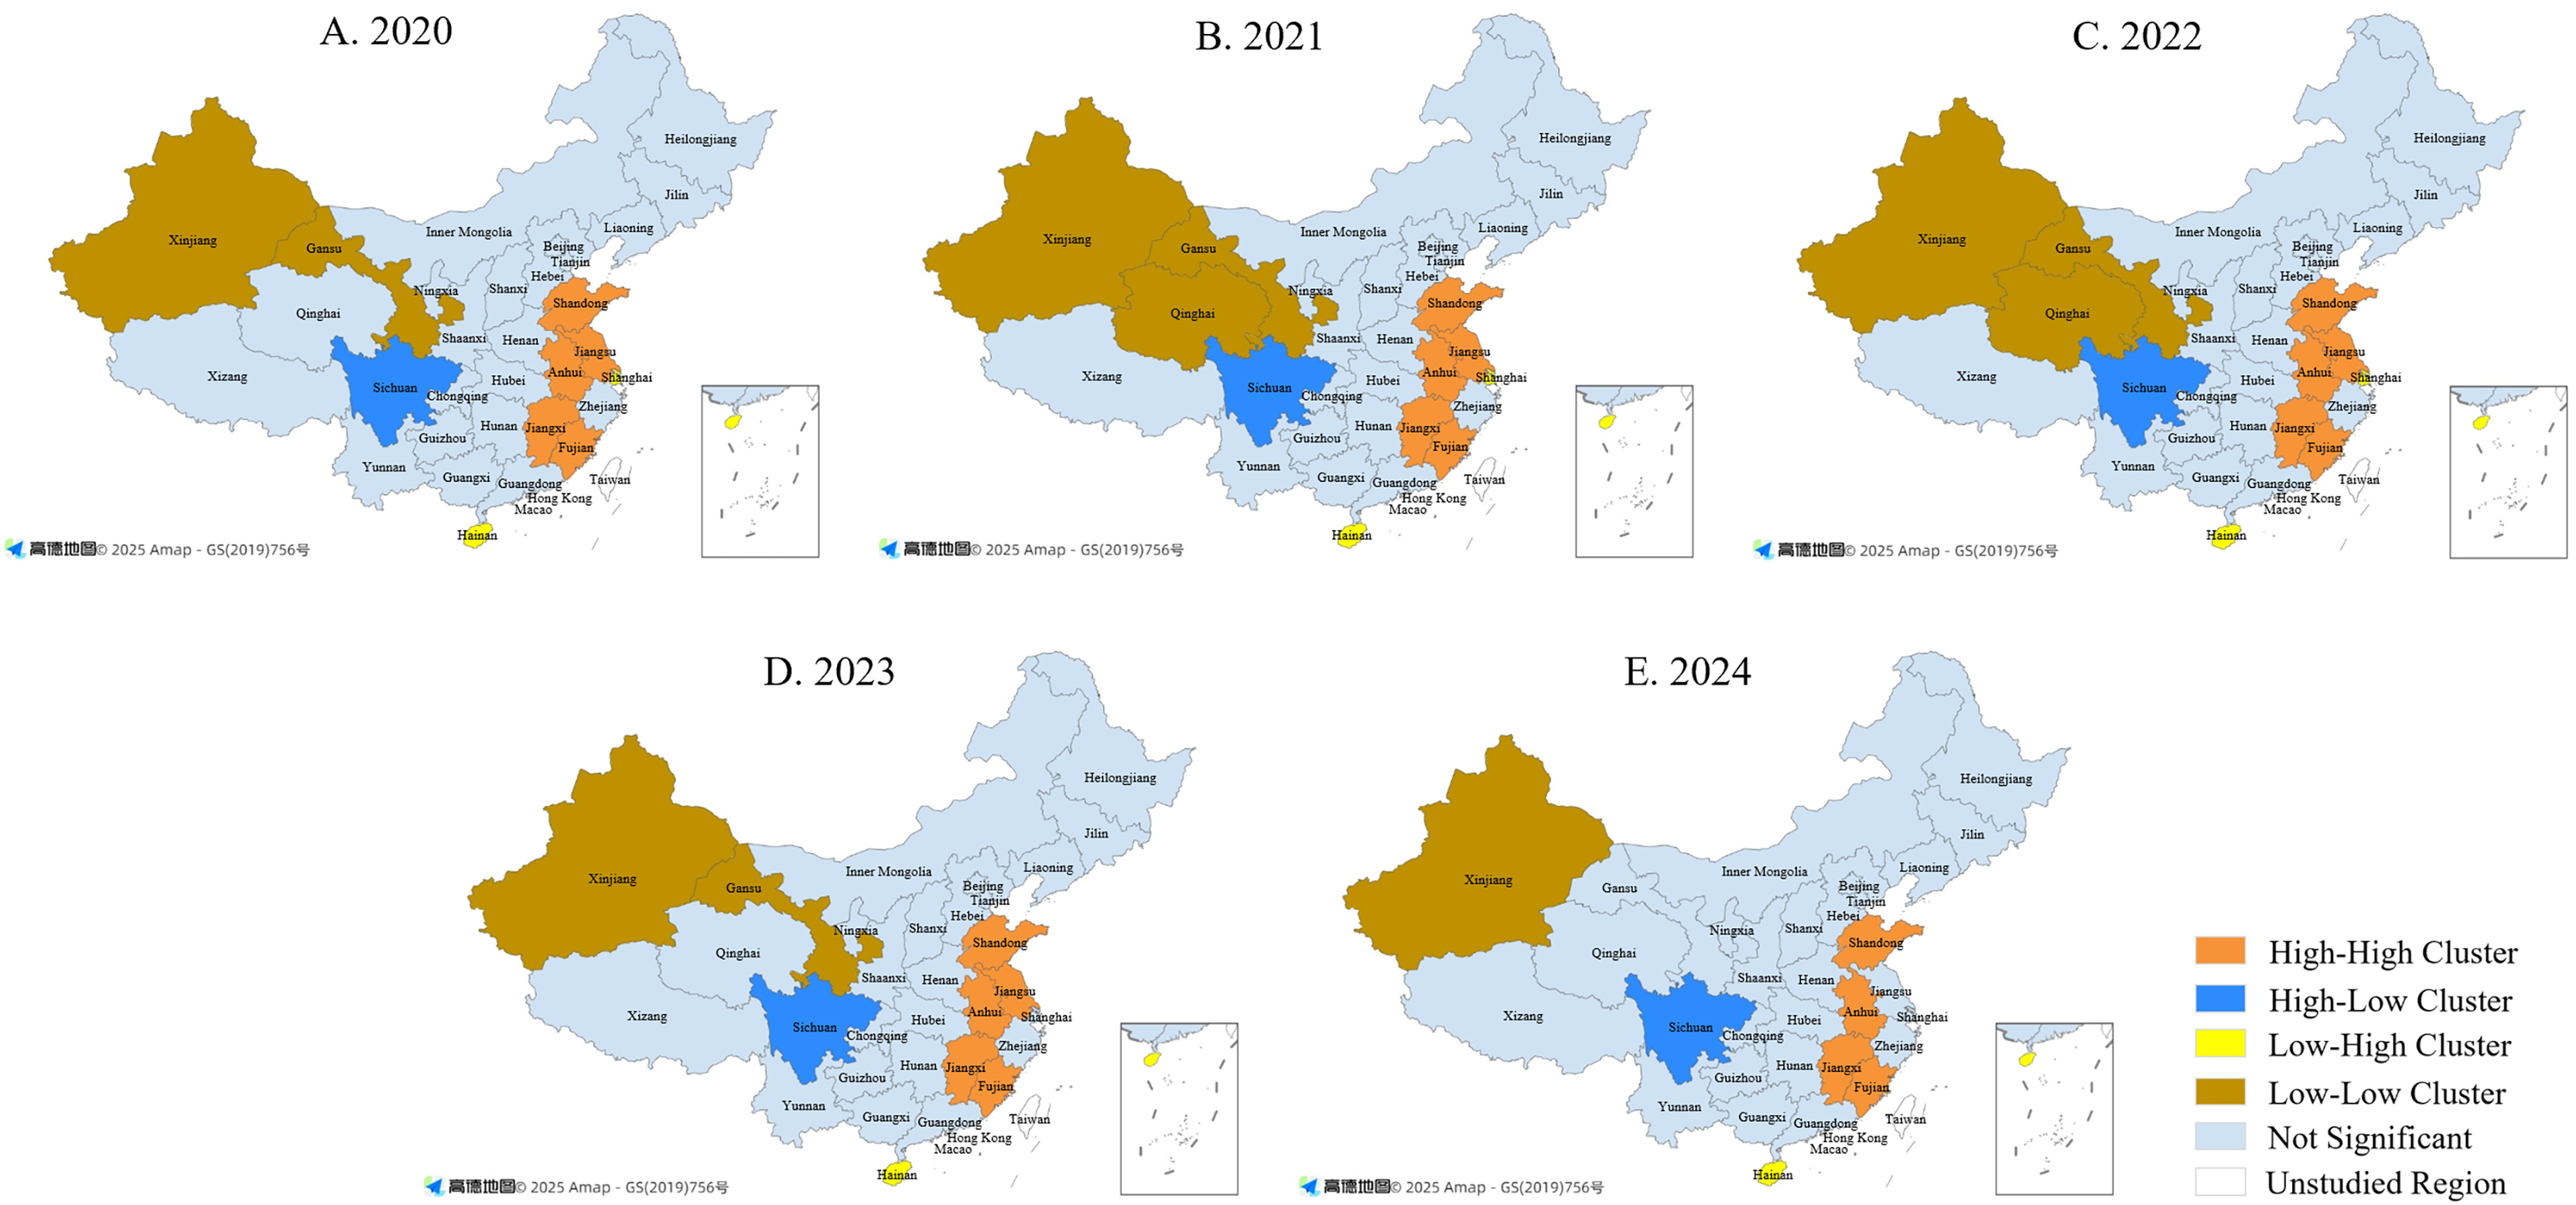
Overall, both high-value and low-value clusters have contracted over the past 5 years, suggesting a gradual shift toward spatial balance in public attention. Nevertheless, regional gaps remain: western provinces continue to lag, while key provinces such as Sichuan maintain a leading role. Future policies should provide greater support to low-attention regions by expanding awareness programs and ensuring fairer access to resources, thereby promoting more balanced development of special education nationwide.
Forecasting model of public attention
Stationarity test
The dataset from January 2020 to December 2023 was used for model training, while data from January to December 2024 served as the validation set for assessing forecasting performance. The ADF test was applied to assess the stationarity of the time series reflecting public attention to special education (see Table 2, Fig. 7). The test statistic was below the critical threshold at all conventional significance levels, with a p-value less than 0.05. This result supports the rejection of the unit root hypothesis, confirming that the series is stationary during the training period and does not require differencing.
| Statistic | P-value | Critical value | ||
|---|---|---|---|---|
| 1% | 5% | 10% | ||
| −4.01 | 0.00136 | −3.616 | −2.941 | −2.609 |
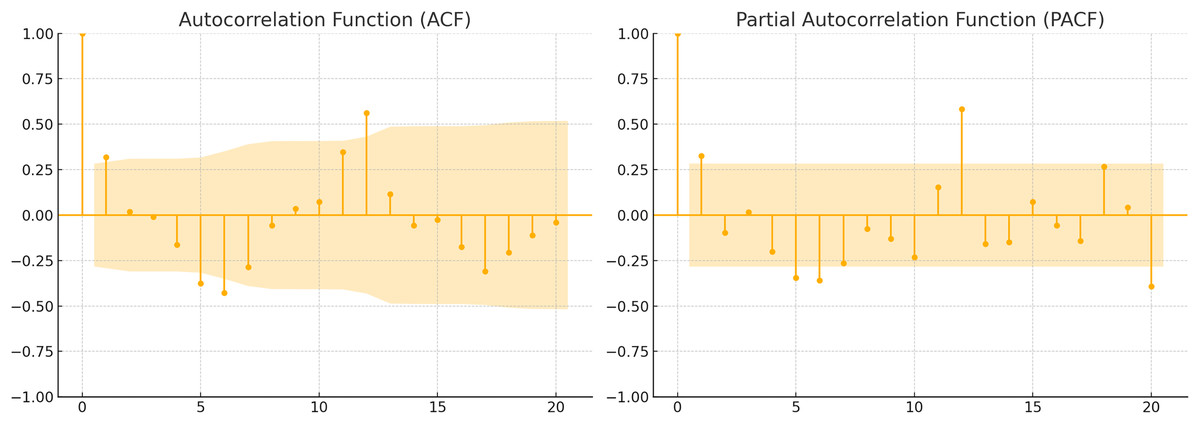
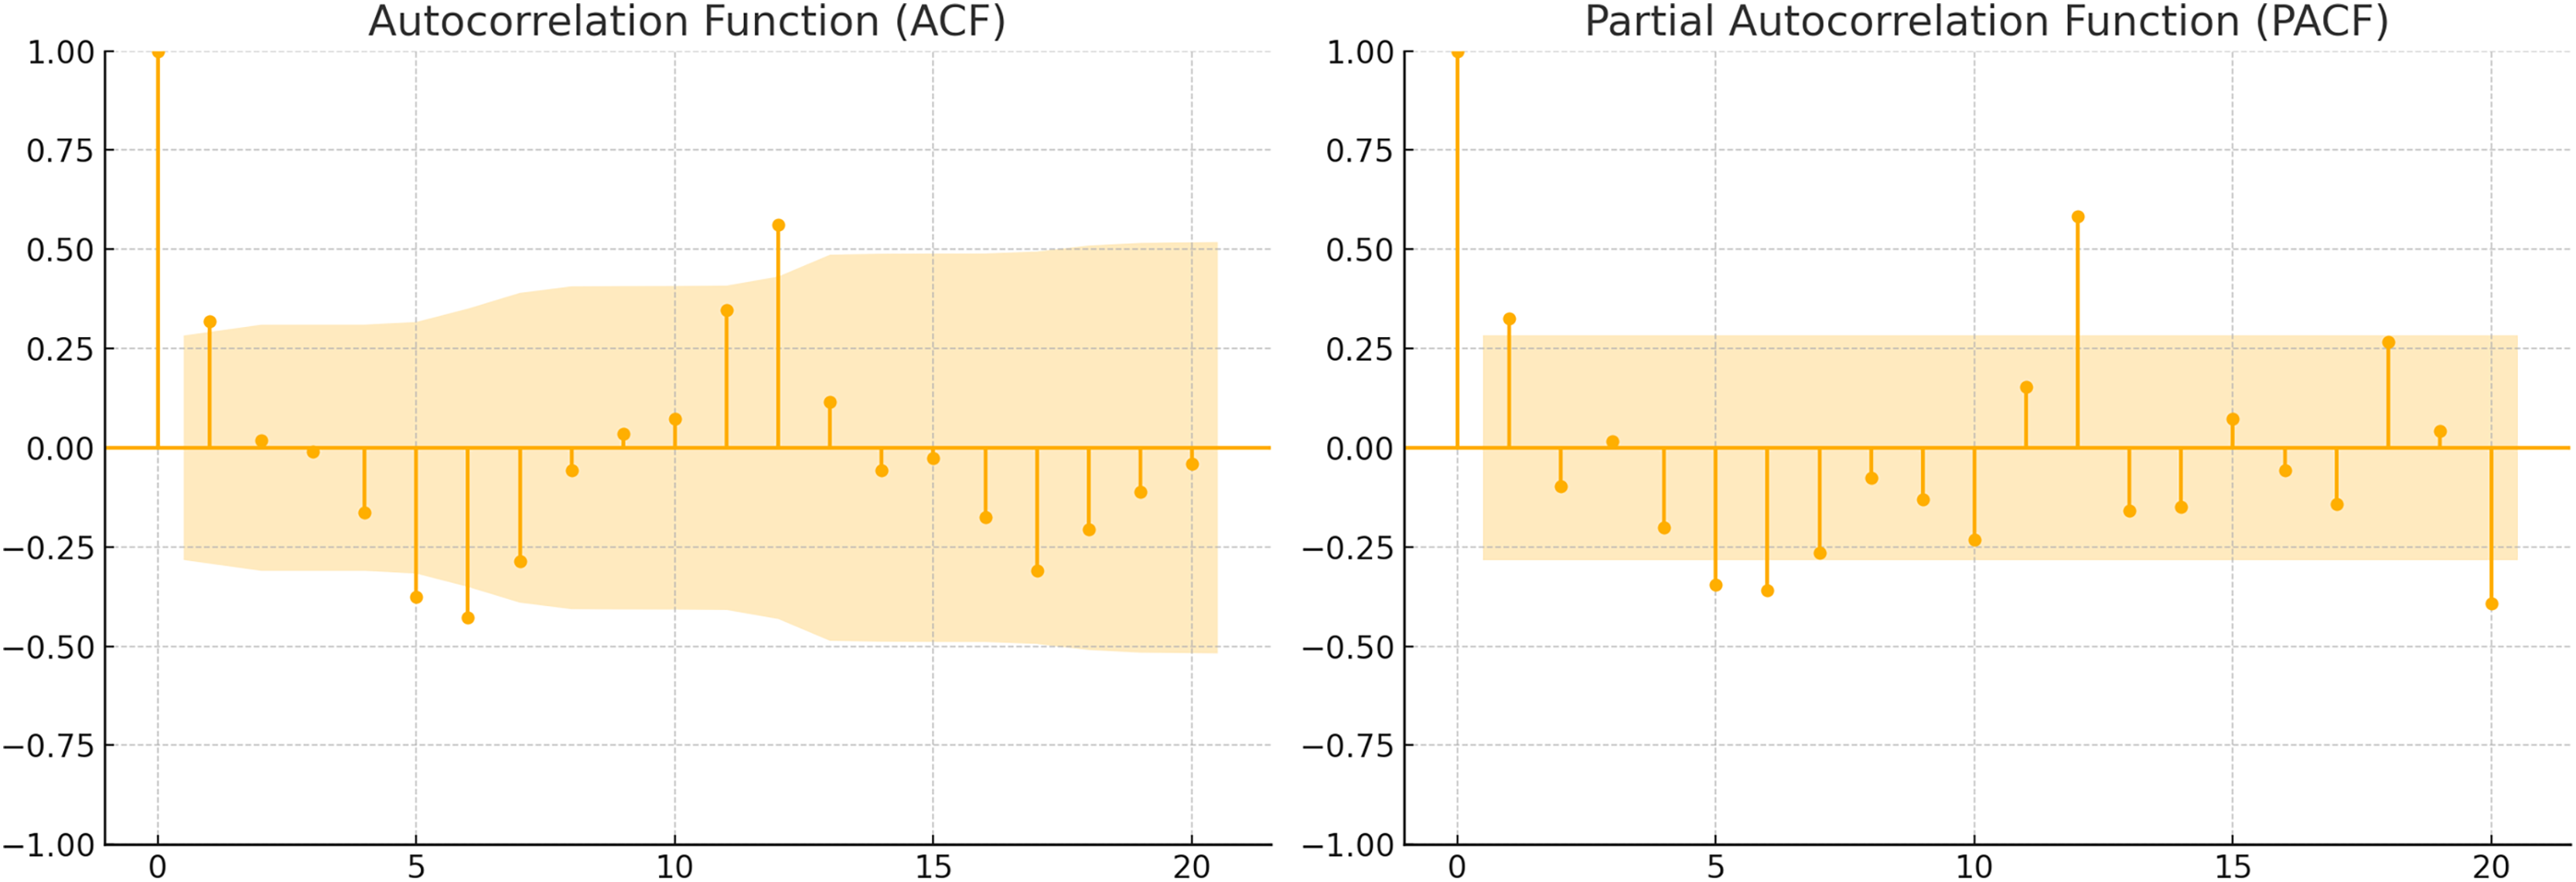
Figure 7: ACF and PACF of time series.
Figure 7 illustrates the autocorrelation function (ACF) and partial autocorrelation function (PACF) of the time series. The ACF reveals a gradual decline over time, whereas the PACF displays a sharp drop after the initial lags. This implies that the series is influenced by both seasonal cycles and short-term dependencies. Together with the ADF test results, these patterns provide clear guidance for model parameter selection and confirm that the series meets the basic conditions for SARIMA modeling.
SARIMA model construction
An initial examination of the time series data on public attention to special education indicates that the prerequisites for applying the SARIMA model are met. As such, the differencing order d is set to 0, and the seasonal period s is defined as 12. The MAPE is used as the evaluation metric, as it is a measure that intuitively captures relative forecasting errors. A model with a smaller MAPE is considered to have superior forecasting accuracy and is therefore more suitable for future forecasting and analysis.
This study applied a grid search approach to systematically explore all possible parameter configurations, selecting values of P, D, Q, and s based on the minimum MAPE. The results indicate that the SARIMA (2, 0, 1) × (1, 0, 0)12 model yields the lowest MAPE value and is thus chosen as the optimal model for forecasting public attention to special education.
The Ljung Box Q test was applied to the standardized residuals of the fitted model. At a lag of 12, the test produced a p-value of 0.890, which exceeds the 0.05 significance threshold. This outcome indicates that the null hypothesis, stating that the residuals follow a white noise process, cannot be rejected. As a result, there is no evidence of autocorrelation remaining in the residuals, suggesting that the model is correctly specified.
SARIMA-LSTM model construction
Although the SARIMA model effectively captures both trend and seasonal components, its residual series still exhibits certain non-linear fluctuations. To further improve forecasting accuracy, the residuals from the SARIMA model are treated as a new time series and used as input for non-linear modeling through an LSTM neural network. Table 3 summarizes the LSTM model settings.
| Category | Parameter | Value |
|---|---|---|
| Input configuration | Input feature dimension | 1 |
| Window size | 3 | |
| Network architecture | Number of layers | 1 |
| Number of units | 64 | |
| Activation function | ReLU | |
| Output layer structure | Dense (1) | |
| Training settings | Number of epochs | 100 |
| Optimizer | Adam | |
| Loss function | MSE (Mean squared error) | |
| Normalization method | Feature scaling | Min-Max scaling |
| Output type | Forecast type | Single-step forecasting |
Upon completion of model training, the LSTM network was used to forecast the monthly residuals for 2024. These forecast residuals were subsequently combined with the SARIMA model’s forecasts to produce the final SARIMA-LSTM forecasting results. The standardized residuals from the hybrid model were tested using the Ljung Box Q test at lag 12, yielding a p-value of 0.831. Given that this value is well above the 0.05 significance threshold, the result does not provide sufficient statistical grounds to refute the null assumption. This suggests that the error terms behave similarly to a white noise process, with no detectable signs of strong autocorrelation. As a result, the model can be considered well-specified, with no apparent structural deficiencies, and is suitable for reliable forecasting.
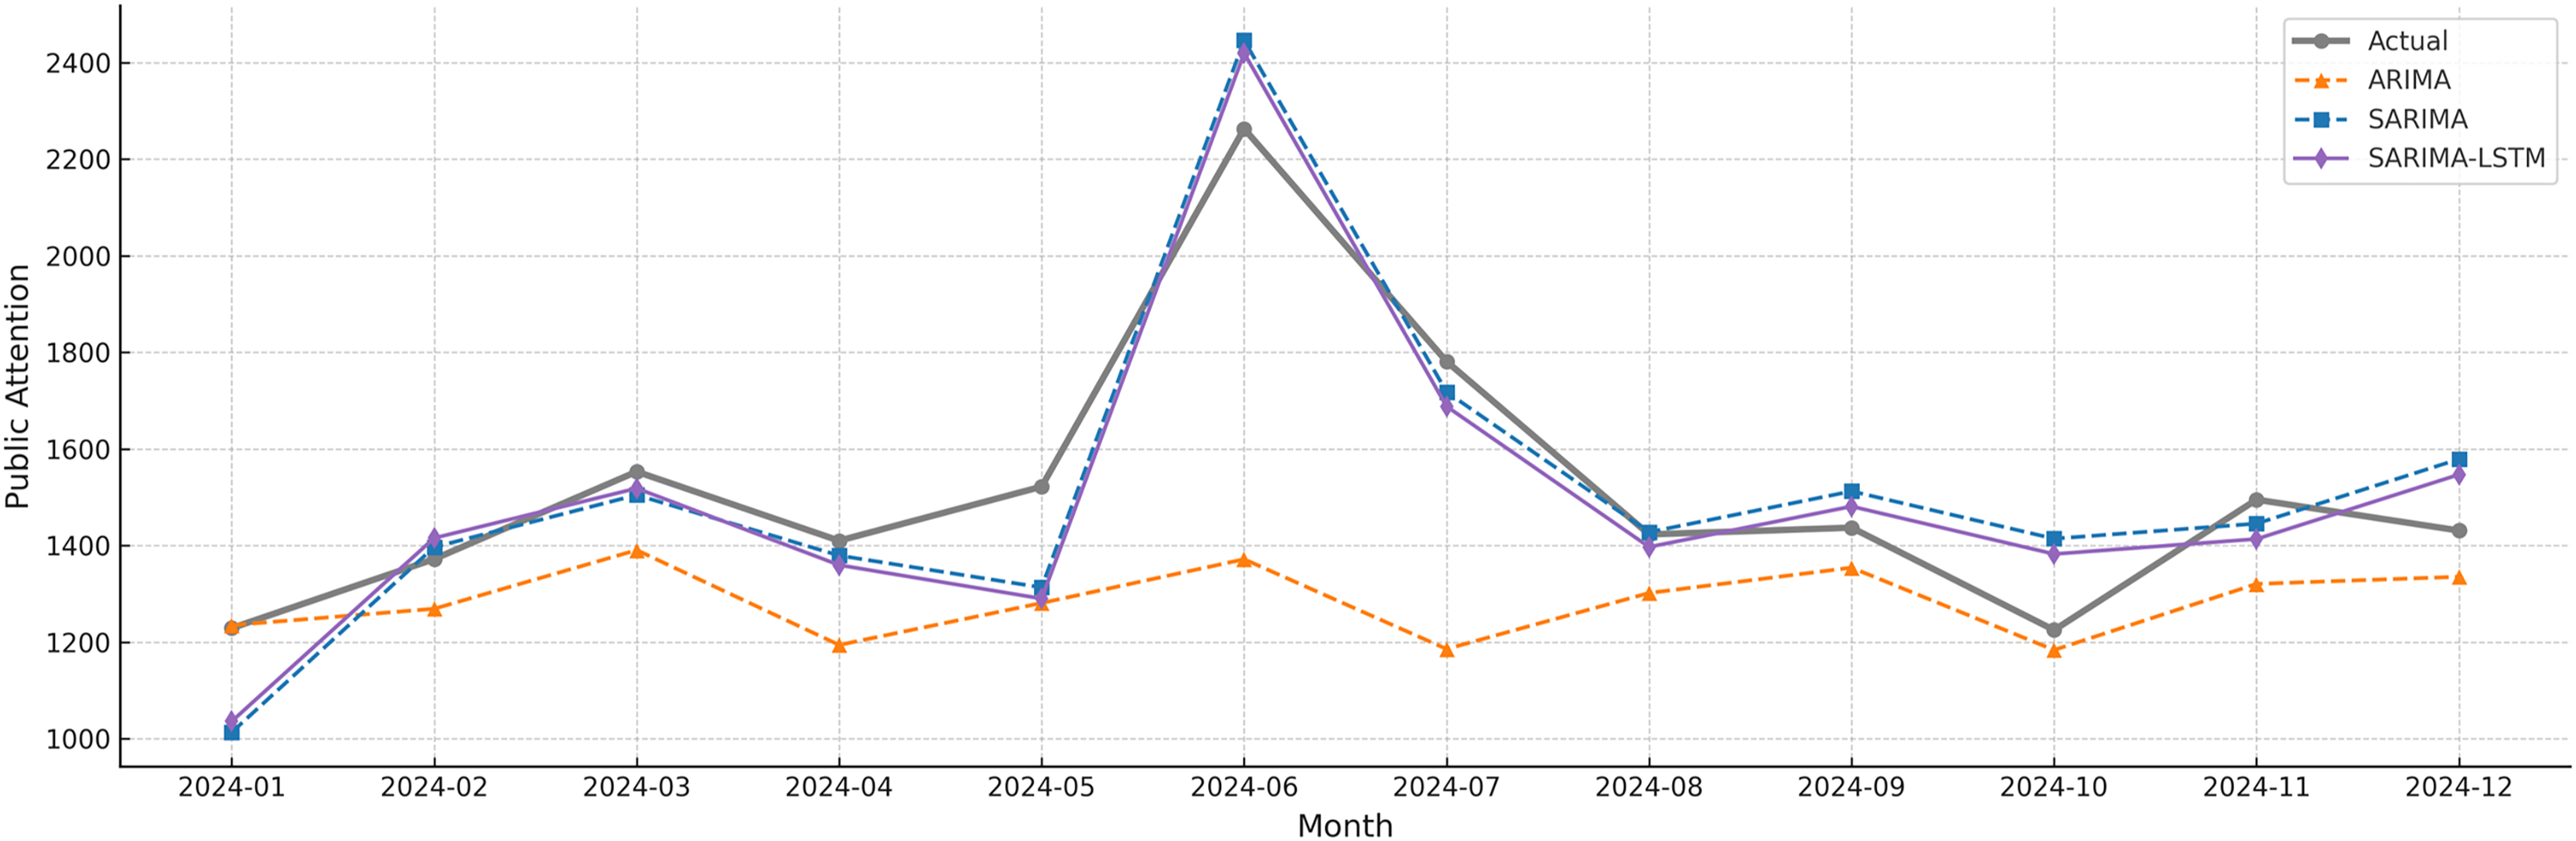
Figure 8 presents a comparative analysis of the 2024 forecast outcomes generated by the SARIMA-LSTM model and those from the standalone ARIMA and SARIMA models.
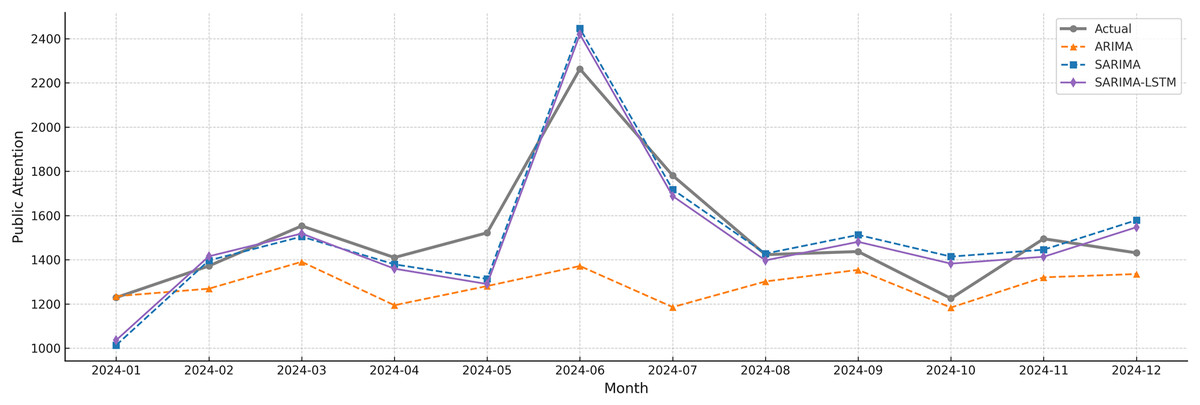
Figure 8: Forecasting of ARIMA, SARIMA, and SARIMA-LSTM models.
The Fig. 8 shows how the forecasted values correspond to the actual public attention levels in 2024, as generated by the ARIMA, SARIMA, and SARIMA-LSTM models. The SARIMA-LSTM model aligns most closely with actual public attention trends across most months, reflecting its strong performance in fitting the data. The SARIMA model also performs well, particularly in capturing seasonal variations, and generally yields better results than the traditional ARIMA approach.
Although the ARIMA model captures the overall direction of the data reasonably well, it tends to diverge significantly during months with sharp fluctuations, especially in June and December. In comparison, the SARIMA-LSTM model achieves higher accuracy by combining the strengths of both linear and non-linear modeling techniques. These findings underscore the value of deep learning in time series forecasting and suggest that SARIMA-LSTM offers a more effective framework for modeling complex temporal patterns in public behavior.
Model evaluation and validation
To evaluate forecasting performance, four indicators including MAPE, RMSE, DA and R2 are used. These measures were applied to assess and compare the forecasting effectiveness of the three models (see Table 4).
| Model | MAPE | RMSE | DA | R2 |
|---|---|---|---|---|
| ARIMA | 13.20% | 335.82 | 52.07% | −0.59 |
| SARIMA | 7.05% | 128.19 | 81.82% | 0.77 |
| SARIMA-LSTM | 6.94% | 121.53 | 81.82% | 0.79 |
The findings demonstrate that, among the three models evaluated, the SARIMA-LSTM approach yields the most favorable overall performance. It achieves the lowest forecasting error, with a MAPE of 6.94%, an RMSE of 121.53, a DA of 81.82%, and an R2 of 0.79. These values suggest that the model not only provides a strong fit but also accurately tracks the trend in public attention.
In contrast, the ARIMA model demonstrates the lowest performance across all evaluation criteria, with an R2 of –0.59, reflecting a limited capacity to explain the data’s variability. Although the SARIMA model performs better than ARIMA, particularly in its ability to capture seasonal structures and reduce forecasting error, its accuracy still falls short when compared to the SARIMA-LSTM model.
Overall, by integrating linear statistical modeling with the non-linear learning capacity of neural networks, the SARIMA-LSTM model proves to be more effective in handling the complexity of time series data like public attention, making it a promising tool for analyzing evolving behavioral patterns.
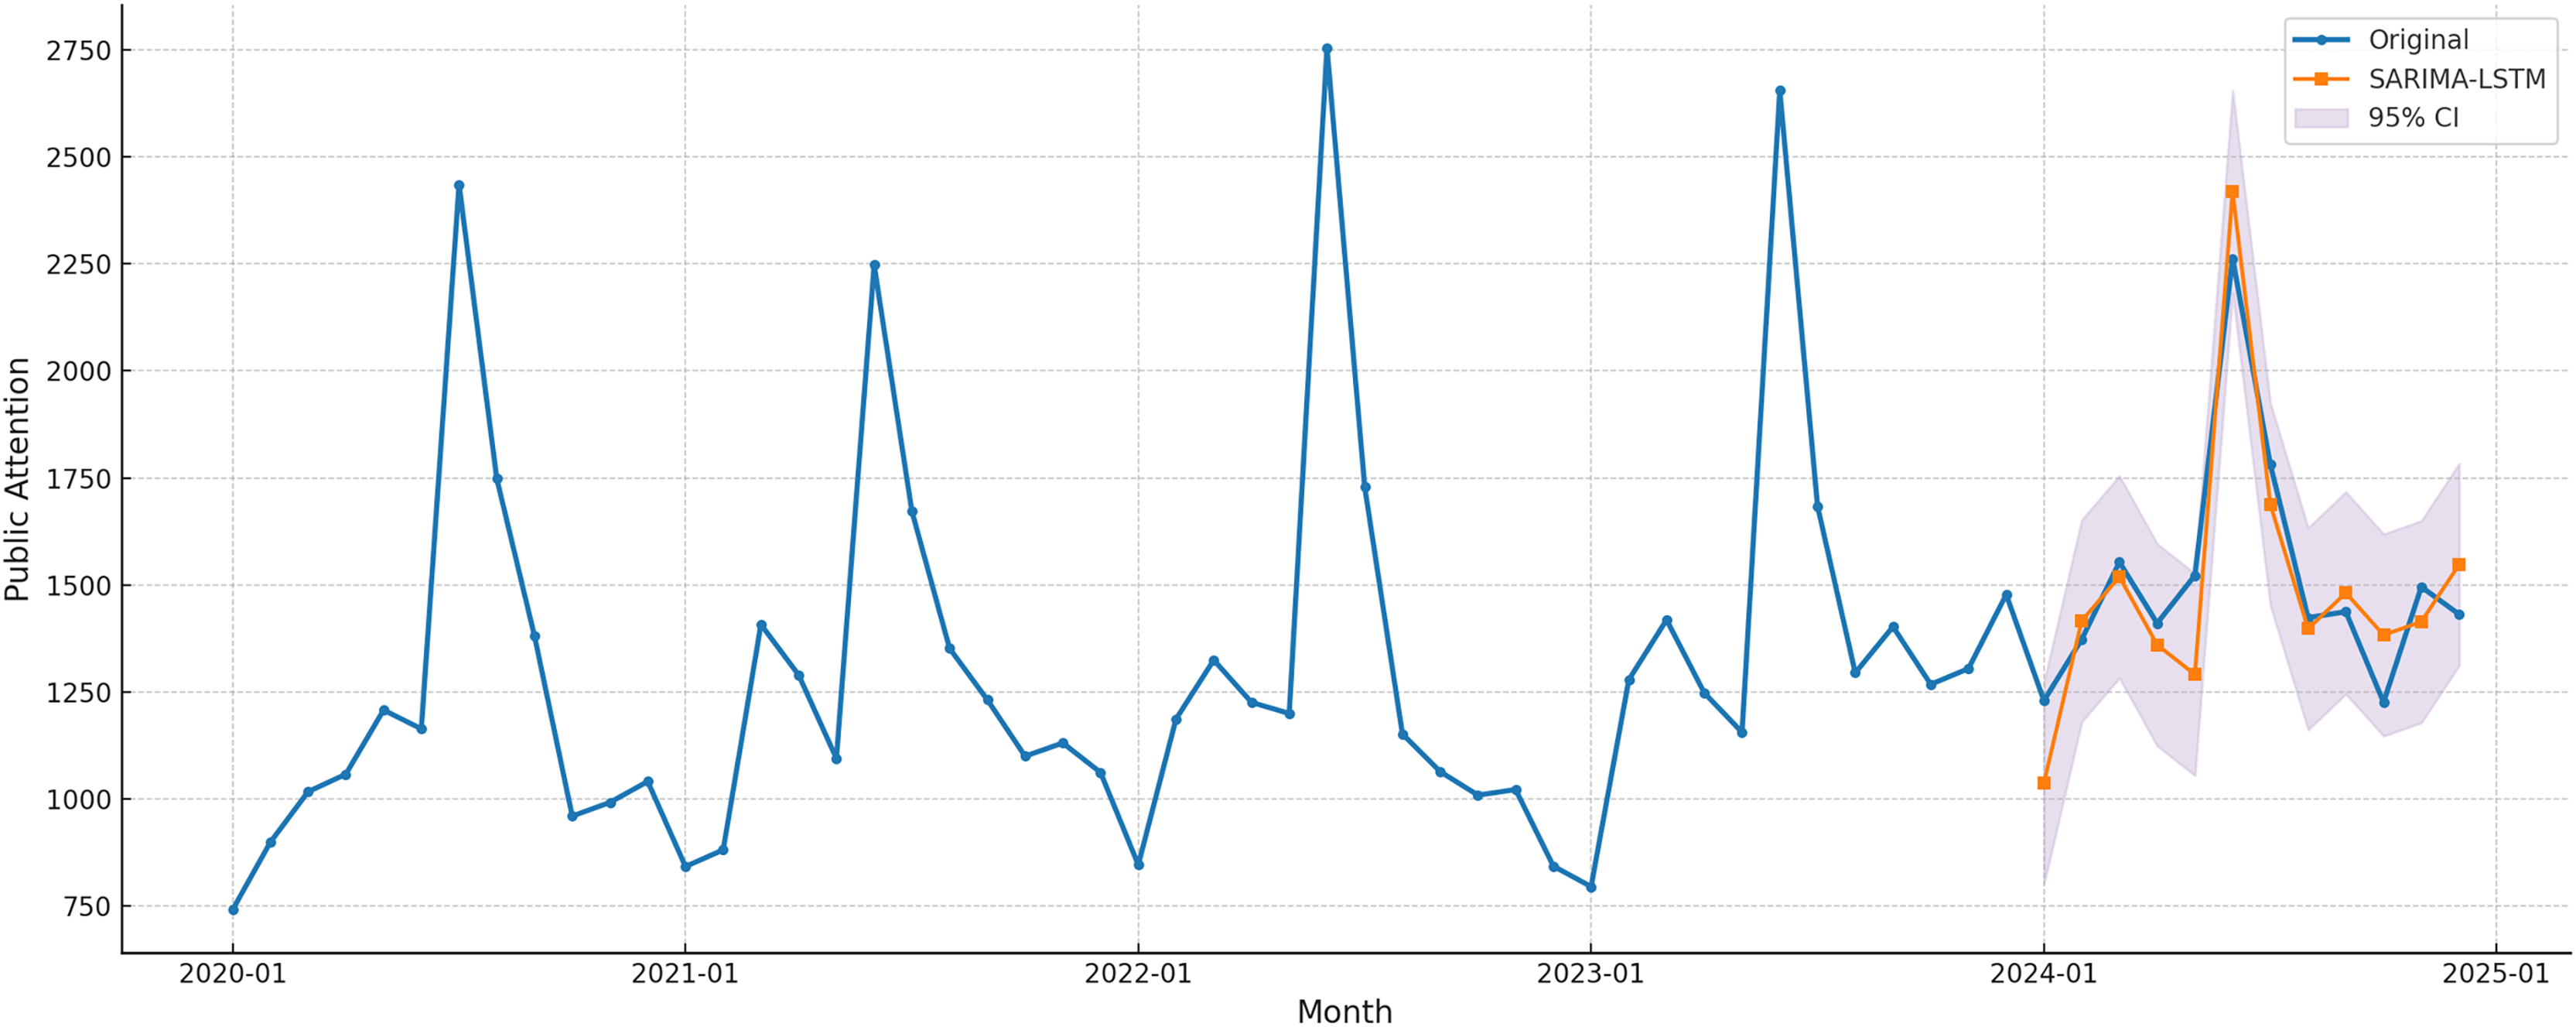
To further assess the forecasting reliability of the SARIMA-LSTM model, a forecasting interval coverage probability test was conducted, with the results presented in Fig. 9. The findings show that the model’s forecasts for 2024 closely match the actual observed values. Importantly, during periods of greater volatility, particularly in the early months of the year and toward year-end, the forecast values largely remain within the 95% confidence interval.
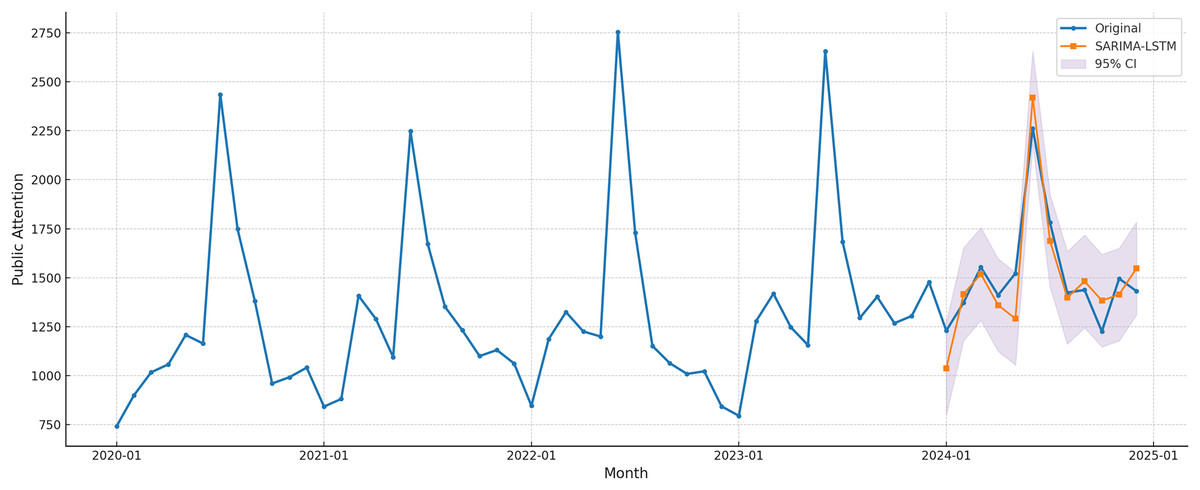
Figure 9: SARIMA-LSTM forecast with 95% CI.
This outcome reinforces the stability and reliability of the SARIMA-LSTM model in capturing patterns of public attention. It demonstrates not only the model’s strong fit to the time series but also its ability to account for uncertainty and variability in future trends.
Discussion
Interpreting the spatiotemporal evolution and driving mechanisms
The results reveal a clear upward trend in public attention to special education, suggesting increased public awareness of educational equity and the rights of individuals with special needs. The observed trend may be shaped by multiple drivers, including policy implementation, evolving educational values, shifts in how information spreads through social media, and the growth of online learning platforms (Özmen, 2015; Hayter & Cahoy, 2018; Zhang & Yuan, 2022). Rising public awareness has been evident not only in search engine activity but also in its tangible impact on the development of special education itself (Tuğba Önder, 2024; Keles, ten Braak & Munthe, 2024). As public attention increasingly reflects the level of societal concern and the visibility of educational issues, it has become an important reference point for policymaking and for improving the allocation of educational resources.
Viewed over time, public attention to special education displays a recurring pattern, with noticeable peaks each June. This surge typically coincides with critical phases in the academic calendar, such as entrance examinations and admissions-related activities. These fluctuations are strongly influenced by external factors, including policy announcements, social events, and media campaigns (Correa, Hinsley & de Zúñiga, 2010; Menachemi, Rahurkar & Rahurkar, 2017; Wei, 2022). Public consciousness has become an important driving force behind the advancement of special education (Jacobs, Simon & Nader-grosbois, 2020). The pattern of public attention is gradually shifting from being primarily policy-responsive to becoming increasingly demand-driven (Chang & Chang, 2020). Looking ahead, it is anticipated that public interest will evolve towards a more stable and balanced long-term trajectory.
Spatial analysis reveals a clear geographical pattern in public attention to special education, with significantly higher levels in the eastern and south-central regions, and notably lower attention in western and peripheral areas. This distribution reflects pronounced regional disparities. Existing studies indicate that shifts in public attention are influenced by multiple factors, including economic conditions, social context, educational resource allocation, population demographics, and levels of internet access (Guo, Zhang & Wu, 2021; Zhao et al., 2022; Brody et al., 2024; Sun, Zhang & Guo, 2024). Provinces such as Guangdong, Shandong, and Zhejiang, characterized by strong economies, abundant educational resources, high population density, and greater public awareness, have maintained consistently high levels of attention. In contrast, more remote western regions tend to suffer from resource constraints, weaker educational infrastructure, and limited internet access, resulting in relatively low levels of public attention.
Analysis using Moran’s I index and spatial clustering techniques provides further insight into the geographic dynamics of public attention. The clustering intensity peaked between 2021 and 2022, but gradually weakened in 2023 and 2024, indicating a trend toward more even spatial dispersion. High-attention regions (H–H clusters) were primarily located along the eastern coast and in central provinces, whereas areas with low levels of attention (L–L clusters) were mostly concentrated in inland western regions. This spatial arrangement points to the continued existence of regional disparities, though the overall trend suggests a movement toward a more balanced pattern of public engagement.
The dynamics of public attention to special education reflect a complex interaction among social perception, policy implementation, and media communication. These dynamics reveal a strong linkage between regional development levels and public awareness. In line with the first research objective, GIS-based spatial analysis and spatial autocorrelation confirm persistent regional disparities, with higher attention in the developed east and lower levels in the west. These findings highlight the need for region-specific strategies, directing resources and outreach toward areas of persistently low attention (Xu et al., 2025).
In light of these findings, it is recommended that education policymakers strengthen relevant initiatives and encourage greater participation in regions with limited public involvement, particularly in the western provinces. Additionally, leveraging social media platforms could further raise awareness and promote more balanced development of special education across different areas (Barbosa et al., 2018; Artyukhov et al., 2023). With continued advancements in communication strategies and growing public awareness, special education is expected to emerge as a sustained area of societal focus, laying a solid foundation for the development of a more equitable and inclusive educational support system. The observed trends in public attention have practical implications for policy and resource allocation. For example, consistent peaks around major examinations or policy announcements suggest that awareness campaigns and resource deployment could be strategically timed to coincide with periods of heightened public interest. Regions with persistently low attention may benefit from targeted outreach and additional funding to promote inclusive education (Yu et al., 2024). Integrating these insights into policy frameworks could enhance the responsiveness and equity of special education systems.
Interpreting the performance of forecasting models
A hybrid forecasting model combining SARIMA and LSTM was constructed and validated to enhance forecasting accuracy in this study. In the model comparison, ARIMA showed a basic capacity for capturing overall trends but fell short in handling non-linear variability, which led to reduced forecasting accuracy. This observation echoes previous studies that have raised concerns about the limitations of ARIMA in modeling public attention within complex social contexts (Bhatti et al., 2021; Kumar Dubey et al., 2021). When seasonal components were incorporated through the SARIMA model, performance improved significantly, as reflected in reduced forecasting errors. This outcome affirms the model’s effectiveness in handling time-dependent patterns influenced by seasonality, aligning with earlier research in the educational domain (Tefera & Fischman, 2020; Zhao, Li & Liu, 2024). Nevertheless, SARIMA remains less effective when dealing with sudden shifts or strongly non-linear dynamics, revealing the need for more flexible modeling approaches under such conditions.
Compared with the ARIMA and SARIMA models applied individually, the SARIMA-LSTM hybrid approach demonstrates significantly better performance in forecasting accuracy, capturing underlying trends, and accounting for uncertainty. By combining traditional statistical modeling with deep learning algorithms, it leverages the strengths of both methods, offering flexibility, consistency, and proven applicability in analyzing public attention (Tuğba Önder, 2024; Bilgili, Pinar & Durhasan, 2025). The model thus provides a reliable and scalable framework for identifying trends and informing policy decisions in the field of education. The integration of intelligent forecasting tools such as SARIMA-LSTM is encouraged to enable dynamic monitoring of public opinion, optimize the timing and content of policy communication, and enhance responsiveness. Specialized outreach and interactive engagement should also be targeted at key stakeholder groups, including parents and educators, to foster shared understanding and institutional trust.
Regarding the second research objective, the SARIMA-LSTM hybrid model outperformed single-model approaches (ARIMA, SARIMA) across all evaluation metrics, including MAPE, RMSE, DA, and R2. The combination of low MAPE and RMSE values indicates that forecasted attention levels are close to observed values, minimizing potential errors in anticipating public engagement trends. A high DA score demonstrates the model’s effectiveness in capturing directional shifts, which is crucial for timing interventions such as awareness campaigns or resource deployment, while a relatively high R2 reflects strong explanatory power, increasing confidence in policy planning applications. These results confirm the model’s capacity to balance high accuracy with the ability to capture both seasonal and non-linear dynamics, providing reliable forecasts of public attention that can guide the timing of awareness campaigns, optimize educational resource allocation, and enhance the responsiveness of inclusive education policies.
Research significance
This study based on special education as a point of departure and integrates GIS-based spatial analysis with SARIMA-LSTM time series modeling to construct a comprehensive spatiotemporal research framework for analyzing the dynamics of social cognition. This approach not only broadens the theoretical perspective within the field of special education but also promotes interdisciplinary integration across education, sociology, geographic information science, and computer science. It offers a novel methodological pathway for modeling and forecasting public attention. On a practical level, the study sheds light on how public attention to special education has evolved across time and space in China, providing data-driven insights and decision-making references for policy formulation, resource allocation, and the optimization of communication strategies. Although the data are derived from the Chinese context, the analytical framework demonstrates strong generalizability and transferability, offering valuable theoretical and methodological reference for education and social science research in other countries and domains.
Limitations and future research
Although this study provides a detailed exploration into the dynamics of public attention to special education and proposes a forecasting model, it still has certain limitations that should be acknowledged. A key constraint lies in the data source, which relies heavily on the Baidu Index. Baidu serves as a valuable and objective proxy for online search interest, but it does not account for user activity on other digital platforms. This reliance on internet search data may lead to an underrepresentation of public attention in less connected or remote regions, where internet usage remains relatively limited. In addition, the sample is limited to Baidu Index data for 31 provinces over a 5-year period, which, although comprehensive in geographic coverage, may not fully capture public attention patterns in populations less active on search engines. We also note that Baidu Index reflects search behavior from specific user demographics and relies on platform-specific algorithms and keyword limits (e.g., three-keyword cap), which may introduce measurement bias. These constraints should be considered when generalizing the findings to other contexts.
While the study offers meaningful insights into time-based trends and spatial clustering patterns, it does not incorporate external variables such as government policies, public campaigns, or media exposure. The absence of these contextual factors restricts the ability to fully explain what drives changes in public attention, especially when sudden or unusual shifts occur. In addition, the forecasting model does not consider the potential influence of major societal events or unexpected policy shifts. This may affect its accuracy in periods of heightened uncertainty.
Future studies may benefit from integrating Baidu Index data with information drawn from diverse platforms such as Weibo, TikTok, and online news comment sections. Building a multi-source model of public attention through this integration would allow for a more comprehensive and nuanced understanding of public discourse. Supplementing this approach with survey data and policy document analysis could further improve the depth and accuracy of the evaluation framework (Yan et al., 2021; Gu et al., 2024; Zhao, Wang & Wu, 2025), thereby enhancing the model’s responsiveness and applicability in real-world settings.
Moreover, introducing additional external variables and employing methods such as causal inference, geographical detectors, and multivariate modeling could help uncover the complex mechanisms that shape the evolution of public attention over time and space (Anselin, Li & Koschinsky, 2022; Qin et al., 2025). These techniques would enhance the explanatory strength of the research and enable the simulation of policy or communication interventions. Taken together, such methodological advancements could offer stronger theoretical foundations and more actionable empirical insights to support the formulation of equitable education policies and more effective public engagement strategies.
Conclusion
This study examined the temporal and spatial patterns of public attention to special education in China and developed a hybrid SARIMA-LSTM model to forecast trends, using Baidu Index data for 31 provinces from 2020 to 2024.
The spatiotemporal analysis reveals an overall upward trend in public attention to special education, with seasonal fluctuations gradually diminishing and a more balanced annual distribution emerging. Spatially, attention levels were higher in the economically developed east and lower in the west, though the regional gap showed signs of narrowing and spatial clustering effects weakened over time.
Comparative analysis of the three models shows that the SARIMA-LSTM hybrid model performs best in terms of forecasting accuracy, trend detection, and fitting capability. Low error rates, strong directional accuracy, and high explanatory power confirmed the model’s robustness and reliability for complex time series forecasting.
By combining spatiotemporal analysis with a hybrid forecasting approach, this study offers a practical, data-driven way to track and forecast changes in public attention. The findings provide clear guidance for making education policies more responsive, improving the efficient use of educational resources, and supporting equitable and sustainable development in education, while also offering insights that can be applied across disciplines.