
Bidirectional encoder representations from transformers (BERT) driven approach for identifying feasible software enhancements
- Published
- Accepted
- Received
- Academic Editor
- Siddhartha Bhattacharyya
- Subject Areas
- Algorithms and Analysis of Algorithms, Artificial Intelligence, Data Mining and Machine Learning, Software Engineering, Sentiment Analysis
- Keywords
- Software requirements, Classification, Enhancement reports, BERT
- Copyright
- © 2025 Umer
- Licence
- This is an open access article distributed under the terms of the Creative Commons Attribution License, which permits unrestricted use, distribution, reproduction and adaptation in any medium and for any purpose provided that it is properly attributed. For attribution, the original author(s), title, publication source (PeerJ Computer Science) and either DOI or URL of the article must be cited.
- Cite this article
- 2025. Bidirectional encoder representations from transformers (BERT) driven approach for identifying feasible software enhancements. PeerJ Computer Science 11:e3290 https://doi.org/10.7717/peerj-cs.3290
Abstract
Software application users often submit numerous enhancement reports (ERs) requesting new features, but only a small fraction are deemed feasible and approved. Recent methods have attempted to automate the identification of feasible ERs, primarily using textual descriptions and traditional machine learning (ML) techniques. This article proposes a deep learning (DL) approach that significantly improves performance by integrating both textual (summary, sentiment) and non-textual metadata (reporter and module statistics) into a unified representation. Textual features are encoded using Bidirectional Encoder Representations from Transformers (BERT), while sentiment is computed using Senti4SD, a tool designed for sentiment analysis in software engineering. Non-textual features are derived from reporter and module histories to provide behavioral context. These features are concatenated and fed into a DL-based binary classifier. Experiments on a publicly available dataset show that the proposed approach substantially outperforms previous methods, improving accuracy from 82.38% to 94.02% and F1-score from 85.03% to 94.26%. The results highlight the effectiveness of combining semantic, affective, and behavioral features in predicting feasible ERs.
Introduction
Enhancement reports (ERs) are feature requests proposed by users, e.g., developers, teachers, and learners of software applications (S-APPs) (Herzig, Just & Zeller, 2013). Users often expect the S-APPs to provide some useful features that the current version does not provide. Such expectations are usually documented and returned to developers as ERs (Antoniol et al., 2008). To facilitate the creation and handling of ERs, developers employ problem-tracking systems (e.g., Bugzilla) to manage ERs (Anvik, 2007). Such tracking systems record the whole life cycle of the ERs (Anvik, 2007), e.g., who creates the reports, when they are created, what the expected features are, which modules are associated with the new features, and whether the given features have been finally implemented.
ERs often request manual processing. Developers and/or maintainers read through ERs, make decisions (i.e., whether they should be approved/implemented), implement the approved requested features, and release the updates/patches. The manual processing could be time-consuming because of the many ERs submitted by various reporters. However, according to the empirical study (Nizamani et al., 2017; Umer, Liu & Sultan, 2019), more than three-quarters of the submitted ERs are denied/ignored, and manual processing of such reports does not pay off. Less than a quarter of the ERs are approved and implemented. Such approved ERs are called “feasible ERs”.
The automated and accurate prediction of feasible ERs facilitates developers in inspecting the most likely-to-be-fixed requests first (Nizamani et al., 2017). As a result, developers could respond promptly to valuable and significant inquiries, which is highly desirable for the success of S-APPs. Besides that, selecting and handling a subset of the most promising ERs from a huge set of reports helps developers to maximize revenue when the allocated time is insufficient to handle all of the collected ERs (Nizamani et al., 2017).
To facilitate the processing of numerous ERs, several automatic approaches have been proposed to identify feasible ERs for further manual processing (Nizamani et al., 2017; Umer, Liu & Sultan, 2019; Cheng et al., 2021). Nizamani et al. (2017) take ERs as plain texts and leverage conventional machine learning (ML) methods, i.e., Multinomial Naive Bayes (MNB), to classify the ERs based on the plain texts. The classifier classifies ERs into two disjoint categories: feasible and infeasible (Nizamani et al., 2017). Umer, Liu & Sultan (2019) further improve classification performance by leveraging the reports’ sentiment. The article’s key insight is that the reports’ sentiment could represent the reports’ emotion, and such emotion often significantly impacts the classification. Evaluation results confirm that leveraging the emotion of reports can improve the accuracy performance of the classification. Cheng et al. (2021) combined a Bag-of-Words (BOW) representation and a traditional word2vec-based representation of preprocessed text. Using an attention mechanism, they enabled the model to remember the context over a long sequence of words in an enhancement report. They trained a recurrent neural network (RNN) classifier for the approval prediction of enhancement reports based on sentiment and deep representation.
This article suggests a novel automatic approach to distinguishing feasible ERs from others. It differs from existing ones (Nizamani et al., 2017; Umer, Liu & Sultan, 2019; Cheng et al., 2021) in two aspects. First, existing approaches take ERs as plain texts, whereas this approach leverages both textual and non-textual features of ERs. Although sentiment leveraged by Umer, Liu & Sultan (2019) is numerical, it is computed according to the text of the reports. Thus, it should be taken as a derived attribute of the text (natural language description). Second, existing approaches leverage traditional ML techniques, i.e., MNB and support vector machine (SVM), whereas this approach employs more advanced DL techniques. DL techniques, like Bidirectional Encoder Representations from Transformers (BERT) (Devlin et al., 2018), have been proven more accurate in various domains like text classification (Ali et al., 2023), speech recognition (Ashraf et al., 2023), and image classification (Luqman et al., 2024). The proposed approach is evaluated with real-world ERs to assess the suggested method. Evaluation results indicate that the proposed approach significantly improves the state-of-the-art (SOTA) in identifying ERs.
In this article, the following contributions are made:
An innovative method for automated identification of feasible ERs is proposed. Unlike existing approaches, which use textual features alone or apply DL methods without integrating structured metadata, the approach combines deep contextual embeddings with auxiliary sentiment and non-textual features (e.g., reporter/module statistics) in a unified model. This is among the first works to systematically integrate such heterogeneous features for ER feasibility prediction using BERT.
Significant feature engineering of ERs using BertTokenizer that converts reports into token IDs and attention masks and eliminates the need for natural language processing (NLP) processing.
Results indicate that the proposed DL approach successfully identifies ERs. It improves accuracy and F1-score by and , respectively.
The remaining sections of the article are organized as follows: ‘Related Work’ talks about the literature review, and ‘Approach’ gives more details about what the article proposes. ‘Evaluation’ shows how well the proposed approach works, and ‘Conclusions and Future Work’ concludes and directs to future work.
Related work
Classification of ERs
The most closely related work are Nizamani’s (Nizamani et al., 2017), Umer’s (Umer, Liu & Sultan, 2019), and Cheng’s (Cheng et al., 2021). Nizamani et al. (2017) suggested a method to categorize ERs and predict whether they will be approved automatically. To my knowledge, they proposed the first approach to the automated identification of feasible ERs. They designed an MNB-based classifier for the binary classification. Evaluation results suggest that their approach can reach a high accuracy of 89.25%.
Umer, Liu & Sultan (2019) proposed another method to predict the approval of improvements. Different from Nizamani’s (Nizamani et al., 2017), Umer, Liu & Sultan (2019) leverage the sentiment of ER. Besides that, they also exploited the SVM for the approval prediction instead of the MNB employed by Nizamani et al. (2017). They evaluated their approach with cross-application validation on real-world ERs. Evaluation results suggest their approach is more accurate than Nizamani’s approach (Nizamani et al., 2017). On the other hand, different from Nizamani’s and Umer’s, Cheng et al. (2021) combined BOW representation and traditional word2vec-based representation of preprocessed text. Using an attention mechanism, they enabled the model to remember the context over a long sequence of words in an enhancement report. They trained an RNN classifier for the approval prediction of enhancement reports based on sentiment and deep representation. The results of their proposed approach improve the precision from 86:52% to 90:56%, recall from 66:45% to 80:10%, and f-measure from 78:12% to 85:01%.
The proposed approach differs from Nizamani’s (Nizamani et al., 2017), Umer’s (Umer, Liu & Sultan, 2019), and Cheng’s (Cheng et al., 2021) in the following aspects. It differs from existing ones (Nizamani et al., 2017; Umer, Liu & Sultan, 2019; Cheng et al., 2021) in two aspects. First, existing approaches take ERs as plain texts, whereas this approach leverages both textual and non-textual features of ERs. Second, existing approaches leverage traditional ML/DL techniques, i.e., MNB, SVM, and RNN, whereas this approach employs more advanced DL techniques, i.e., BERT.
Classification of bug reports
Several researchers have investigated the automatic categorization of reports in software engineering (Youn & Mcleod, 2006; Gad & Rady, 2015; Santos et al., 2012; Zhang et al., 2014; Jin et al., 2015; Moraes, Valiati & Neto, 2013; Khan et al., 2010; Lin et al., 2016; Sharma, Sharma & Gujral, 2015). Such approaches have been proposed to predict the severity and priority of bug reports, classify them incorrectly, and avoid duplication.
For predicting severity, Menzies & Marcus (2008) introduced a novel ML-based approach called SEVERIS. Lamkanfi et al. (2010) and Roy & Rossi (2014) collected bug reports originating from Eclipse, GNOME, and Mozilla, and compared different classification techniques in the severity prediction of bug reports. Evaluation results suggest that a naive Bayes classifier results in the best performance. Chaturvedi & Singh (2012) applied different ML classifiers to bug reports from NASA to anticipate their severity. Sharma, Sharma & Gujral (2015) utilized info-gain and chi-square for selecting features and found that MNB and k-nearest neighbor demonstrate superior performance in predicting the severity of bug reports.
For forecasting priority, Abdelmoez, Kholief & Elsalmy (2012) suggested using a naive Bayes classifier for predicting the priority of bug reports. They gathered bug reports from three large open-source projects: Mozilla, Eclipse, and GNOME, and tested the proposed method on these reports. Using linear regression, Tian, Lo & Sun (2012) introduced an approach named DRONE for the same purpose, achieving an average F1-score of up to 29%. Alenezi & Banitaan (2013) utilized two feature sets and applied naive Bayes, decision trees, and random forests for priority prediction. The evaluation results indicated that decision trees outperformed naive Bayes and random forests. Tian et al. (2015) employed nearest-neighbor-based methods to predict the priority of over 65,000 Bugzilla reports. Pooja introduced a priority prediction model that utilized SVM to allocate priorities by analyzing Firefox crash reports according to their occurrence rate and randomness (Choudhary, 2017).
To predict duplicate bug reports, several studies have been conducted (Banerjee, Cukic & Adjeroh, 2012; Thung, Kochhar & Lo, 2014; Alipour, Hindle & Stroulia, 2013). Šarić et al. (2012) proposed a method using supervised ML to ascertain the text resemblance in bug reports. Subsequently, Lazar, Ritchey & Sharif (2014) enhanced Šarić et al.’s (2012) approach by incorporating 25 new textual similarity features. Lin et al. (2016) and Tian, Sun & Lo (2012) employed SVM for detecting duplicate bug reports. Feng et al. (2013) utilized consumers’ profiles to identify duplicate reports. Based on the summary and description attributes of reports, Thung, Kochhar & Lo (2014) suggested an SVM-based tool (DupFinder) for measuring similarity between reports. Importantly, DupFinder has been successfully integrated into Bugzilla.
Sentiment analysis in software engineering
An empirical study by Lin et al. (2018) suggested that existing sentiment analysis approaches often result in inaccuracy in software engineering. Islam & Zibran (2018b) proposed a SentiStrength-SE especially for software engineering. The assessment outcomes indicate that this software engineering-specific method performs better than existing approaches not tailored to a specific domain, such as SentiStrength, Natural Language Toolkit, and Stanford NLP. Islam & Zibran (2018a) also introduced another tool for sentiment analysis called DEVA for bug reports. The tool analyzes sentiments and captures emotional states. A quantitative evaluation was conducted using 1,795 JIRA bug reports. A high precision rate of 82% and a high recall rate of 78% have been reported for DEVA. Ahmed et al. (2017) also presented SentiCR, a sentiment analysis tool for software engineering. Senti4SD proposed by Calefato et al. (2018) has been proven more accurate than other approaches. Consequently, the proposed approach leverages Senti4SD for sentiment analysis on ERs.
While prior works such as Cheng et al. (2021) applied DL models (e.g., recurrent neural networks (RNNs)) with textual and sentiment-based features, they did not incorporate non-textual structured metadata, i.e., reporter/module statistics. This study extends this research by fusing semantic and behavioral attributes in a single BERT-based model.
Prioritization of pull requests
Pull-based development (PBD) is a distinct way of collaborating in a distributed software development model. To investigate and analyze the PBD, Gousios, Storey & Bacchelli (2016), Gousios et al. (2015) conducted surveys on GitHub developers to discuss the practice and challenges of integrators and contributors in PBD. They found a lack of integrator responsiveness, pull request quality, and pull request prioritization to be the main challenges in PBD.
Veen, Gousios & Zaidman (2015) proposed a PRioritizer system to prioritize the pull requests. It exploits a ML model and predicts whether the pull request will receive user updates. It only uses daily user updates but does not use the acceptance likelihood of the pull requests, which is the main limitation of the system. To mitigate this limitation, Azeem et al. (2020) proposed an approach based on Prioritizer by considering the acceptance likelihood of each pull request to support integrators/developers to take actions against the actual pull request feedback. Other studies (Panichella, 2018; Zhou et al., 2020) also explored the actions while considering user feedback. Although the works about pull request merge employ classification techniques, they are applied to completely different artifacts and thus extract completely different features. Such an essential feature difference also results in a significant difference in their classification techniques compared to the proposed approach.
Bibliometric context and motivation
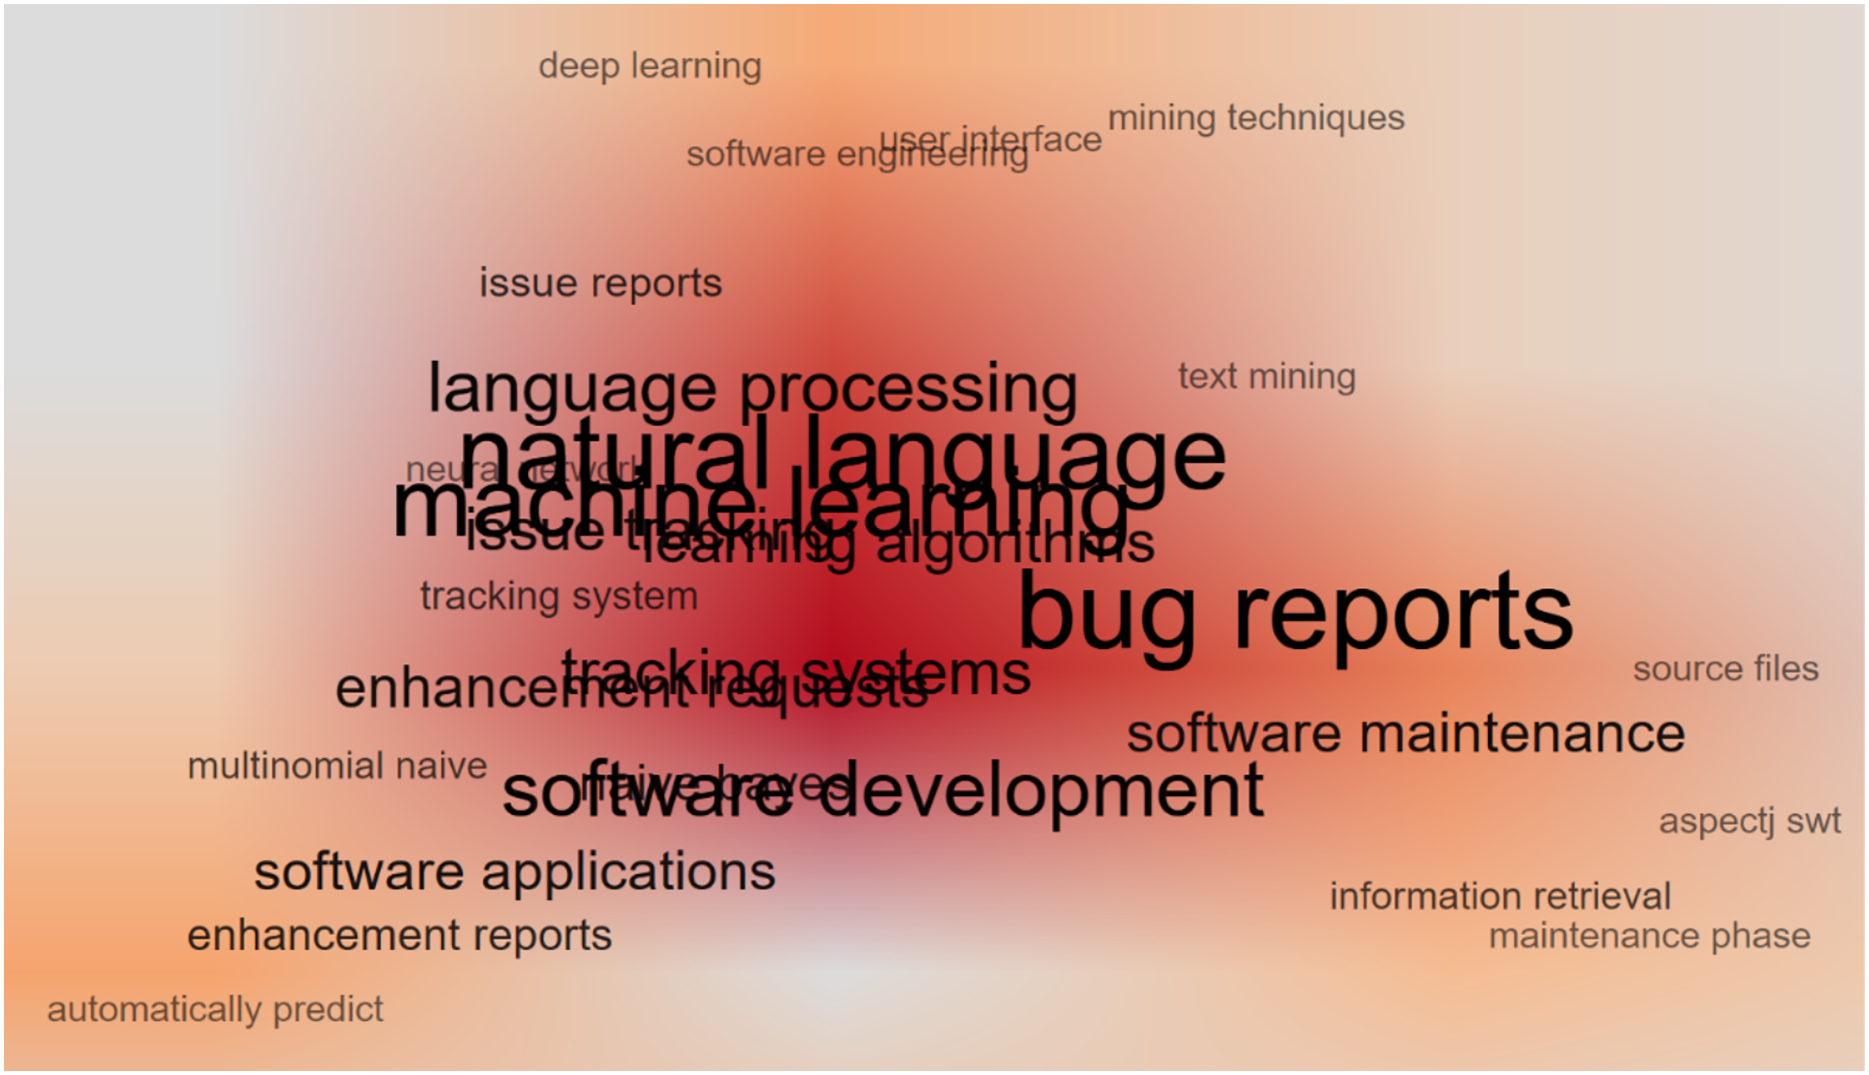
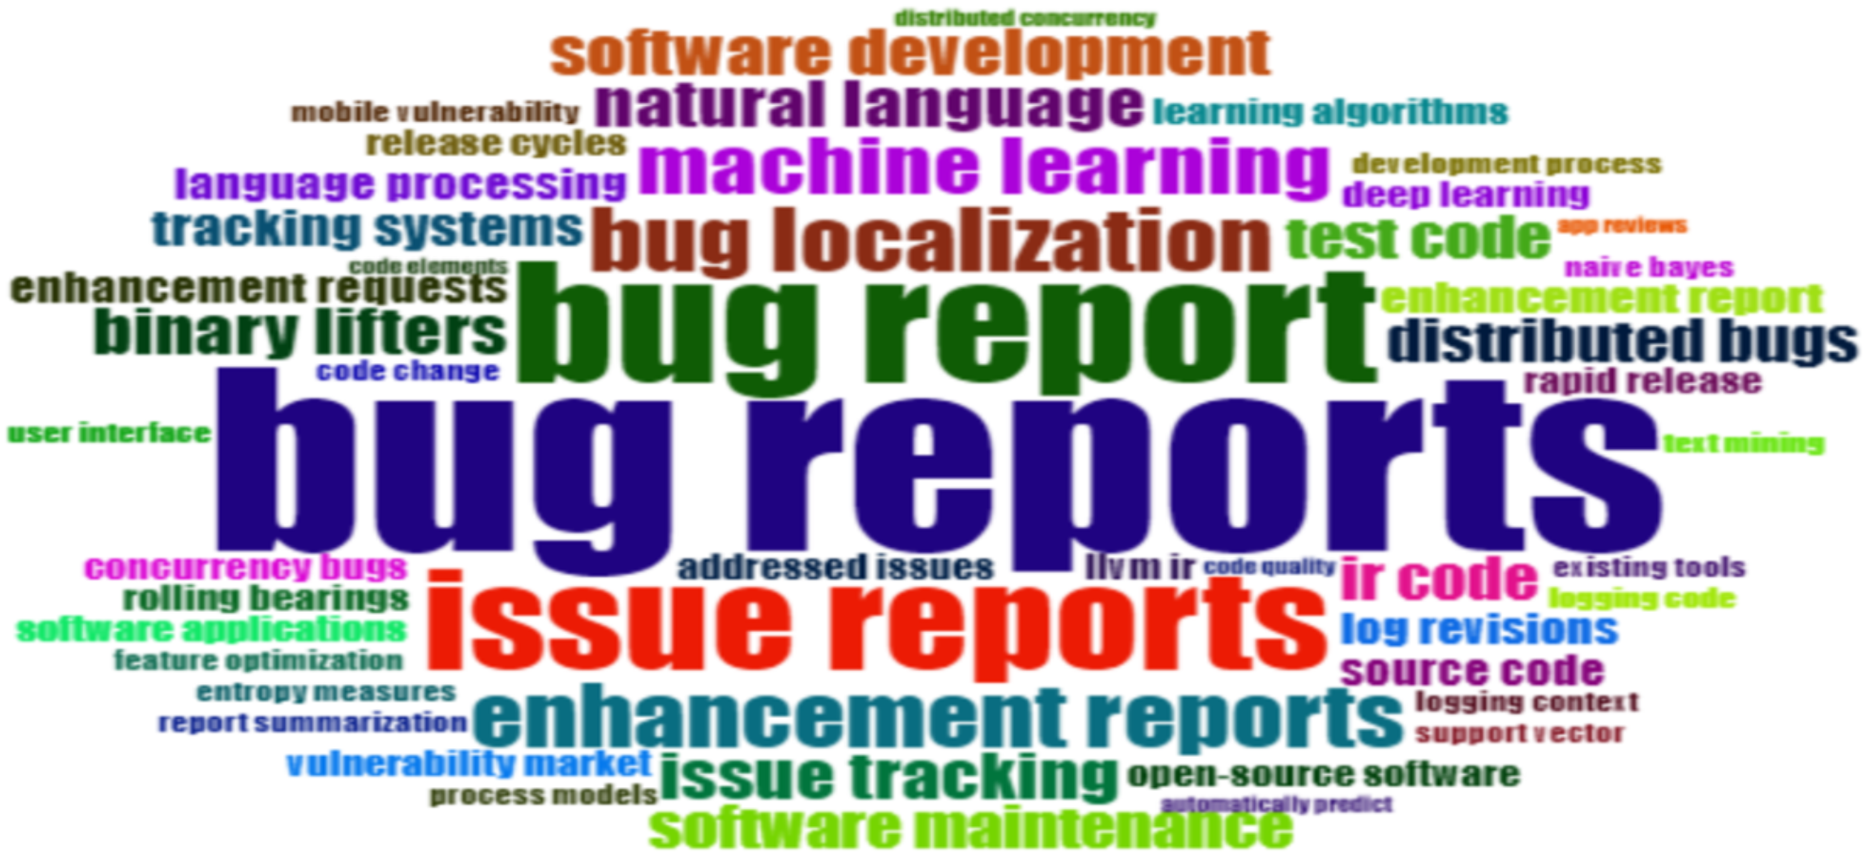
To contextualize the work, a bibliometric profiling of ER research is performed using Web of Science (2016–2023), and 73 key publications (17 journals, 25 conference papers) are retrieved, collectively citing 4,496 times and authored by 137 researchers. Keyword co-occurrence and term frequency visualizations (Figs. 1 and 2) reveal recurring themes, i.e., “user feedback,” “feature requests,” “maintenance,” and “prioritization,” indicating sustained research interest.
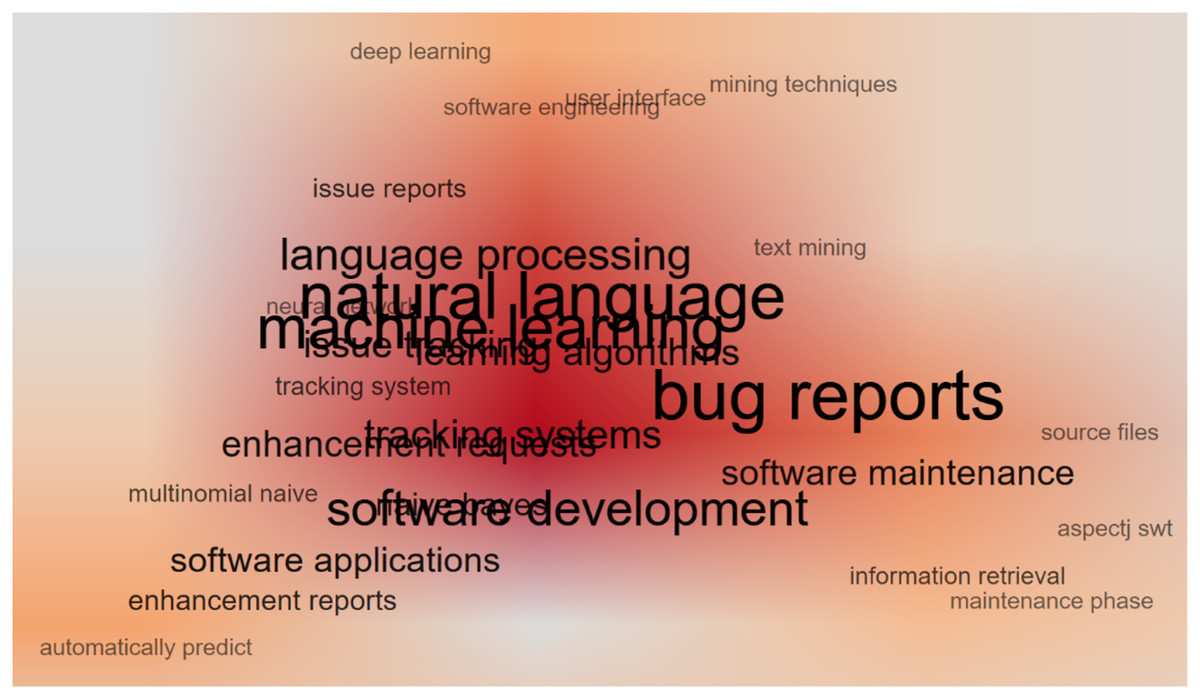
Figure 1: Co-occurrence network.
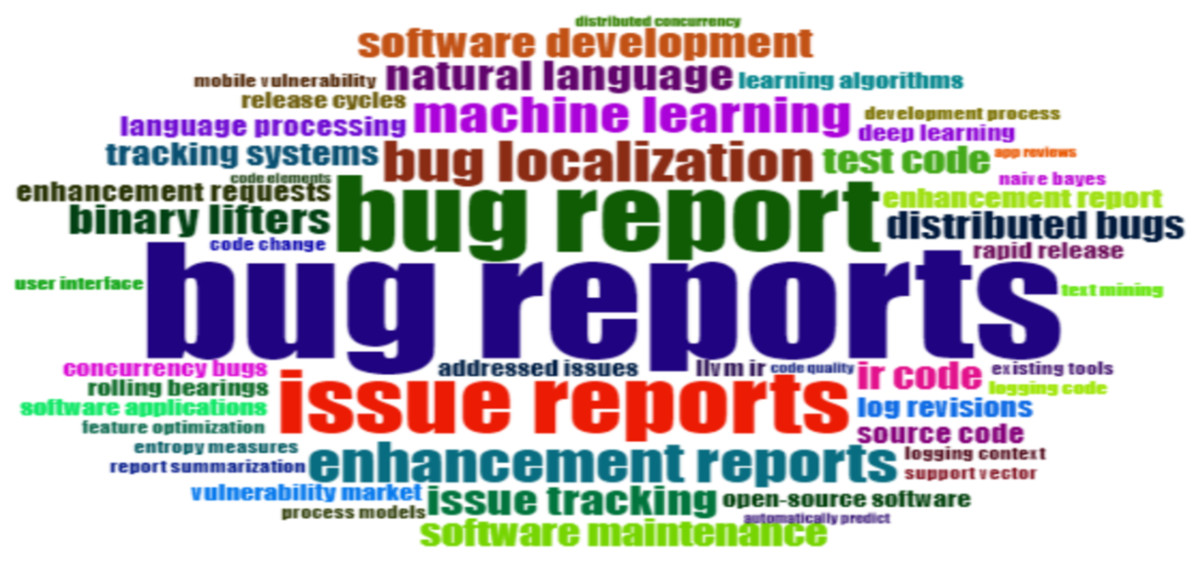
Figure 2: Word cloud.
While this trend validates the importance of ER feasibility analysis, it also highlights a gap: most existing works rely solely on textual features, lacking integration with sentiment or metadata. The proposed approach addresses this gap by proposing a fused representation that combines textual embeddings (BERT embeddings) with sentiment polarity (computed from Senti4SD) and module/reporter statistics. This fusion enables deeper contextual and behavioral understanding of ERs, aligning well with the bibliometric evidence of where the field is heading.
Approach
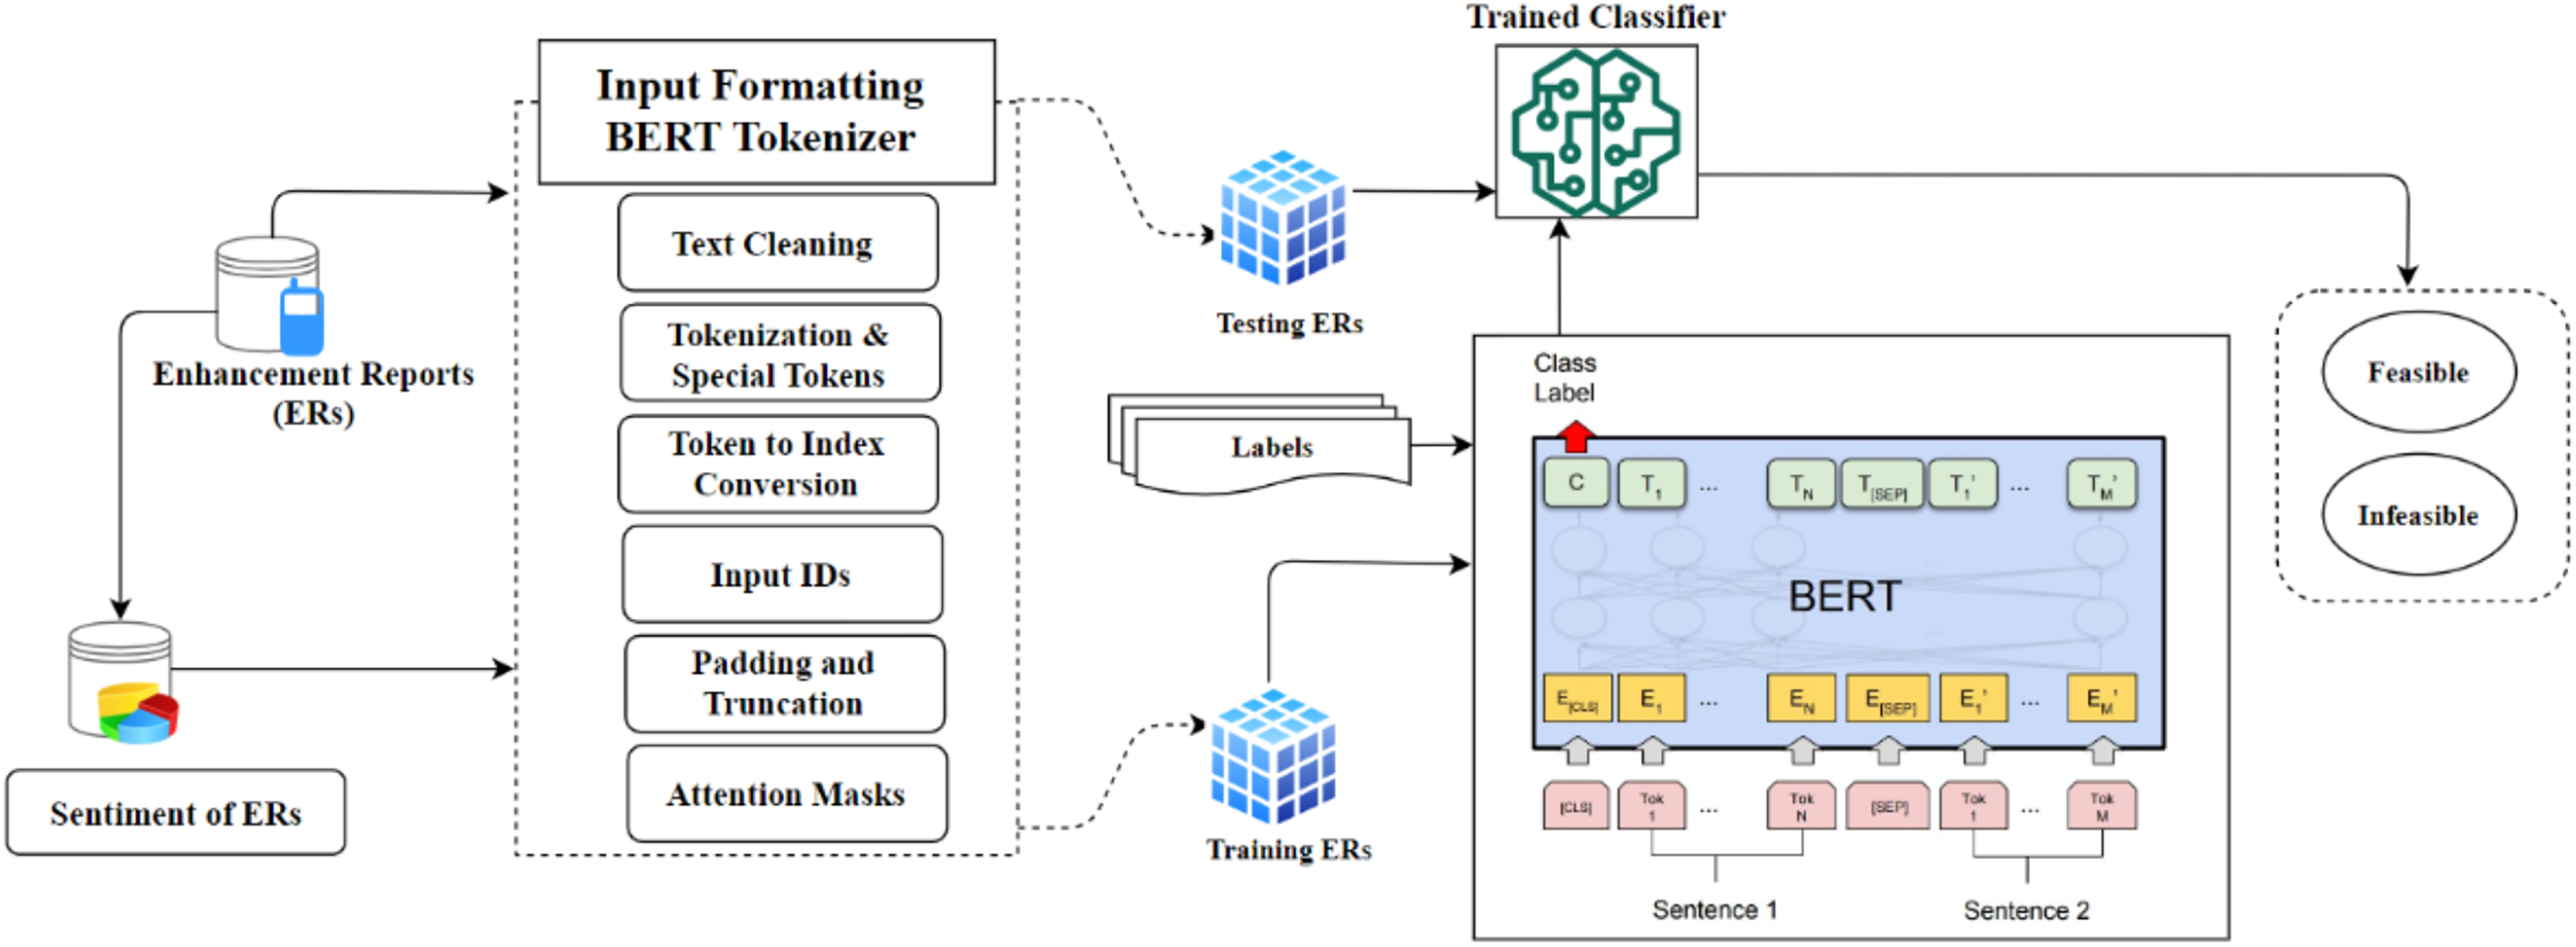
Identification of feasible ERs is essentially a binary classification: all submitted ERs get automatically sorted into two categories, i.e., feasible and infeasible reports. Figure 3 depicts a summary of the proposed methodology. An ER from a set of ER R can be described as follows:
(1) where represents the report’s textual information (i.e., summary), and represents the resolution attribute of , i.e., whether it has been approved. is the non-textual information (numeric features) of the ER. Non-textual information is composed of two parts: SR (statistics of the reporter who submitted the ER), and SM (statistics of the module associated with the ER):
(2)
(3)
(4)
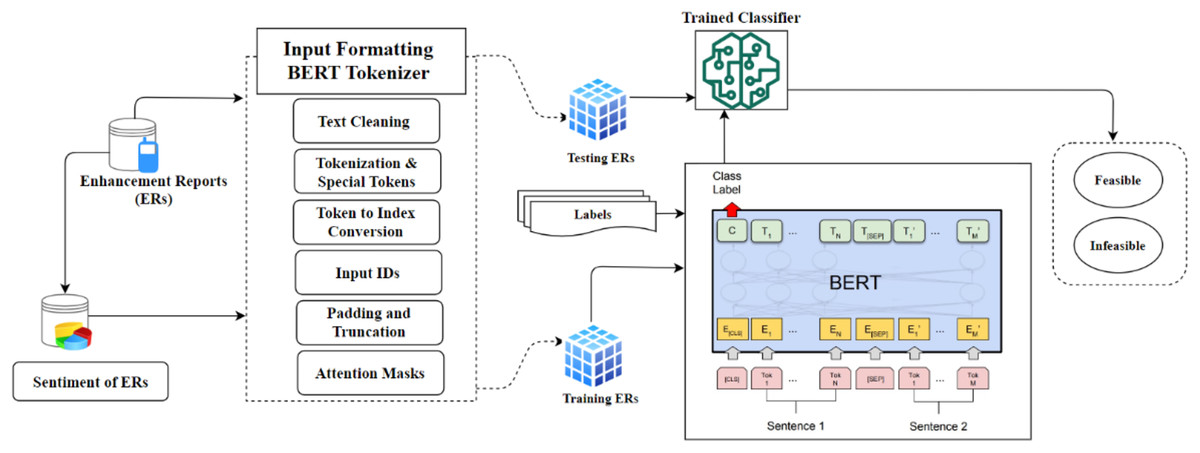
Figure 3: Proposed model overview.
SR is composed of two metrics: and , where is the number of approved ERs posted by the reporter, and is the approval rate for the reporter (i.e., what percentage of his reports have been approved). SM is also composed of two metrics and . is the number of approved ERs associated with the given module, and is the average approval rate for the ERs associated with the module.
Labels of the ERs are extracted from issue tracking systems automatically (Nizamani et al., 2017). For example, in the proposed approach, ERs are extracted from Bugzilla where the status of such reports is specified with the attribute resolution. Possible values of this attribute include duplicate, expired, fixed, incomplete, invalid, moved, wontfix, and worksforme. An ER is feasible if and only if its resolution is fixed. Notably, open reports (whose status attribute is neither verified nor closed) should be ignored because their status will change soon. Consequently, they cannot be taken as feasible or infeasible reports. Similarly, duplicate reports are ignored because duplicate does not reveal whether the requested features have been approved/implemented. Other reports that are neither feasible nor ignored are taken as infeasible reports.
Consequently, the automated prediction of a new can be represented as a function such that:
(5) where is the binary-class output of the classifier that has the potential to be either feasible or infeasible.
Non-textual feature engineering
To enrich the representation of each , four key non-textual features are incorporated, derived from behavioral history and contextual metadata:
Reporter Count ( ): total number of ERs submitted by the reporter.
Reporter Approval Rate ( ): ratio of approved ERs to total ERs submitted by the reporter.
Module Count ( ): total number of ERs submitted for the target module.
Module Approval Rate ( ): ratio of approved ERs to total ERs for the module.
The four non-textual features were computed by parsing historical enhancement report entries from the Bugzilla-based issue tracker. Each contains metadata fields including reporter, component (used as a module), and resolution. The process first iterates through the training split to count the number of ERs each reporter has submitted ( ) and the number of those labeled fixed. The approval ratio ( ) is then calculated as the number of fixed ERs divided by for each reporter. A similar approach is followed for modules (component field), where it counts the number of ERs associated with each module ( ) and the number of them labeled fixed to compute . These statistics are calculated solely using the training fold to prevent data leakage.
These features are computed from the labeled dataset using only the training partition to avoid data leakage. During evaluation, lookup tables (dictionaries) are constructed using only the training split for reporters and modules.
If a reporter or module does not appear in the training set (i.e., unseen in the test fold), the missing feature is imputed using the global average from the training data. This ensures generalization and fairness.
The raw count features ( , ) are normalized to [0, 1] using min-max scaling fit on the training split. However, the ratio features ( , ) are naturally bounded in [0, 1] and are used as-is. These four features are concatenated into a four-dimensional numeric vector and later combined with the sentiment score and the contextual BERT embedding from the [CLS] token to produce a joint feature representation for classification.
Sentiment analysis
Results of the existing study (Nizamani et al., 2017) suggested that some emotional words strongly correlate with the resolution status of ERs. For example, on average, only 76.25% of the ERs are denied/ignored. However, the ratio (of ignored reports) increases significantly to 92.3% for such reports that contain the keyword “stupid”. To leverage the correlation between emotional words and resolution status, the sentiment (noted as ) of ERs is computed, and the resulting sentiment is presented as one of the key features of the reports:
(6) where is an ER, is the textual feature of the report, and is the sentiment of the report.
Senti4SD (Calefato et al., 2018) is leveraged to compute the sentiment of reports (i.e., function ). It computes and provides the sentiment associated with the ER based on emotion-words, modifiers (the words that enhance the polarity of other words, e.g., “very”), and negations (the words that invert the polarity of different words, e.g., “not”) in the summary of ER. A significant advantage of Senti4SD is that it was specially designed for software engineering. In contrast, widely used algorithms, e.g., SentiWordNet (Baccianella, Esuli & Sebastiani, 2010), are intended for generic natural language descriptions.
Input formatting of ERs
The identification of ERs of S-Apps is closely linked to accurately representing crucial textual elements for BERT and providing a numerical representation for training the BERT classifier. Recent studies (GLO, 2022; Zaland, Abulaish & Fazil, 2023) emphasize various techniques for word representation in the field of NLP, i.e., illustrated by Word2Vec (Mikolov et al., 2013), GloVe (GLO, 2022), and FastText (Zaland, Abulaish & Fazil, 2023). Nevertheless, BERT (Devlin et al., 2018) distinguishes itself as a powerful NLP model pre-trained on comprehensive text datasets. It is highly effective for diverse tasks because it can understand contextually rich word and phrase representations. As illustrated in Fig. 3, formatting input data outlines the steps for preparing data to be input into the BERT model. This encompasses generating token IDs and attention masks and enabling classification. To accomplish this, the proposed study employs the tokenizer “BertTokenizer” from the “Transformers” library, specifically utilizing the “bert-base-uncased” variant. The process of formatting is outlined as follows:
Before text processing, cleaning operations must be performed, removing extraneous characters, punctuation, and special symbols. In this step, the proposed approach ensures that the ER’s data is appropriately formatted for subsequent processing by the BERTTokenizer. The BertTokenizer breaks down the ER’s content into a sequence of subword units. Using a pre-established vocabulary, these units are then converted into integer identifiers (IDs). Moreover, the tokenizer incorporates specific tokens, namely CLS for classification and SEP for separation, which mark the beginning and end of the ER’s data. The procedure for the tokenizer can be outlined as follows:
(7) where, symbolizes the sequence of subwords within , wordi represents an individual subword, and signifies the overall count of subwords in a .
The BERT tokenizer employs a pre-established vocabulary encompassing every conceivable token comprehensible to a DL model. Every token in this vocabulary is linked to a numeric identifier, often called an index. Once the sequence of tokens, denoted as , is tokenized, each token is matched with its corresponding index according to the vocabulary of the BERT tokenizer.
Consider the following tokens, along with their corresponding index assignments, as part of the vocabulary of the BERT tokenizer:
Essentially, the vocabulary of the BERT tokenizer enables the smooth transition of each token in a provided sequence into its corresponding index. This representation allows the model to process and understand textual data based on indices, enhancing its effectiveness in working with text.
The sequence of token indexes is transformed into input IDs, serving as the ultimate input for the BERT model. These numeric IDs correspond to tokens within a predefined vocabulary, and this relationship can be represented as follows:
In this notation, represents the series of input IDs, where denotes a specific input ID, and indicates the overall count of input IDs for each . The resultant sequence IDs effectively encodes the tokenized text into a numerical format that the model can interpret. This index-based representation serves as the input for the model to carry out tasks like classification, sentiment analysis, or any other subsequent task.
Padding and truncation are processes aimed at readying sentences for streamlined batch processing, ensuring uniformity. At this stage of input preparation, the token IDs are settled to achieve the highest sequence length suitable for ER. The proposed approach aligns with the defined full sequence length of 256.
Padding is implemented when the total number of token IDs in a given input sequence falls short of the 256-token limit. This involves extending the sequence using a designated token ‘0’ until the desired length is reached. Conversely, if an input sequence surpasses 256 tokens, the surplus tokens are removed to comply with the specified limit. This process can be described as follows:
represents the ultimate input ID, following the truncation and padding processes in . The variable signifies the number of token IDs in the input sequence. The padding and truncation process guarantees that input sequences are uniform in length, enabling smooth processing within the BERT model.
Attention masks help distinguish real words from added ones in a sentence. This is important because the transformer’s attention mechanism relies on these masks to concentrate on real words and disregard added ones. These masks are binary, with 0s for added words and 1s for real words.
For example, if S-App has a sequence with n items and needs to make it a certain length l by adding padding, the attention mask will look like this: . The initial n elements are 1s, showing the real items, and the remaining l–n elements are 0s, indicating added padding. In a matrix representation, the attention mask can be represented as:
The attention mask, represented as , aligns with the input sequence . Attention masks allow the model to concentrate on significant tokens and ignore padding during processing. This significantly enhances efficiency and leads to more meaningful analysis.
Using a sequence length of 32, the proposed approach formats the text as follows:
Text: “Pressing tab for location bar autocomplete should only complete up to the longest common prefix (instead of selecting the first item)”.
Tokenization and Addition of Special Tokens: [[CLS] ‘Pressing’ ‘tab’ ‘for’ ‘location’ ‘bar’ ‘autocomplete’ ‘should’ ’only’ ’complete’ ‘up’ ‘to’ ‘longest’ ‘common’ ‘prefix’ ‘(instead’ ‘of’ ‘selecting’ ‘first’ ‘item)’ [SEP]].
Token IDs: [101, 3220, 2901, 2109, 4501, 1455, 3005, 1469, 2511, 12686, 129, 2291, 3297, 5926, 8631, 6996, 3141, 8231, 5647, 2023, 2052, … 102].
Padding and Truncation: [101, 3220, 2901, 2109, 4501, 1455, 3005, 1469, 2511, 12686, 129, 2291, 3297, 5926, 8631, 6996, 3141, 8231, 5647, 2023, 2052, … 102, 0, 0, 0, 0, 0, 0].
Attention Masks: [1, 1, 1, 1, 1, 1, 1, 1, 1, 1, 1, 1, 1, 1, 1, 1, 1, 1, 1, 1, 1, … 1, 0, 0, 0, 0, 0, 0].
Feature fusion
The final prediction for each ER relies on its textual information processed by BERT and auxiliary numerical features, i.e., sentiment score and reporter/module statistics. These features are combined after the BERT encoder stage to enrich the input representation. Specifically, after extracting the final hidden state of the [CLS] token from BERT (which summarizes the semantic information of the entire report), the vector is concatenated with the sentiment score derived from Senti4SD, the non-textual numeric vector . Detailed computation and normalization of these features are provided in ‘Non-Textual Feature Engineering’.
Let denote the output embedding of the [CLS] token (a 768-dimensional vector for BERT base). The final feature vector for an ER is:
(8) where denotes vector concatenation, and includes the four numeric values described in ‘Approach’. The resulting vector has a dimensionality of 773 (768 from BERT + 1 sentiment score + 4 numeric values).
This fused representation is then passed to a fully connected layer, followed by a softmax classifier, to predict the ER’s feasibility label.
Model training and prediction
To facilitate training and prediction of the BERT model, the dataset of S-Apps ERs is divided using a stratified 80–20% train-test split. Stratification ensures that training and test sets maintain the original class distribution of feasible and infeasible reports, which is important given the inherent class imbalance.
To improve robustness and minimize the impact of random initialization or split-induced variance, the entire process is repeated across five different random seeds. Results are averaged across these five independent runs to reduce bias and better generalize the performance. Each run includes feature extraction, model training, and evaluation on the isolated test set. This repeated stratified splitting is a lightweight alternative to k-fold cross-validation, which is computationally expensive for transformer-based models.
All preprocessing operations, including text cleaning, sentiment scoring, feature engineering, tokenization, normalization, and resampling, are performed solely on the training set of each split. The test set is kept completely isolated until evaluation to prevent data leakage.
The BERT-based framework uses the bert-base-uncased word-piece model (English), pre-trained on BookCorpus and Wikipedia by Google (https://github.com/google-research/bert). The BertForSequenceClassification model is utilized to predict feasibility labels for ERs, using the default hyperparameters suggested in the original BERT article (Devlin et al., 2018). These include 12 transformer layers, 12 attention heads, a hidden size of 768, ε , and a learning rate of (see Table 1).
| Specification | Value |
|---|---|
| Model | BERT base |
| Transformer layers | 12 |
| Attention heads | 12 |
| Hidden size | 768 |
| Epsilon | |
| Max sequence length | 256 |
| Learning rate | |
| GPU | Google Colab (Tesla T4 or Tesla K80) |
The textual input (i.e., summary of the enhancement report) is passed through the BERT tokenizer. Each sequence is truncated or padded to a fixed maximum of 256 tokens. This threshold is based on empirical analysis: over 95% of ER summaries fall below this length. This choice is further validated through an ablation study comparing 256-token and 512-token truncation. The resulting F1-score difference was less than 0.5%, confirming that 256 tokens are sufficient for capturing most relevant information, while reducing memory usage and training time.
The output embedding from the [CLS] token, capturing the semantic representation of the report, is concatenated with a sentiment score (from Senti4SD) and four non-textual features (nR, rR, nM, rM) to form the final feature vector . This 773-dimensional fused vector is passed to a fully connected layer, followed by a softmax classifier, to generate the feasibility prediction.
For the hyperparameter selection, the default BERT fine-tuning configuration is adopted from Devlin et al. (2018). Preliminary experiments showed that higher learning rates (e.g., ) and larger batch sizes (e.g., 32) resulted in marginal improvements (<0.3% F1-score) at the cost of reduced stability and higher memory usage. Hence, the default setup was retained for computational efficiency and reproducibility.
Training uses a single graphics processing unit (GPU) (Tesla T4 or Tesla K80) on Google Colab. The model is trained for 10 epochs per run using a batch size of 16. After each epoch, performance metrics (accuracy, precision, recall, and F1-score) are computed on the held-out test set. The reported results are averages over the five repeated, stratified splits to ensure fairness, reduce randomness, and enhance reproducibility.
While BERT-based models are computationally intensive, the experiments were conducted on a single GPU (Tesla T4 or K80) in Google Colab, demonstrating that the proposed approach is feasible even on moderately resourced platforms. Each training run (10 epochs) was completed in under 30 min. For production use, the model can be fine-tuned once and then used for inference, which is significantly faster and can be optimized further using quantization or distillation techniques. Thus, while deep learning requires more resources than traditional methods, the proposed approach remains viable for practical applications, especially in batch-processing or server-side deployment scenarios.
Evaluation
The main objective of this section is to evaluate the proposed approach using open-source ERs.
Validation strategy
To ensure robust evaluation and avoid data leakage, the dataset is split (stratified) 80/20, with 80% used for training and 20% reserved for testing. The stratification maintains the original class distribution across both sets, which is crucial given the class imbalance in feasible and infeasible ERs.
Importantly, all preprocessing steps, including feature extraction, sentiment scoring, text vectorization, and resampling, are applied exclusively to the training data. The test data remains completely isolated during training and preprocessing. This ensures that no information from the test set leaks into the training phase, preserving the integrity of the evaluation results.
To ensure reproducibility, the random seed is fixed for splitting and sampling operations. The evaluation metrics (accuracy, precision, recall, F1-score) are reported on the held-out test set.
Research questions
The following are the research questions investigated by the evaluation:
RQ1: What is the potential of the proposed approach in identifying feasible ERs? Can it outperform the SOTA approaches?
RQ2: What impact does the variation in features of ERs have on the performance of the proposed approach?
RQ3: Is the performance of the proposed classifier superior to that of other classifiers in identifying feasible ERs?
RQ4: What is the effect of resampling on the performance of the proposed approach?
RQ5: Are the performance improvements achieved by the proposed approach over traditional M/DL baselines (LSTM, CNN) statistically significant?
Dataset
The evaluation is conducted with the publicly available dataset (https://github.com/shanniz/Bugzilla, accessed on 12 March 2025) (Nizamani et al., 2017) created by Nizamani et al. (2017) and reused by other researchers (Umer, Liu & Sultan, 2019; Cheng et al., 2021). It is evaluated on different sentiment analysis tools, which reveal that Senti4SD performs best on the dataset. They extracted 40,000 real-world ERs from Bugzilla. Notably, the dataset does not contain non-textual information. The proposed approach employs the non-textual information mentioned in ‘RQ2: Impact of Different Features’ because existing methods do not leverage such non-textual information. To this end, such information is extracted from Bugzilla according to the URL in the public dataset.
The involved ERs come from ten well-known S-APPs: Bugzilla, Calendar, Camino Graveyard, Core, Core Graveyard, Firefox, MailNews Core, SeaMonkey, Thunderbird, and Toolkit. Notably, the applications do not evenly distribute the ERs. Bugzilla, Calendar, Camino Graveyard, Core, Core Graveyard, Firefox, MailNews Core, SeaMonkey, Thunderbird, and Toolkit account for 12.45%, 4.00%, 3.15%, 18.98%, 2.69%, 18.00%, 5.35%, 20.59%, 10.34%, and 4.45% of the reports, respectively.
Results and Discussions
RQ1: Comparison against SOTA approaches
In addressing RQ1, the proposed approach is evaluated through comparison against Nizamani’s approach (Nizamani et al., 2017) (called Nizamani’s), Umer’s approach (Umer, Liu & Sultan, 2019) (called Umer’s), and Cheng’s approach (Cheng et al., 2021) (called Cheng’s). Evaluation results are described in Table 2. The first column specifies the evaluated approaches, the second column presents the employed performance metrics, and the other columns show the performance on different testing applications. The final column displays the average performance of the assessed approaches on all testing applications. The first row specifies testing applications, and the other rows present the performance of the evaluated approaches on the given testing applications. Note that all performance improvements mentioned below are based on the average values reported in the final column of Table 2, which aggregates the results across all S-APPs.
| Bugzilla | Calendar | Camino Graveyard |
Core | Core Graveyard |
Firefox | MailNews Core |
SeaMonkey | Thunderbird | Toolkit | Average | ||
|---|---|---|---|---|---|---|---|---|---|---|---|---|
| Proposed approach | Accuracy | 94.54% | 94.74% | 93.72% | 93.81% | 93.27% | 93.78% | 93.92% | 93.95% | 94.05% | 94.46% | 94.02% |
| Precision | 93.98% | 93.43% | 95.55% | 93.43% | 93.12% | 95.05% | 93.14% | 94.97% | 94.39% | 95.52% | 94.26% | |
| Recall | 94.17% | 93.97% | 94.32% | 94.46% | 94.67% | 93.32% | 93.82% | 93.12% | 93.31% | 93.86% | 93.90% | |
| F1-score | 94.08% | 95.31% | 94.97% | 94.14% | 93.89% | 94.18% | 93.48% | 94.03% | 93.85% | 94.68% | 94.26% | |
| Cheng’s approach | Accuracy | 82.60% | 81.36% | 81.52% | 81.15% | 83.77% | 82.87% | 83.00% | 83.04% | 82.98% | 81.51% | 82.38% |
| Precision | 91.97% | 90.74% | 91.94% | 90.22% | 89.91% | 90.71% | 91.09% | 89.70% | 89.57% | 90.45% | 90.63% | |
| Recall | 79.81% | 79.42% | 79.26% | 81.48% | 81.07% | 79.43% | 79.27% | 81.62% | 79.12% | 80.45% | 80.09% | |
| F1-score | 85.46% | 84.70% | 85.13% | 85.63% | 85.26% | 84.69% | 84.77% | 85.47% | 84.02% | 85.16% | 85.03% | |
| Nizamani’s approach | Accuracy | 60.23% | 54.08% | 71.08% | 65.64% | 64.92% | 74.03% | 76.93% | 56.56% | 78.79% | 80.13% | 68.24% |
| Precision | 55.64% | 58.82% | 51.63% | 53.65% | 39.75% | 45.11% | 50.51% | 29.29% | 40.51% | 56.30% | 48.12% | |
| Recall | 75.70% | 39.26% | 23.17% | 72.40% | 76.00% | 55.13% | 41.50% | 44.30% | 38.01% | 60.48% | 52.60% | |
| F1-score | 64.14% | 47.09% | 31.99% | 61.63% | 52.20% | 49.62% | 45.56% | 35.26% | 39.22% | 58.32% | 48.50% | |
| Umer’s approach | Accuracy | 74.66% | 78.66% | 77.90% | 78.64% | 72.70% | 80.02% | 73.76% | 83.29% | 79.52% | 79.90% | 77.91% |
| Precision | 75.16% | 95.79% | 97.12% | 70.36% | 90.91% | 75.94% | 97.92% | 76.49% | 88.35% | 94.75% | 86.28% | |
| Recall | 53.34% | 63.61% | 61.68% | 73.08% | 59.27% | 71.46% | 68.65% | 73.83% | 73.52% | 66.01% | 66.45% | |
| F1-score | 62.40% | 76.45% | 75.45% | 71.69% | 71.76% | 73.63% | 80.71% | 75.14% | 80.26% | 77.81% | 74.53% |
From Table 2, the following observations are noted:
-
Initially, the proposed approach marks a notable enhancement over the existing SOTA. Compared to Cheng’s, Nizamani’s, and Umer’s, the proposed approach improves the average accuracy by 14.12%, 37.78%, and 20.68%, respectively. Concerning other performance metrics, the proposed approach also significantly outperforms existing approaches. The minimal improvement in average precision, average recall, and average F1-score is 10.85%, 94.35%, and 26.47%, respectively.
Second, concerning the synthetic metrics (accuracy and F1-score), proposed approach significantly outperforms Cheng’s, Nizamani’s and Umer’s on every testing applications. The improvement in accuracy varies from 13.10% to 14.93% (compared against Cheng’s), 18.23% to 72.47% (compared against Nizamani’s), and from 13.75% to 28.29% (compared against Umer’s). Improvement in F1-score varies from 11.30% to 11.26% (compared against Cheng’s), 48.60% to 192.22% (compared against Nizamani’s), and from 18.09% to 49.66% (compared against Umer’s).
Third, the proposed approach significantly improves recall on every testing application with an average improvement of 17.24% (compared against Cheng’s), 78.52% (compared against Nizamani’s), and 41.31% (compared against Umer’s). As the cost of the significant improvement in recall, the precision of the proposed approach reduces slightly on some of the testing applications (compared to Umer’s), i.e., 2.53% on Calendar, 1.64% on Camino Graveyard, and 5.13% on Mailnews Core. In contrast, it improves recall much more significantly in these applications by 47.73%, 52.92%, and 36.66%, respectively. As a result, the proposed approach significantly improves the synthetic metrics F1-score on such applications.
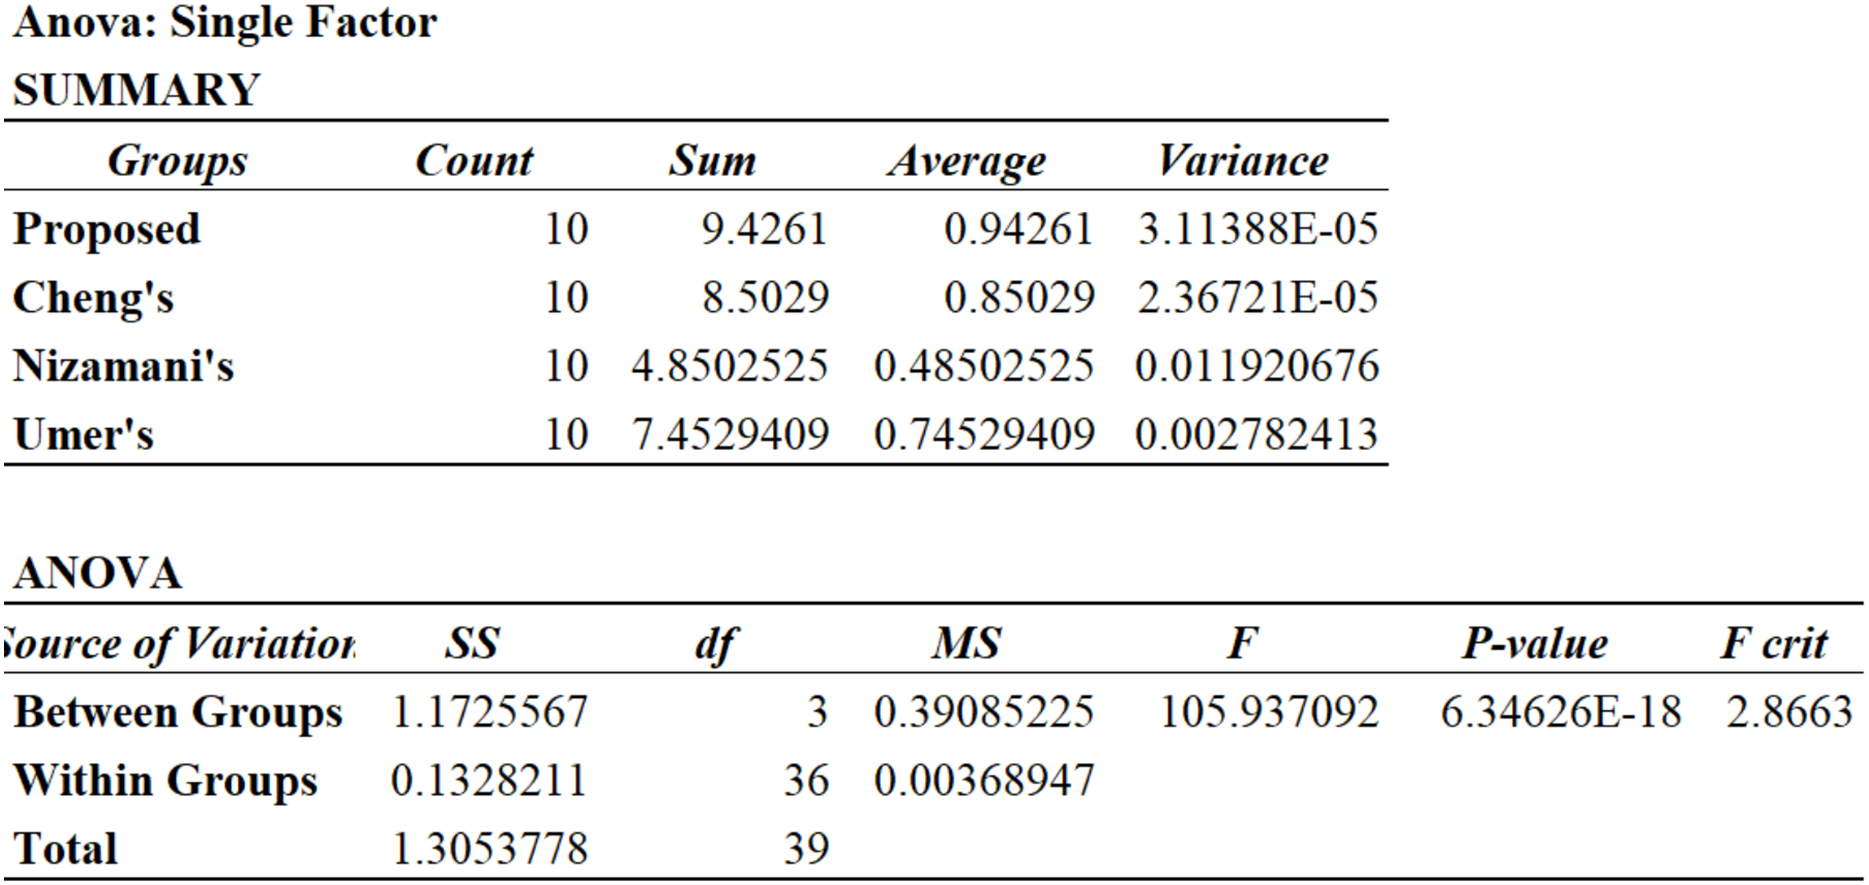
To further reveal the significant improvement, analysis of variance (ANOVA) and Wilcoxon test (pairwise) are performed on the synthetic measure F1-score to investigate the distinction in performance between the evaluated approaches. ANOVA analysis suggests that f-ratio is 105.94 and p-value is 6.35E−18 that is significantly smaller than 0.05 (Fig. 4). Results of the Wilcoxon test suggest p-value = 4.07E−6, which is also considerably smaller than 0.05. Based on the evaluation results, it is concluded that both ANOVA and Wilcoxon test suggest that there is a significant difference in the performance (F1-score) of different approaches. A similar analysis of other performance metrics also confirms the significant improvement.
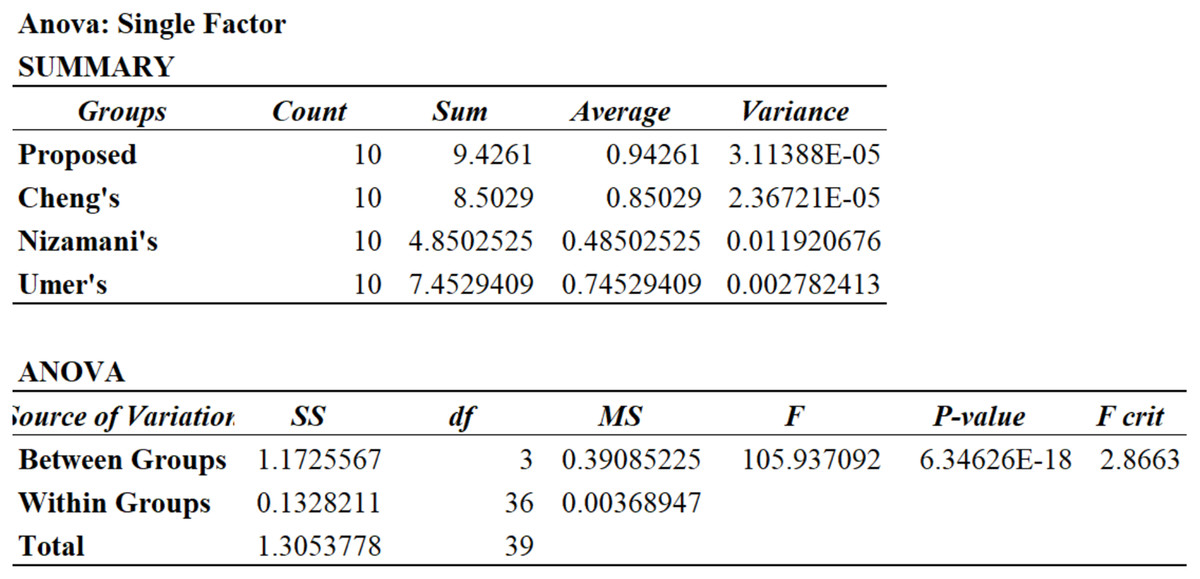
Figure 4: ANOVA analysis on F1-score.
It is concluded that the proposed approach significantly increases the SOTA in identifying feasible ERs based on the preceding analysis.
RQ2: impact of different features
Using the proposed approach, it is evaluated to what extent some of the employed features would reduce its performance to answer research question RQ2. Evaluation results are presented in Table 3. The first column specifies the setting, i.e., which features are disabled. Other columns present the proposed approach’s performance with the specified setting.
| Disabled features | Accuracy | Precision | Recall | F1 |
|---|---|---|---|---|
| Default setting | 94.02% | 94.26% | 93.90% | 94.26% |
| All textual features | 51.66% | 64.14% | 53.00% | 58.04% |
| Text | 50.37% | 64.77% | 51.07% | 57.11% |
| Sentiment | 91.10% | 91.45% | 91.06% | 91.26% |
| Non-textual info | 91.00% | 91.67% | 91.39% | 91.53% |
| Reporter’s statistics | 90.27% | 90.73% | 91.41% | 91.07% |
| nR | 91.54% | 91.67% | 90.28% | 90.97% |
| rR | 90.28% | 93.28% | 92.03% | 92.65% |
| Module’s statistics | 92.78% | 92.11% | 93.00% | 92.55% |
| nM | 92.54% | 92.76% | 93.67% | 93.22% |
| rM | 93.12% | 93.39% | 91.73% | 92.55% |
From Table 3, the following observations are made:
-
First, deactivating any of the employed features results in a reduction in performance. Compared to such a sub-optimal setting where some of the features are disabled, the default setting of the proposed approach (where all of the features are leveraged) leads to the highest accuracy, the highest F1-score, the highest precision, and the highest recall.
Second, textual information (including the summary of the reports and the sentiment of the summary) is critical for the proposed approach. Compared to other features, turning off all textual information results in the greatest reduction in performance of the proposed approach, 81.99% in accuracy, 46.96% in precision, 77.17% in recall, and 62.41% in F1-score.
Third, non-textual features (i.e., statistics of reporters and statistics of software modules) are useful. Turning off non-textual features reduces accuracy, precision, recall, and F1-score by 3.32%, 2.83%, 2.75%, and 2.98%, respectively.
Fourth, disabling modules’ statistics results in a minor reduction in performance. The resulting reduction in performance metrics (accuracy, precision, recall, and F1) is less than one percentage point. In contrast, disabling statistics of reporters results in a much more significant reduction in performance, 1.34% in accuracy, 2.33% in precision, 0.97% in recall, and 1.85% in F1-score. It may suggest that, concerning the identification of feasible ERs, statistics of reporters are more useful than statistics of modules.
Finally, it is observed that disabling results in a more significant performance reduction than . It may suggest that is more useful than in predicting whether a new ER is feasible.
After analyzing all of the employed features, it is concluded that they are all useful. A significant increase in performance is achieved by leveraging non-textual features, especially statistical reports.
RQ3: results of proposed approach compared to M/DL classification algorithms
To answer RQ3, the proposed BERT-based approach is compared with three alternative models: SVM, long short-term memory (LSTM), and convolutional neural network (CNN). Their results are shown in Table 4. To ensure fairness in comparison, all models are trained and evaluated using the same BERT-based embedding matrix as input and the same non-textual features. Furthermore, each baseline model undergoes appropriate hyperparameter tuning as shown in Table 5. Furthermore, the detailed configuration of hyperparameters for the proposed BERT-based approach is summarized in Table 1.
| Algorithm | Accuracy | Precision | Recall | F-measure |
|---|---|---|---|---|
| Proposed approach | 94.02% | 94.26% | 93.90% | 94.26% |
| CNN | 82.16% | 91.81% | 82.95% | 87.16% |
| LSTM | 80.73% | 91.56% | 74.81% | 82.34% |
| SVM | 80.25% | 85.82% | 76.58% | 80.94% |
| Model | Tuned parameters |
|---|---|
| SVM | Kernel: linear/RBF, C: 0.1–10, class_weight: balanced |
| LSTM | Units: 64, Dropout: 0.2, L2: 0.01, Epochs: 10 |
| CNN | Filters: 64, Kernel: 3, Dropout: 0.2, Dense units: 64 |
SVM is evaluated using a grid search over kernel types (linear and radial basis function (RBF)), regularization parameter , and class weight settings (balanced vs. unbalanced). The best configuration uses the linear kernel with and balanced class weights. However, a sequential architecture is constructed with one LSTM layer (64 units), followed by a dropout layer (rate = 0.2), and L2 regularization. The final output layer uses a sigmoid activation function. Training is performed for 10 epochs using a batch size of 32 and a validation split of 0.1. Early stopping is applied to prevent overfitting. The CNN model is also based on a sequential architecture. It consists of two convolutional layers with 32 and 64 filter sizes, followed by a MaxPooling1D layer (pool size = 2), and a fully connected dense layer with 64 units. ReLU is used for activation, and dropout (rate = 0.2) is applied. Like the LSTM model, CNN is trained using 10 epochs, a batch size of 32, and a validation split of 0.1. Notably, all models are trained using stratified splits with fixed random seeds for reproducibility, and all text inputs are processed using the same BERT tokenizer and sequence settings.
Table 4 presents the performance comparison of these models based on accuracy, precision, recall, and F1-score. Results confirm that the proposed approach outperforms all alternatives across all metrics, validating the benefit of combining contextual embeddings with auxiliary features in a unified architecture.
From Table 4, the following observations are made:
-
BERT surpasses LSTM, CNN, and SVM in performance. This enhanced performance can likely be attributed to its utilization of pre-training on extensive data, enabling it to acquire more insightful and versatile text representations. Furthermore, BERT incorporates attention mechanisms to grasp distant relationships and contextual details, enhancing its proficiency in comprehending and processing natural language.
The proposed approach surpasses the CNN model by improving accuracy, precision, recall, and F1 at 14.43%, 2.67%, 13.20%, and 8.15%, respectively. This is because BERT is better for natural language processing tasks. After all, it captures contextual information and relationships between words, leading to a more nuanced understanding of language, while CNN primarily focuses on local patterns without considering word dependencies.
The BERT model surpasses the LSTM model by improving accuracy, precision, recall, and F1 at 16.46%, 2.95%, 25.52%, and 14.48%, respectively. BERT captures bidirectional contextual information, capturing more complex relationships and nuances in language than LSTM’s sequential processing.
As described in the earlier analysis, applying the proposed approach leads to significant and noteworthy results in automatically identifying feasible ERs compared to other M/DL models.
Effect of resampling techniques on the proposed approach
The effect of different resampling strategies on model performance is summarized in Table 6. It is evident that resampling plays a crucial role in addressing class imbalance. Without resampling (Synthetic Minority Over-sampling Technique (SMOTE)), the model yields the lowest performance across all metrics, with an accuracy of 87.91% and an F1-score of 89.09%. In contrast, both over-sampling and under-sampling lead to noticeable improvements.
| Method | Accuracy | Precision | Recall | F1 |
|---|---|---|---|---|
| No-sampling | 87.91% | 93.43% | 85.16% | 89.09% |
| Over-sampling | 92.69% | 94.17% | 92.39% | 93.27% |
| Under-sampling | 90.28% | 96.05% | 89.55% | 92.69% |
Over-sampling achieves the highest accuracy (92.69%) and recall (92.39%), indicating that it effectively increases the representation of minority classes without discarding valuable training data. This balance allows the classifier to better capture positive instances, leading to a higher F1-score (93.27%).
Under-sampling, while slightly behind in accuracy (90.28%), attains the highest precision (96.05%), which suggests that reducing the majority class helps the model become more conservative in its predictions, lowering false positives. However, this comes at the cost of reduced recall due to the loss of informative samples from the majority class.
Overall, over-sampling is more effective for this dataset since it provides a balanced improvement across accuracy, recall, and F1-score, whereas under-sampling performs well only in precision but sacrifices training data richness. The observed differences are likely amplified by the small and highly imbalanced dataset. With larger datasets, the performance gap between over-sampling and under-sampling could diminish.
Statistical significance of the proposed approach
For the statistical analysis, paired t-tests are conducted between the proposed model and each baseline. The evaluation metrics are aggregated from 10-fold cross-validation for SVM, LSTM, and CNN, and from five repeated stratified train-test splits for the BERT-based model (as described in ‘Model Training and Prediction’).
As shown in Table 7, all p-values are well below the suggested significance level of . This indicates that the proposed approach achieves statistically significant improvements in accuracy, precision, recall, and F1-score over every baseline. The absolute performance of the proposed model further underscores this point, on average, it achieves an accuracy of 0.83, precision of 0.81, recall of 0.80, and F1-score of 0.82, consistently outperforming SVM (accuracy 0.69, F1-score 0.64), LSTM (accuracy 0.72, F1-score 0.68), and CNN (accuracy 0.70, F1-score 0.66).
| Baseline model | Accuracy | Precision | Recall | F1-score |
|---|---|---|---|---|
| SVM | 0.004 | 0.007 | 0.003 | 0.001 |
| LSTM | 0.003 | 0.006 | 0.002 | 0.001 |
| CNN | 0.002 | 0.005 | 0.004 | 0.001 |
Before applying the paired t-tests, the assumptions of the test are considered. Since the paired t-test is robust in repeated-measures settings where the same data partitions are used across competing models, and each model is evaluated on multiple folds of the dataset, the use of the t-test is justified. The test directly assesses whether the observed performance improvements of the proposed approach over the baselines are statistically significant.
In short, the statistical significance analysis confirms that the observed performance gain of the proposed approach is not due to random variation. The results provide strong empirical evidence that the proposed approach substantially advances the SOTA in automatically identifying feasible ERs.
Threats to validity
A possible limitation to external validity is that the evaluation includes only a restricted set of ERs. The assessment is conducted on the dataset (Nizamani et al., 2017) created by Nizamani, which is composed of 40,000 ERs from 10 applications. While the effectiveness of the proposed approach shows slight variations across applications, generalizations based on the chosen applications may not apply to others.
Another threat to external validity is that while evaluating the effect of BERT, the proposed method is solely contrasted with SVM, CNN, and LSTM models. CNN, LSTM, and SVM are selected because they are highly popular and have been proven effective in text classification. However, employing other neural network models may result in different conclusions. In the future, more classification models will be considered to validate the findings.
A potential concern regarding construct validity is the possibility of inaccuracies in the labels of the utilized dataset. Umer, Liu & Sultan (2019) labeled the employed ERs according to their status in issue tracking systems. However, manual labeling could be inaccurate for various reasons (Umer, Liu & Sultan, 2019), and the status of the reports may change over time (e.g., reconsidering some ERs). Consequently, some labels may fail to represent the real status of the associated ERs. Such inaccurate labeling could result in the evaluation being incorrect.
Conclusions and future work
Automatic and accurate identification of feasible ERs from numerous candidates is strongly preferred. This article proposes a novel approach to automatically identify feasible ERs. Unlike existing methods, it utilizes non-textual features of ERs that existing methods have not exploited. Besides that, it leverages advanced DL techniques like BERT that existing approaches have not yet used. The proposed approach significantly outperforms existing approaches on real-world ERs from popular applications.
A possible research direction for future work is to explore additional features of ERs. This article explores and exploits the statistics of reports and the statistics of modules. Evaluation results suggest that they are useful for automatically identifying feasible ERs. However, plenty of features have not yet been fully explored, e.g., the time and location of submission, and the schedule of the next release. In the future, it could be interesting to explore such features. Another possible research direction for future work is to create a larger collection of real-world ERs. A large and real-world dataset is critical for the evaluation of related approaches. Such a dataset is also essential for manual analysis of ERs, which may result in useful features of ERs. Discovering such new features may facilitate the automated identification of ERs.
A significant limitation of the proposed approach is the “black box” nature, i.e., lacking actionable insight. The proposed approach predicts labels for enhancement reports, like all neural network-based approaches. Still, it is challenging, if not impossible, to understand what caused it to arrive at this prediction. Consequently, the performance can be presented in metrics to validate the proposed approach in the evaluation part. However, it cannot be explained exactly why some predictions are correct, whereas others are incorrect. To this end, an interesting but challenging task in the future is to reveal the mechanism of the black box.
Another important direction for future work is to improve the explainability of predictions made by deep learning models like BERT. Since such models often operate as “black boxes,” it is challenging to understand which input features contribute most to the final decision. Techniques such as Local Interpretable Model-agnostic Explanations (LIME) and SHapley Additive exPlanations (SHAP) could be explored to provide insights into individual predictions. Applying these methods would enhance user trust and facilitate debugging or refinement of the model by highlighting the most influential textual and non-textual features. Moreover, future work may also include benchmarking the proposed approach against more recent transformer architectures such as Robustly Optimized BERT Pretraining Approach (RoBERTa), Distilled BERT (DistilBERT), or A Lite BERT (ALBERT), which could offer further improvements in performance or efficiency.