
Automatic pancreatic cancer segmentation and classification in CT images using an integrated deep-learning approach
- Published
- Accepted
- Received
- Academic Editor
- Jiachen Yang
- Subject Areas
- Algorithms and Analysis of Algorithms, Artificial Intelligence, Computer Vision, Data Mining and Machine Learning, Neural Networks
- Keywords
- Pancreatic cancer, Deep learning, Modified ResNext (MResNext), Enhanced UNet model (EUNet)
- Copyright
- © 2025 Dodda and Muneeswari
- Licence
- This is an open access article distributed under the terms of the Creative Commons Attribution License, which permits unrestricted use, distribution, reproduction and adaptation in any medium and for any purpose provided that it is properly attributed. For attribution, the original author(s), title, publication source (PeerJ Computer Science) and either DOI or URL of the article must be cited.
- Cite this article
- 2025. Automatic pancreatic cancer segmentation and classification in CT images using an integrated deep-learning approach. PeerJ Computer Science 11:e3263 https://doi.org/10.7717/peerj-cs.3263
Abstract
Background
Successful treatment for pancreatic cancer depends on timely and precise diagnosis because the disease has a low chance of survival. The critical challenge of effectively distinguishing between tumorous and non-tumorous pancreatic tissues in computed tomography scans is pancreatic cancer classification. Using detailed cross-sectional images provided by computed tomography scans, radiologists and oncologists can examine the properties and morphology of the pancreas. Furthermore, deep learning algorithms can obtain precise image analysis and in-depth diagnostic knowledge for therapeutic use.
Methods
This research proposes an integrated artificial intelligence system based on deep learning to segment and classify pancreatic cancer. The tumor-affected region on computed tomography scans can be identified using an Enhanced UNet model segmentation technique. The Modified ResNext model is used to classify pancreatic cancer. Ultimately, the modified ResNext model’s hyper-parameter tuning is achieved using the tunicate swarm optimization algorithm, which helps to increase classification performance. The proposed deep learning models aim to create a reliable and accurate approach to enhance pancreatic cancer diagnosis performance. A benchmark computed tomography image database was used to test the suggested method’s experimental results.
Results
The experimental results show that the proposed Modified ResNext model effectively classifies the pancreatic cancer images into benign and malignant stages with a maximum accuracy of 99.85%, sensitivity of 99.76%, specificity of 99.72%, precision of 99.54%, F-measure of 99.23%, it offers huge possibilities and safety in the automated diagnosing of benign and malignant malignancies. The proposed Enhanced UNet model correctly segments the accurate region of the pancreatic tumor with a higher Intersection Over Union of 96.04% and Dice Similarity Coefficient (DSC) of 95.87%. A comprehensive analysis of the results showed that the proposed strategy performed favorably compared to more cutting-edge techniques. The pancreatic cancer classification and tumor segmentation performance using the proposed integrated model was excellent, indicating its ability to detect pancreatic cancer effectively and precisely.
Introduction
Pancreatic cancer is one of the most aggressive malignancies, with a poor prognosis and a high mortality rate due to its late-stage diagnosis and limited treatment options (JagadeeswaraRao & Sivaprasad, 2024; Li et al., 2024). In 2020, pancreatic cancer accounted for approximately 496,000 cases worldwide, with 466,000 reported deaths, making it the seventh leading cause of cancer-related mortality globally (Qu et al., 2024; Shen et al., 2024). The disease is often asymptomatic in its early stages, leading to late detection when therapeutic interventions are less effective (Zhang et al., 2024). The absence of reliable early diagnostic tools significantly contributes to high mortality rates, necessitating the development of advanced, automated systems for early detection and classification (Juneja et al., 2024). Traditional imaging techniques, such as computed tomography (CT) scans, are widely used for pancreatic cancer diagnosis (Saxena & Saxena, 2023). However, about 40% of tumors smaller than 2 cm remain undetected using conventional CT imaging techniques, making early detection a major clinical challenge (Yugandhar & Naidu, 2024). Consequently, the development of computer-aided diagnosis (CAD) systems powered by deep learning can significantly enhance the ability to detect pancreatic cancer at an early stage, thereby improving survival rates (Gunesch et al., 2022; Sonnad et al., 2025).
Recent advancements in artificial intelligence (AI) and deep learning have significantly improved medical image analysis, offering promising solutions for early cancer detection and diagnosis (Li et al., 2024). Convolutional neural networks (CNNs), in particular, have demonstrated exceptional performance in medical imaging tasks such as tumor segmentation, classification, and prediction (Gao et al., 2022b). AI-driven computer-aided diagnosis (CAD) systems have the potential to enhance radiologists’ ability to detect malignant lesions by analyzing large-scale imaging data with high precision and consistency (Boekestijn et al., 2024). These systems can automatically extract critical features from CT images, reducing the likelihood of misdiagnosis and minimizing human errors (Dzemyda et al., 2024). Moreover, artificial intelligence (AI) models can identify subtle patterns and anomalies that may not be apparent to the human eye, enabling more accurate and early-stage detection of pancreatic cancer (Karar, El-Fishawy & Radad, 2023; Qiao et al., 2022). Despite these advancements, existing AI-based approaches still face challenges, such as class imbalance, lack of generalizability, and limitations in distinguishing between malignant and benign tumors, necessitating further research into more robust and efficient deep learning architectures for pancreatic cancer detection (Zavalsız et al., 2023; Dinesh et al., 2023). Additionally, existing deep-learning approaches for pancreatic cancer diagnosis suffer from limitations such as poor segmentation accuracy, feature loss, and computational inefficiency (Vishnudas & King, 2023; Chhikara, Goel & Rathee, 2025). To address these challenges, we propose a hybrid deep learning framework integrating Enhanced U-Net (EUNet) for segmentation and Modified ResNeXt (MResNeXt) for classification. The proposed EUNet model surpasses conventional U-Net models in segmentation accuracy, making it particularly effective for localizing pancreatic tumor regions with high precision. In our proposed hybrid framework, MResNeXt is leveraged to distinguish malignant from benign pancreatic tumors, ensuring robust classification performance.
The EUNet-MResNeXt framework provides an end-to-end deep learning solution that integrates precise segmentation and high-accuracy classification. This hybrid approach not only improves diagnostic reliability but also offers a more computationally efficient solution compared to existing methods. The combination of advanced segmentation techniques in EUNet and the powerful classification capabilities of MResNeXt ensures that our proposed model achieves superior performance in pancreatic cancer detection and classification. Through extensive experiments, our model has demonstrated improved segmentation accuracy, classification robustness, and computational efficiency, making it a valuable tool for early pancreatic cancer diagnosis.
Problem statement
The accuracy of existing models, such as the basic UNet, SegNet, and DenseNet models, may be decreased since they cannot identify subtle and complicated features specific to pancreatic cancer. Conventional CNNs are helpful but frequently need more structural flexibility or depth to assess such complex data fully.
The degree of feature discrimination needed to concentrate on essential regions of interest may not be applied by the existing standard models for pancreatic tumor segmentation. This may result in a large number of false positives or false negatives, particularly when attempting to differentiate between benign and malignant pancreatic diseases.
Several accurate models are computationally costly, which makes them unsuitable for large-scale or real-time clinical applications. Additionally, they lack the processes necessary to generalize successfully when trained on small pancreatic cancer datasets.
We have created the Modified ResNext (MResNext) model for pancreatic cancer classification and the Enhanced UNet model (EUNet) for pancreatic cancer segmentation to address the issues above with the existing models.
Motivation
The size, shape, and texture of pancreatic cancer cells vary greatly depending on the imaging modality. Because of this, it is challenging for standard models to depict the distinctive features of malignant tissues accurately. The proposed models have a high segmentation accuracy and successfully capture the unique features of malignant tissues.
Because pancreatic cancer is aggressive, even minor classification errors might cause a delay in diagnosis or result in inappropriate treatment choices. Therefore, increasing classification robustness and precision is crucial. The proposed classification model reduces false positives and negatives while achieving excellent precision.
Because pancreatic cancer imaging datasets are frequently smaller and unbalanced, it can be difficult for models to identify subtle differences between early and advanced stages and generalize across various patient populations. Our proposed approach effectively detects both early and advanced stages of pancreatic cancer by capturing the complex features of the tumors and performing well on smaller datasets.
Effectiveness of proposed research
To overcome these particular difficulties, the Modified ResNeXt model (MResNeXt) incorporates architectural enhancements that increase feature extraction and facilitate improved generalization on small, intricate datasets. ResNeXt can more effectively identify complex patterns in the data by employing aggregated transformations, which are essential for distinguishing minor variations between benign and malignant tissues. MResNeXt is more versatile for classifying pancreatic cancer even when data is sparse or biased toward one category since it can accommodate various channel sizes and employ group convolutions. The proposed MResNeXt model addresses traditional models’ drawbacks regarding feature extraction, efficiency, and scalability, offering a viable way to enhance the accuracy and robustness of pancreatic cancer classification.
For the segmentation of pancreatic tumors, the Enhanced UNet (EUNet) model with Wide Context (WC) and Residual Extended Skip (RES) blocks provide several significant advantages. These changes are intended to address the difficulties of obtaining contextual information and minute features in intricate tumor locations, which are essential for precise pancreatic cancer segmentation. By keeping vital information at several levels, the combination of RES and WC blocks in the suggested EUNet segmentation model allows to segment tumors with greater accuracy and precision. As a result, the segmented regions have more distinct boundaries and fewer false positives and negatives. The EUNet model can sustain high performance without experiencing an unnecessary increase in computing complexity thanks to the RES and WC blocks.
Main contribution of the research
To improve the performance of pancreatic diagnosis, a deep learning-based integrated artificial system is proposed in this research.
A novel pre-processing pipeline combines Gaussian and median filtering for effective noise elimination and introduces the haze-reduced local-global (HRLG) technique for enhanced contrast in pancreatic CT images.
We propose an Enhanced UNet (EUNet) model with WC and RES blocks, improving tumor boundary segmentation in pancreatic cancer imaging. Our model achieves higher segmentation accuracy than conventional U-Net, ensuring precise tumor localization, which enhances classification performance.
Advanced tumor features, including higher-order, texture, shape, and intensity features, are extracted using the DenseNet-169 model, enabling robust tumor characterization.
A novel Modified ResNeXt model, equipped with a standard deviation-based regularizer (SD-Reg) and optimized hyper-parameters using the Tunicate Swarm Optimization algorithm (TSOA), is proposed for classifying pancreatic tumors as benign or malignant.
The proposed system is validated on a benchmark pancreatic cancer CT image database, demonstrating superior segmentation and classification performance, supported by high Dice Similarity Coefficient (DSC), Intersection over Union (IoU), accuracy, and precision metrics.
Organization of the research
The article’s structure is as follows: related prior works are covered in ‘Related Prior Works’. ‘Proposed Methodology’ presents the proposed hybrid deep learning models and the overall block diagram of the proposed system. In ‘Result and Discussion’, the experimental results of the proposed approach in both quantitative and qualitative ways are compiled and discussed. ‘Conclusion’ concludes with recommendations and a discussion of future directions.
Related prior works
This section reviews recent methods for segmenting and classifying pancreatic cancer using machine learning and deep learning. Table 1 shows the summary of existing methods for pancreatic tumor classification on CT images: techniques, performance, advantages, and limitations. A novel radiomics-based CAD method for CT images was created by Gai et al. (2022). First, the image noise is reduced and filtered by applying an image pre-processing algorithm. Then, the tumor region is segmented using the modified region growing algorithm. After that, the optimal radiomics features are computed and selected; then, the detected pancreatic tumor is classified by training and testing the SVM model.
| Reference | Year | Method | Results | Advantage | Disadvantage |
|---|---|---|---|---|---|
| Gai et al. (2022) | 2022 | SVM | Accuracy: 72.7% | (i) SVMs have relatively few hyperparameters to tune during training. | (I) It produces less accuracy for classification |
| Sensitivity: 60.6% | (ii) It performs well in high-dimensional processes during classification. | (ii) It can be computationally intensive, mainly when dealing with large datasets. | |||
| Specificity:81.8% | |||||
| Althobaiti et al. (2022) | 2022 | CFNN | Accuracy: 98.40% | (i) It significantly decreases the trainable parameters. | The segmentation performance has decreased. Improving classification performance requires a deep-learning model for segmentation |
| Sensitivity: 98.73% | (ii) Accurate and fast diagnosis is performed with this approach. | ||||
| Specificity: 97.75% | |||||
| F1-score: 98.82% | |||||
| Lakkshmanan & Ananth (2022) | 2022 | RDA-BPNN | Accuracy: 98.51% | A significant level of specificity and sensitivity is produced, along with accurate results. | (i) In real-time applications, it lowers the classifiers’ quality. |
| sensitivity: 98.54% | (ii) The network model’s reliability and interpretability are both lacking | ||||
| Specificity: 98.46% | |||||
| F1-score: 98.23% | |||||
| Khdhir, Belghith & Othmen (2023) | 2023 | CNN-GRU | Accuracy: 99.92% | (i) It improves classification accuracy and lessens the over-fitting issue. | Training takes a lot of time and is a highly complex procedure. |
| Precision: 99.64% | (ii) This approach correctly classifies higher-resolution images. | ||||
| F1-score: 99.72% | |||||
| Recall: 99.53% | |||||
| Zhou et al. (2023) | 2023 | DN-Net | Precision: 89.98% | It generates precise results for pancreatic segmentation. | (i) The model’s overall complexity is improved. |
| Recall: 87.08% | (ii) Especially when working with limited training data, there is a chance of over-fitting due to the increased model complexity. | ||||
| F1-score: 88.07% | |||||
| Vaiyapuri et al. (2022) | 2022 | Auto encoder (AE) | Accuracy: 99.35% | (i) Auto encoders are capable of reducing the dimensionality of features. It does not require any dimensionality reduction technique. | (i) It has several hyperparameters; finding the optimal set of hyperparameters can be challenging and may require extensive experimentation. |
| Sensitivity: 99.35% | (ii) It produces high classification accuracy | (ii) It increases the complexity of the network | |||
| Specificity: 98.84% |
The local variance-driven level set model was created by Shu & Yuan (2023), dynamically mixes the boundary information and the local variance difference for medical image segmentation. The local variance-driven level set model outperforms existing level set techniques in terms of accuracy and noise resistance. However, because of the intricate energy function optimization, the method is computationally costly, and its performance may deteriorate when weak boundary regions or very heterogeneous textures are involved.
For pancreatic cancer classification, a new deep learning-based technique was created by Althobaiti et al. (2022). This approach aims to identify and categorize pancreatic tumors from non-tumors. Adaptive window filtering (AWF) is used in this technique to eliminate noise. The image segmentation procedure also uses Kapur’s thresholding technique with Sailfish Optimizer. Additionally, feature extraction utilizing the capsule network (CapsNet) is derived to provide a set of feature vectors. A political optimizer (PO) with a cascade forward neural network (CFNN) is also used for categorization.
Lakkshmanan & Ananth (2022), created a deep learning-based method for classifying pancreatic cancer. Image pre-processing using the bilateral filtering (BF) approach is mainly used to remove noise. Additionally, the non-interactive GrabCut (NIGC) method is used to segment images. Then, a helpful set of feature vectors is produced using the ResNet152 model as a feature extractor. The red deer optimization algorithm (RDA)-tuned back-propagation neural network (BPNN), or RDA-BPNN model is used for pancreatic tumor classification.
Khdhir, Belghith & Othmen (2023) created the ALO-CNN-GRU model for pancreatic tumor detection. This approach aims to segment and classify the existence of cancerous tissue. The segmentation of pancreatic cancer region is performed using the Antlion optimization (ALO) technique. The CNN and GRU classifiers are used to classify the pancreatic cancer. Zhou et al. (2023) used a dual branch coding network (DB-Net) for segmentation. The semantic features of the pancreas and its surroundings are extracted using one branch, and the complex pancreas features are extracted using other branches in the encoder part. Next, using the fine-grained enhancement network (FE-Net), pancreatic tumors are segmented into different segments within the organ.
Chaithanyadas & King (2025) created an automated deep learning network models for pancreatic cancer segmentation and classification. To remove unwanted noise, the raw input images are first pre-processed using a hybrid CLAHE and median filter. Second, ASMO-assisted IAF-Unet is used to apply semantic segmentation to filtered images. Segmented images are processed by the CNN model to the point of radiomic feature extraction. In addition, deep features are extracted using cascade-net. Lastly, pancreatic tumor identification and classification are done using an Ensemble Learning-based Classifier with Cascade-net and CNN (ELC-Casnet-CNN) that uses AdaBoost, Random Forest, and Auto-Encoder.
An effective deep learning framework was presented by Nadeem et al. (2025). The tumor region of pancreatic cancer is segmented using UNet and watershed segmentation. Using a proposed reduced 11-layer AlexNet model, the system first classifies the identified tumor as a normal or pancreatic tumor before determining whether it is benign, pre-malignant, or malignant.
Shu et al. (2023) developed a reinforcement learning-based balanced distribution active learning (BDAL) framework for MRI cardiac multi-structure segmentation. From a vast number of unlabeled datasets, the deep Q-network architecture can train an efficient policy to choose a few sample and instructive images to be tagged. The agent can find representative and instructive images for annotation by using the shape attributes of the images and the balance of various class distributions to create new state and action representations. This BDAL technique offers an agent to enhance active learning’s capacity to choose images in order to increase segmentation accuracy. Additionally, tests and findings demonstrate that this BDAL approach works noticeably better than all baselines and alternative AL-based techniques. However, BDAL’s scalability in practical applications is limited by its reliance on the quality of the initial labeled data, which makes it susceptible to subpar annotations. Additionally, its computational complexity rises with the size of datasets.
Complex medical imaging tasks have recently been demonstrated to be successfully handled by attention-based systems. For instance, in oral multi-pathology segmentation tasks, the lead-assisting backbone attention network has proven to be effective (Li et al., 2025). Likewise, the interpretability of deep models in whole slide image analysis has improved thanks to multiple instance learning (MIL) techniques (Zhang et al., 2025). These findings aid in the creation of integrated deep learning models for the segmentation and classification of pancreatic tumors.
Research gaps
Most studies have focused on improving prediction accuracy with traditional classification methods and other feature selection approaches. In contrast, some of the studies produce results with noise, which has a significant impact on the model’s accuracy. Similarly, the number of features in the dataset significantly impacts both the computational complexity and accuracy of the machine-learning process. Consequently, in any machine learning process, selecting appropriate features for classification is essential. The proper classification approach still needs to be significantly improved to choose the relevant subset of features that contribute to more reliable and accurate predictions, even though various classification methods have previously been proposed by researchers for the datasets provided. To significantly reduce the computational complexity of the proposed classifiers, the classification technique has to identify a minimal number of critical features that could help achieve accurate classification. Moreover, improved accuracy requires an efficient classification technique. The proposed integrated deep learning methodology for pancreatic segmentation and classification aims to address the shortcomings of existing methods.
Conventional deep learning models for pancreatic cancer classification (e.g., standard ResNet, VGG, Xception) struggle to capture both local and global features effectively. They may not focus on critical region-specific details necessary for accurate benign and malignant classification. Many existing models fail to handle the challenges of small, indistinct pancreatic tumor regions, resulting in poor Dice similarity coefficients (DSC) and Intersection over Union (IoU) scores. Pancreatic tumors have high inter-patient variability, making it difficult for traditional models to generalize well across diverse datasets. Many deep learning models require high computational resources, making them impractical for real-time or clinical applications. Lightweight and optimized architectures are needed to balance accuracy and computational cost.
Proposed methodology
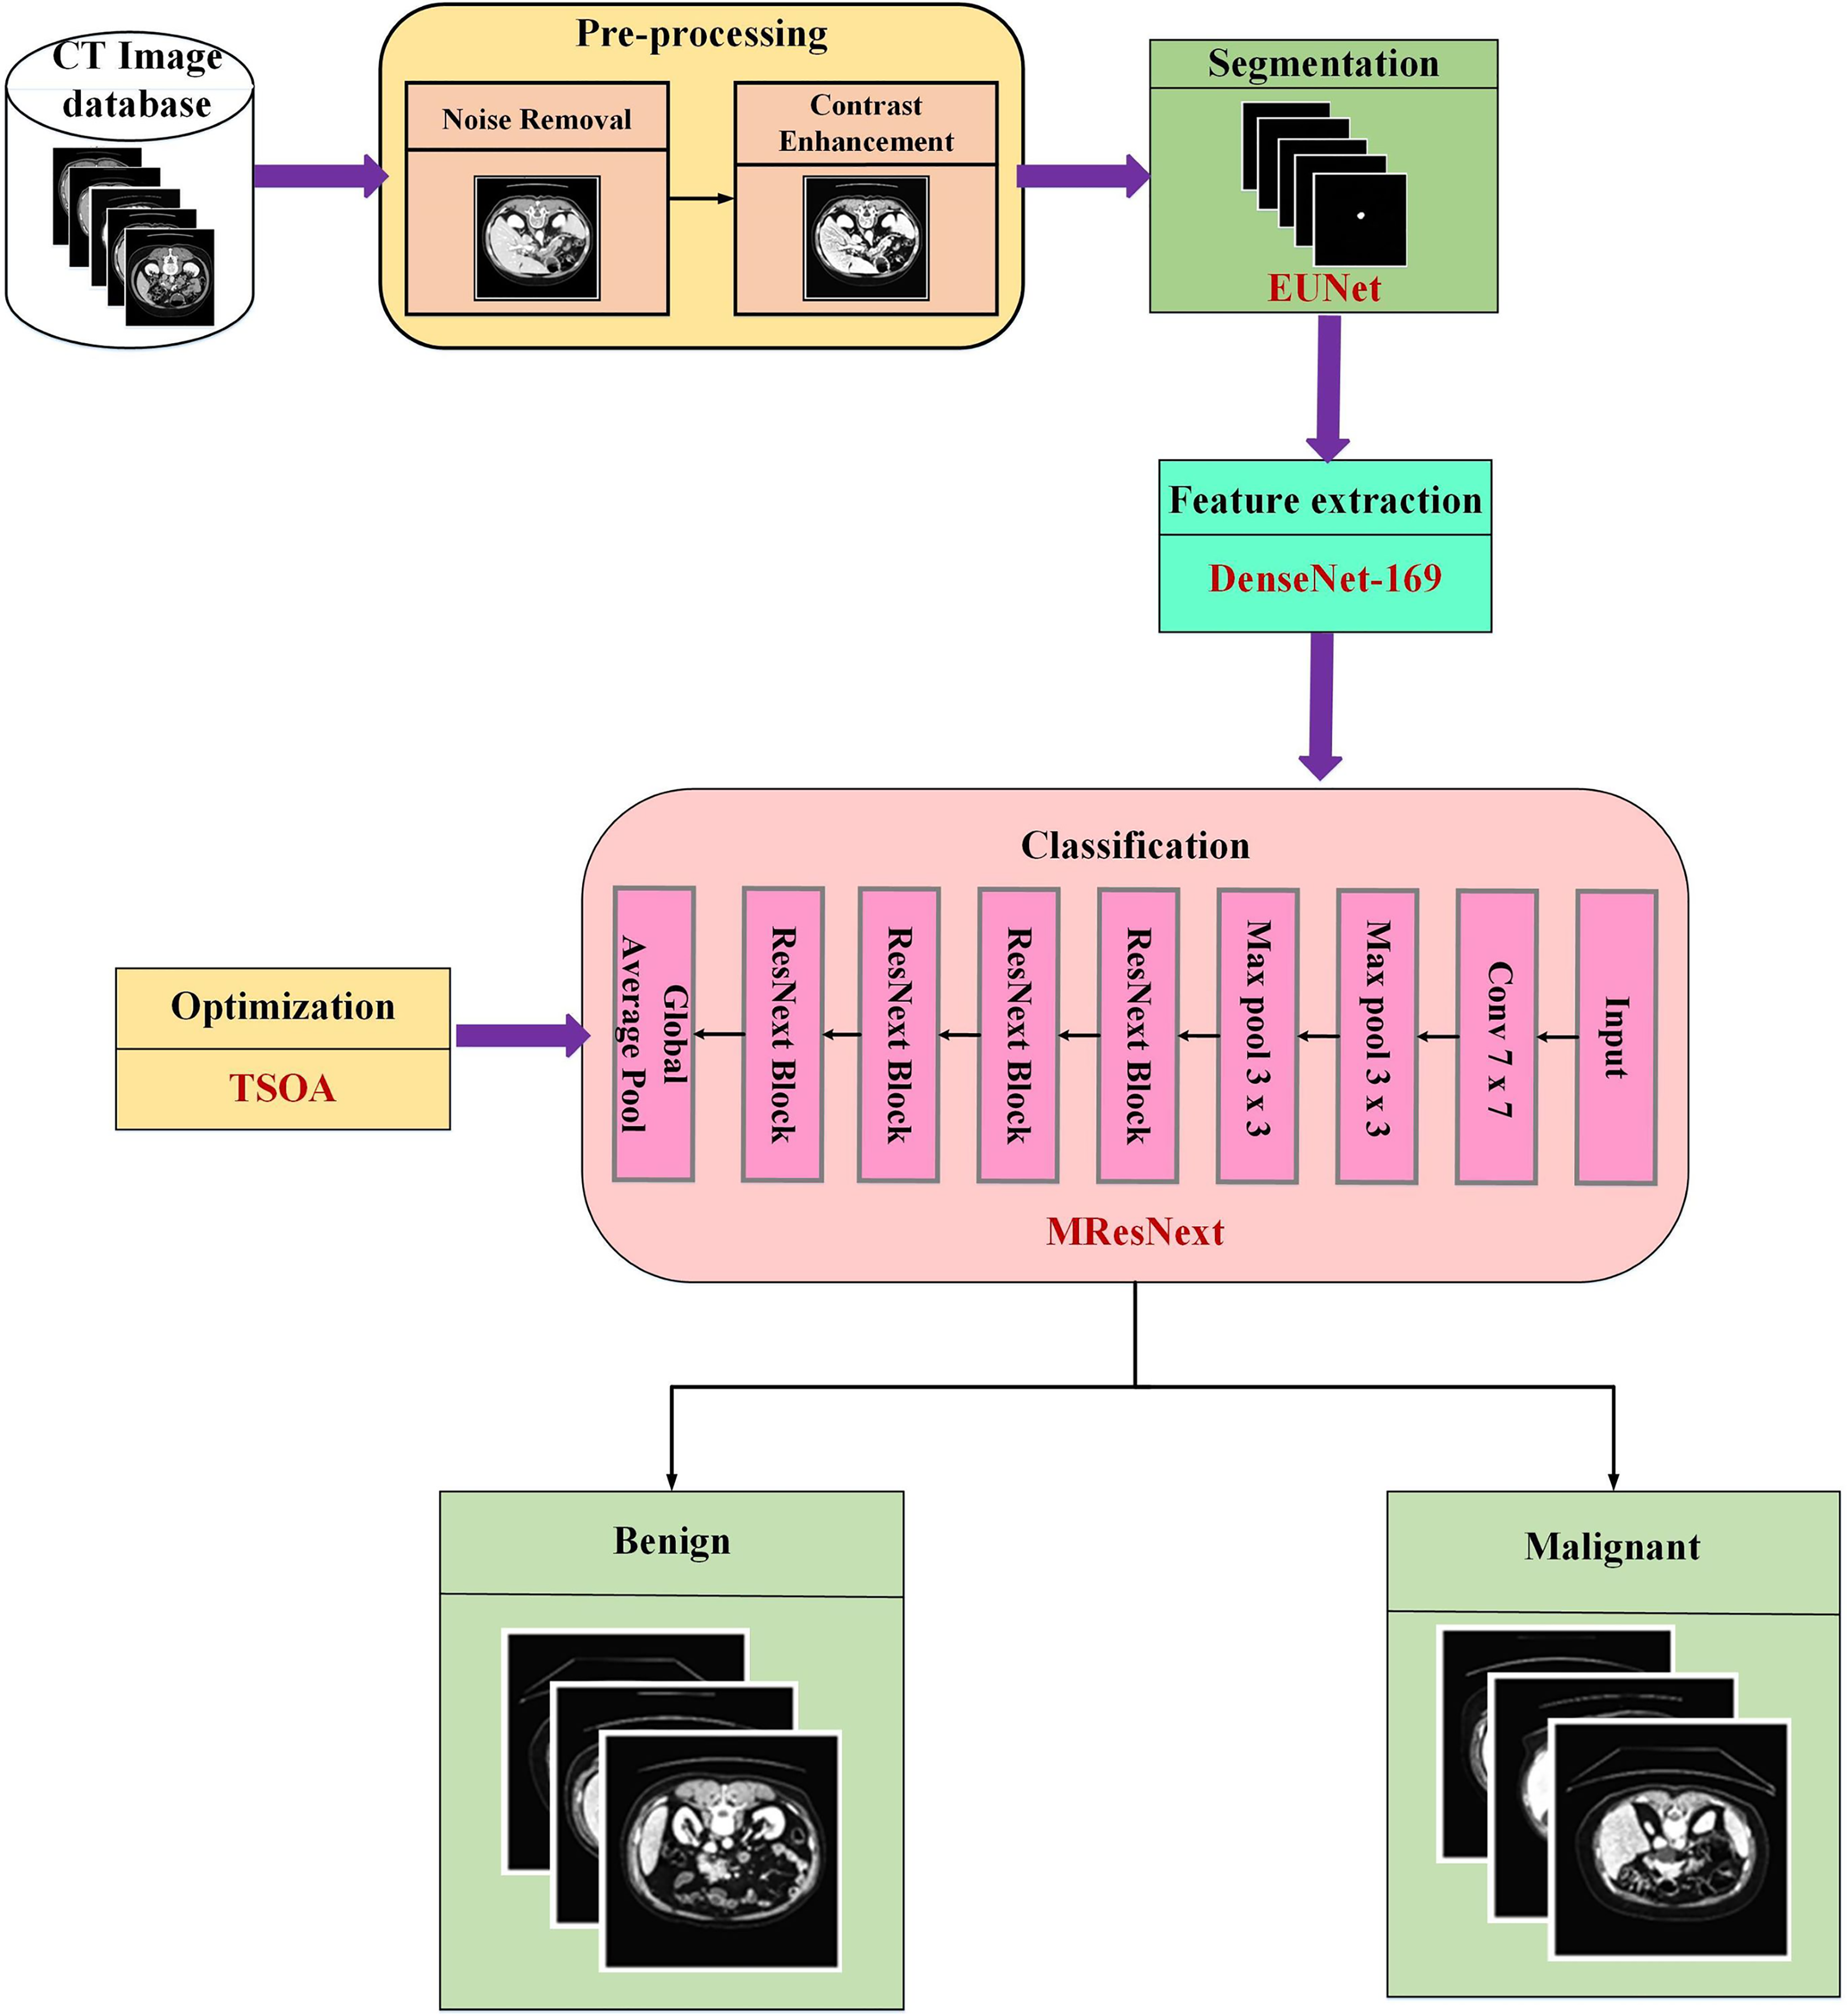
The main focus of this proposed research is the use of images from the pancreatic cell tumor classification dataset, which includes examples of both benign and malignant stages. A novel integrated deep learning-based approach is applied at every stage of image processing with the assistance of the Chapter 2 survey. Figure 1 displays the proposed methodology’s block diagram.
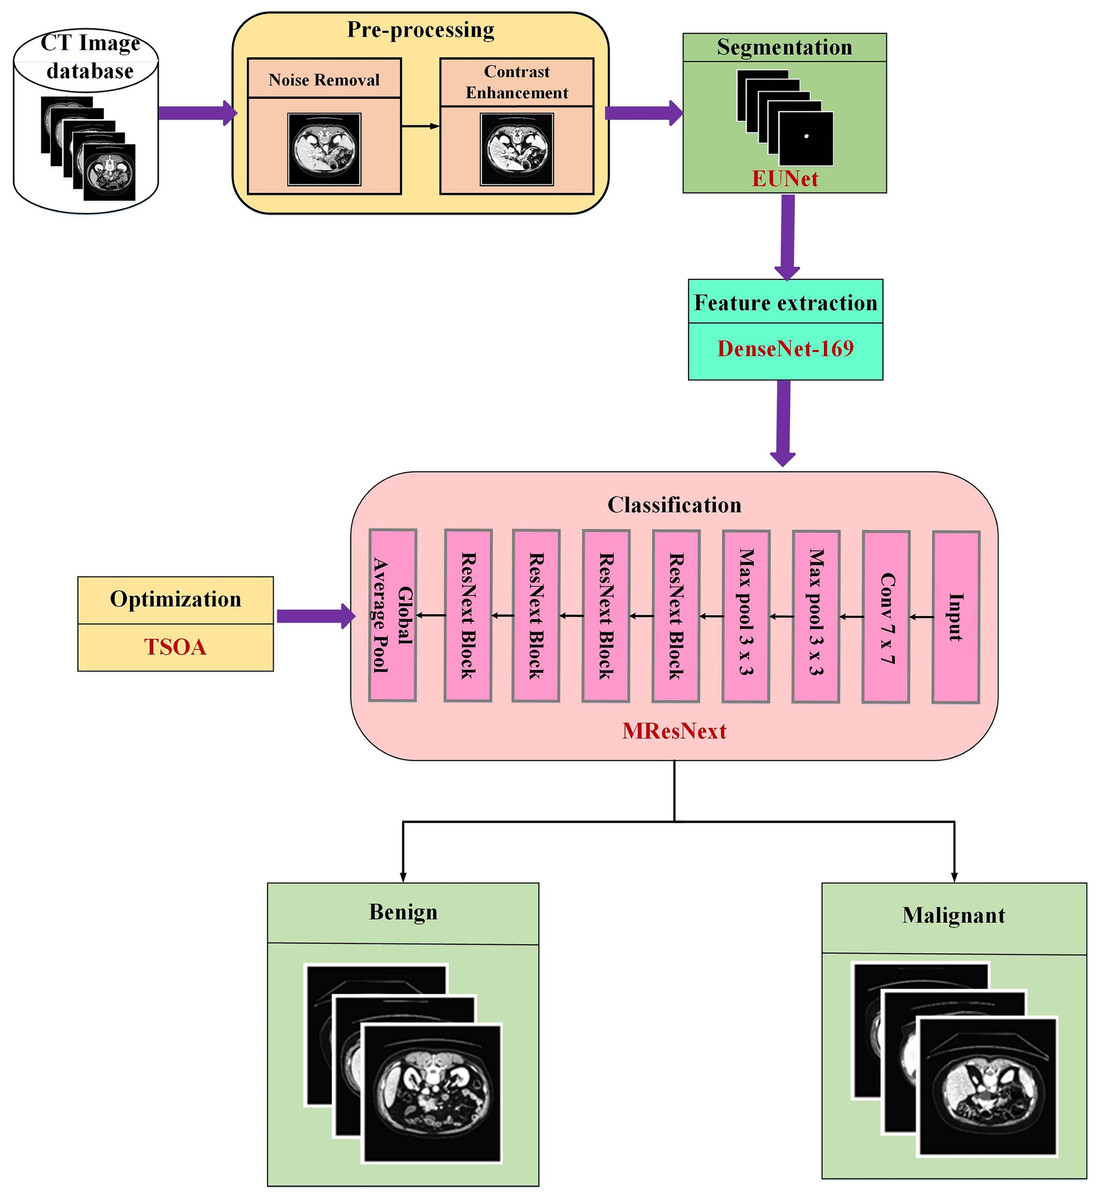
Figure 1: Schematic representation of the end-to-end pancreatic cancer analysis pipeline.
As pre-processing sets the image prepared for subsequent processing, it is a crucial stage in any categorization process. During the pre-processing phase, hybrid filters like Gaussian and median are used to eliminate unwanted noise from the input photos, and the HRLG approach is used to improve the contrast of the images. Then, the segmentation approach is used to remove the tumor’s interesting region from CT images. The EUNet model is utilized in the segmentation step to partition the tumour area precisely to improve classification accuracy. To extract the essential tumor features, such as higher-order, texture, shape, and intensity features, the segmented images are sent to the DenseNet-169 model. Afterwards, the MResNext uses the features gathered from the pancreas sample to categorize the tumor cells as benign or malignant. The TSOA algorithm is used to optimize the classification network’s hyperparameters.
Database
In this research, the experimental evaluation is performed using a publicly available dataset from Kaggle titled “Pancreas Cancer Segmentation” (https://www.kaggle.com/datasets/piyansusaha/pancreas-cancer-segmentetion/data). A total of 10,870 abdomen CT scans in DICOM and PNG formats make up this dataset, which has been carefully selected for the purpose of segmenting and classifying pancreatic cancers. The 512 × 512 pixel spatial resolution of each CT picture comes from contrast-enhanced abdominal scans. Both benign and malignant pancreatic tumor cases are included in the dataset, which offers a solid foundation for developing deep learning models for tasks involving binary classification and segmentation. CT scans from patients ranging in age from 25 to 80 are included in the dataset. The proportion of male and female patients is comparatively equal. A variety of sizes, shapes, and contrast levels are seen in tumor instances, which indicate both: Clearly defined tumor boundaries (easy cases), In order to facilitate supervised learning, tumors that are diffuse, low contrast, or irregularly shaped (difficult cases) are labeled as either benign or malignant. The very low number of instances of advanced-stage pancreatic cancer should be noted, too, since this could affect the generalization of models for late-stage diagnosis. Both 2D slice-level images and related segmentation masks are included in the collection. Although the dataset is curated at the slice level rather than as whole 3D volumes, each CT scan normally has numerous axial slices (around 80 to 150 slices per volume). Segmentation masks use binary labeling for tumor areas, where background (0) and tumor (1) are represented by pixel values.
Pre-processing
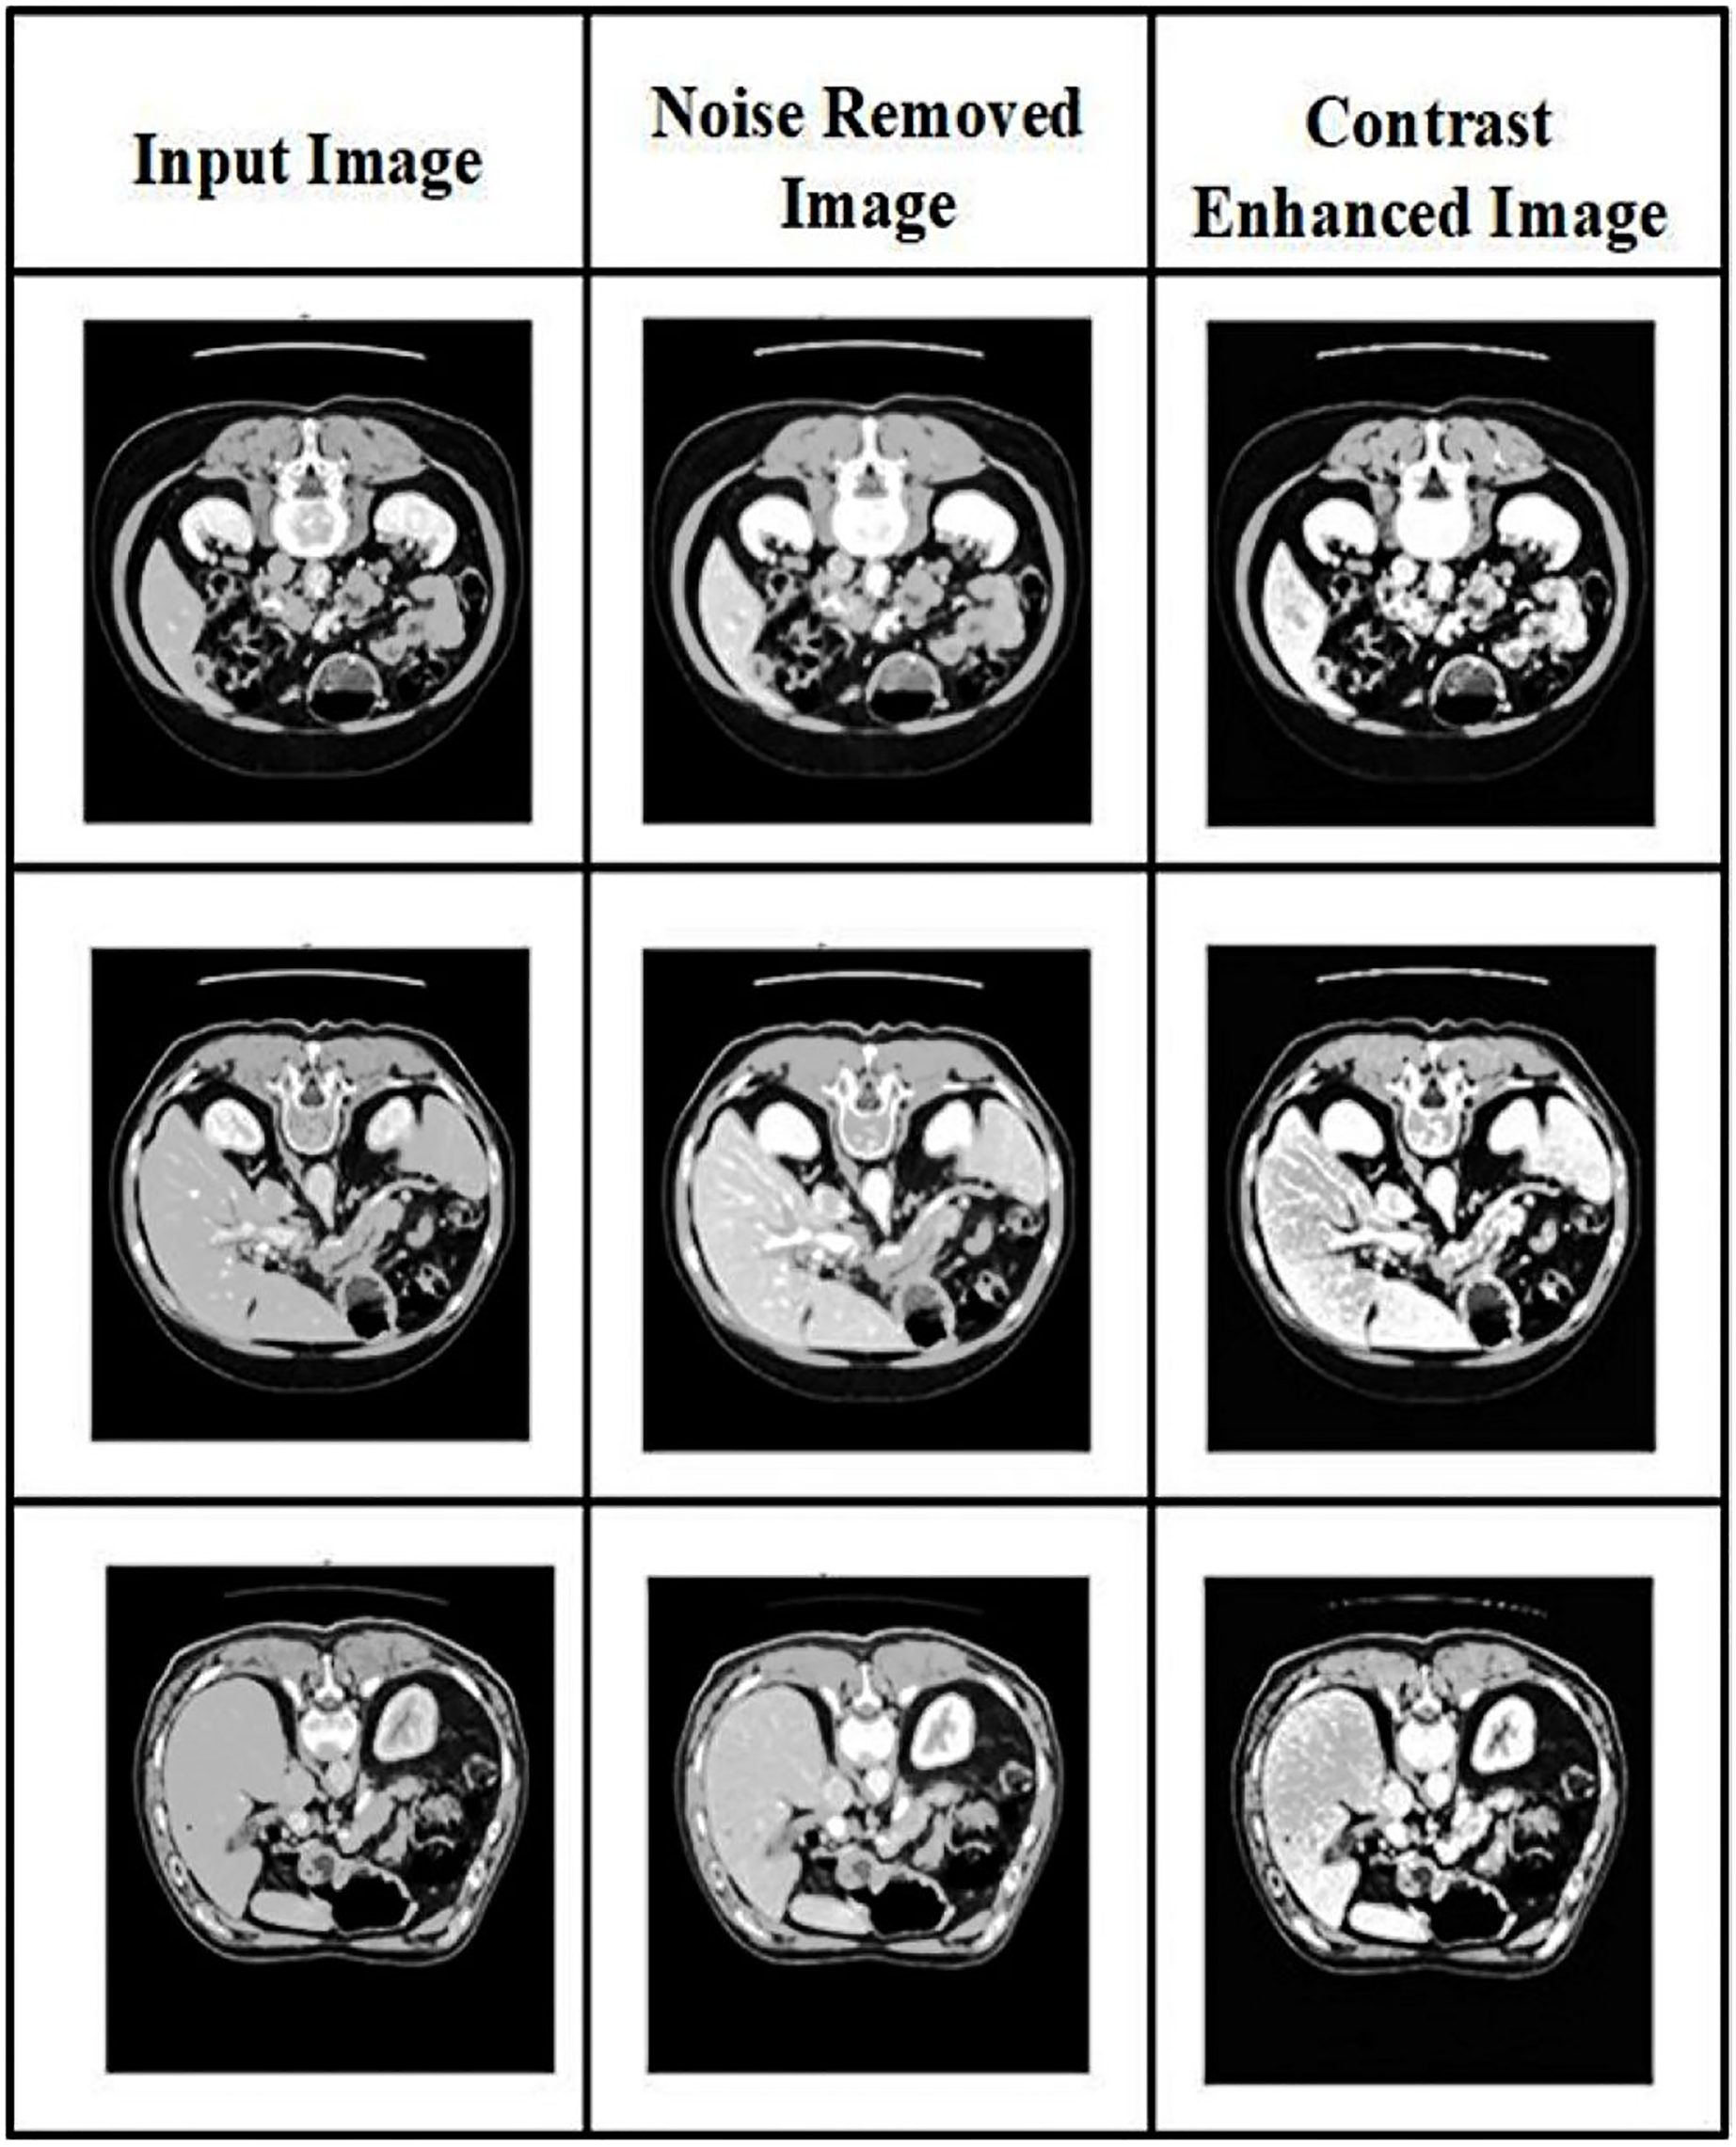
Two image processing techniques are performed in the pre-processing: noise removal and contrast enhancement. The resulting images after pre-processing are shown in Fig. 2.
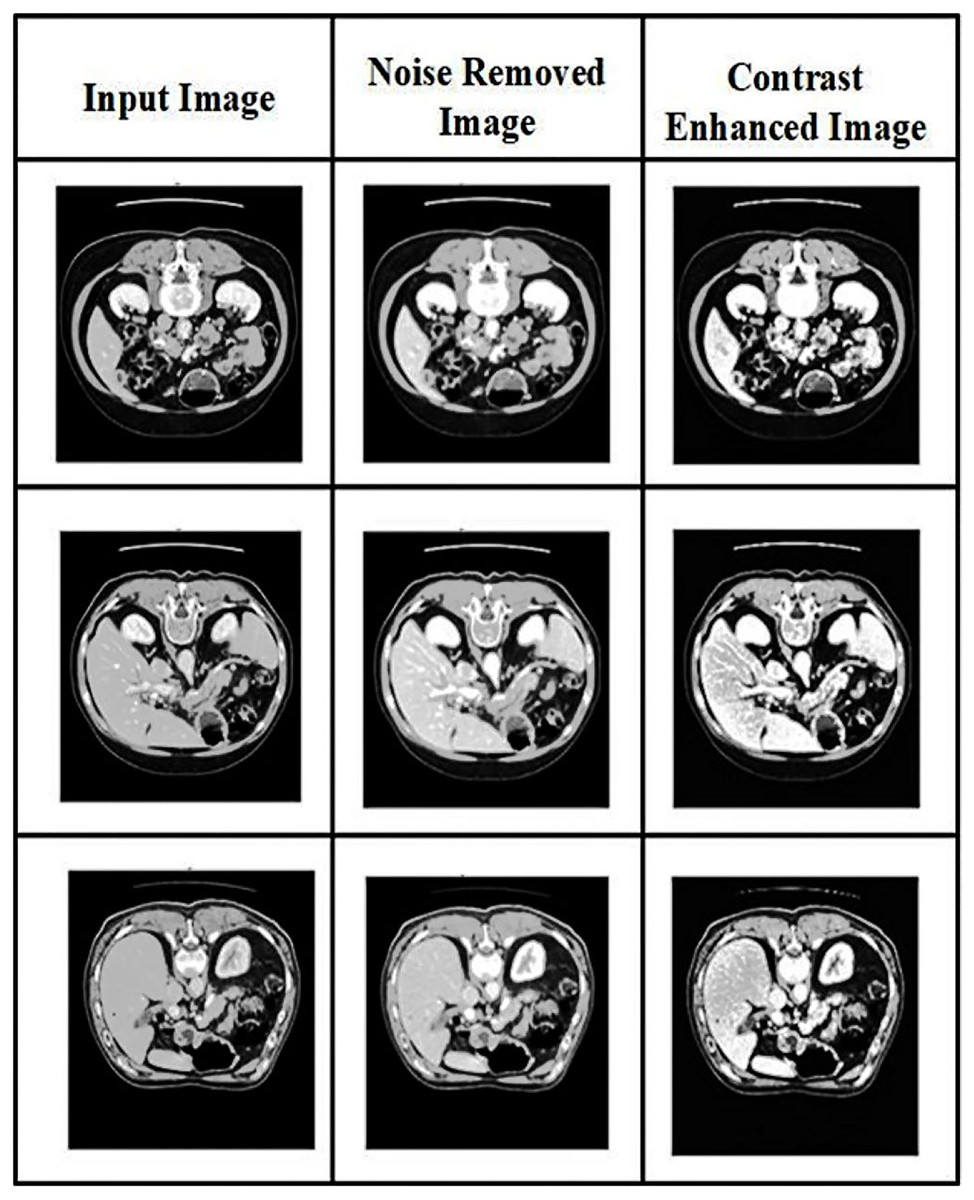
Figure 2: Visual representation of CT image pre-processing stages: noise removal and contrast enhancement.
Noise removing
Pre-processing is the first step in the detection of pancreatic cancer. It is used to eliminate unnecessary data in datasets. Unrelated noises impacting the computed tomography images slow the image analysis process. The CT images are affected mainly by speckle noises resulting from internal and exterior sources. Therefore, in CT pancreatic images, a hybrid filter reduces the noise. The combination of Gaussian and median filters is used in the present research. The Gaussian filter reduces residual differences in regional intensities and noise in the CT scans. Using the average value of surrounding pixels propagated according to Gaussian probability, the Gaussian filter replaces the noisy pixels in the images. Conversely, the median filter will return the grey level to each pixel and may be able to successfully eliminate spikey noises without affecting the image’s sharp edges. The proposed approach uses noise-reduced images to segment the pancreatic cancer images.
The Gaussian filter equation is:
(1) where the standard deviation is represented , the distribution’s mean is assumed to be 0.
The median filter equation is:
(2)
Here represents residual pixel removal.
The enhanced formula for CT image pre-processing is:
(3)
Here, each image’s pixel dimension is depicted as r. Each image has m as its denotation.
Contrast enhancement
Conventional haze removal methods seek to restore an image to a high level of quality by varying the saturation and contrast (Jabeen et al., 2023). The haze reduction process can significantly improve the scene’s visibility in the image. A hybrid method of local-global transformation and haze removal is used for contrast enhancement.
Consider M as a whole image database with N total images. The original image is described as with dimensional N × M × 3, and the final enhanced image is denoted as . We first performed a haze reduction approach to the original image using the dark channel as the basis. The following is the mathematical definition of the haze reduction procedure:
(4) where the observed intensity value is denoted as Q, the scene radiance is depicted as Y, the transmission map is denoted as , and the atmospheric light is W. By estimating the transmission map and atmospheric light, the dehazing technique is used to recover scene radiance :
(5)
Afterwards, the resulting Y is applied using the following formulation to determine an image’s global contrast:
(6) where is the resulting image of global contrast, the gain factor for global contrast is denoted as , the standard deviation of is denoted as σ, the global mean value of is represented as , an input pixel value of is represented by . The following mathematical function was used in the final phase to calculate the haze reduction image’s local contrast,
(7) where the image’s grayscale pixel after dehaze is shown , the dehazed image’s mean value is described as a small parameter value is α, and the local contrast is depicted as LC. The final enhanced image was obtained by applying the following mathematical equation to create a single image by combining the regional and global contrast-produced images.
(8)
Dataset splitting
For experimental evaluation, the dataset is randomly divided into test and training sets. After pre-processing, 80% of the data is used for training, and the remaining 20% of the data is used for testing. For experiment analysis, 9,035 images are used for training and 1,835 for testing. The training set consisted of 5,035 benign nodules and 4,000 malignant nodules, and the test set consisted of 1,035 benign nodules and 800 malignant nodules. The model is assessed using the test set.
Pancreatic cancer segmentation
Extracting the affected region from computed tomography (CT) images is a crucial stage in surgical operations like radiation therapy and cancer diagnosis. Different forms and sizes present challenges for existing computer-assisted segmentation approaches, while manual segmentation could be more laborious and operator-dependent. To overcome these difficulties, this research offers a EUNet model for precise pancreatic tumor segmentation from CT scans.
Recent segmentation models such as UNet, Attention U-Net, DeepLabV3+, UNet++, TransUNet, and Swin-UNet have advanced feature extraction capabilities but suffer from various limitations. Traditional U-Net models rely on standard convolutional layers, which may struggle to capture multi-scale contextual information. Attention U-Net improves focus on relevant regions but can miss fine-grained tumor details and is computationally expensive. DeepLabV3+, relying on atrous convolutions, struggles with small object segmentation and spatial information loss. UNet++ enhances skip connections but increases model complexity and is prone to over-fitting. Transformer-based models like TransUNet and Swin-UNet achieve strong global feature extraction but require high computational power and often struggle with local detail preservation. Our Enhanced U-Net (EUNet) model overcomes these challenges through WC blocks and RES blocks. The WC blocks improve multi-scale feature extraction, ensuring precise tumor boundary segmentation without excessive computational cost. The RES blocks enhance feature propagation, reduce over-fitting, and preserve fine-grained tumor details, making our model both efficient and highly accurate for pancreatic tumor segmentation. Unlike transformer-based models, EUNet achieves comparable performance with lower computational complexity, making it a practical choice for real-world medical applications. While conventional U-Net skip connections transfer low-level features directly, our RES blocks introduce residual learning, which helps in better gradient flow, feature reuse, and reducing vanishing gradient issues. This leads to more accurate localization of tumor regions with better shape preservation and less over-segmentation.
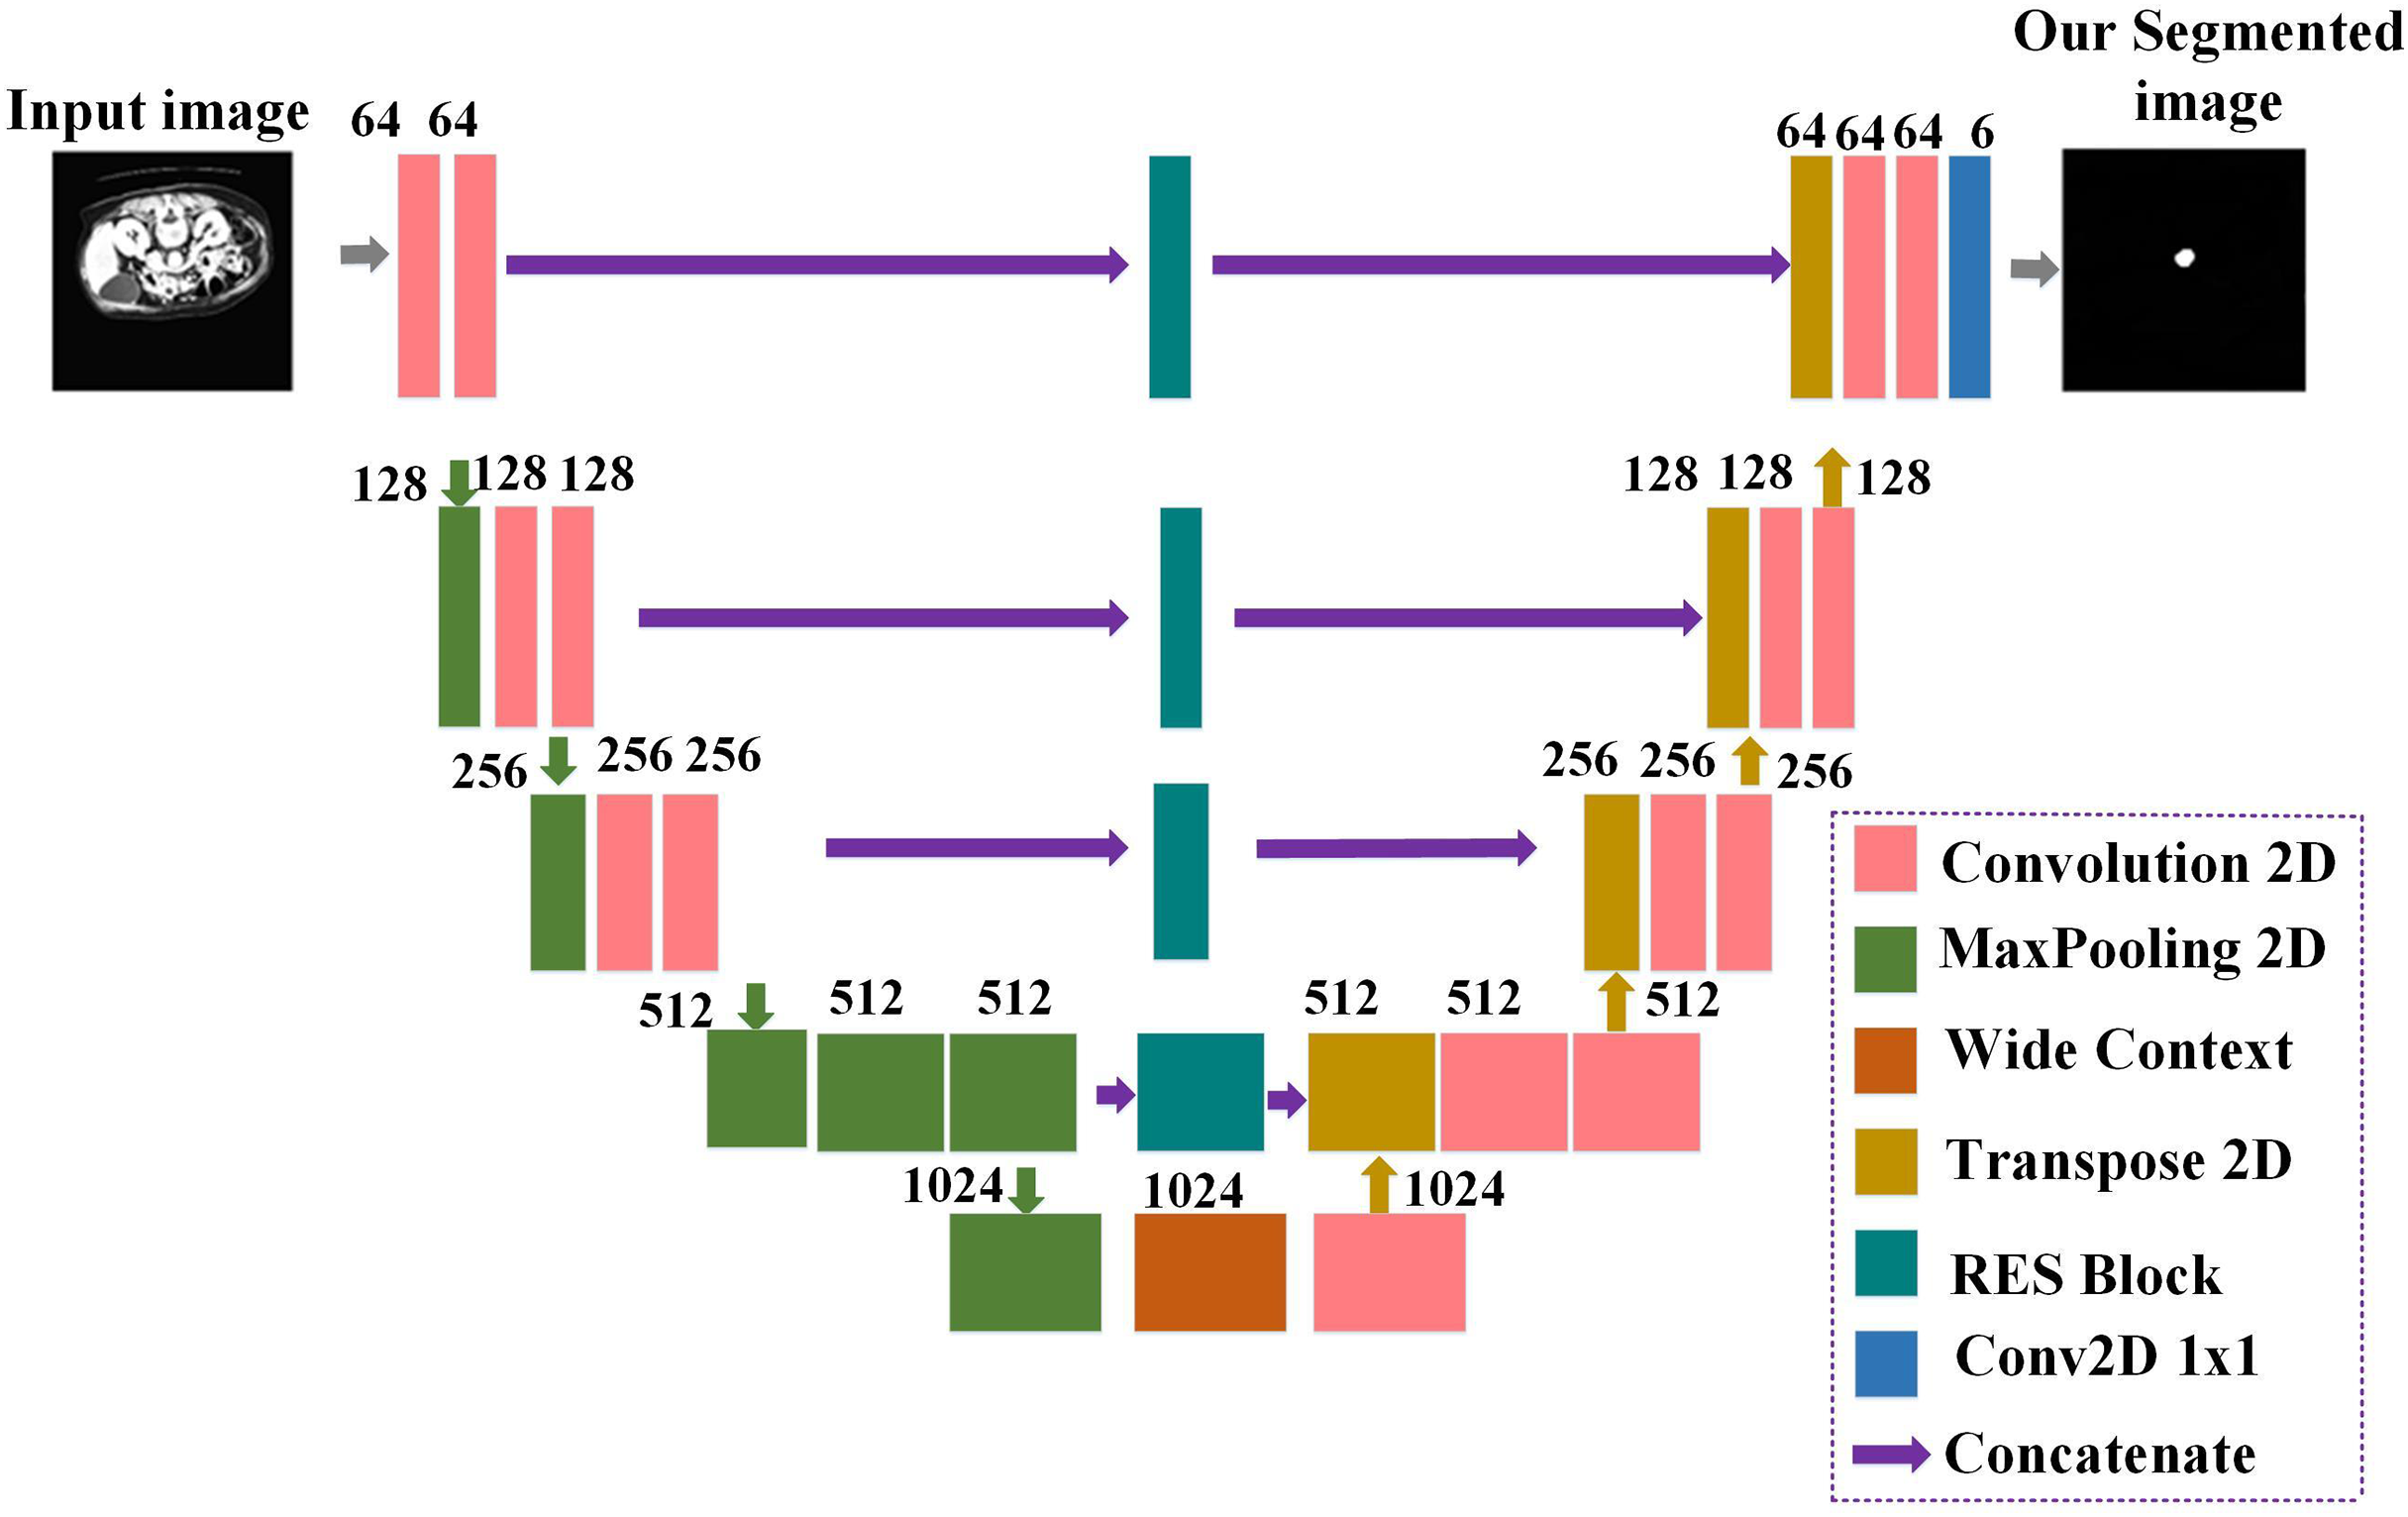
Prior baseline U-Net architecture (Yin et al., 2022) did not share contextual information between the deep and shallow layers. Enhancing the network’s local and global features requires introducing a module between the shallow and deep layers to share information. The proposed EUNet’s general architecture, consisting of RES blocks and a WC block, is depicted in Fig. 3. The design generates images of the same size when it receives input images with a resolution of 512 × 512. The proposed EUNet uses convolution layers with padding. This makes it possible to obtain an image with the same size as the input as the output.
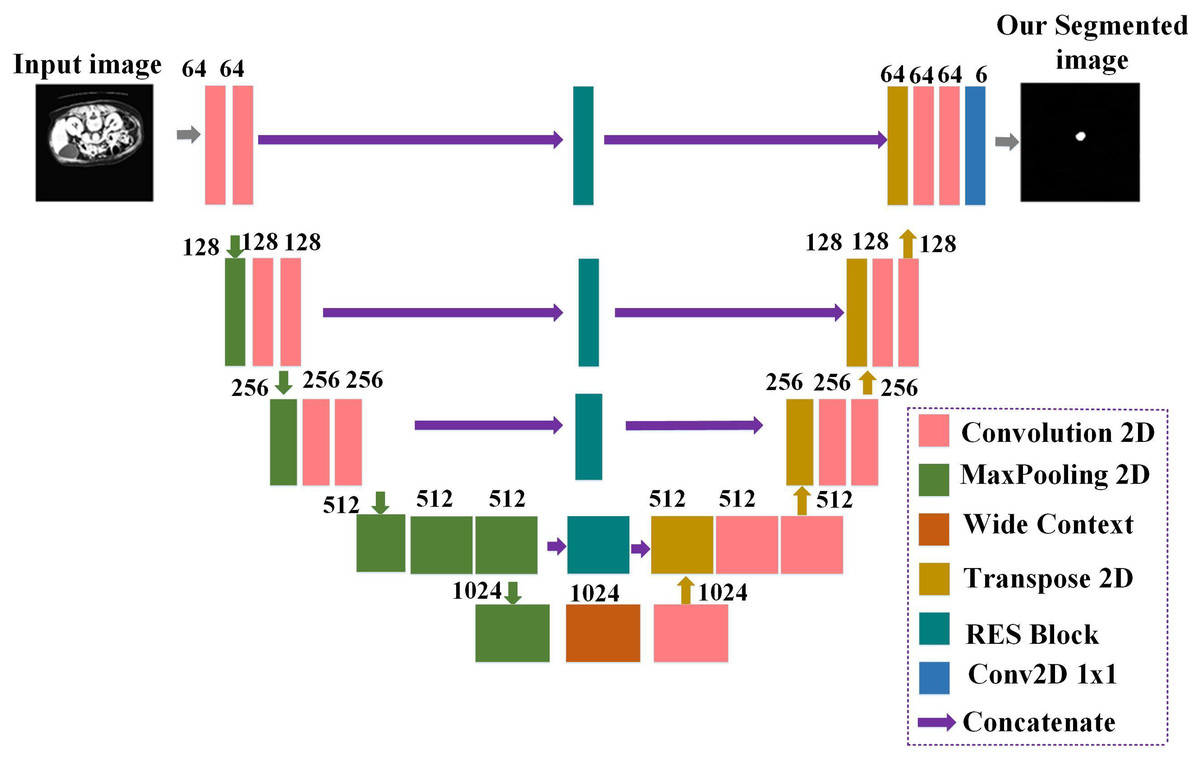
Figure 3: Detailed architecture of the proposed enhanced U-Net (EUNet) for tumor segmentation.
The network’s encoder and decoder are separated into blocks. Every block has two convolution layers: one max-pooling layer, one dropout layer, and one on the encoder side. Concatenation is performed between the output produced by the related RES block and the output of the Conv2DTranspose layer. Two convolution layers are added after dropout to the concatenated output. Six 1 × 1 filters comprise the final convolution layer in the decoder’s block. In an image, the decoder side handles image expansion while the encoder side handles image contraction. The proposed EUNet model employs a Softmax activation function for the last convolution layer, while batch normalization and ReLU activation functions follow each convolution layer.
The Improved UNet model proposed in this research differs from the baseline UNet and other existing segmentation methods in several significant ways. The conventional UNet uses simple convolutional blocks, which can have vanishing gradients in deeper networks and aren’t able to reuse features that have been learned.
In our proposed EUNet model, the EUNet adds skip connections within each convolutional layer by using residual blocks. This enables better feature reuse, adequate gradient flow during back-propagation, and an increased capacity to capture fine-grained features of the tumor region.
The ability of traditional UNet to comprehend global image features is limited since it does not specifically concentrate on obtaining contextual information across many scales. By enlarging the receptive region, wide context (WC) blocks improve the model’s ability to extract both local and global features. This allows for improved segmentation in complex locations by bridging the gap between shallow (regional) and deep (contextual) layers.
Standard UNet typically uses cross-entropy or Dice loss independently, which may lead to suboptimal segmentation performance, especially in imbalanced datasets. The proposed method creates a single loss function by combining weighted cross-entropy (WCE) and dice loss coefficient (DLC). WCE addresses class imbalance by giving minority classes (such as tumor regions) greater weights. DLC ensures accurate segmentation by concentrating on boundary precision and overlap. Segmentation performance is enhanced by this combined loss function, especially when dealing with small and irregular tumor regions.
Restoring the original input size becomes more difficult because the original UNet might not have used padding in its convolutional layers, which would have reduced the spatial dimensions of feature maps. Padding-equipped convolution layers guarantee that feature maps’ spatial dimensions are maintained across the network. As a result, the input and output sizes match precisely—improving spatial information preservation for segmentation at the pixel level.
The standard UNet’s encoder and decoder are simple and don’t specifically highlight how shallow and deep levels share contextual information. The encoder in our proposed EUNet model concentrates on feature extraction using residual blocks for improved gradient flow. At the same time, the decoder efficiently reconstructs fine-grained segmentation maps using WC blocks and skip connections.
Even in complex and noisy CT images, these enhancements enable the EUNet to more accurately separate pancreatic tumors by capturing both fine-grained details (local features) and wider anatomical structures (global features).
Residual extended skip
Five parallel connections are used in the architecture. The first convolution layer uses the N × 1 filter size. By the second convolution layer, a 1 × N size filter is used in each connection with convolution layers. The two cascaded convolution layers are used rather than a single N × N filter size convolution layer. The architecture benefits from using two convolution layers since fewer parameters are generated. Furthermore, tests revealed that the effect of cascading convolution layers with fewer parameters is comparable to that of a single convolution layer with more parameters. The input is forwarded as it is in the final connection, which is a skip connection. One output is obtained by adding the outputs from each of the five connections. Five connections’ outputs are added together to create a single output. The three convolution layers’ filter sizes are 3 × 3, 3 × 3, and 1 × 1.
Information deterioration is controlled in part by the RES block. The residual extended skip is scale-invariant because it executes contextual aggregation on several scales despite the considerable size variability in the cancer patches. By increasing the valid receptive field, the RES enables improved segmentation for the EUNet.
Wide context
Two parallel connections receive input from WC. Two convolution layers are present in each connection. The two convolution layers in the first connection use N × 1 and 1 × N, respectively. In the next convolution layers, the filter size 1 × N and N × 1 is used in the second connection. This variation in the two connections creates a robust feature set that can improve performance. It was noted that this variation alters the retrieved features, and both variations can influence the outcome. The combined outputs from the two connections are regarded as WC’s output.
Like RES, the broad context (WC) captures contextual information crucial for sub-classification across several cancer subclasses. Moreover, it aggregates the transition level feature, improving the segmented areas’ reconstruction.
Customized loss function
The imbalance of class data is a significant challenge for pancreatic tumor segmentation. The non-enhancing tumor covers the least volume, at only 0.23%. The considerable discrepancy severely impacts the performance of segmentation.
The DLC and WCE are added to create a combined loss function, which EUNet uses to solve the described problem.
(9)
(10)
where the total number of labels is depicted as N, and the weight given to the label “j” is · represents the segmented image’s predicted binary pixel value and represents the segmented image’s ground truth binary pixel value. The following equation describes the total loss function.
(11)
Two objective functions make up the loss function: Regardless of class, the DLC executes one objective function that optimizes the overlap between the ground truth and the predicted segmented regions, and WCE is used in the second objective function to classify the tissue cells according to their class.
Feature extraction
The DenseNet-169 is used for the feature extraction process in the research, which effectively extracts the local and global features of the images to enhance classification performance. By directly connecting every layer with an equal feature size to every other layer, DenseNets solves the gradient vanishing issue.
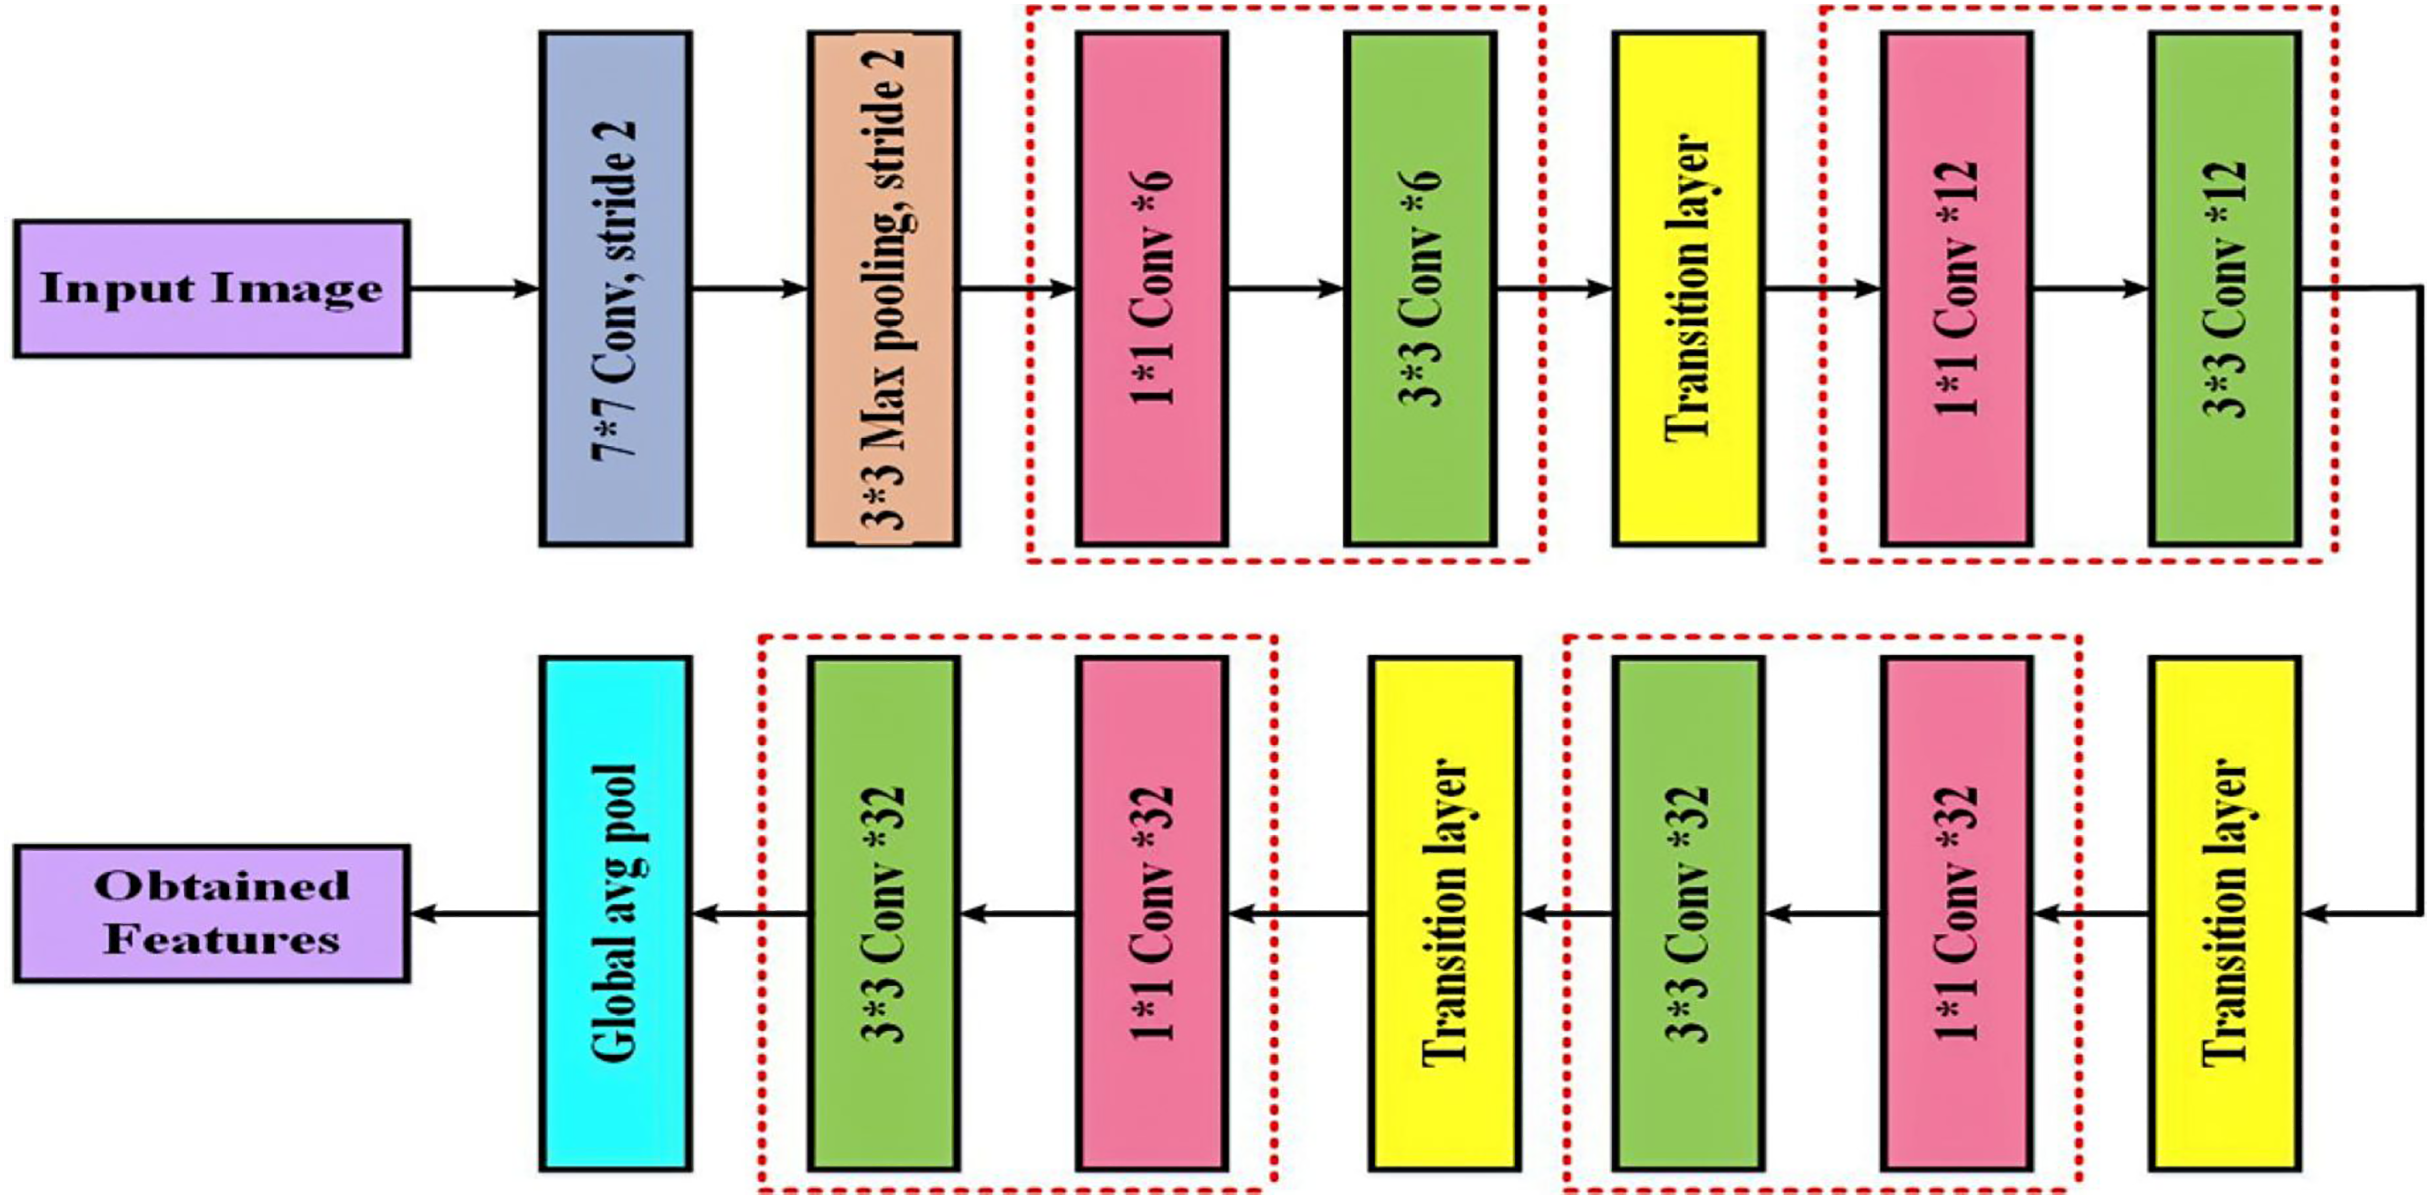
A convolution and pooling layer at the beginning, three transition layers, and four dense blocks comprise the DenseNet-169 (Dalvi, Edla & Purushothama, 2023) design. A max pooling of convolutions with stride two is applied by the first convolutional layer following the completion of convolutions with stride 2. The network is then divided into three sets, each of which contains a dense block and a transition layer. Figure 4 displays the DenseNet-169 model’s layer structure.
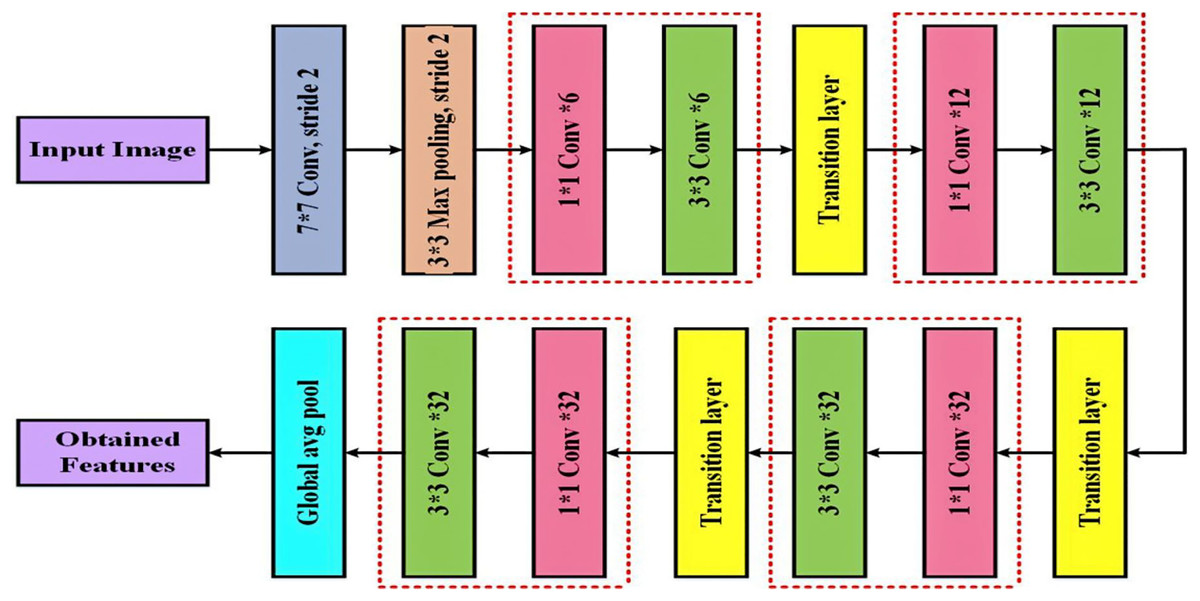
Figure 4: Detailed layout of the DenseNet-169 network for deep feature extraction.
DenseNets have direct connections between every layer and every other layer in the network. As a result of receiving feature maps from every previous layer in the network, the lth layer improves the gradient flow over the whole structure. Several densely connected blocks are used to form the DenseNet framework because CNNs are significantly designed to reduce the size of feature maps. The feature maps are reduced by combining the previous layer’s feature maps with the same size.
The layers that lie between these dense blocks are known as transition layers. An average pooling layer, batch normalization layer, and a convolutional layer make up the network’s transition layers. As previously stated, four dense blocks have two convolution layers each. The first layer is sized 1 × 1, while the second is sized 3 × 3. In the DenseNet169 architecture, the four dense blocks have the following sizes: 6, 12, 32, and 32.
All network layers were used in the feature extraction procedure except the final classification layer, which is a fully connected layer. Following interpretation, a 50,176 × 1 dimension vector was produced and fed into the classifier as the final feature representation.
Pancreatic cancer classification
Using a deep learning network, the work’s last stage involves classifying pancreatic cancer. The new technique improves the proposed approach’s overall performance and maximizes the cancer prediction rate. Pancreatic cancer is mainly detected and classified using classification algorithms such as machine and deep learning approaches. Several traditional classification methods have a low classification rate and must be more appropriate for subsequent severity diagnosis. The present research uses the MResNext model to classify pancreatic CT scans into benign and malignant classes.
The term “cardinality,” which describes the number of parallel paths in every convolutional block, is introduced by ResNeXt. ResNeXt increases cardinality without appreciably increasing the number of parameters, which enhances learning capacity in contrast to ResNet, which concentrates on deeper and wider networks. The diversified feature extraction made possible by grouped convolutions in medical image segmentation allows for the better acquisition of subtle and complex information (such as small tumor boundaries). ResNeXt outperforms a comparable ResNet in terms of accuracy while using fewer parameters. ResNeXt lessens feature extraction redundancy by reusing the same transforms across several pathways. ResNeXt can learn richer and more varied feature representations due to group convolutions. To differentiate between areas of disease and healthy tissue, different features are necessary. Because of this, ResNeXt is especially good at capturing small changes in texture and intensity in CT scans of pancreatic tumors. In terms of performance benefits relative to the computational cost of more extensive or deeper networks, ResNeXt scales more effectively than ResNet. When working with high-resolution medical pictures, scalability helps the model retain accuracy without incurring excessive computing costs. Because of its grouped convolutions, which serve as a form of regularization by diversifying learned features, the ResNeXt design generalizes well.
Compared to ResNet, the ResNeXt model has a number of advantages, including as improved feature diversity, effective parameter use, scalability, and resistance to over-fitting. These benefits translate into better tumor identification, enhanced boundary recognition, and consistent performance across various datasets in the context of medical image segmentation. The Modified ResNeXt is the best option for pancreatic cancer classification and segmentation tasks since the SD-Reg regularizer enhances the model’s capacity for generalization.
To classify pancreatic cancer, we employ the ResNeXt classification model (Pant, Yadav & Gaur, 2020). Rather than a simple residual block, we have used an aggregated residual block in the network; this is the fundamental concept underlying ResNeXt. This approach, also known as “split-transform merge,” was used in the initial architecture.
Each layer’s weighted sum of primary neurons is the artificial neural network’s inner product, determined independently for each layer. Looking at the inner product from the perspective of Eq. (12), one can consider it a kind of aggregate transformation.
(12) where are the neurons channel, the filter weight is denoted by , and the neuron’s D-channel input vector is described as .
A function that is more inclusive and capable of acting as a network, the aggregated transformations as,
(13)
An arbitrary function is defined as integrating x into a projection and then modifying it, which acts as an analog to a primary neuron. According to their analysis, the cardinality dimension can control many intricate transformations.
(14)
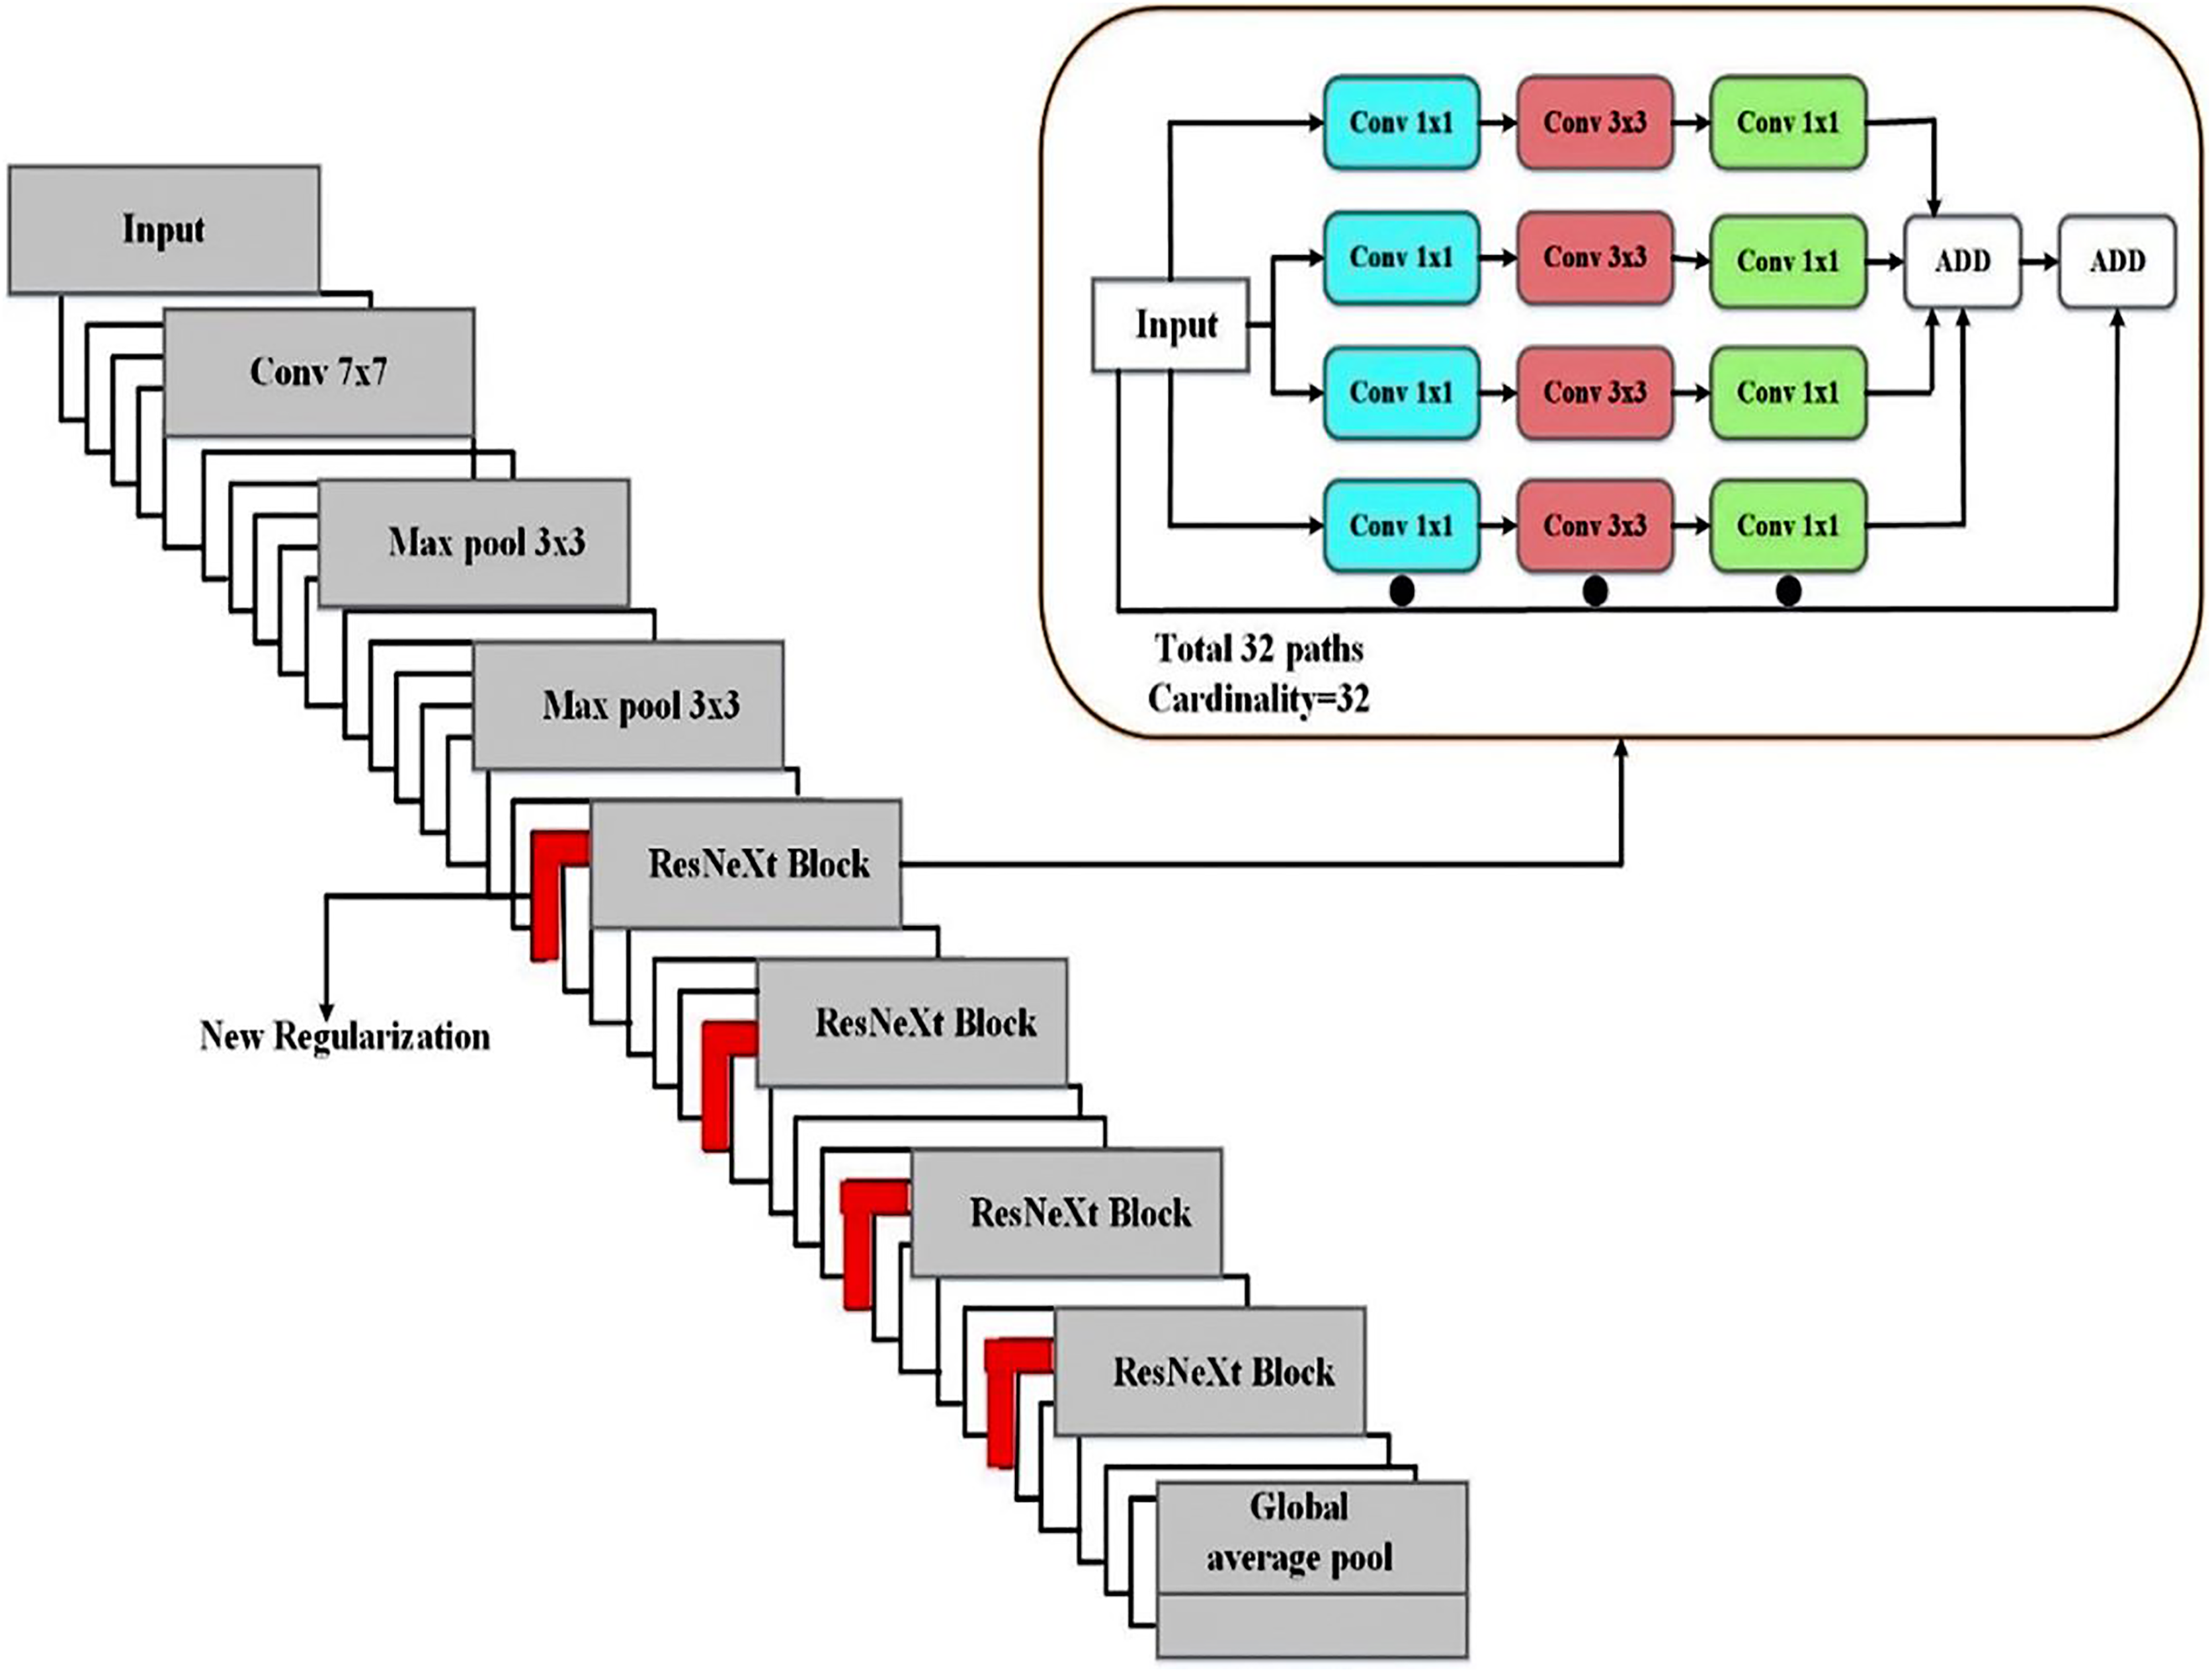
As illustrated in Eq. (14), the residual function is the aggregated transformation from Eq. (13). A deep and extensive network is less accurately constructed than ResNeXt since it uses ResNet’s skip notion and cardinality. Regarding accuracy, the proposed MResNeXt performed better than the existing models. We use the MResNeXt model for pancreatic cancer classification because of these benefits. Figure 5 displays the MResNeXt model structure for classification.
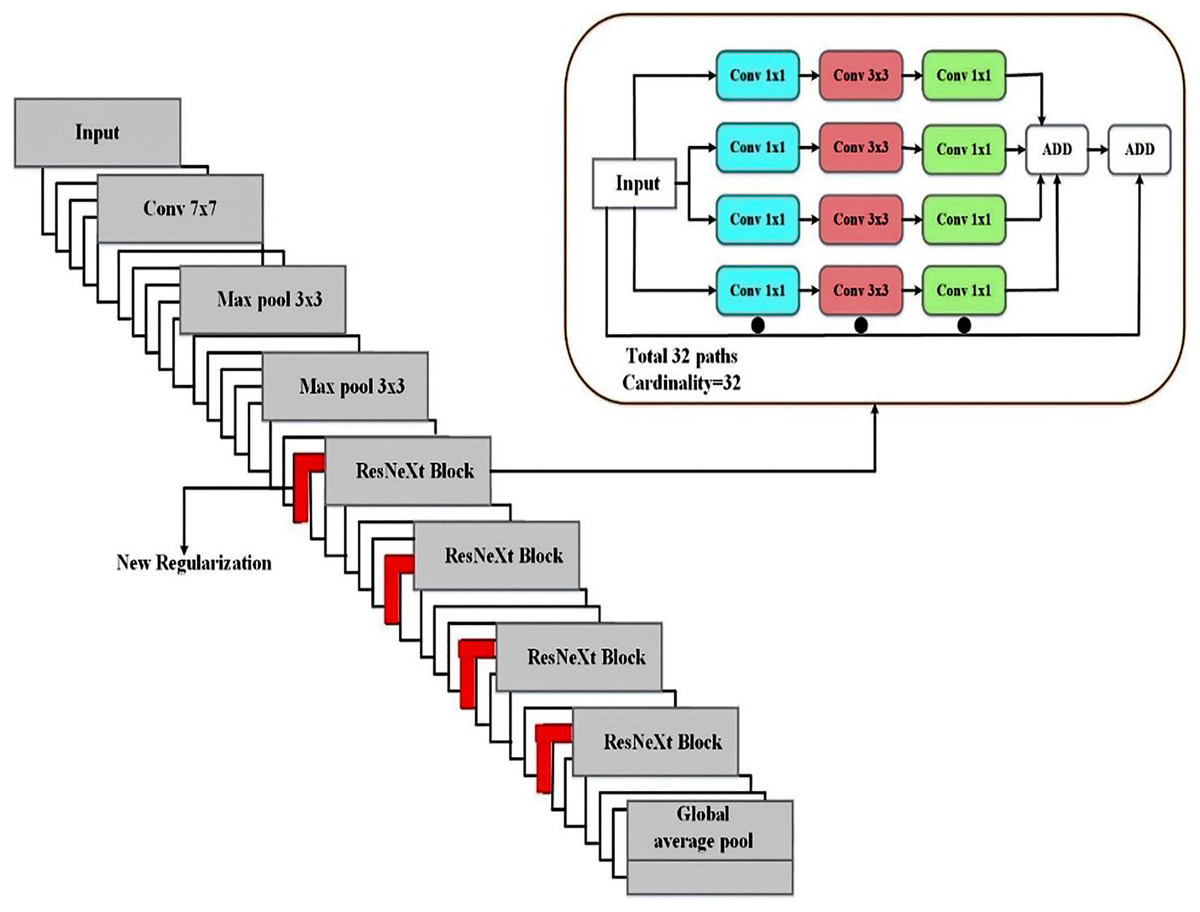
Figure 5: Proposed MResNext deep learning architecture for tumor classification.
The proposed model was modified using a novel regularization technique to regulate the connection between specific weight values and weight matrix elements. To develop an adaptive weight decay form, multiply the weight matrix’s standard deviation by λ. Thus, the regularizer terminates the learning model using values too widely distributed from the weight space. The new regularizer has undergone thorough testing on various tasks using various datasets and is more successful than previous regularization techniques.
From the weight matrix, the obtained weight values control the relationship between entries using the new regularizer technique. This minimizes the complexity of the model by eliminating irrelevant data and retaining only those that are important for classification. Compared to other regularization algorithms, the stated regularizer outperformed the others after comprehensive testing across various domains, including computer security. The Softmax layer is used for the final classification process, and the ReLU activation function is effectively used to classify benign and malignant tumors.
Although group convolutions are useful for computational efficiency, the traditional ResNeXt model may have difficulty capturing minor intraclass variations, such as slight textural differences within benign or malignant tumor classifications. The SD-Reg penalizes changes that do not contribute to class separability, allowing the model to concentrate on critical characteristics across samples and capture smaller distinctions within classes. The SD-Reg regularization helps keep the model from over-fitting on noisy or small datasets by stabilizing the feature representations and lowering variance in feature maps. Better generalization results from this, mainly when data is limited.
Regularizer
While the L2 regularizer gives less important features less weight, the feature selection is performed using the L1 regularizer. Nevertheless, significant disadvantages and inherent restrictions with both regularizers prevent their widespread application in identifying zero-day threats. Regretfully, a weight matrix’s relationship between entries is ignored by L1 and L2 regularizers.
Stated differently, their focus is solely on specific weight values. Nonetheless, even slight changes in the feature properties might significantly impact the model’s performance. To effectively handle the dispersion of the weight values, we devised a novel regularizer technique (SD-Reg) based on the standard deviation. In other words, the learning model is restricted to using the weight-space diapered area by the SD-Reg regularizer. To generate the periodicity term, it starts with a standard deviation and multiplies it by the λ parameter, which is then used to produce an adaptive form with weight decay.
The standard deviation of the following weight values:
(15)
There are k rows in the weight matrix, and every row represents a distinct weight. The number of features is defined as ‘n’ and provides each feature’s weight values. At the same time, the standard deviation’s weighted averages are described as σ. The weight matrix has n columns in each of its rows. The parameter λ is used to control the rows and columns. In our case, the loss function is
(16)
The loss function is minimized by using the standard deviation to choose a specific range of values.
Hyper-parameter optimization
The TSOA is used to optimize the hyperparameter tuning of the Deep Echo State Network (DESN) model. Tunicates’ social behavior when they are looking for prey serves as the model for TSOA (Cui, Shi & Dong, 2022). All the tunicates could rapidly expel the seawater inhaled using atrium siphons. Additionally, the tunicate showed SI as soon as it could exchange search parameters regarding the meal’s location. The tunicate needs to satisfy the following requirements:
Prevent any conflicts amongst the search agents.
Every agent will inevitably approach the most physically fit individual.
Construct the search agent to merge towards the area surrounding the most fit individual.
The algorithm below was utilized to determine the agent’s novel location to avoid conflicts between each search agent:
(17)
(18)
(19) where is the vector used to determine each agent’s most recent location, three randomly selected integers from (0,1) are represented by , , and the deep sea’s water flow is depicted as , Gravity is depicted as and stands for the vector value, which is the searching agents’ social strength as follows:
(20)
In Eq. (20), the search agent can create social interaction by using primary and secondary speeds, denoted by and ; the values of and are set to 1 and 4.
(21)
In Eq. (21), the food at the current optimal individual’s location is indicated by the present search agent’s location information at t-th iterations is displayed in , stands for any arbitrary number between 0 and 1, and target food and tunicates’ spatial distance from one another is represented by the vector .
Developing the search agent and conducting enough local investigations of nearby fittest individuals to identify the optimal solution for the present iteration, the location was evaluated by:
(22)
Every search agent investigates the area around the best-fit individual at iteration t. Location information is shared throughout the searching agents via the tunicates’ swarming behavior. This procedure can be influenced by the current search agents’ locations and completed by their improved locations. The fit individual can achieve this by using the swarm act to improve their position from the previous individual:
(23)
Here, the exiting search agents’ locations are displayed , the previous search agents’ position at the next iteration is described , and the population size is denoted . The steps to update the search agent’s location are listed below to illustrate the TSOA process:
Step 1: Establishes the initial group of searching agents X.
Step 2: Set the starting parameters and maximum iterations to their values.
Step 3: Analyze each candidate’s FV and select the one with the highest FV as a superior search agent.
Step 4: All search agents should be repositioned by Eq. (20).
Step 5: Prevent all search agents from entering the search area.
Step 6: Calculate the FV of each upgrading searching agent and update if the fittest individuals differed from the previous best-searching agents in the population.
Step 7: If the operation ends after the maximum number of iterations is reached, Then return to steps 4 to 7.
Step 8: Print the best possible individual ( ).
The TSOA system generates a fitness function (FF) to achieve higher classification efficacy. Positive integers are defined as denoting the superior performance of the proposed solution. The classifier error rate decline is considered to be FF.
(24)
Result and discussion
The results of a comparison analysis employing pancreatic tumor samples from the database image are shown in this section. Hybrid filtering techniques are applied to the sampled images in the initial pre-processing stage. To distinguish the pancreatic tumor cell from the surrounding tumor area, we have utilized the EUNet segmentation method. The DenseNet-161 model is used to extract the significant features of the pancreatic tumor. The MResNext architecture is used to classify the extracted features according to severity. This advances the creation of segmentation and classification algorithms to diagnose pancreatic tumor sample images with the CAD system. A ROC curve and confusion matrix are presented for each classification technique. Utilizing statistical functions, the data were visualized using Python software.
Evaluation measures
F1-score, precision, specificity, sensitivity (recall), and accuracy are used to assess the performance of pancreatic cell tumor CT scan database images (benign and malignant). Formulas (25)–(29) define the performance parameters. When using the deep learning classification model, more TPs and TNs were acquired than when using alternative methods.
Accuracy: Accuracy measures the classification system’s ability to identify tumor areas from pancreatic CT scans.
(25)
Sensitivity (Recall): The percentage of the malignant region the categorization system accurately recognizes is known as sensitivity.
(26)
Specificity: The percentage that the normative system has identified as the actual background of the cancerous area
(27)
Precision: It displays the proportion of the identified area corresponding to the proper region.
(28)
F-measure: Precision and sensitivity are averaged and weighted in the F-measure. Two types of false negatives and false positives are included in the method.
(29)
In segmentation networks, intersection over union (IOU) and dice similarity coefficient (DSC) are two often used performance evaluation metrics. The similarity between the two sets is measured by DSC and IOU, which are also used to assess the similarity between network segmentation outcomes and the gold standard mask, which is calculated as follows:
(30)
(31)
Pixel-level indicators such as the DSC and IOU accept values between 0 and 1, values nearer one signifying improved model performance.
Parameter settings
The experiments were conducted on a system running Windows 10 with 32 GB RAM and a 2.90 GHz CPU. The proposed model was implemented in Python using TensorFlow 1.14 for both training and testing. For deep learning computations, the training process was accelerated using an NVIDIA RTX 3090 Tesla V100.
The stochastic gradient descent (SGD) optimization technique is used during training to optimize the segmentation (EUNet) and feature extraction (DenseNet-169) network parameters. The classification network’s parameters are optimized via the TSOA method. Next, training and test sets were randomly selected from the dataset in an 80:20 ratio. Table 2 provides the hyperparameter settings of the proposed deep-learning pipeline for pancreatic tumor analysis.
| Hyper-parameters | Segmentation (Enhanced UNet) | Feature Extraction (DenseNet-169) | Classification (Modified ResNext) |
|---|---|---|---|
| Optimizer | SGD | SGD | TSOA |
| Learning rate | 0.01 | 0.001 (with step decay) | 0.0001 |
| Batch size | 16 | 32 | 32 |
| Number of epochs | 100 | 100 | 100 |
| Momentum | 0.9 | 0.9 | – |
| Loss function | Customized loss function | – | Categorical cross-entropy |
| Regularization | L2 weight decay (0.0005) | L2 weight decay (0.0001) | SD-Reg weight decay (0.0001) |
| Dropout rate | 0.3 | – | 0.4 |
Experimental results
While building the EUNet-MResNext, a training and testing phase was carried out using the collected datasets; following model adjustments, the proposed approach was used to improve classification results. First, the classification assessment measures are displayed. Each test set result’s performance is utilized to assess it.
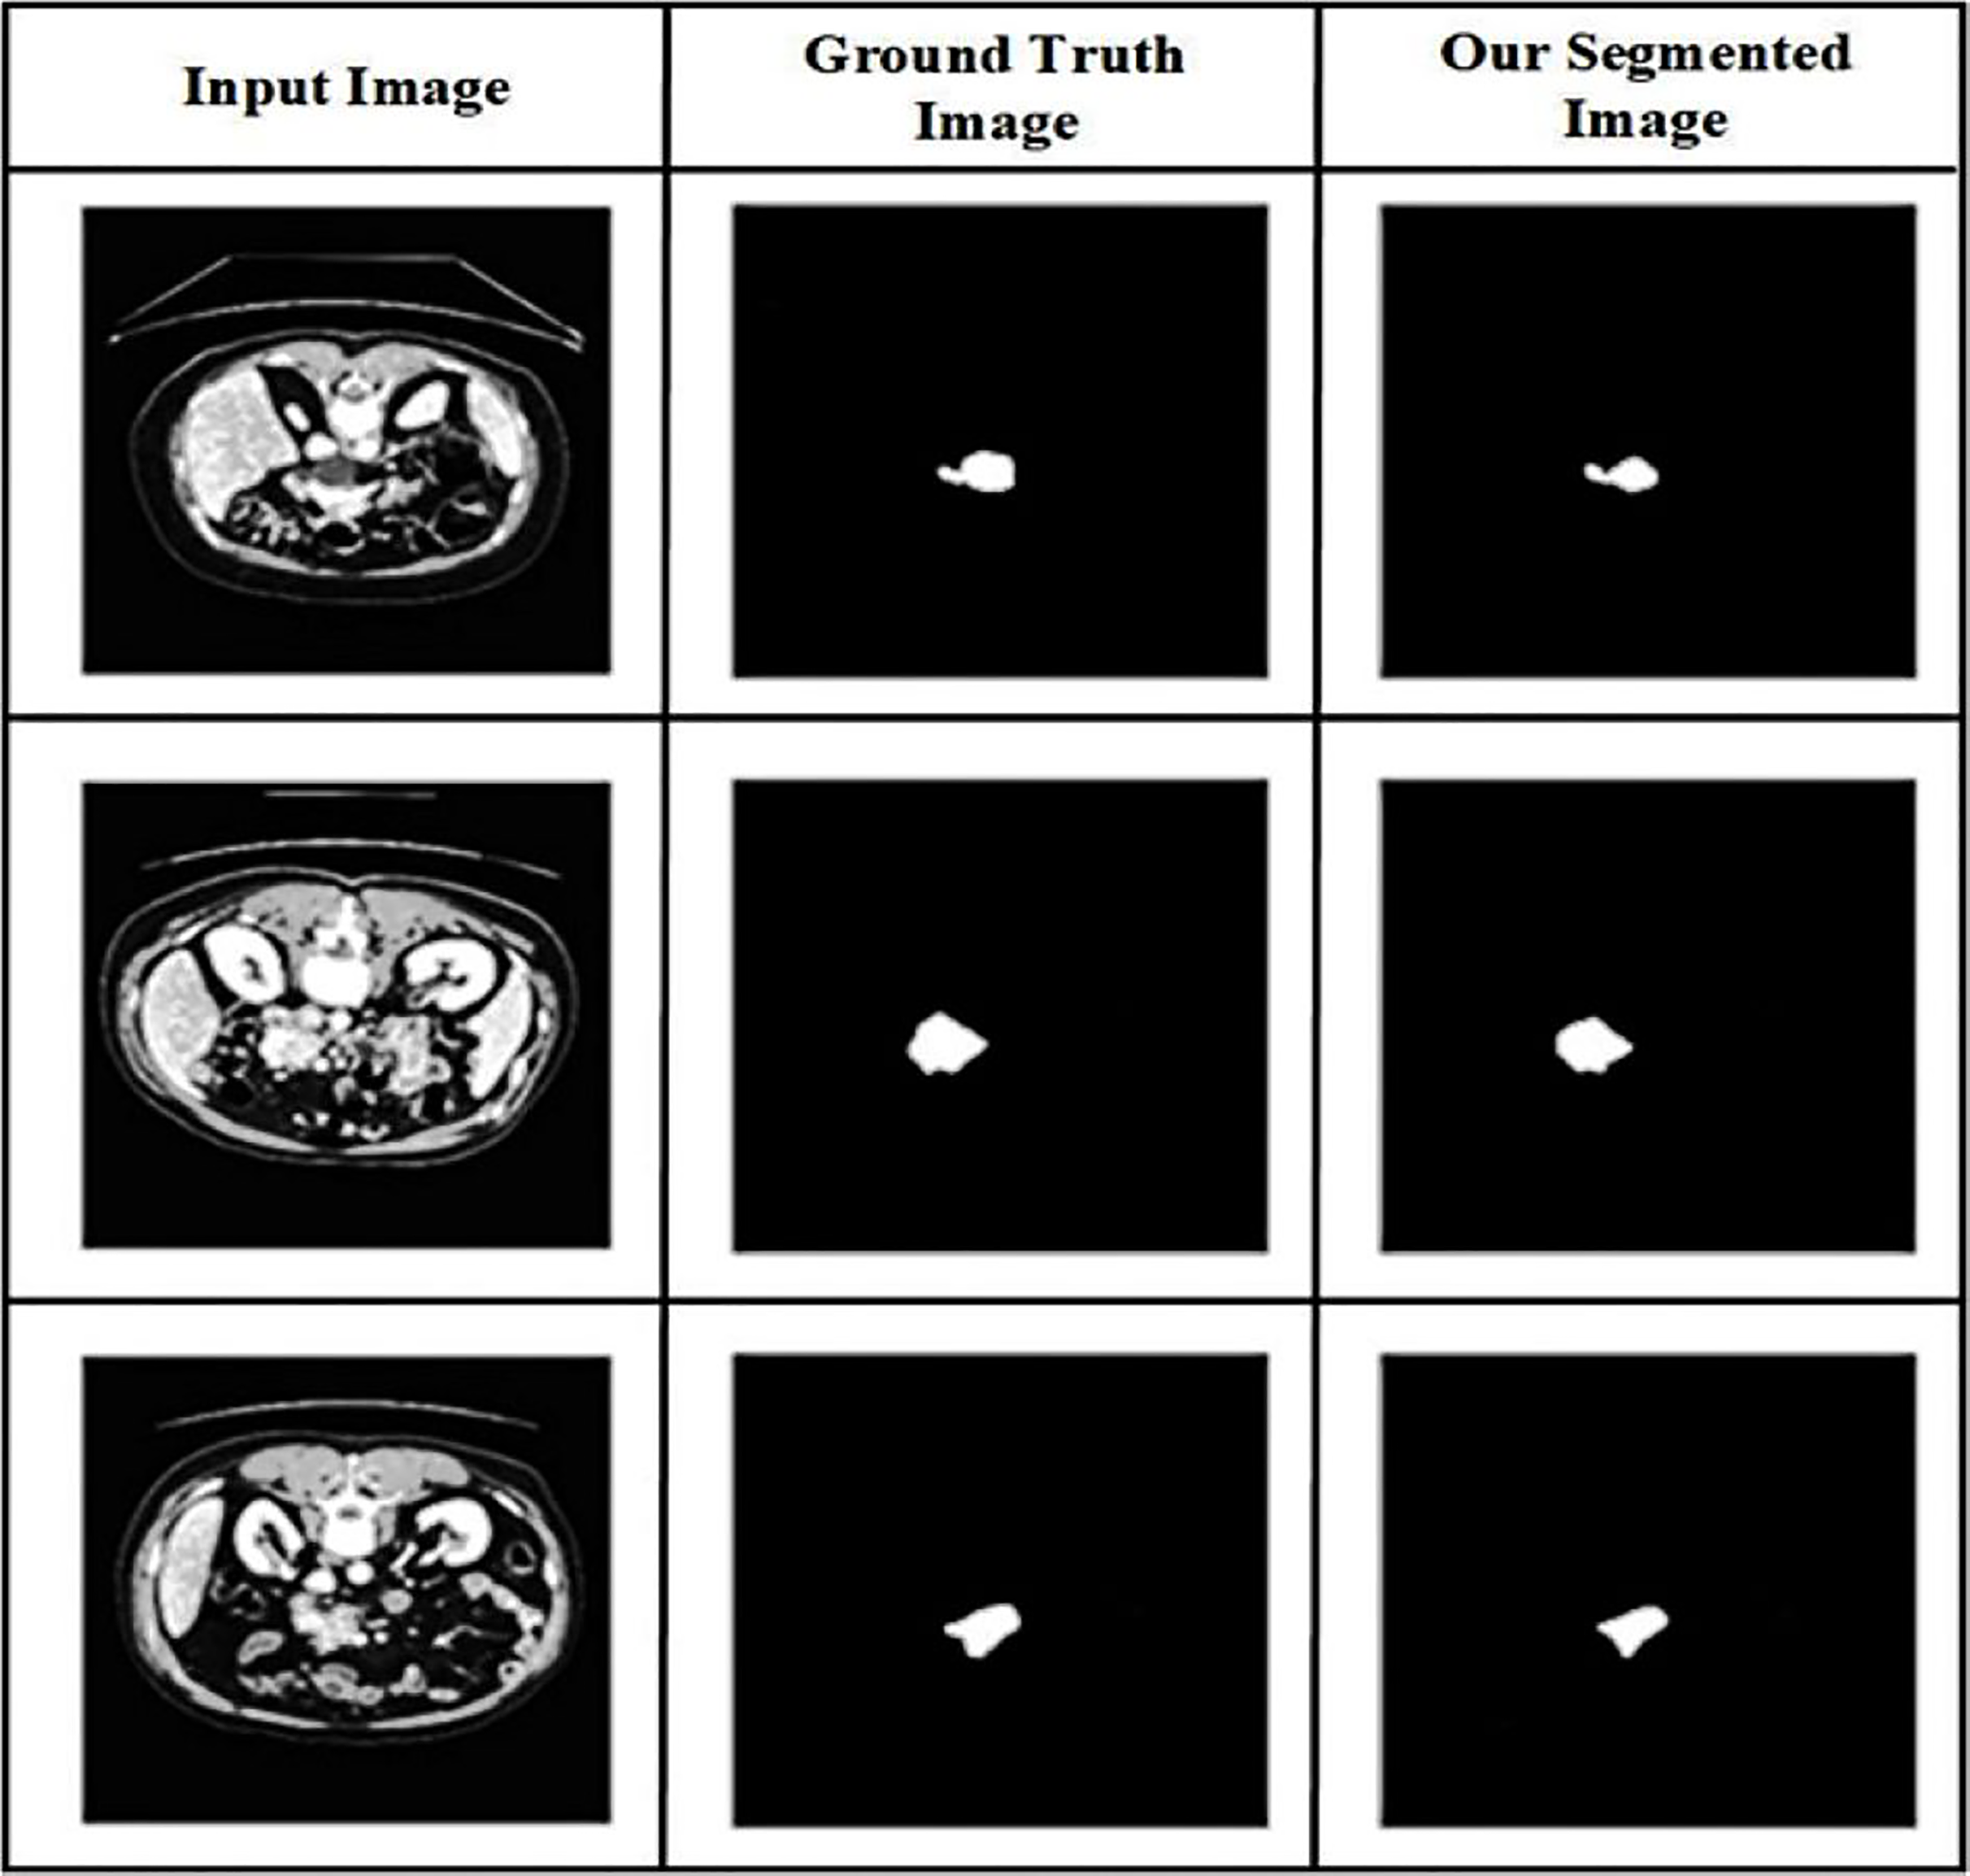
The value of the suggested method is demonstrated in Fig. 6 by providing a visual comparison between the segmentation results of the pancreas produced using the proposed method and the ground truth segmentation. The abdominal CT scans are displayed in the first column, followed by the segmentation based on ground truth in the second column and the segmentation outcomes of the suggested approach in the third, illustrating the visual comparison.
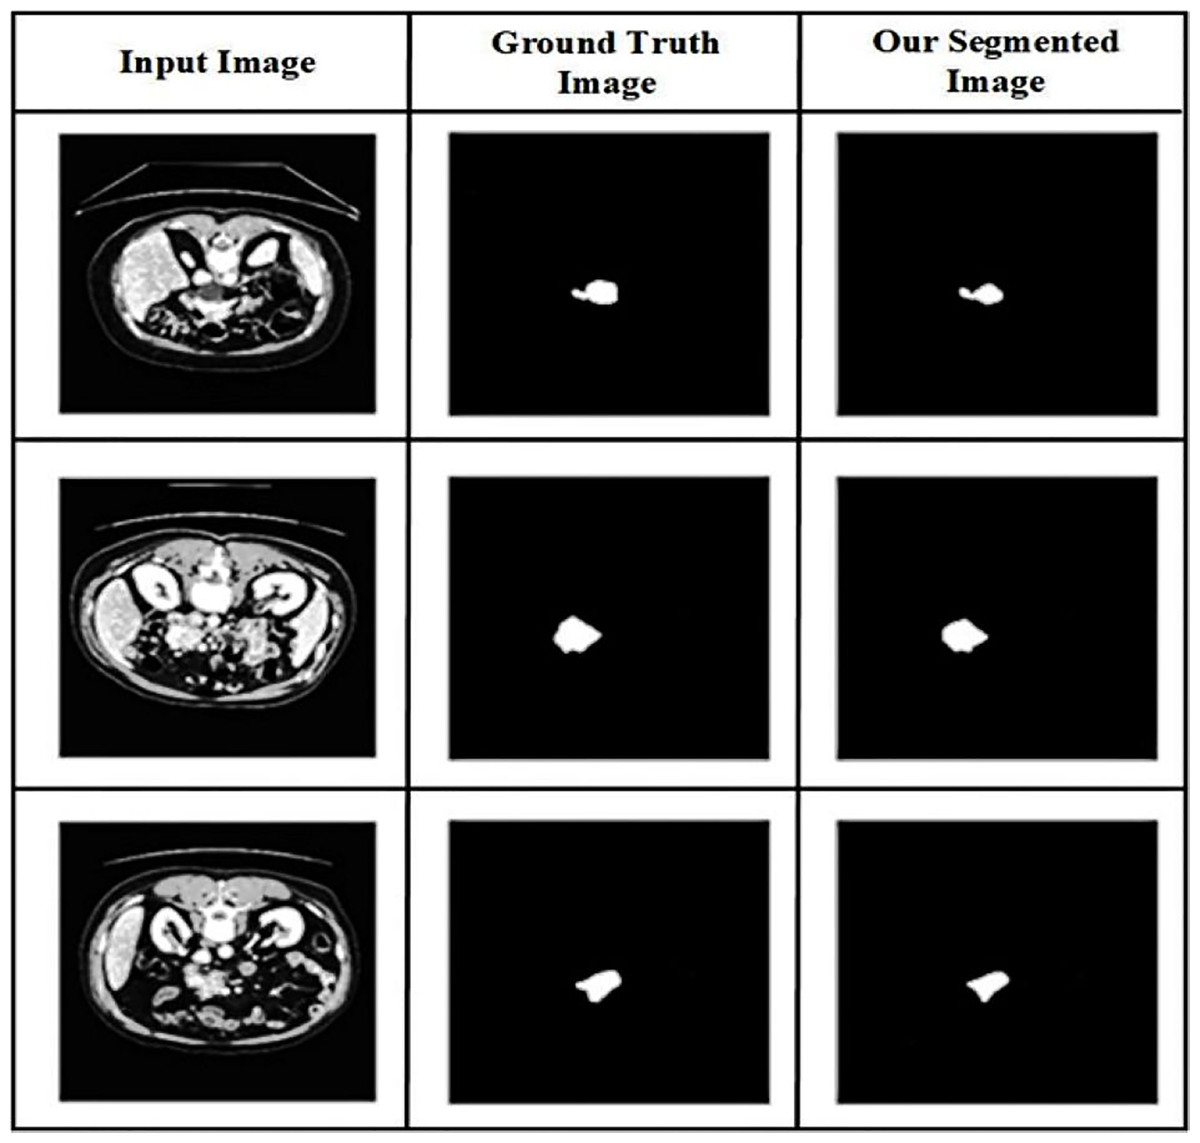
Figure 6: Qualitative results of pancreatic tumor segmentation.
From abdominal CT images, the performance of the proposed technique in accurately segmenting the tumor region is evaluated using a visual comparison. Comparing the proposed approach’s segmentation findings with the ground truth segmentation can help determine how well the recommended method accurately segments the pancreatic tumor’s affected region. The results show that the recommended method is effective in accurately segmenting pancreatic tumors in CT images of the abdomen. The similarities and differences generated by the recommended approach and the accurate segmentation are examined between the segmentation outcomes.
The affected lesion area is precisely segmented using the EUNet model. The proposed segmentation model resolves the poor resolution of the CT image and the overlap in the area of the infected lesion. Our hybrid deep learning technique enhances diagnostic performance by enhancing convergence and mitigating the effects of structured noise.
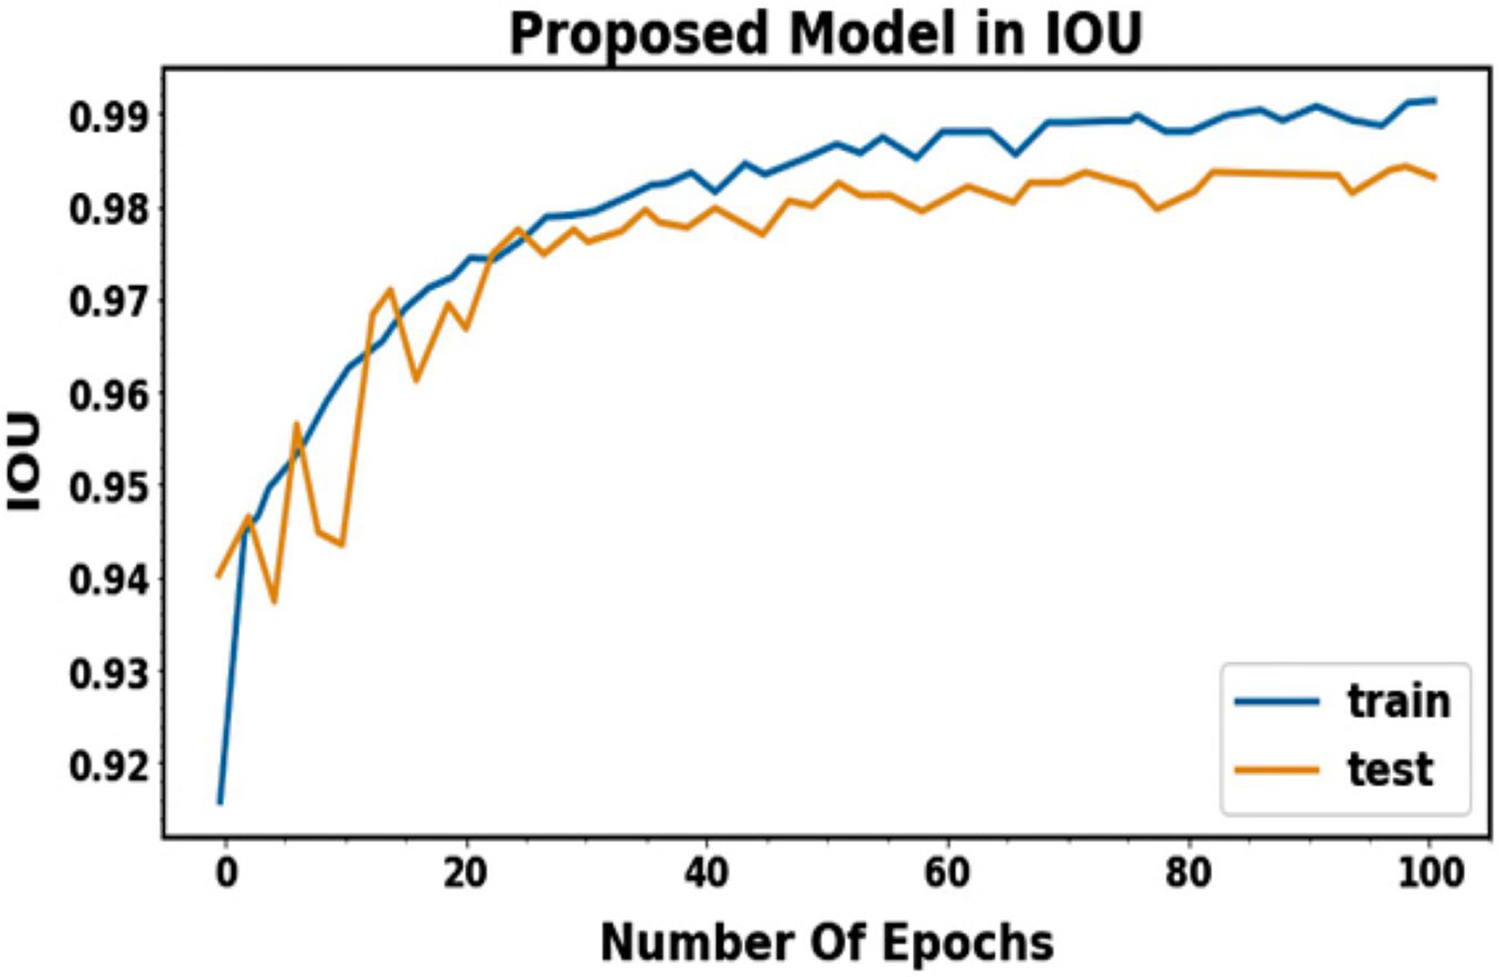
The pancreatic tumor segmentation performance analysis uses the Dice coefficient and IOU scores. The goal is to measure the accuracy with which segmentation regions and spatial segmentation may be predicted from pancreatic tumor images. Figure 7 shows the performance result for segmentation in terms of IOU. When the suggested segmentation model was used in research, higher IOU accuracy and lower loss rates were observed. The results presented in Table 3 demonstrate the effectiveness of the proposed EUNet in accurately segmenting benign and malignant pancreatic tumors. Both IOU and DSC values show strong performance consistency across training and testing phases, indicating the model’s robustness and generalization ability. The suggested IUNet segmentation model segments the lesion region for each class with high segmentation outcomes, averaging mean IOU scores of 95.85% and 96.04% and Dice scores of 95.27% and 95.87% for training and testing.
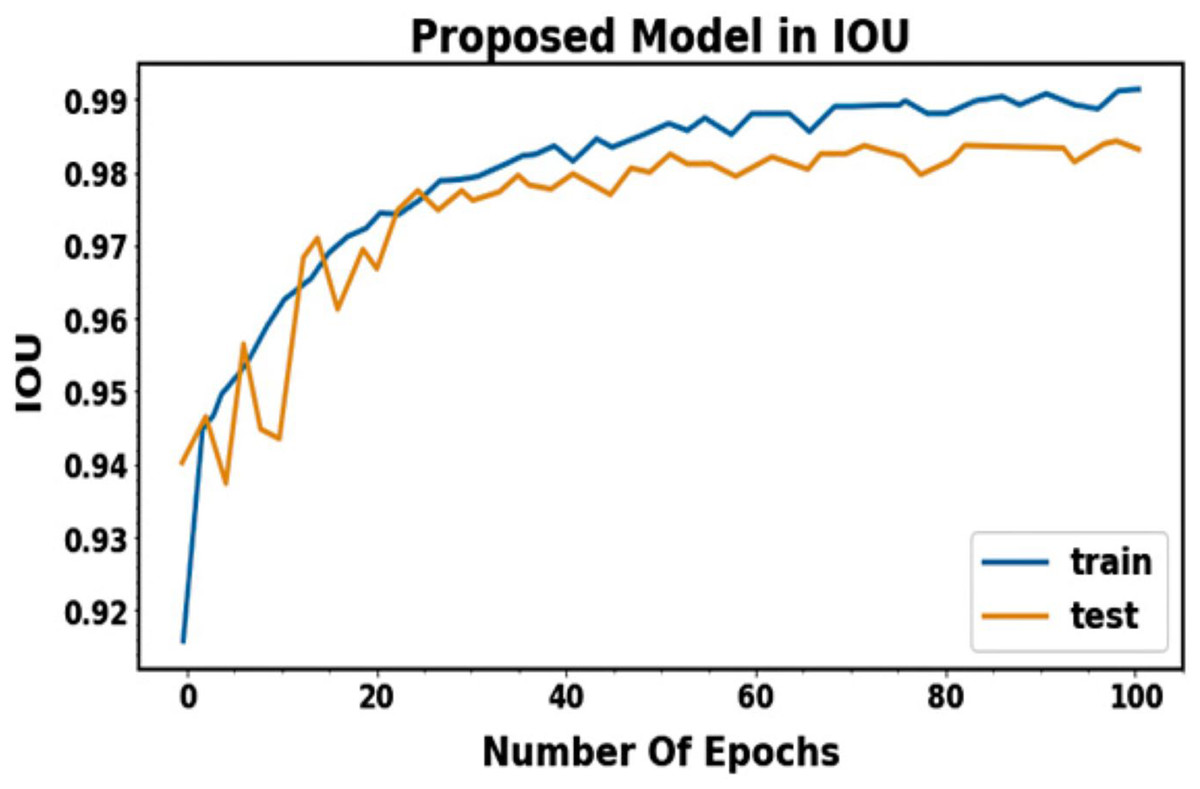
Figure 7: IOU performance for training and testing phases.
| Class | IOU (%) | DSC (%) |
|---|---|---|
| Training phase | ||
| Benign | 96.23 | 95.12 |
| Malignant | 95.52 | 95.23 |
| Average | 95.85 | 95.27 |
| Testing phase | ||
| Benign | 95.64 | 96.42 |
| Malignant | 96.45 | 95.32 |
| Average | 96.04 | 95.87 |
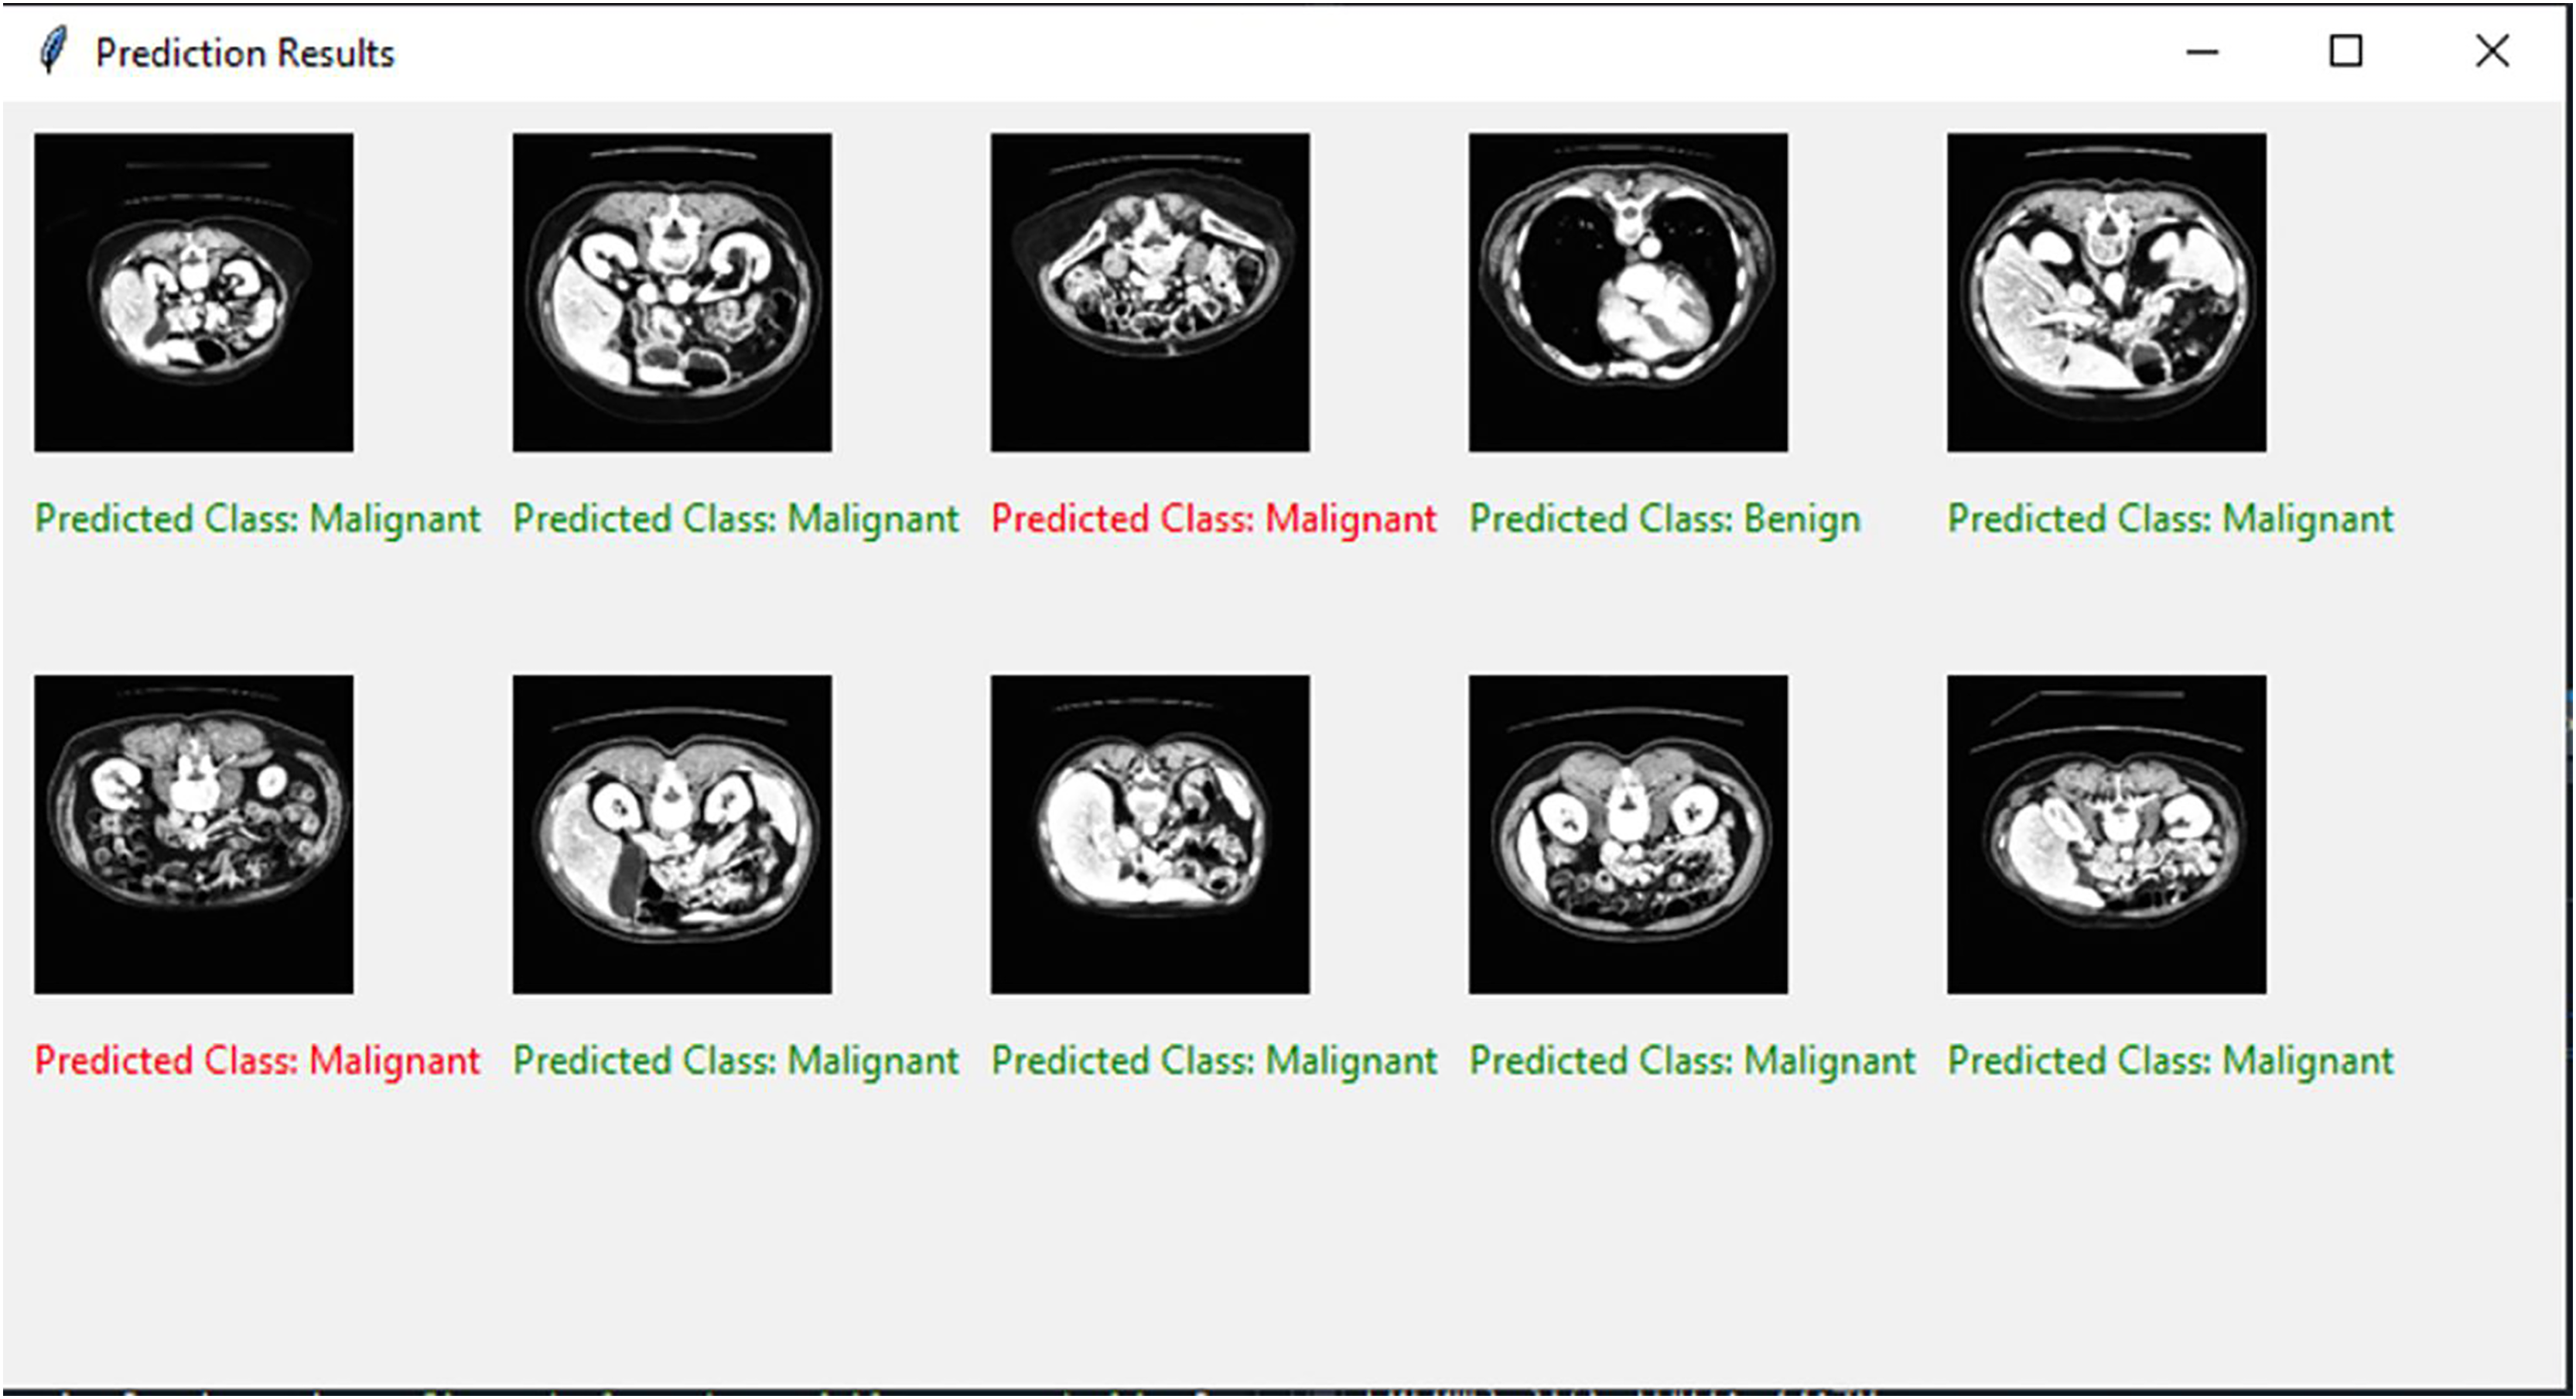
The binary classification strategy is used in the present research to distinguish between benign and malignant pancreatic tumors. Figure 8 shows the final classified results. The training and testing accuracies and losses of the suggested classification model for pancreatic cancer are shown in Fig. 9. We observed gains in every evaluation criterion following the implementation of our binary classification strategy. Table 4 presents the classification outcomes achieved by the proposed model using CT image datasets. The results indicate outstanding performance in both training and testing phases, with an average accuracy of 99.85% and strong values across all other metrics (precision, sensitivity, specificity, and F-measure), confirming the model’s effectiveness in distinguishing between benign and malignant pancreatic tumors. The training process is completed in 75 s to reach the final iteration. It illustrates our model’s superior classification and generalization abilities.
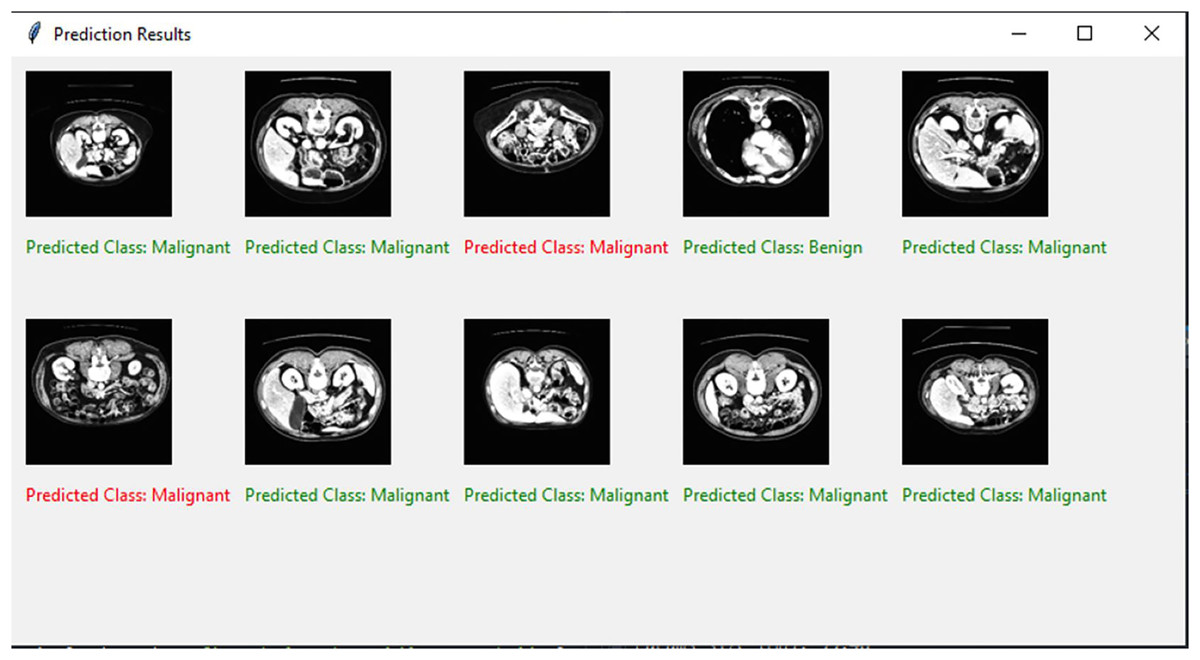
Figure 8: Visual representation of predicted classification results.
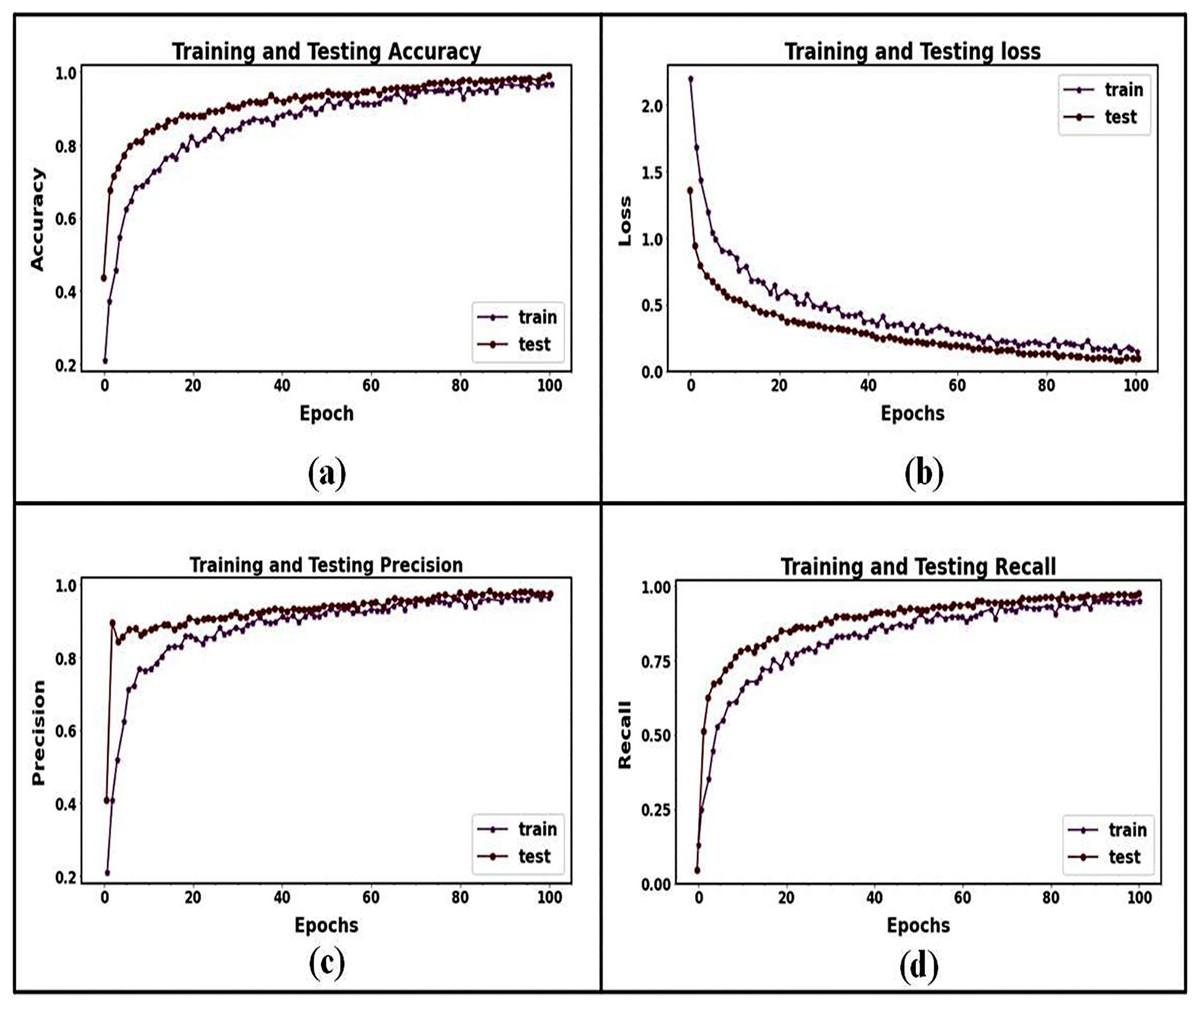
Figure 9: Training and testing performance curves for the proposed classification model: (A) the accuracy graph for training and testing, (B) the loss graph for training and testing, (C) the precision graph for training and testing, and (D) the recall graph for training and testing.
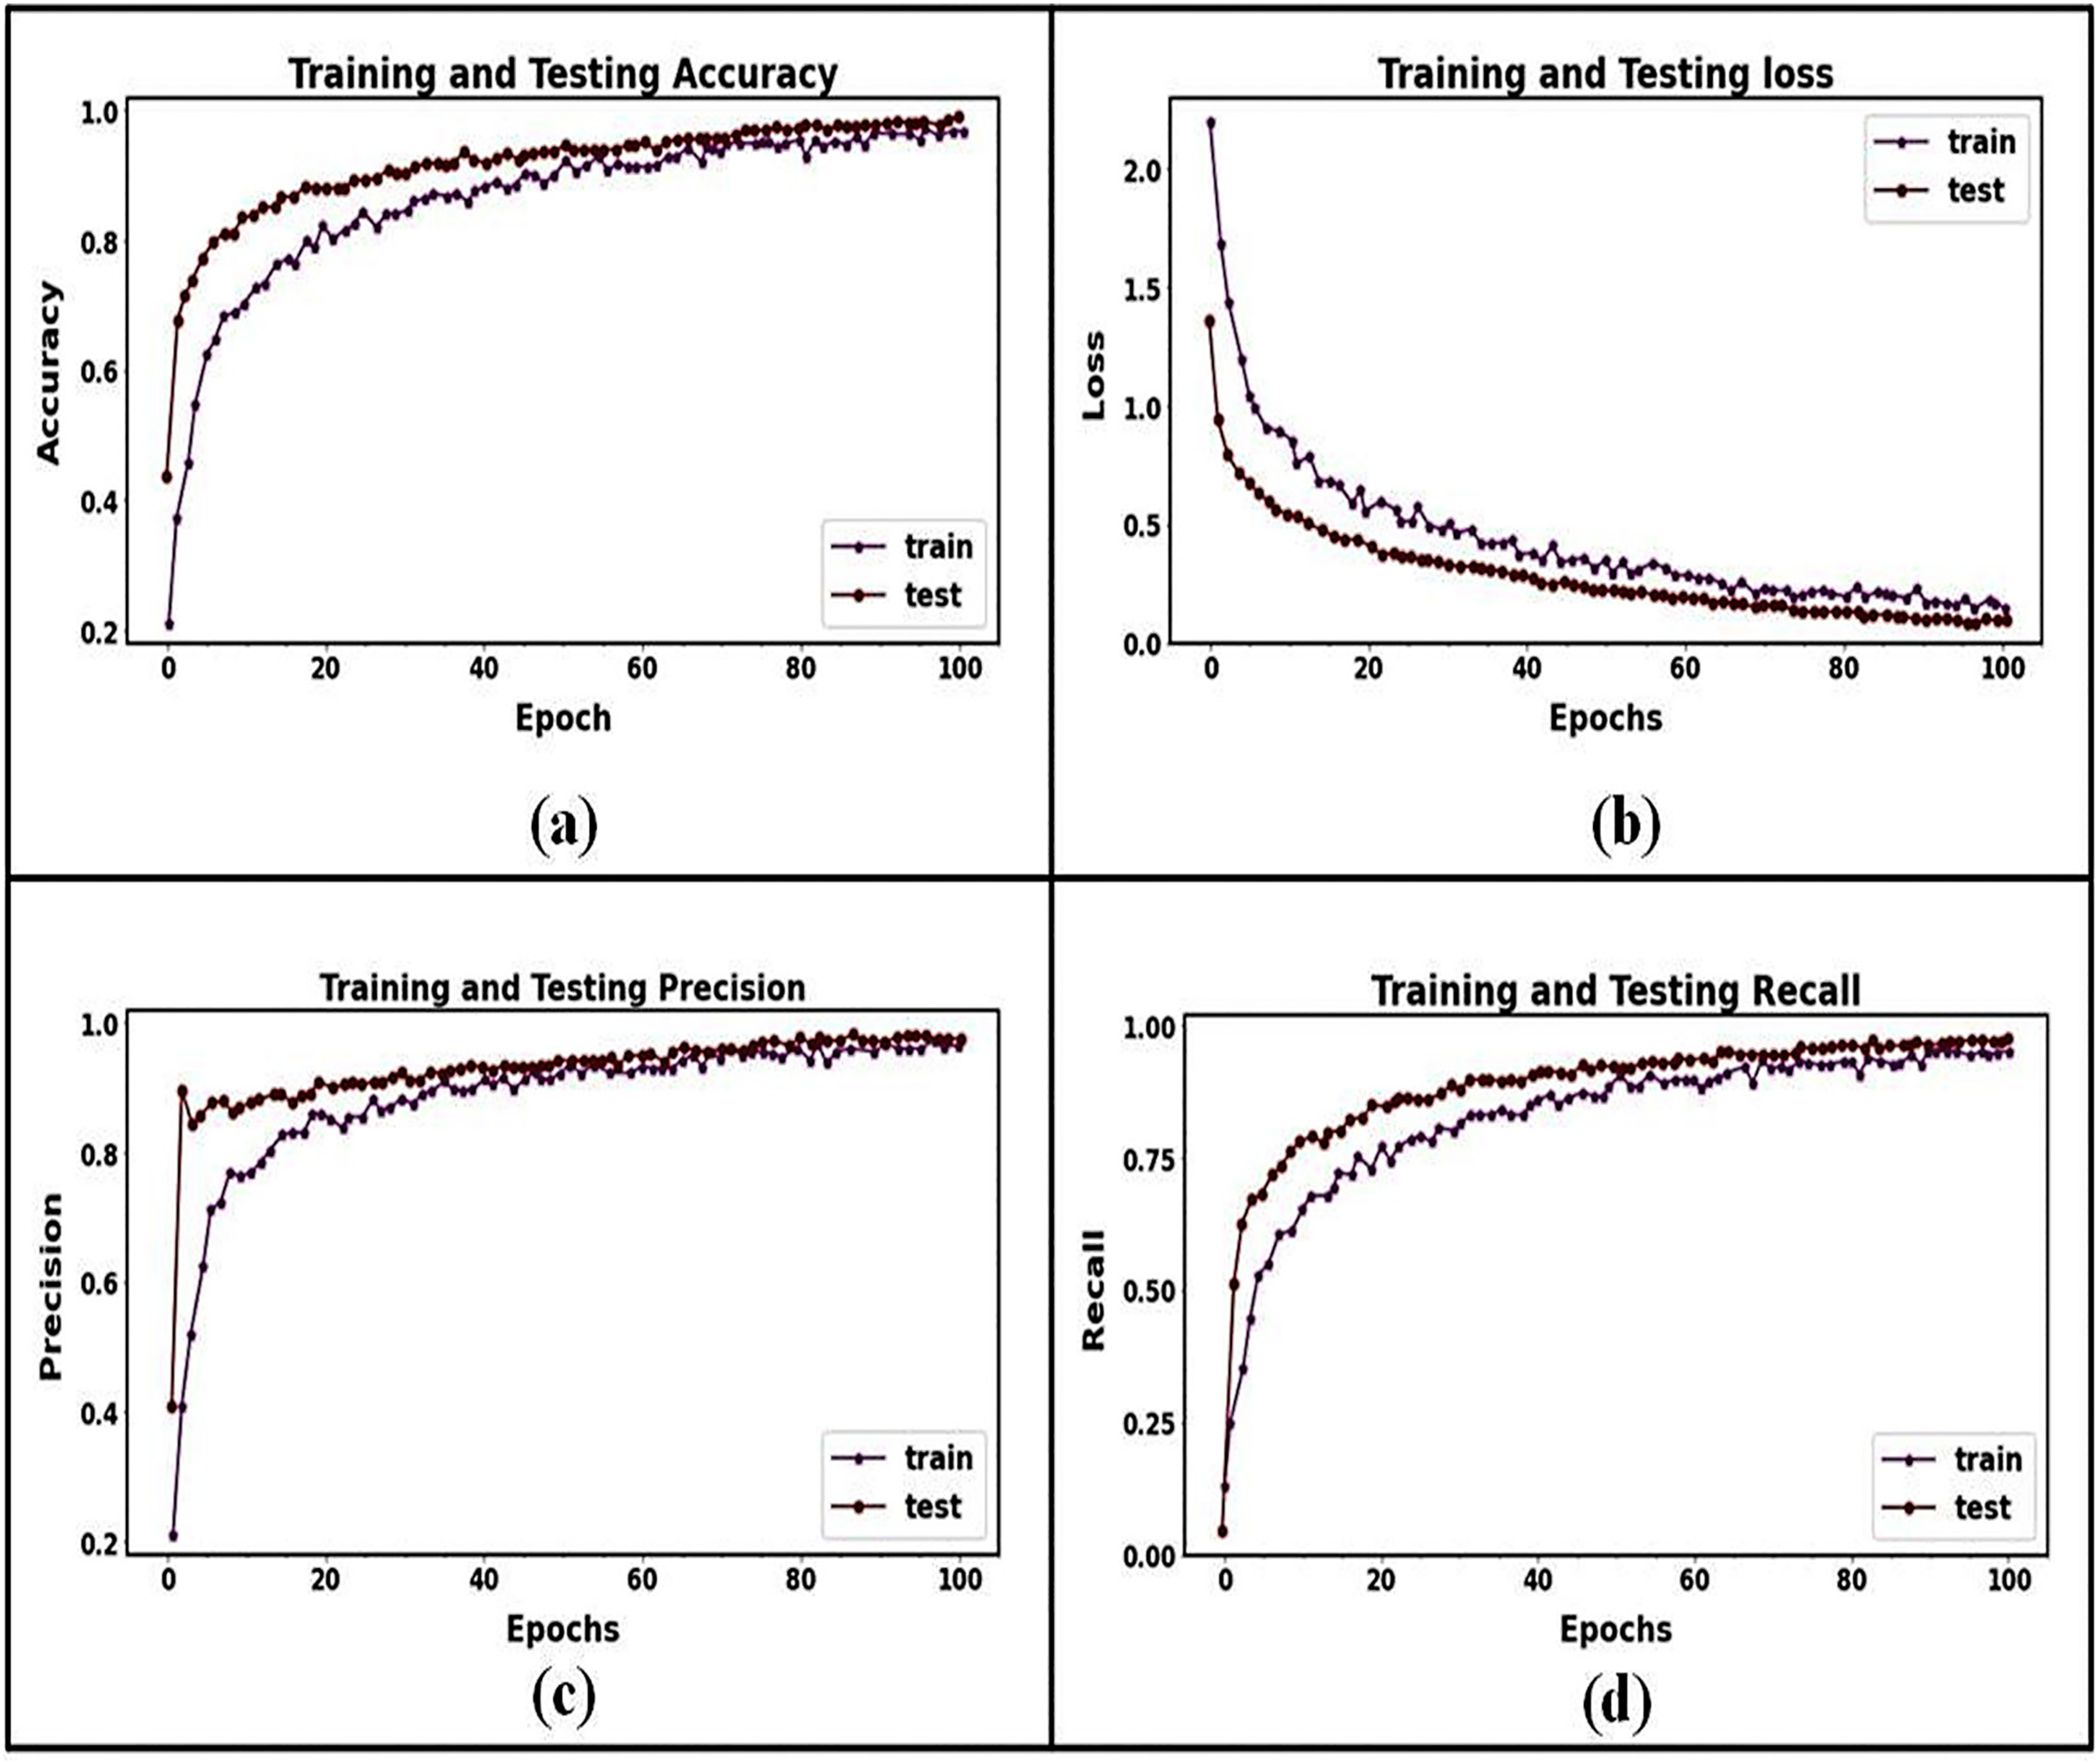
| Class | Accuracy (%) | Precision (%) | Sensitivity (%) | Specificity (%) | F-measure (%) |
|---|---|---|---|---|---|
| Training phase | |||||
| Benign | 100 | 99.38 | 99.28 | 99.69 | 99.68 |
| Malignant | 99.28 | 100 | 99.58 | 100 | 99.27 |
| Average | 99.46 | 99.94 | 99.43 | 99.84 | 99.475 |
| Testing phase | |||||
| Benign | 100 | 99.82 | 100 | 99.82 | 99.03 |
| Malignant | 99.73 | 99.26 | 99.52 | 99.74 | 99.43 |
| Average | 99.85 | 99.54 | 99.76 | 99.72 | 99.23 |
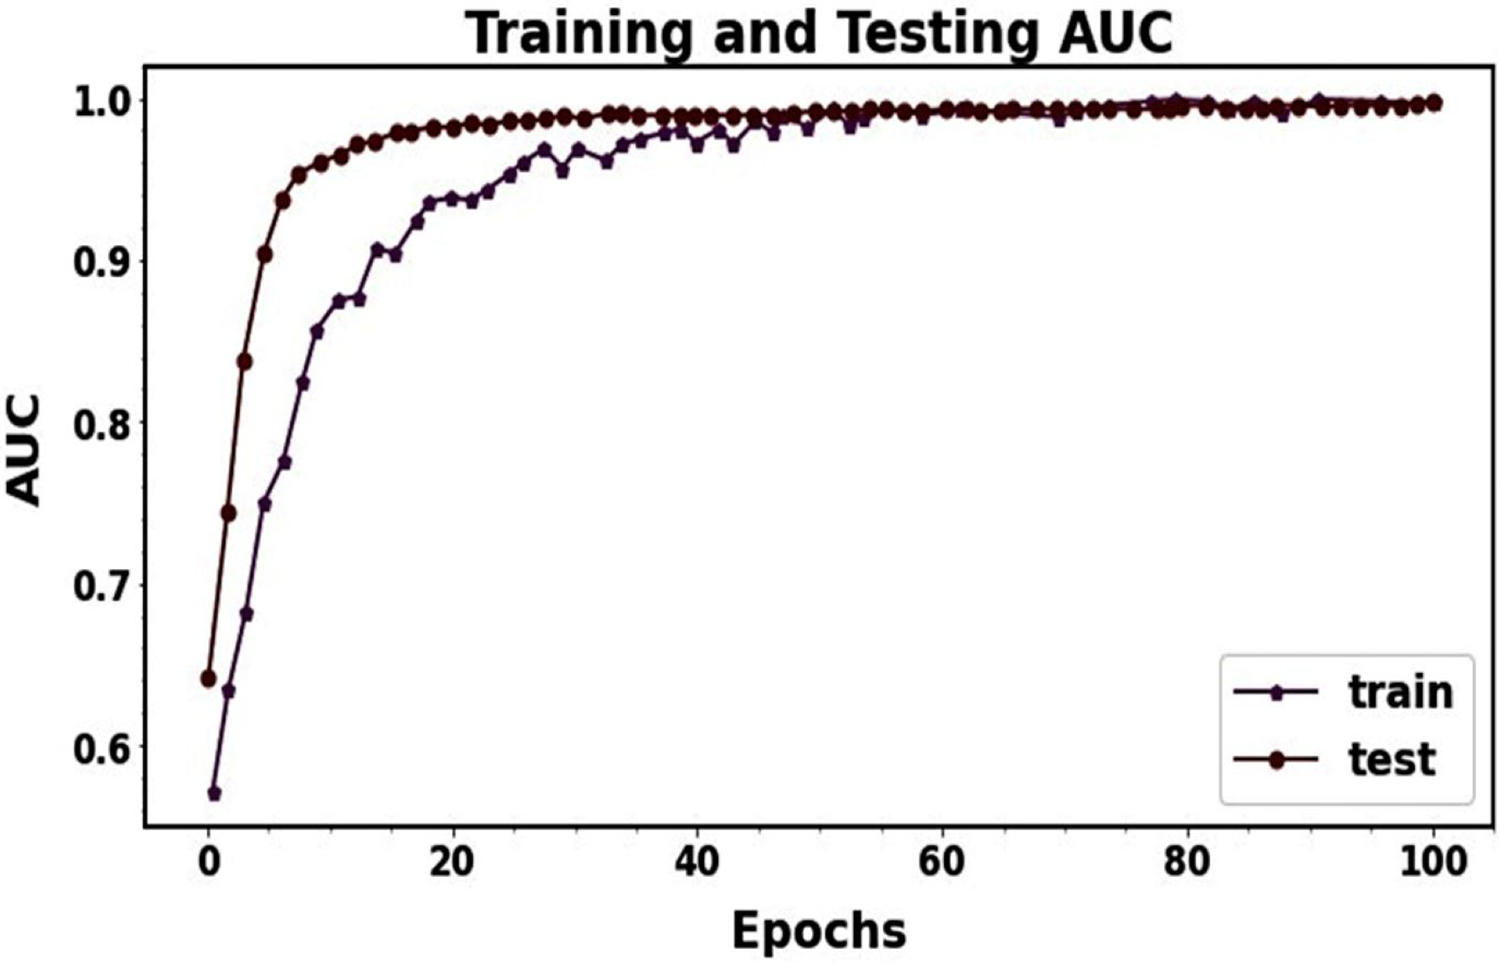
The graph visualization in Fig. 9 clarifies that the accuracy, precision, and recall test curves continuously outperform the respective training curves. Even though Fig. 9’s recall curve initially showed some slight under-fitting, the suggested model performed better over epochs as the distance between training and testing lines reduced. Multiple strategies were used in this research to address the issues of under- and over-fitting. The testing loss was monitored for three consecutive epochs to apply early stopping and prevent over-fitting. It was evident from the loss graph that training had a more significant loss than validation. It revealed no issues with under-fitting during training and that the suggested model appropriately operated. When the precision and recall graphs were seen, it was evident that the training and testing curves were not more significant than each other. It shows that the suggested model for categorization is acceptable. In general, these efforts enhanced the resilience and functionality of the proposed MResNext model throughout the training and testing phases. The AUC training and testing value for pancreatic cancer classification is shown in Fig. 10. The AUC graph visualization shows that the proposed model has a high AUC score. A higher AUC value suggests that the MResNext model can distinguish across various classes. Consequently, the model demonstrated exceptional performance in the detection challenge.
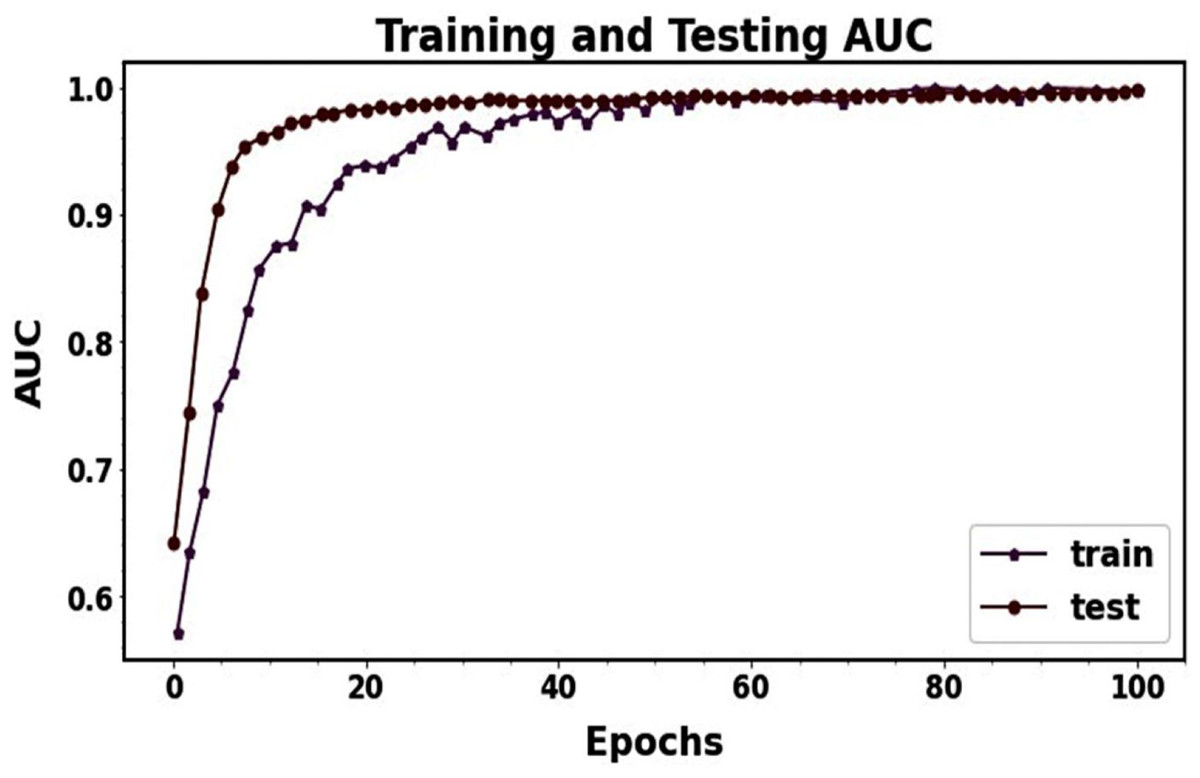
Figure 10: ROC-AUC performance during model training and testing.
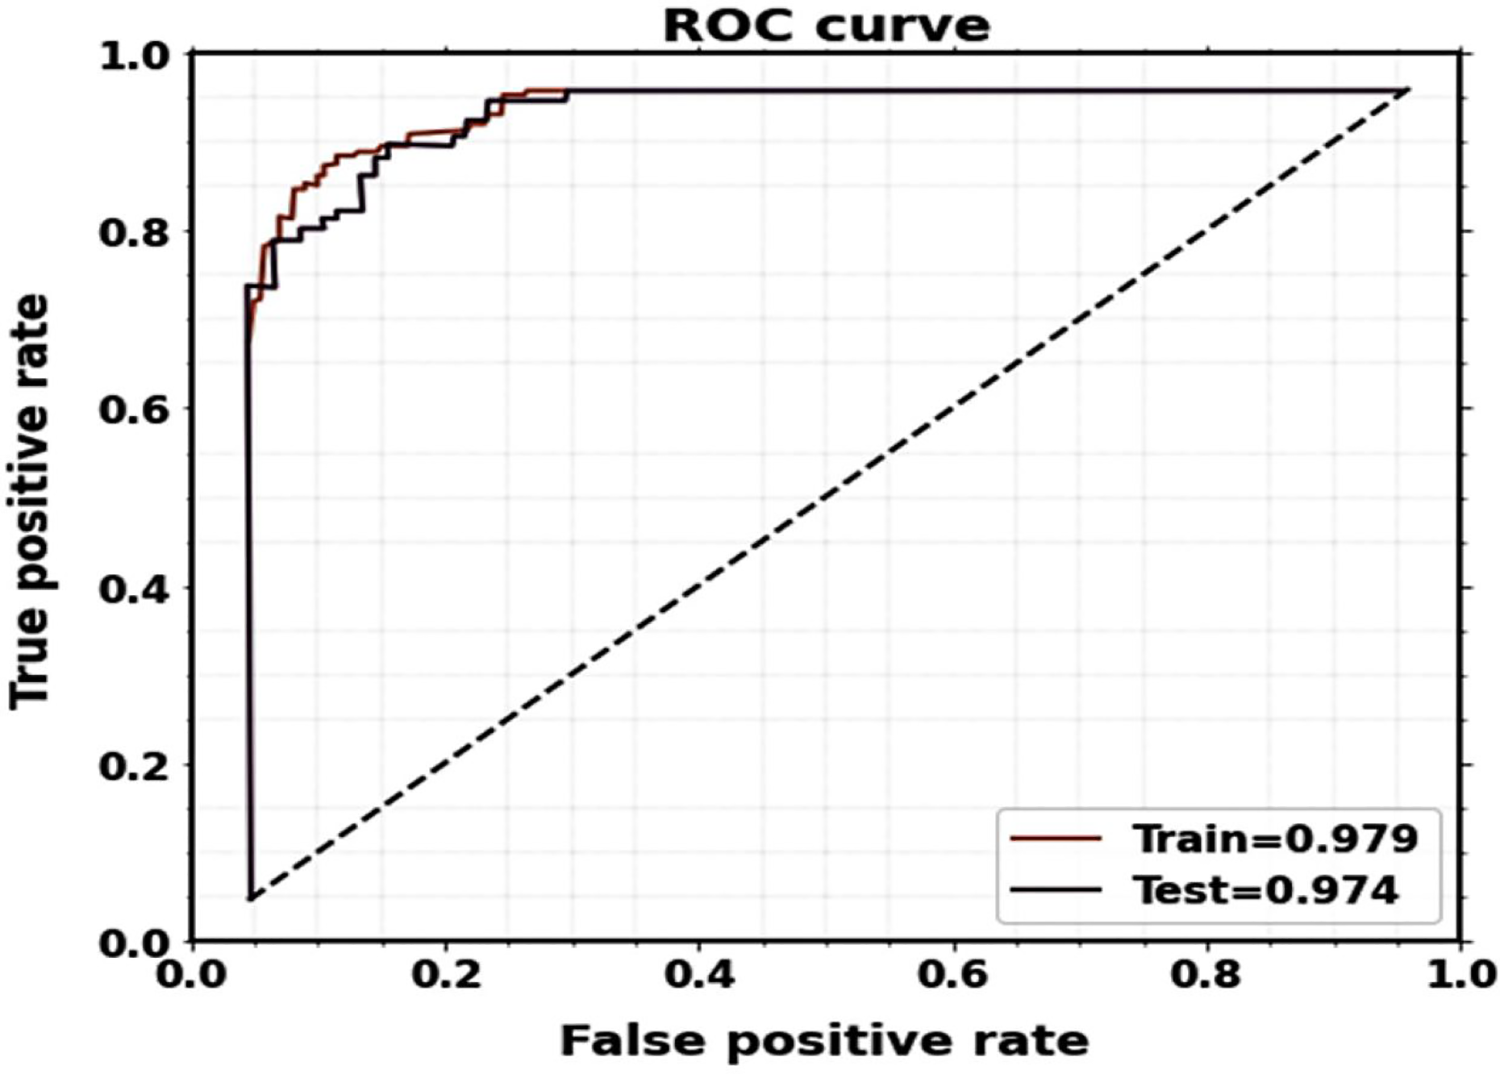
Figure 11 displays the plots of the ROC curve for classification. It is observed that the suggested model utilizing the CT image dataset yields better classification results, with AUCs for testing and training being 0.974 and 0.979, respectively.
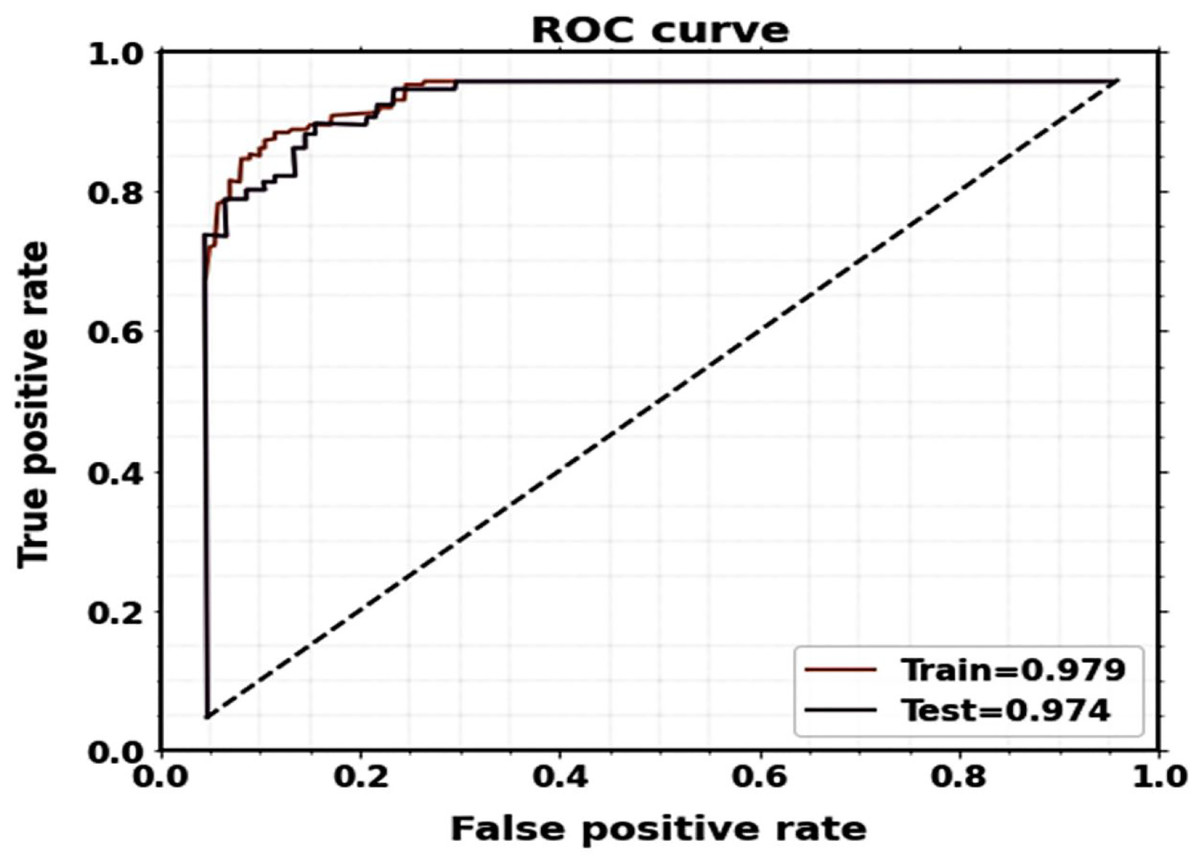
Figure 11: ROC curves of the proposed classification system for training and testing.
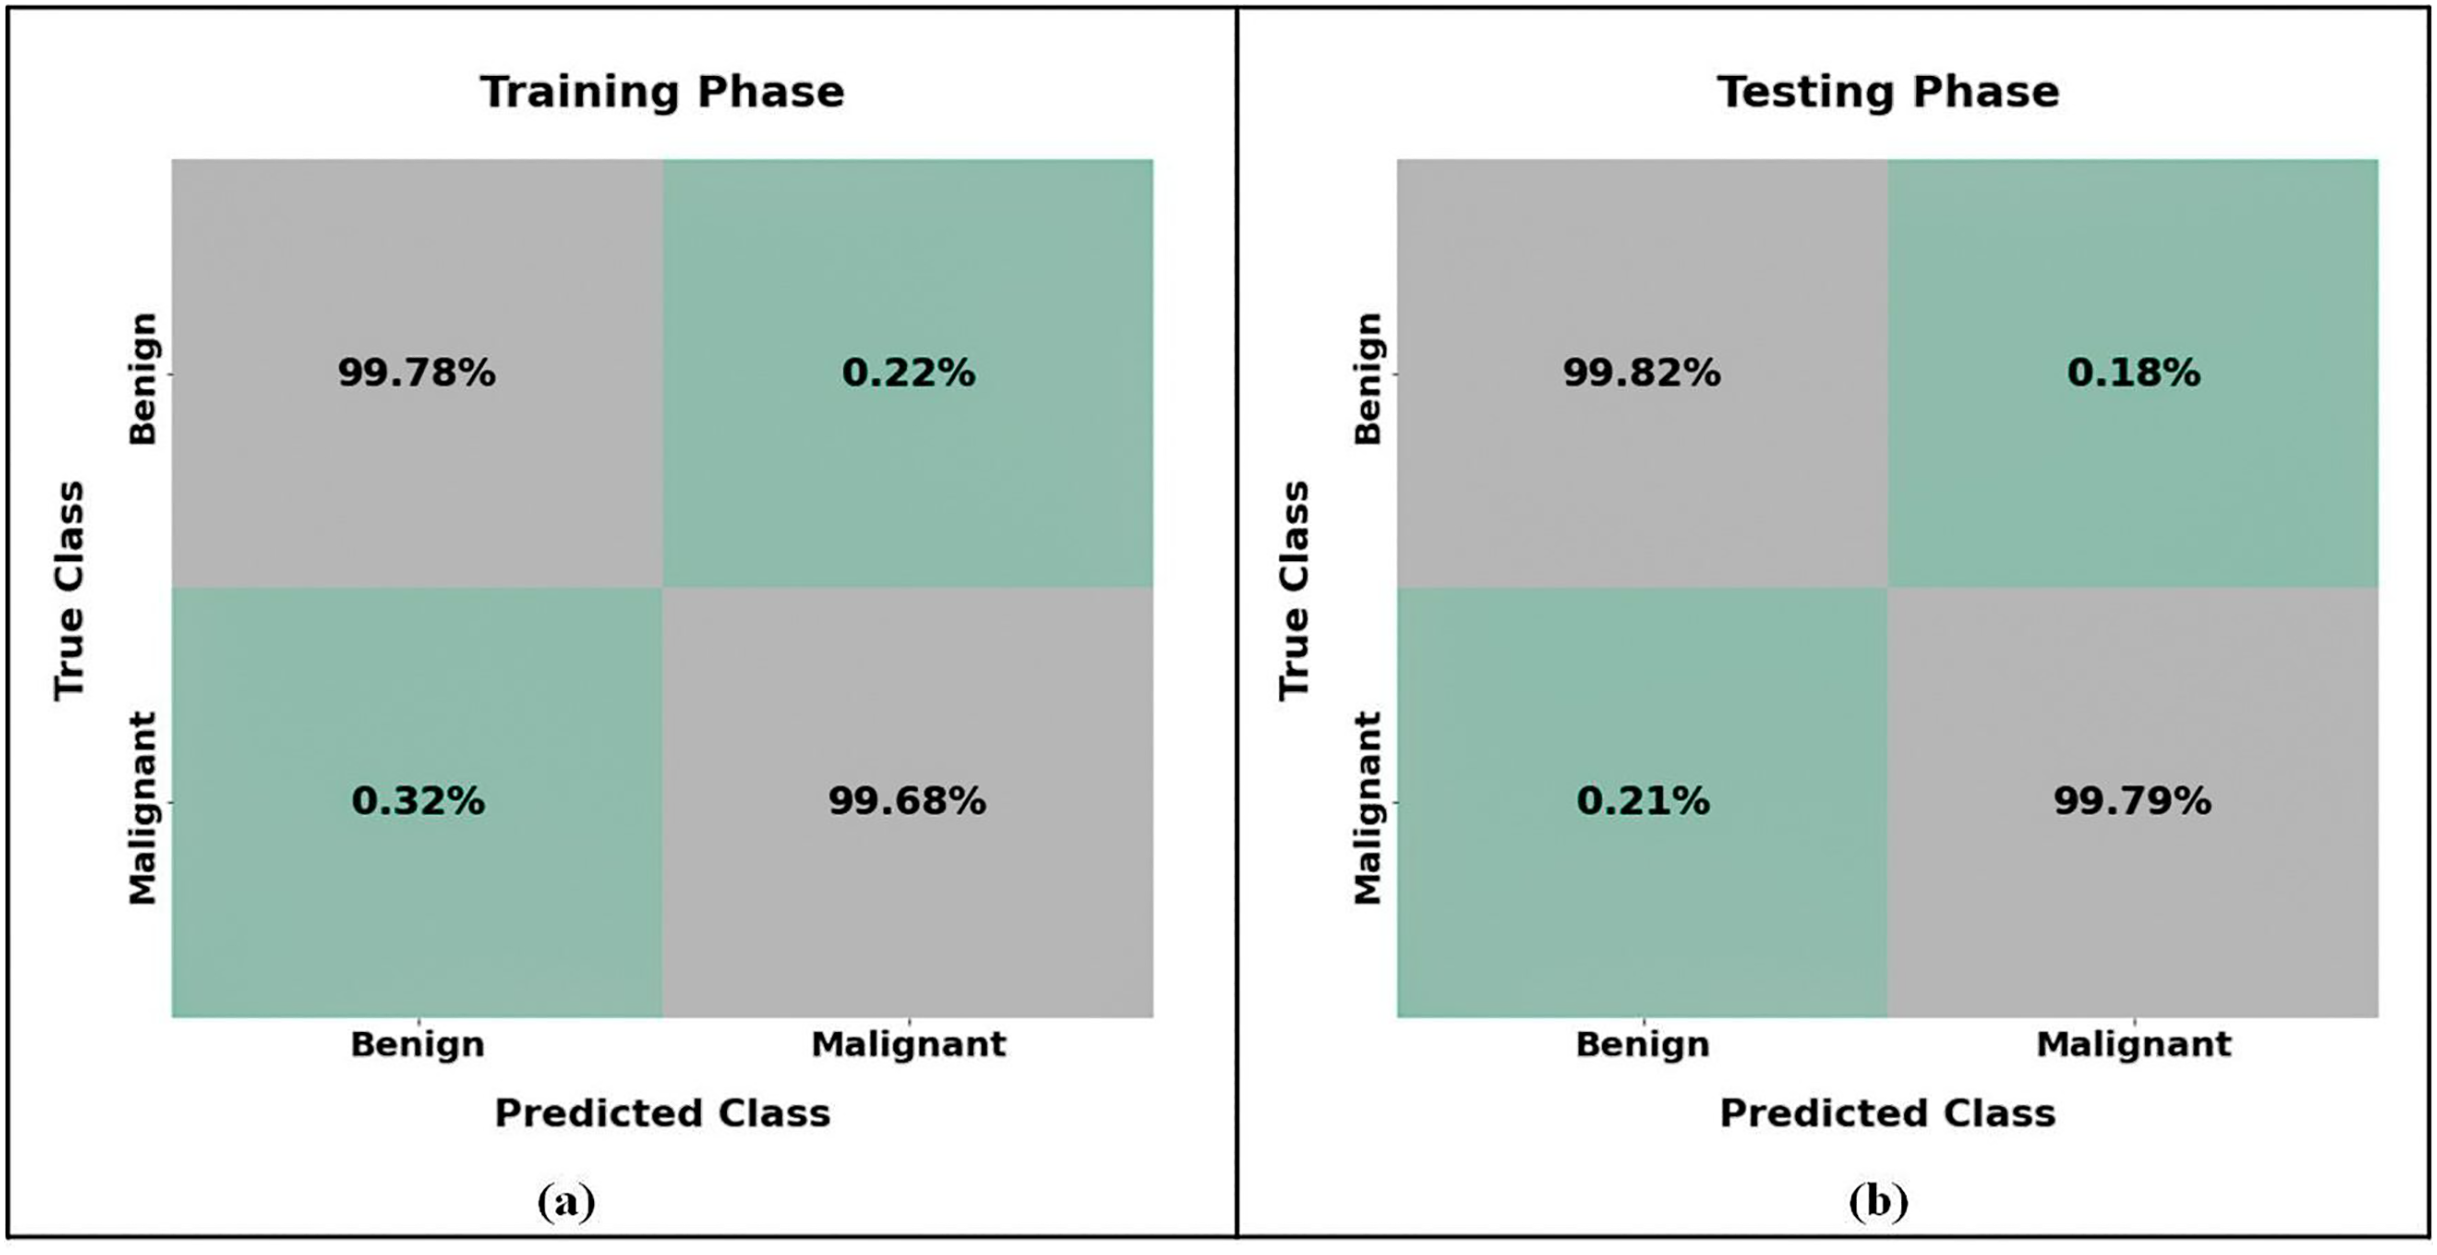
Figure 12 presents an analysis of the pancreatic cancer categorization using the confusion matrix of the MRextNet approach. According to the findings, the suggested method successfully distinguished between benign and malignant pancreatic cancer.
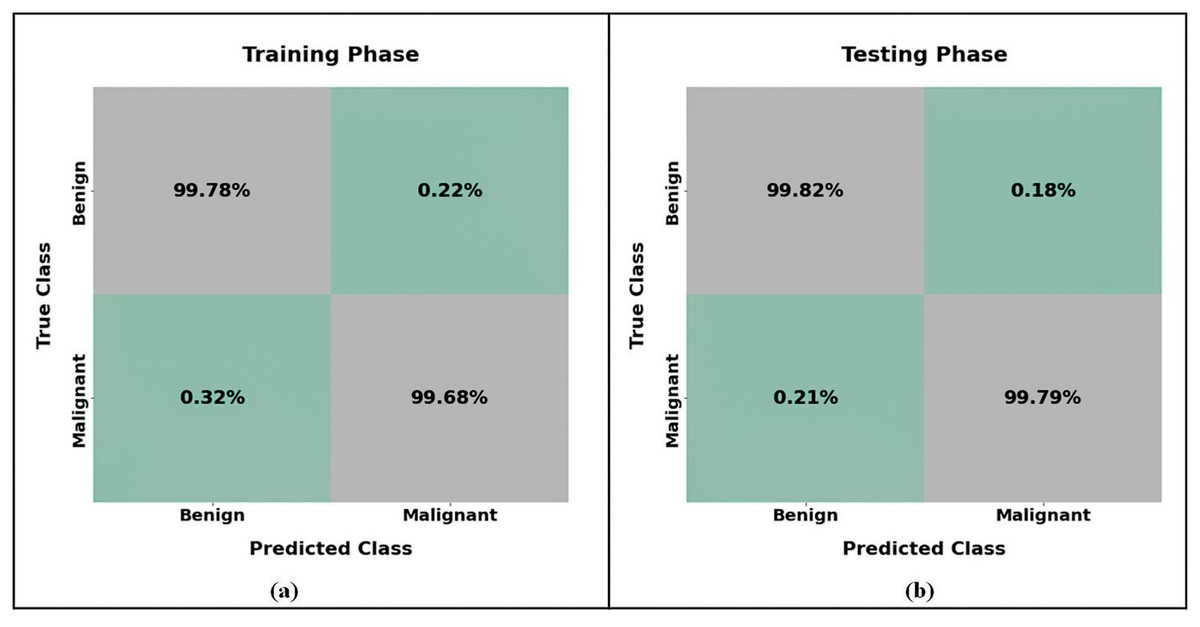
Figure 12: Confusion matrix of proposed pancreatic classification approach for (A) training and (B) testing.
Comparison results
The findings show that the suggested method effectively distinguished between benign and malignant pancreatic cancer. The proposed approach using CT scans for pancreatic tumor classification was contrasted with the cutting-edge techniques shown in Table 5. It demonstrates an improvement in the suggested model’s ability to classify benign and malignant tumors compared to the previous optimization processes. The best results are obtained using the proposed MResNext model with a TSOA optimizer configuration. The effectiveness of the proposed approach is compared to more recent previous approaches, including CNN (Lakkshmanan, Ananth & Tiroumalmouroughane, 2022), DESN (Gandikota, 2023), artificial neural networks (ANN) (Cao et al., 2023), Extreme Gradient Boost (XGBoost) (Bakasa & Viriri, 2023), Graph Neural Network (GNN) (Li et al., 2023), Echo State Network–Auto Encoder (ESN-AE) (Hussain et al., 2024), 11-layer AlexNet (Nadeem et al., 2025), and ELC-Casnet-CNN (Chaithanyadas & King, 2025) is less effective in extracting spatial features from images because they are built on recurrent neural networks first created for sequential data. Convolutional structures, such as those in MResNeXt, can better capture the intricate spatial patterns necessary for categorizing pancreatic cancer. It can be computationally costly to train a DESN, particularly for large, high-dimensional image datasets. In contrast to the more organized and optimized training of MResNeXt, echo state networks rely on a reservoir of randomly linked neurons, which might make the training process more complex and unpredictable.
| Reference | Year | Model | Accuracy (%) | Sensitivity (%) | Specificity (%) |
|---|---|---|---|---|---|
| Lakkshmanan, Ananth & Tiroumalmouroughane (2022) | 2022 | CNN | 98.02 | 97.62 | 98.82 |
| Gandikota (2023) | 2023 | DESN | 99.55 | 99.55 | 99.55 |
| Cao et al. (2023) | 2023 | ANN | 93.02 | 92.9 | 95.9 |
| Bakasa & Viriri (2023) | 2023 | XGboost | 97 | – | – |
| Li et al. (2023) | 2023 | GNN | 98.56 | 98.02 | 98.55 |
| Hussain et al. (2024) | 2024 | Echo State Network-Autoencoder (ESN-AE) | 99.33 | 99.22 | – |
| Nadeem et al. (2025) | 2025 | 11-layer AlexNet | 98.72 | 99.17 | – |
| Chaithanyadas & King (2025) | 2025 | ELC-Casnet-CNN | 98.21 | 97.54 | 99.11 |
| Gulsoy & Kablan (2025) | 2025 | FocalNeXt | 99.81 | 99.70 | – |
| Thanya & Jeslin (2025) | 2025 | DCCNN-ML | 99.3 | 99.1 | 99.5 |
| Kulkarni & Kansal (2025) | 2025 | LSTM | 98.53 | – | – |
| Alaca & Akmeşe (2025) | 2025 | K-NN | 92.10 | – | – |
| Proposed approach | MResNext | 99.85 | 99.76 | 99.72 |
ANN does not automatically recognize the local and global features between pixels in an image. However, MResNeXt’s deep, hierarchical structure allows it to capture these correlations and learn intricate spatial patterns across several scales, which is essential for recognizing tumor features. Significant parameters are usually needed for ANNs with fully connected layers, which might result in over-fitting, mainly when image data or small datasets are included. MResNeXt reduces this danger by using grouped convolutions and residual connections, which enhance generalization and help manage model complexity.
When image regions are transformed into network nodes in the GNN model, some delicate spatial information must be recovered. Important image features, such as small changes in pixel intensity surrounding tumor boundaries, may need to be more accurate. Complex pre-processing is frequently required to create a graph from an image, such as segmenting the image into regions or superpixels, which can introduce variability and inaccuracies. The quality of this graph representation significantly impacts GNN classification accuracy. In contrast, MResNeXt does not require this extra pre-processing step because it can process raw images directly. The number of graph nodes and edges can grow significantly when working with high-resolution photos, making GNNs computationally costly and challenging to train. This can result in slower processing speeds and increased memory requirements, especially for high-dimensional medical images. Large images are frequently handled more effectively by MResNeXt, which is well-optimized for image data.
To strengthen the evaluation of the proposed classification model, we incorporated comparisons with several recent state-of-the-art deep learning methods applied to CT image-based tumor classification. Specifically, FocalNeXt (Gulsoy & Kablan, 2025) utilizes a hybrid ConvNeXt and FocalNet structure with transformer-style attention for improved diagnostic accuracy; however, it is primarily designed for lung cancer detection and lacks pancreas-specific adaptations. Thanya & Jeslin (2025) introduced a Deep Cascade CNN with Multimodal Learning (DCCNN-ML), leveraging ResNet-50 for feature extraction, but its complex architecture increases training time and computational overhead. Kulkarni & Kansal (2025) used a hybrid CNN-LSTM approach with handcrafted texture features, which may lead to over-fitting and limited generalization across datasets. Alaca & Akmeşe (2025) adopted a graph-based pipeline involving Harris corner detection and transfer learning, followed by k-nearest neighbors (k-NN) classification; while innovative, this method relies heavily on graph quality and struggles with complex morphological variations in pancreatic tumors. In contrast, our proposed MResNeXt model offers significant advantages: it incorporates a modified ResNeXt architecture optimized via the Tunicate Swarm Optimization algorithm, enabling efficient hyperparameter tuning and improved generalization. Unlike prior methods, our model is tailored explicitly for pancreatic cancer classification and achieves superior performance with a classification accuracy of 99.85%, sensitivity of 99.76%, and specificity of 99.72%. The model benefits from a deeper residual architecture with grouped convolutions that enhance feature representation while maintaining computational efficiency. These improvements underscore the robustness and diagnostic potential of our method in detecting pancreatic malignancies.
MResNeXt’s usage of residual connections, which mitigates the vanishing gradient issue and aids in training deeper networks, is one of its many noteworthy advantages. These connections are frequently absent from standard CNNs, which makes it more challenging to train deeper models successfully. Regarding specificity, sensitivity, and accuracy, the proposed MResNext-TSOA model performs better than the previous deep-learning models and effectively classifies pancreatic cancer. The significant properties that the proposed model successfully captures indicate the inter-scale variability of the tumor, hence increasing classification performance. The suggested system shows promising classification accuracy, enabling automated pancreatic cancer detection and pre-screening.
Table 6 compares the results of several segmentation approaches utilized in recent existing methodologies with the proposed segmentation model. Lightweight Multiscale Novel Semantic-Net (LMNS-Net) (Paithane & Kakarwal, 2023), MobileNet-U-Net (MBU-Net) (Huang & Wu, 2022), U-Net (Saraswathi & Rafi, 2023), deep neural network (DNN) (Kawamoto et al., 2023), Modified CNN (Paithane & Kakarwal, 2022), Selected Multi-scale Attention Network (SMANet) (Gao et al., 2022a), CausegNet (Li et al., 2024), nnU-Net (Yang et al., 2024), and CS module (Chen et al., 2024) and the suggested technique are among the approaches investigated. The two metrics we utilized to compare the efficacy of different strategies were DSC and IOU. Our proposed approach outperformed the others in segmentation performance, with the most significant values across all four categories. The SMANet technique performed well overall, although some measures had slightly lower values.
| Reference | Year | Model | IOU (%) | DSC (%) |
|---|---|---|---|---|
| Paithane & Kakarwal (2023) | 2023 | LMNS-Net | 88.68 | – |
| Huang & Wu (2022) | 2022 | MBU-Net | 80.93 | 82.87 |
| Saraswathi & Rafi (2023) | 2023 | U-Net | – | 88.2 |
| Kawamoto et al. (2023) | 2023 | DNN | 85.43 | 87.4 |
| Paithane & Kakarwal (2022) | 2022 | Modified CNN | 69.82 | 82.57 |
| Gao et al. (2022a) | 2022 | SMANet | 66.5 | 76.9 |
| Li et al. (2024) | 2024 | CausegNet | – | 86.67 |
| Yang et al. (2024) | 2024 | nnU-Net | – | 76.4 |
| Chen et al. (2024) | 2024 | Channel and spatial self-attention (CS) Module | 59.42 | 73.93 |
| Wang et al. (2023) | 2023 | MFCNet | – | 76.20 |
| Proposed approach | EUNet | 96.04 | 95.87 |
With a computational time of only 6 s for each slice, the suggested segmentation model demonstrates how lightweight EUNet is as a CNN. It can also identify edges and curves quite successfully. Because the boundaries between the malignant and benign lesion regions of pancreatic cancer are precisely and successfully delineated, the proposed model achieves a more effective performance for early-stage diagnosis.
Comparative performance of general segmentation models
Table 7 displays the general segmentation model’s performance comparison with our proposed model (EUNet) results for pancreatic tumor segmentation using the CT image dataset. According to the comparative analysis, general-purpose segmentation models such as DeepLabV3+ and Mask region-based convolutional neural networks (R-CNN) perform rather well, but they have trouble capturing the irregular and fine-grained boundaries of pancreatic tumors, especially in low-contrast CT images. After fine-tuning, DeepLabV3+ and Mask R-CNN outperform SAM; nonetheless, they still have issues in accurately delineating boundaries and preserving minute lesion features. The baseline U-Net performs satisfactorily, but its accuracy is slightly lower since it lacks the advanced contextual aggregation and residual learning skills required for better gradient flow and feature reuse. As compared to transformer-based or large-scale models like SAM, the proposed EUNet continuously produces better IoU and DSC values, successfully striking a balance between high segmentation accuracy and reduced computing complexity. The proposed EUNet model is now better suited for practical medical imaging applications due to the integration of WC blocks for improved multi-scale contextual feature extraction and residual extended skip (RES) blocks for better gradient flow, decreased overfitting, and enhanced fine-detail preservation.
| Model | IoU (%) | DSC (%) |
|---|---|---|
| SAM (Segment Anything Model) | 81.25 | 82.1 |
| DeepLabV3+ | 87.42 | 88.05 |
| Mask R-CNN | 85.67 | 86.54 |
| U-Net (Baseline) | 91.32 | 90.85 |
| Proposed EUNet | 96.04 | 95.87 |
Performance comparison of proposed EUNet with recent segmentation models
We used the same pancreatic CT dataset as in our proposed research to evaluate our proposed Enhanced U-Net (EUNet) model with representative recent segmentation models TransUNet, nnU-Net, Swin-UNet, and FocalNeXt as shown in Table 8. All models were trained and tested under identical experimental settings, and segmentation performance was evaluated using IoU and DSC as key metrics.
| Model | IoU (%) | DSC (%) |
|---|---|---|
| TransUNet | 93.12 | 92.85 |
| nnU-Net | 94.87 | 94.65 |
| Swin-UNet | 94.12 | 93.98 |
| FocalNeXt | 95.02 | 94.87 |
| Proposed EUNet | 96.04 | 95.87 |
In both IoU and DSC, the proposed EUNet performed better than all other models under comparison, exhibiting better tumor boundary preservation and segmentation accuracy. This improvement can be attributed to the synergistic effect of RES blocks and WC blocks, which enhance both multi-scale contextual understanding and fine-grained detail preservation without excessive computational cost.
Discussion
In this work, we presented a unique technique for automatically classifying and segmenting pancreatic cancer from CT scan pictures. Network layer training in deep learning is a laborious process. The proposed method requires a very short time compared to previous deep learning methods. The suggested method’s F-measure value for the same dataset is better than alternative CNN network models. The values of the F-measure, precision, specificity, accuracy, and sensitivity using the proposed approach are better than those of other techniques. In comparison to cutting-edge methods, DSC and IOU scores are high.
Combining the EUNet and MResNext models yields a reduced misclassification rate compared to other models, as seen in Fig. 10, demonstrating the model’s ability to detect infected areas correctly. Our technique can accurately detect such positive regions even in cases where the input patch contains only a small amount of pancreatic tumor. According to these findings, our proposed model identified pancreatic cancers mainly using nuclear characteristics. With large, crowded, dark, and irregular regions, the tumor cell nuclei were effectively identified by our EUNet model. These features are essential for the identification of tumors.
ResNeXt’s “cardinality” concept enhances its capacity to collect several features by enabling numerous parallel channels for information flow. In contrast to AlexNet, VGG, or ResNet, which lack this parallel pathway structure, this is especially helpful for pancreatic cancer, where features can be subtle and complicated, improving the model’s capacity to distinguish between malignant and benign tissues.
EUNet incorporates enhancements such as dense skip connections and deeper decoder layers to maintain spatial information and boundary detail. This is more efficient than the basic UNet, which may lose boundary information because of resolution limitations, resulting in a finer delineation of tumor boundaries, which is crucial for medical imaging.
Enhanced UNet models are frequently more computationally efficient than conventional segmentation networks since they have optimized layer structures and fewer parameters. Compared to the more computationally demanding UNet+ or SegNet, EUNet is more appropriate for real-time or resource-constrained environments because of its performance and efficiency balance.
ResNeXt improves upon ResNet by introducing the grouped convolution mechanism, which allows for a more efficient and scalable architecture. The following are the key advantages of the ResNext model over the ResNet model: ResNeXt introduces cardinality; it splits feature maps into multiple groups and processes them separately before aggregating the outputs. This enhances diversity in learned features compared to ResNet, which relies solely on deeper or wider networks. This is particularly useful for medical image classification, where fine-grained patterns (e.g., tumor textures) need to be captured more effectively; ResNeXt achieves better accuracy with fewer parameters compared to ResNet. This is critical for medical imaging, where models need to balance accuracy and computational feasibility. The grouped convolutions reduce redundancy and enhance feature extraction while keeping computational costs similar to ResNet.
For segmentation tasks, ResNeXt’s grouped convolutions can be leveraged in several ways: Using ResNeXt as the feature extractor in UNet, DeepLabV3+, or other segmentation models can improve feature representation for tumor boundaries and lesion areas. The increased cardinality allows for capturing diverse spatial features, which is crucial for medical image segmentation. In segmentation tasks, multi-scale contextual information is essential. ResNeXt’s ability to process multiple transformations in parallel improves the detection of both fine-grained and large-scale structures. This is particularly useful in pancreatic tumor segmentation, where tumors vary in size and shape. Grouped convolutions in ResNeXt help in better edge detection and reduce segmentation artifacts, which is crucial for accurately segmenting medical images. Incorporating ResNeXt in the encoder of DeepLabV3+, UNet++, or an improved UNet variant can improve segmentation precision.
Compared to the state-of-the-art, the suggested technique values are high according to the assessment matrix parameters. The proposed approach uses the dice loss function as the loss function in the segmentation network. The classification network’s accuracy increases, and network loss is reduced using the SD-Reg approach. Although the proposed approach effectively segments data, it cannot identify the percentage of areas impacted by pancreatic cancer. The proposed approach yields a 2D image of the size and shape of the pancreas. Future applications of the suggested technique include 3D pancreatic image detection.
Ablation study
This section includes accuracy ablation experiments to illustrate the effectiveness of our proposed methodology. Four modules comprise the proposed framework: pre-processing (Noise filtering + contrast Enhancement), segmentation (EUNet), feature extraction (DenseNet-169), and classification (MResNext). The test results above showed that the proposed method can produce positive results on the datasets of pancreatic CT images. In this section, we carried out the ablation experiment to investigate the effects of each constituent in the proposed structure in more detail. Table 9 displays the results of the ablation experiments.
| Pre-processing | Segmentation | Feature Extraction | Classification | Accuracy (%) | Sensitivity (%) | Specificity (%) | AUC (%) |
|---|---|---|---|---|---|---|---|
| ✓ | ✓ | ✓ | 99.23 | 99.10 | 99.15 | 95.01 | |
| ✓ | ✓ | ✓ | 98.92 | 98.67 | 98.24 | 94.64 | |
| ✓ | ✓ | 98.54 | 98.03 | 98.54 | 96.65 | ||
| ✓ | ✓ | ✓ | 99.34 | 99.53 | 99.64 | 95.24 | |
| ✓ | ✓ | ✓ | ✓ | 99.85 | 99.76 | 99.72 | 97.40 |
Table 9 demonstrates the relative importance of the EUNet-based segmentation and the DenseNet-169-based feature extraction. The accuracy and other performance measures are significantly reduced if specific modules are removed. The DenseNet-169 model efficiently reduces dimensionality, focuses on the most relevant features, and extracts and fuses static and dynamic features, all essential for enhancing the classifier’s performance. The handle is complicated, and high-dimensional data is effectively handled using the EUNet segmentation model, which guarantees accurate pancreatic tumor segmentation. Additionally, we discovered that the pre-processing module, which uses hybrid filtering for noise reduction and HRLG for contrast enhancement, can aid in the classification of pancreatic cancer. This is because the hybrid filtering and HRLG contrast enhancement technique improves the quality of classified output images. Without the pre-processing phase, the proposed method achieved only 99.23% accuracy, 99.10% sensitivity, and 99.15% specificity. Integrating all modules improved the accuracy of the MResNext model for pancreatic tumor classification. Based on the ablation test results, it was clear that adding these modules to the proposed model would improve performance.
External clinical validation
To further validate the effectiveness of the proposed Modified ResNeXt (MResNeXt) model, we conducted an external clinical validation using an independent dataset from a different medical institution. A total of 100 pancreatic cancer patients were included in this study, and their CT images were collected for classification into benign and malignant cases. Three experienced radiologists reviewed the imaging data and verified the ground truth labels through pathology reports.
Once the images were preprocessed, segmented, and relevant features extracted, they were fed into the trained Modified ResNeXt model. The classification results were then compared with expert diagnoses to assess the model’s reliability. Performance metrics, including accuracy, sensitivity, specificity, and AUC, were evaluated to determine the robustness of the proposed approach. Our model consistently achieved performance above 90% in clinical validation, demonstrating its strong generalization capability.
Additionally, we analyzed the true positive rate (TPR) and false positive rate (FPR) at different probability thresholds to compute the ROC curve. As shown in Fig. 13, the AUC value of 0.9650, calculated using the trapezoidal method, indicates a highly accurate classification system. AUC values above 0.9 reflect strong diagnostic capabilities, confirming the model’s reliability in real-world scenarios.
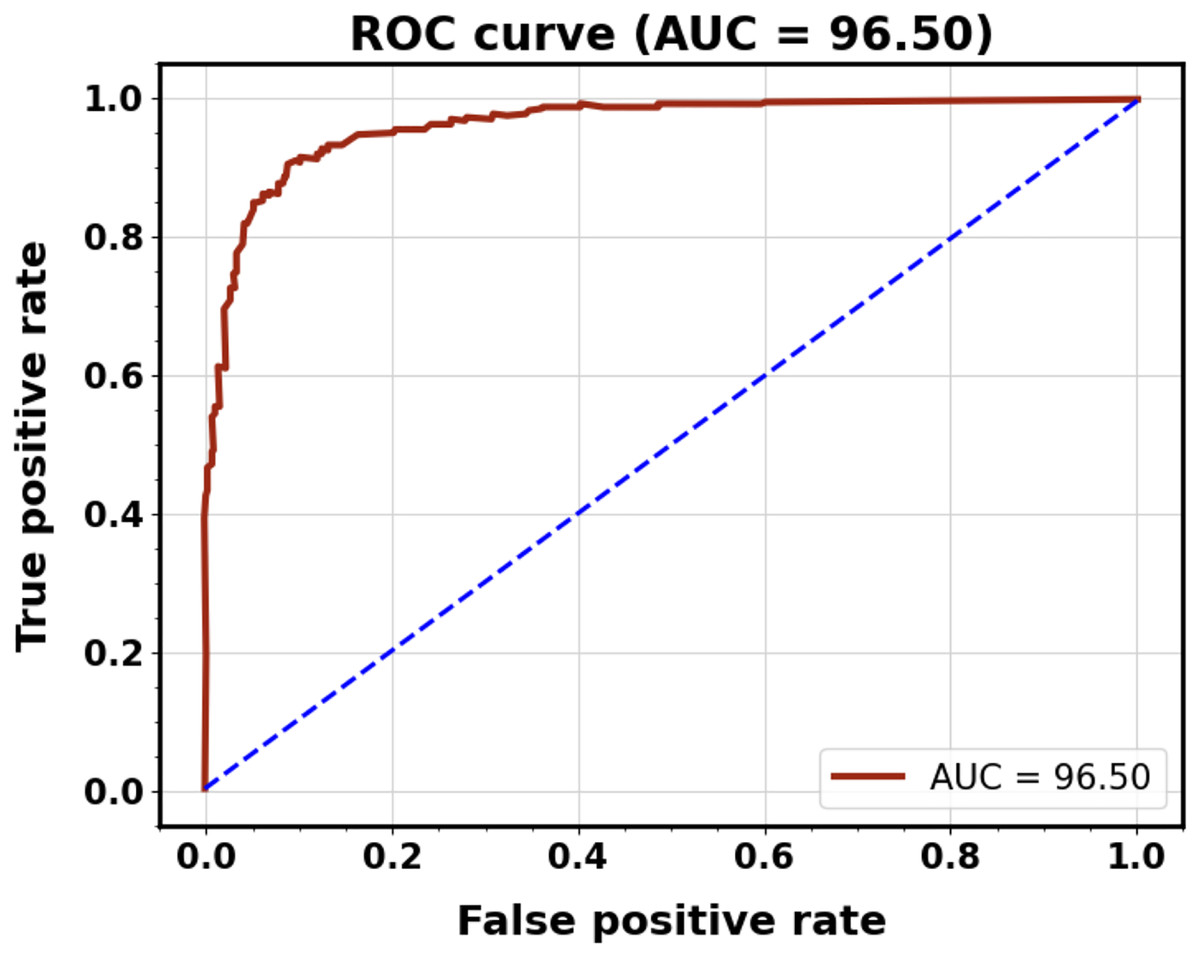
Figure 13: ROC curve for clinical validation.
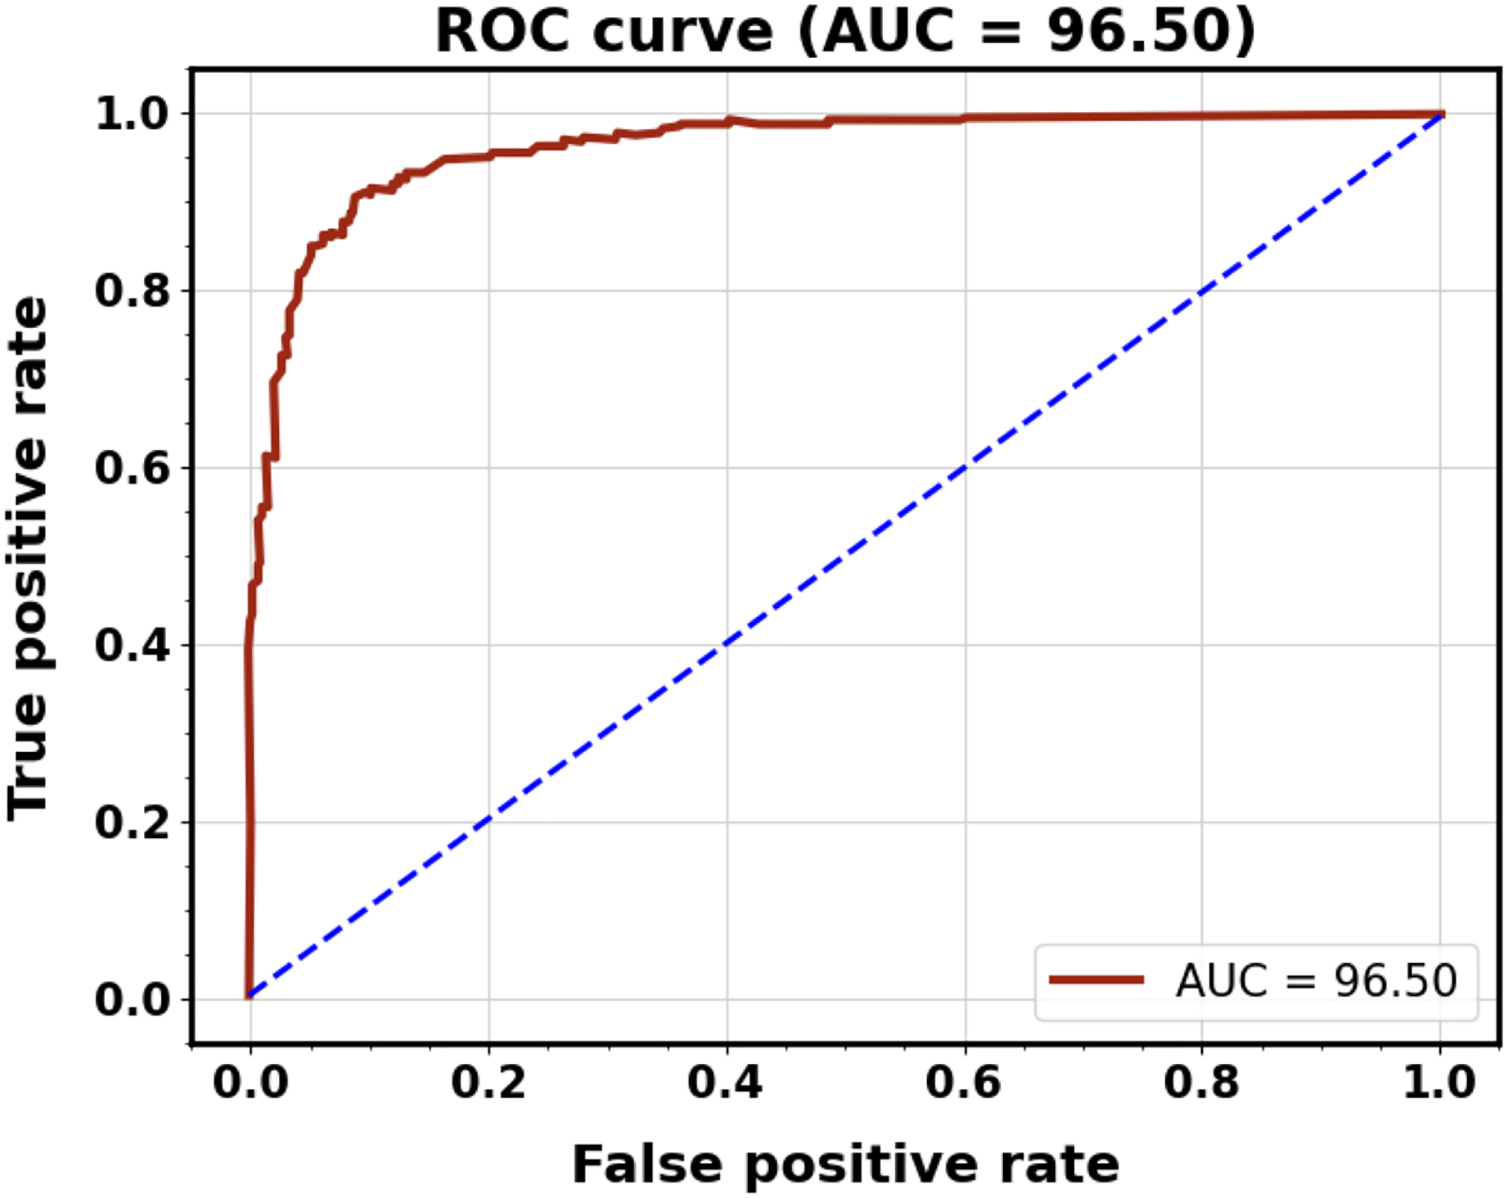
Furthermore, the proposed method significantly improves diagnostic efficiency. Each patient’s imaging data was analyzed within 0.2 s, enabling a fully automated diagnosis within 3 s, compared to the 8 min required by a radiologist for manual assessment. These findings highlight the clinical feasibility of the Modified ResNeXt model, demonstrating higher accuracy, faster processing time, and improved diagnostic effectiveness compared to conventional diagnostic methods. The results from external clinical validation confirm the robustness and generalizability of our approach, with minimal performance drop and strong agreement with expert annotations.
ANOVA test
To evaluate the effectiveness of the proposed model in comparison to existing state-of-the-art models, we conducted a one-way Analysis of Variance (ANOVA) test to assess significant differences in key performance metrics: accuracy, sensitivity, and specificity. The ANOVA test yielded an F-statistic of 7 and a p-value of 0.01, indicating a statistically significant difference in performance among the models. A p-value of 0.01 suggests that there is only a 1% probability that the observed improvements in accuracy, sensitivity, and specificity occurred due to chance. This strongly supports the claim that the proposed model significantly outperforms existing models. The obtained F-value of 7 is relatively high, meaning that the variation in performance between the proposed and existing models is much greater than the variation within the models themselves. Based on the ANOVA test results, the proposed model demonstrates significant improvements in accuracy, sensitivity, and specificity compared to state-of-the-art models, robust performance, validated through statistical analysis, strong confidence (99%) in the reliability of the observed improvements (p = 0.01), and meaningful variance (F = 7), confirming that the enhancements are not due to random fluctuations. The statistical analysis strongly supports the effectiveness of the proposed model. The observed performance improvements are statistically significant, confirming that the model offers superior classification accuracy, sensitivity, and specificity over existing approaches. This reinforces its potential as a reliable and efficient solution for pancreatic cancer classification.
Computational complexity
The computational efficiency of the proposed method for diagnosing pancreatic cancer is shown in Table 10. Floating point operations (FLOPs), testing execution time, storage consumption, and parameters are used to evaluate the method’s computational efficiency. As the table shows, the proposed method for identifying pancreatic tumors requires less computational work. The proposed segmentation (EUNet) model takes 1 to 3 s to segment medical CT images during the testing process for pancreatic tumor segmentation. Compared to other segmentation models, the proposed EUNet model takes less time to test.
| Proposed models | Parameters | Flops | Memory | Computation cost | Execution time for testing |
|---|---|---|---|---|---|
| EUNet model | 3M | 25M | 0.8 GB | 1.15 GB | 3 s |
| MResNext model | 4M | 30M | 0.95 GB | 1.2 GB | 2.5 s |
Limitations
One significant drawback of this proposed research is that just one publicly accessible pancreatic cancer CT imaging dataset was used to train and evaluate the proposed models. The availability of diverse and annotated datasets for pancreatic cancer remains a challenge, limiting the ability to test the model’s generalizability across populations with varied demographics, scanner types, or acquisition protocols.
The dataset has a higher representation of benign cases compared to malignant ones, which could introduce a class imbalance bias during training.
The transition of the proposed models from research to clinical environments poses several challenges. These include ensuring compatibility with existing radiology systems, real-time processing capabilities, and ease of use for radiologists without requiring extensive training.
The proposed models need rigorous validation in clinical settings across multiple healthcare institutions to ensure robustness and reproducibility under varying conditions.
Future scope
To address the limitation of dataset diversity, future research will involve testing the models on multiple large-scale and multi-institutional pancreatic cancer datasets, including private and public repositories. This will help evaluate the generalizability and robustness of the proposed approach.
To address the class imbalance, data augmentation techniques such as flipping, rotation, and contrast adjustments are applied to underrepresented classes in the future to ensure a balanced training set.
Future work will explore domain adaptation and transfer learning methods to adapt the models to different imaging modalities (e.g., MRI, PET-CT) and scanners to increase the versatility of the proposed system.
Develop a user-friendly interface to enable seamless integration with clinical workflows. Collaborate with radiologists and oncologists to conduct prospective validation studies in real-world clinical settings, focusing on assessing model interpretability and diagnostic accuracy.
Conclusion
The pancreas is a vital organ that secretes substances inside and outside the body. It is also susceptible to various diseases. There is currently an inferior prognosis for pancreatic malignancies, which are deadly. To track, diagnose, and classify cancer incidence, computerized segmentation and classification of pancreatic cancer using a CAD model are required. Deep learning systems can give precise image interpretation for medicinal purposes. The research created a novel deep learning-based segmentation and classification (EUNet-MResNext) model for CT images to accomplish this goal. Pre-processing is applied to the images to eliminate noise from the acquired dataset. A hybrid filtering technique is employed for pre-processing. The EUNet model is used for segmentation to identify the affected pancreatic region. Using the DenseNet-161 model, the essential features of the affected lesion region are retrieved. The next step is to classify pancreatic cancer as benign or malignant using MResNext-TSOA. The classification performance is improved due to the TSOA’s ability to prevent the manual trial-and-error hyper-parameter selection procedure. With a 99.85% overall accuracy, 99.76% sensitivity, 99.72% specificity, 95.87% dice score, and 96.04% IOU, the proposed integrated method segments and classifies pancreatic cancer. Comparing the proposed (modified DenseNet-201-IDRSN) model to other approaches, such as U-Net, Modified CNN, DNN, GNN, ANN, particle swarm optimization (PSO), support vector machine (SVM), XGboost, and others, the proposed models outperformed the others in segmentation and classification tasks, according to the experimental data.
We intend to gather additional samples from various central institutions in the future and develop a classification model that performs better; consequently, it has more clinical value for using CT imaging for the preoperative diagnosis and staging of pancreatic cancer.