
YOLOvFIS: a YOLO network for fruit instance segmentation
- Published
- Accepted
- Received
- Academic Editor
- Jyotismita Chaki
- Subject Areas
- Artificial Intelligence, Computer Vision, Data Mining and Machine Learning, Neural Networks
- Keywords
- Fruit instance segmentation, Fruit image dataset, YOLO networks, YOLOvFIS, YOLOvFIS’s backbone
- Copyright
- © 2025 Cheng et al.
- Licence
- This is an open access article distributed under the terms of the Creative Commons Attribution License, which permits using, remixing, and building upon the work non-commercially, as long as it is properly attributed. For attribution, the original author(s), title, publication source (PeerJ Computer Science) and either DOI or URL of the article must be cited.
- Cite this article
- 2025. YOLOvFIS: a YOLO network for fruit instance segmentation. PeerJ Computer Science 11:e3256 https://doi.org/10.7717/peerj-cs.3256
Abstract
You Only Look Once (YOLO) networks have demonstrated significant advancements in fruit detection and instance segmentation. Nonetheless, challenges remain in managing dense scenes, overlaps, occlusions, generalization difficulties, dynamic environments, computational and deployment limitations, specifically concerning the application of YOLOv5 to YOLOv11 for fruit instance segmentation. This article tackles these issues by constructing a fruit image dataset with segmentation annotations, having 11,546 images with six classes, and developing a You Only Look Once version Fruit Instance Segmentation (YOLOvFIS) network for fruit detection and instance segmentation. The results demonstrate that integrating the backbone of YOLOvFIS into YOLO versions of YOLOv5n, YOLOv6n, YOLOv7t, YOLOv8n, YOLOv9t, YOLOv10n, and YOLOv11n improved the networks, surpassing the performance of the original networks. The improved YOLOv9t outperformed other improved YOLO networks, even though it had a longer overall detection time. The parameters (params) and giga floating point operations per second (GFLOPs) of YOLOvFIS’s entire network are less than other YOLO networks. The mean average precision (mAP) of YOLOvFIS is 1.6%, 1.0%, 1.0%, 1.0%, 0.3%, 0.8%, and 0.4% more accurate than YOLOv5n, YOLOv6n, YOLOv7t, YOLOv8n, YOLOv9t, YOLOv10n, and YOLOv11n, respectively, for fruit detection. It also exhibits superior mAP by 1.5%, 1.0%, 0.9%, 1.6%, 0.6%, 0.7%, and 0.7% compared to YOLOv5n, YOLOv6n, YOLOv7t, YOLOv8n, YOLOv9t, YOLOv10n, and YOLOv11n, respectively, in the context of fruit instance segmentation. Regarding total detection time, YOLOvFIS is 14%, −7.2%, 112.2%, 0.0%, 84.8%, 9.9%, and 7.5% faster than YOLOv5n, YOLOv6n, YOLOv7t, YOLOv8n, YOLOv9t, YOLOv10n, and YOLOv11n, respectively. As a result, the network of YOLOvFIS is robust for generalization, appropriate for real-time applications, robotic integration, and low-power computing devices. Lastly, the obtained findings can serve as technical assistance and suitable references for YOLO-based fruit detection and instance segmentation.
Introduction
Fruit instance segmentation is an important task in computer vision, particularly in applications like agriculture and farming, robotic harvesting/picking, fruit quality control, and supply chain management (Gené-Mola et al., 2020; Jia et al., 2022; Zhou et al., 2024). It involves detecting and delineating individual instances of fruits within an image and video, allowing precise recognition and tracking of different fruit targets. The advancements in deep learning have significantly improved the performance of detection and instance segmentation over the years, with the You Only Look Once (YOLO) family of networks playing a pivotal role in this evolution (Lawal, Zhu & Cheng, 2023; Mohamed et al., 2024; Khan et al., 2024; Lawal, 2021a).
The original YOLO version of the network was introduced in 2015, and the recent YOLOv11 represents a progressive enhancement in single-stage real-time object detection and segmentation capabilities. These networks are renowned for their ability to balance speed and mean average precision (mAP), rendering them well-suited for practical applications of fruit detection and instance segmentation where the processing of substantial volumes of data in real-time is frequently required. YOLO had difficulty recognizing smaller items in clusters, struggled with shapes, and suffered from localization errors. With these, the evolution from YOLOv2 to YOLOv4 has been characterized by key innovations such as anchor boxes, feature pyramids, and spatial attention mechanisms that enhance the detection of small and overlapping fruit instances (Gené-Mola et al., 2020; Jia et al., 2022; Zhou et al., 2024; Mohamed et al., 2024; Khan et al., 2024). The enhancements in multi-scale predictions in YOLOv3 established a strong foundation for detecting targets of various sizes; meanwhile, YOLOv4 built upon this foundation with Cross Stage Partial Network (CSPNet) and Mosaic data augmentation to further improve mAP and better generalization. The modification of YOLOv3 was reported by Fu et al. (2021) for kiwifruit detection in orchards, Zheng et al. (2019) for muskmelon detection, and Lawal (2021a) and (Liu et al., 2020) for tomato detection. The pursuit for improved YOLOv4t for real-time pear fruit detection and counting was published by Parico & Ahamed (2021); likewise, Latha et al. (2022) reported on fruit and vegetable detection, Lawal (2021b) introduced YOLOMuskmelon for muskmelon fruit detection, Tang et al. (2023a) detected each camellia oleifera fruit target in an orchard, Lawal (2021c) developed a tomato detection model for a robotic platform, Mei-Ling & Yang (2023) proposed GCS-YOLOv4t to detect different growth stages of fruits, and (Lawal & Zhao, 2021) launched YOLOFig using deep learning for fig fruit detection.
The introduced YOLOv5 for fruit detection and instance segmentation became more modular, focusing on ease of use, training efficiency, and deployment. Using the YOLOv5 for target detection, the real-time cucurbit fruit detection in greenhouses was reported by Lawal (2024). Gai, Li & Chen (2021) developed YOLOv5s-cherry for cherry detection; Qiao et al. (2021) added ShuffleNetv2 for a counting method of red jujube. Zhang et al. (2022) applied ghost network to detect a dragon fruit in the natural environment, Lawal (2023a) developed a lightweight YOLOStrawberry for strawberry detection, Xu et al. (2023) proposed YOLO-Jujube to detect jujube fruit automatically for ripeness inspection, and (Lawal, Zhu & Cheng, 2023) incorporated feature concatenation with a coordinate attention mechanism (CAM) to detect fruit. In the case of fruit instance segmentation, Zhou et al. (2024) applied a lightweight network called YOLO-AppleSeg to detect apple fruit, likewise YOLOv5-LiNet was proposed by Lawal (2023b) for fruit instance segmentation; Lu et al. (2023) harnessed instance segmentation of lotus pods and stalks in unstructured planting environments, and (Paewboontra & Nimsuk, 2024) detected multi-scale rose apple skin and defects using instance segmentation with anchors optimization. YOLOv6 and YOLOv7 further refined the architecture with advancements in training techniques, optimization algorithms, and feature extraction, enhancing the detection and segmentation of fruits in complex scenes. Chowdhury, Said & Saruchi (2024) adopted YOLOv6 to detect oil palm fruit ripeness levels. While Zhang et al. (2022) used the YOLOv7 network to detect dragon fruit, Chen et al. (2022) improved it with the added Convolutional Block Attention Module (CBAM) for citrus detection, and Zhou, Zhang & Wang (2023) utilized the PSP-Ellipse technique to further detect the endpoints of the dragon fruit after its localization and classification. Tang et al. (2023b) developed the YOLOv7-plum to detect plum fruits in a complicated orchard setting, whereas Chen et al. (2024) used MTD-YOLO to perform three tasks: cherry tomato detection, fruit and bunch maturity rating, and cherry tomato detection. Tang et al. (2024) introduced EfficientNet-B0 and CBAM modules into YOLOv7 to build YOLOC-tiny for citrus fruit detection at various maturity levels. Selective fruit harvesting prediction and 6D pose estimation for multi-parameter recognition was published by Zhao et al. (2025), and the Darknet Framework YOLOv7 was harnessed by Nasution et al. (2023) for pineapple fruit ripeness classification.
For a more modular and adaptable architecture with anchor-free YOLOv8 to YOLOv11, incorporated cutting-edge approaches enabled the networks to perform instance segmentation tasks with exceptional mAP and robustness. They also provided better support for dense scenes, occlusions, and real-world variabilities in fruit appearance. Xiao, Nguyen & Yan (2024) adopted the YOLOv8 network for fruit ripeness identification, while Ang et al. (2024) called the improved network YCCB-YOLO for the detection of young citrus fruits on trees, and Lawal et al. (2023) proposed a simplified topology of the network to detect, track, and count fruit targets. Yang et al. (2023) added a Swin-Transformer into the YOLOv8 network to increase the mAP of detected strawberry fruit, and Li et al. (2023) leveraged the multi-head self-attention (MHSA) mechanism to detect, grade, and count tomato maturity stages. YOLOv9 was built upon by Ye et al. (2024) to design CR-YOLOv9 for strawberry fruit maturity detection, and Wang, Rong & Hu (2024) integrated HGBlock and SPD-ADown modules to detect ripe tomatoes. Li et al. (2024) developed lightweight D3-YOLOv10 based on improved YOLOv10 to identify tomatoes in facility situations. Fu et al. (2024) incorporated a squeeze-and-excitation (SE) attention mechanism into the YOLOv10 network to create MSOAR-YOLOv10 for multi-scale occluded apple detection and improved harvest robotics. For instance segmentation, Neupane et al. (2024) modified YOLOv8 for real-time detection of mango fruit in tree canopy images using an edge computing device; Gamani, Arhin & Asamoah (2024) focused on instance segmentation of strawberry fruit development stages in open field environments; Kim et al. (2024) addressed lychee instance segmentation at various growth stages; Sapkota, Ahmed & Karkee (2024) explored automated orchard operations in multi-apple segmentation; Wang et al. (2024) conducted real-time detection and segmentation of tomato fruits at different ripeness stages; and Yue et al. (2023) investigated instance segmentation of healthy and diseased tomato plants during the growth stage. Sapkota & Karkee (2024) evaluated the efficacy of instance segmentation using YOLOv11 and YOLOv8 for both occluded and non-occluded immature green fruits in a complex orchard setting, while Sapkota, Meng & Karkee (2024) utilized LLM-generated datasets for YOLO11 and YOLOv10 to facilitate apple detection via machine vision sensors. This progression has transformed YOLO networks into a diverse and powerful tool for fruit instance segmentation. Applications for automated fruit harvesting, picking, sorting, and inventory management have grown more viable and effective as a result of their capacity to efficiently localize and segment fruit targets.
While the versions of YOLO networks, particularly from YOLOv5 to YOLOv11, have achieved remarkable progress in fruit detection and instance segmentation, certain limitations persist in handling dense scenes, overlapping, occlusions, generalization issues, dynamic environments, computational and deployment constraints, and domain-specific variability. Meanwhile, these limitations are due to intrinsic complexities in real-world applications, as well as specific architectural and methodological constraints. Furthermore, the references to the application of YOLOv5 to YOLOv11 for fruit instance segmentation, including the fruit image dataset, are limited. This article addresses these problems by building a new fruit image dataset and integrating YOLO-based segmentation with robust feature extraction modules to develop You Only Look Once version Fruit Instance Segmentation (YOLOvFIS), which improves performance in fruit instance segmentation tasks. The YOLO network relies heavily on these feature extraction modules because they effectively extract important information from images, improving the network’s ability to recognize, locate, and segment fruit targets under a variety of situations. Therefore, the contributions are to:
-
(1)
develop a robust fruit image dataset with segmentation annotation under complex natural environments to limit the lack of the domain-specific variations found in agricultural sectors.
-
(2)
introduce the C4fR module that combines standard and concatenated Pointwise-Depthwise convolutions into C4 for enhanced feature extraction and processing, the spatial-channel downsampling (SCDown) module for downsampling with separable convolutions, spatial pyramid pooling faster (SPPFr) for enhanced feature extraction, and partial self-attention (PSA) for implementing position-sensitive attention into the backbone network of YOLOv5n to YOLOv11n, and compare the original to the improved network for fruit instance segmentation.
-
(3)
design YOLOvFIS with the incorporated backbone network mentioned in (2), and modified neck network of YOLOv11n with SCDown to foster low computation, fewer parameters, high mAP, high speed, robustness, and deployable-friendliness for low-power computing devices.
-
(4)
compare the performance of the YOLOvFIS network to that of YOLOv5n, YOLOv6n, YOLOv7t, YOLOv8n, YOLOv9t, YOLOv10n, and YOLOv11n for fruit detection and instance segmentation, especially with the incorporation of YOLOvFIS’s backbone.
The remainder of this article outlines the methodology pertaining to the proposed YOLOvFIS and the created fruit image dataset. The ‘Results and Discussion’ section contrasts the original network with the improved network of YOLOv5n to YOLOv11n and the performance of YOLOvFIS with other mainstream YOLO networks. The ‘Conclusion’ section provides a final summary of the findings.
Methodology
Fruit image dataset
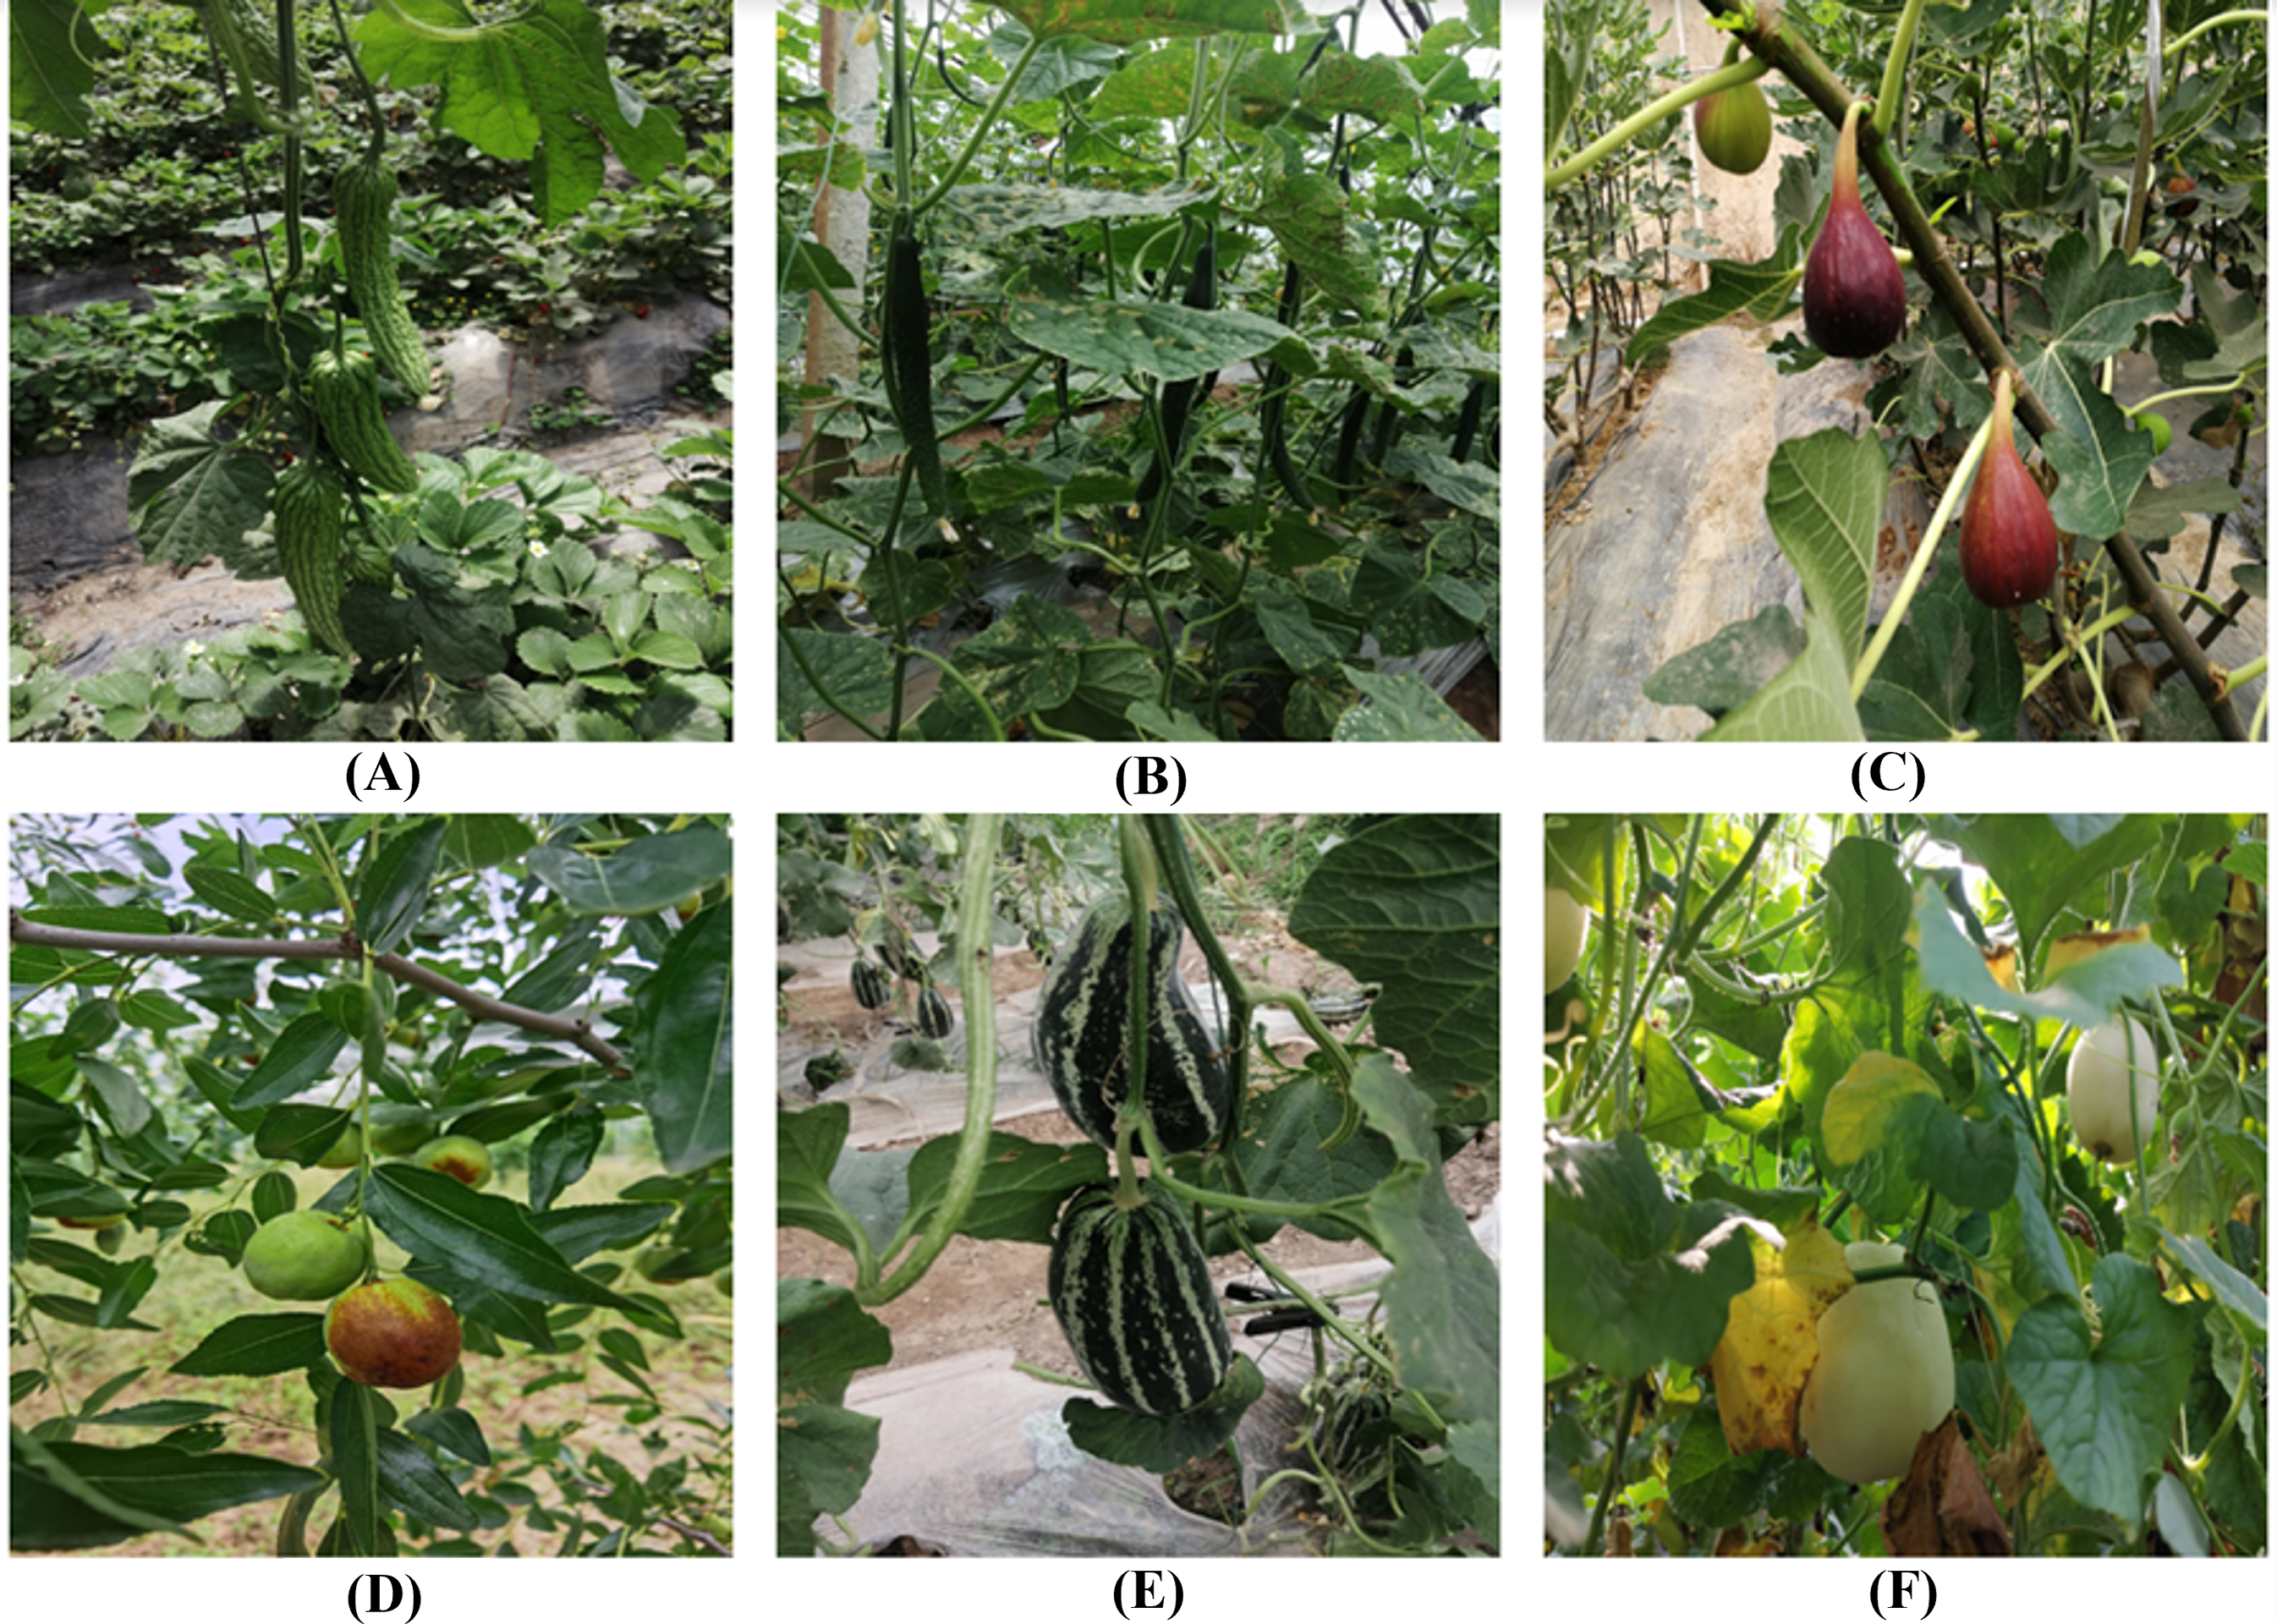
The fruit images used in this article were obtained from different locations within the Wanghaizhuang greenhouses, Houcheng town, Jinzhong, Shanxi, China, using a regular 3,968 × 2,976 pixels digital camera. During the morning, midday, and afternoon hours, 665 images of bitter-melon, 664 images of cucumber, 382 images of fig, 1,959 images of jujube, 736 images of melon-boyang, and 404 images of muskmelon were taken, paying special attention to a range of conditions like dense scenes, overlapping, occlusions, illumination, and other fruit scenes. These images were selected due to their high variability in color, texture, size, shape, and so on, which can enable the network’s ability to generalize across different fruit datasets. Figure 1 provides the sample of images in the dataset. Neglecting the images’ complex and changeable condition, all the ground truth bounding polygons of each target in an image were manually annotated and saved in Common Objects in Context (COCO) format using the Labelme tool (https://github.com/wkentaro/labelme).
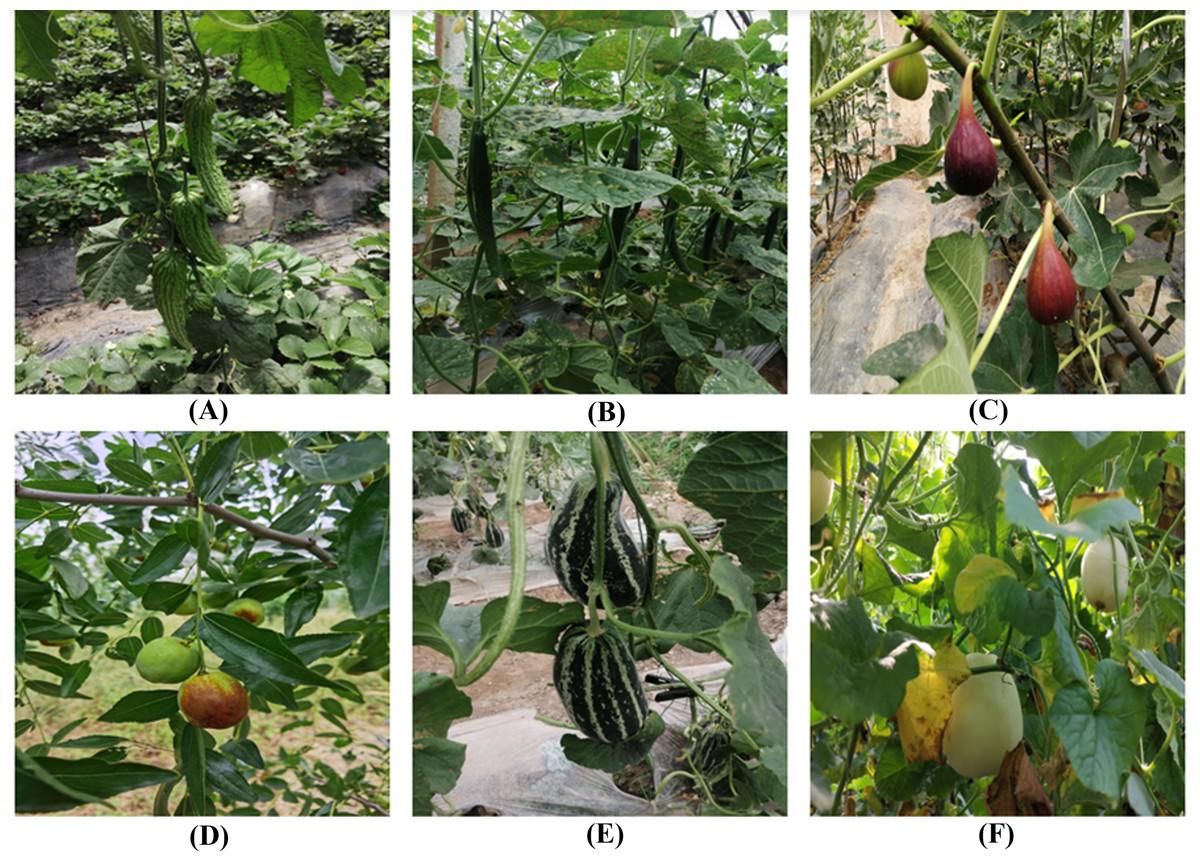
Figure 1: The image sample of (A) bitter-melon, (B) cucumber, (C) fig, (D) jujube, (E) melon-boyang, and (F) muskmelon.
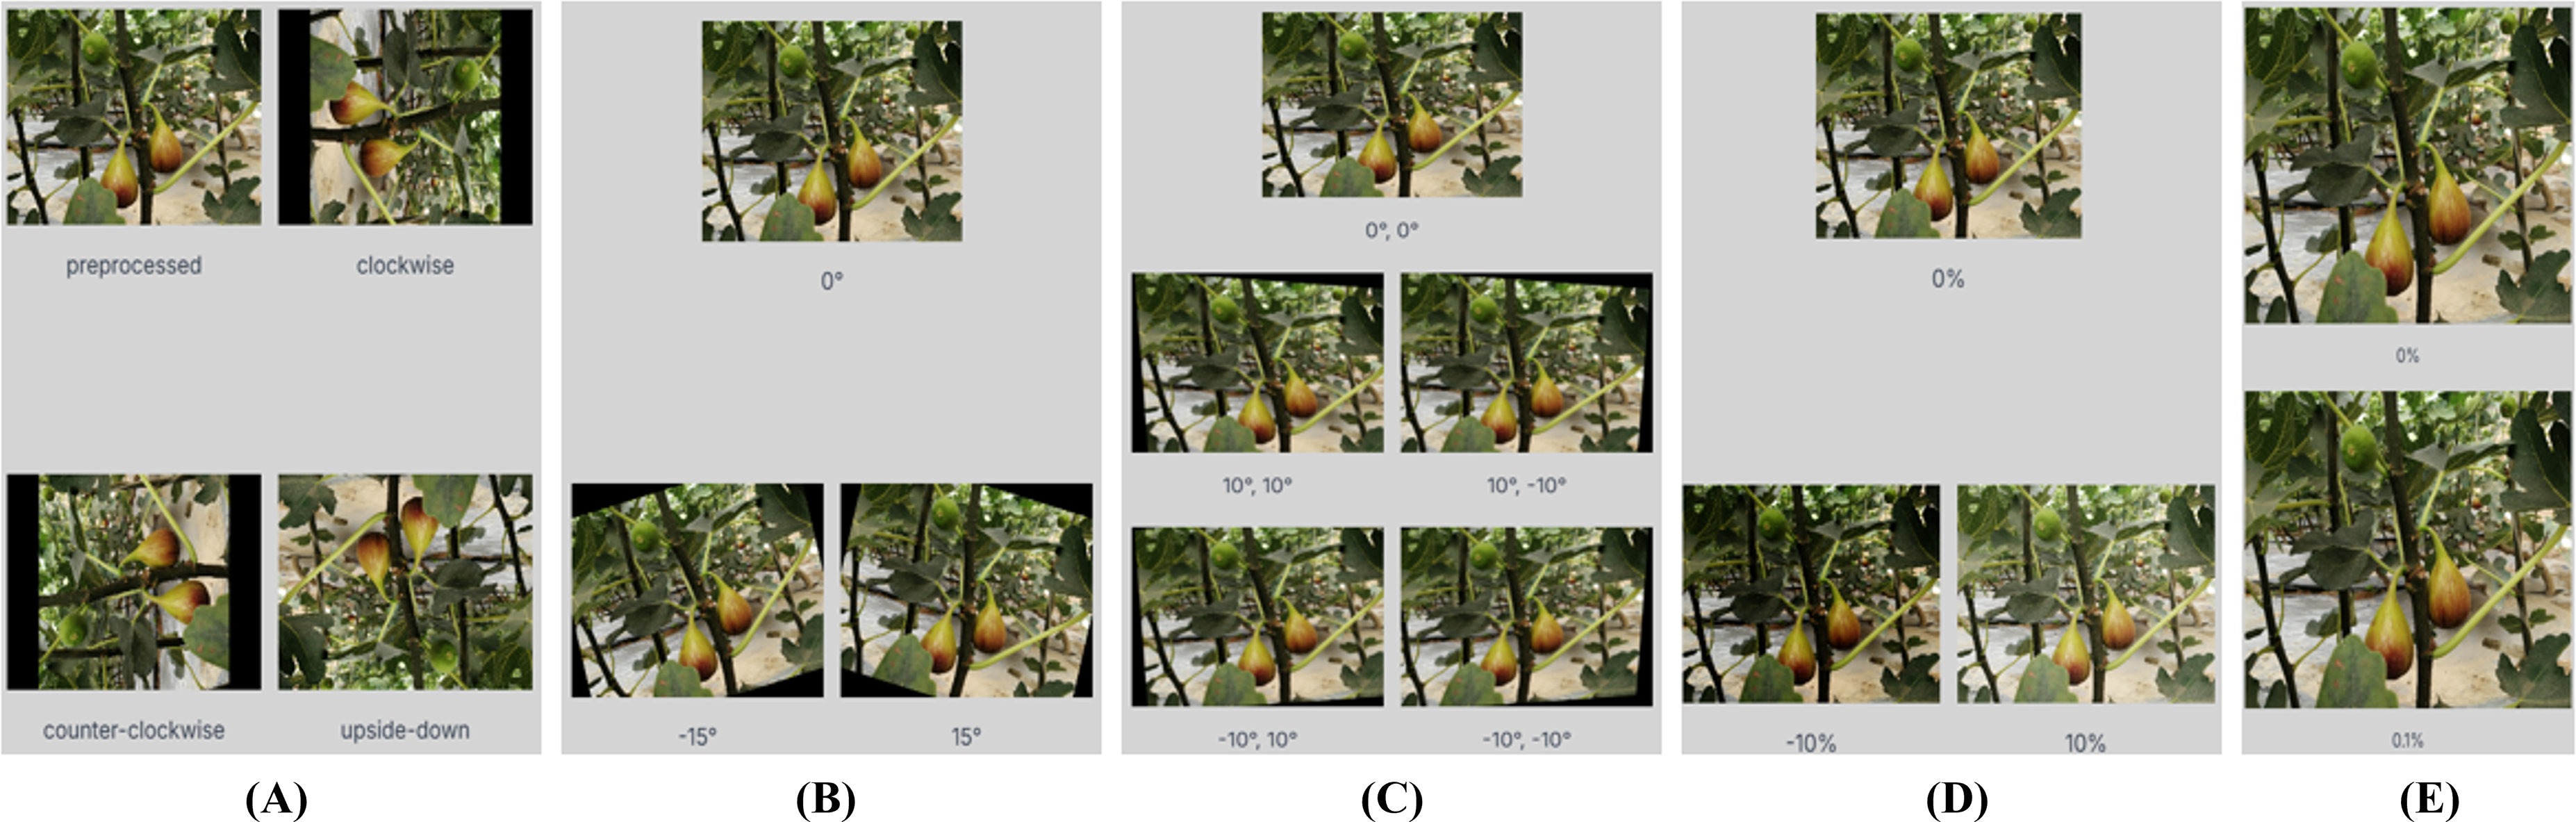
Using the Roboflow tool (Dwyer et al., 2024) for image pre-processing, the dataset was artificially expanded with diverse augmentation as shown in Fig. 2 to create three versions of each source image, allowing the YOLO networks to learn more robust features and generalize better to unseen data. The following augmentations are applied: (1) equal probability of one of the following 90-degree rotations: none, clockwise, counter-clockwise, or upside-down; (2) random rotation of between −15 and +15 degrees; (3) random shear of between −10° and +10° horizontally and −10° and +10° vertically; (4) random exposure adjustment of between −10 and +10 percent; (5) salt and pepper noise to 0.1 percent of pixels. The advantages of image augmentation are that it helps prevent overfitting, improve mAP, and adapt to different scenarios (Iceland & Kanan, 2023). The pre-processed dataset includes 1,512 images of bitter-melon, 1,520 images of cucumber, 994 images of fig, 5,044 images of jujube, 1,550 images of melon-boyang, and 926 images of muskmelon, having instances of 5,137, 6,426, 6,643, 22,985, 3,734, and 1,693, respectively. And randomly divided into 70% train, 20% valid, and 10% test sets as shown in Table 1. The network learns patterns, relationships, and features in the training set, while the valid set is used to evaluate the network’s performance during training, and the test set evaluates the network’s generalization ability for real-world scenarios.
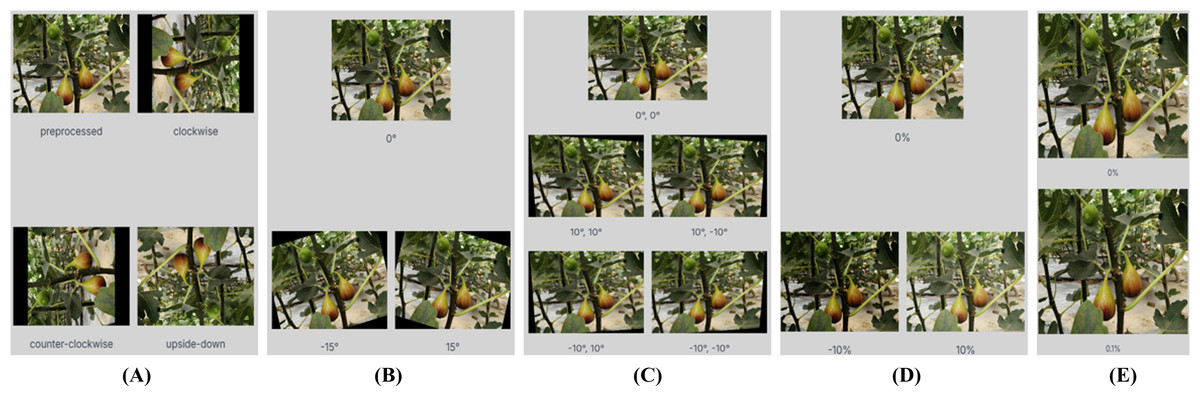
Figure 2: Augmented image sample of fig fruit at (A) 90° rotation, (B) rotation, (C) shear, (D) exposure, and (E) noise.
| Dataset | Images | Instances |
|---|---|---|
| Train | 10,134 | 41,338 |
| Valid | 947 | 3,806 |
| Test | 465 | 1,474 |
| Total | 11,546 | 46,618 |
Architecture of YOLOvFIS
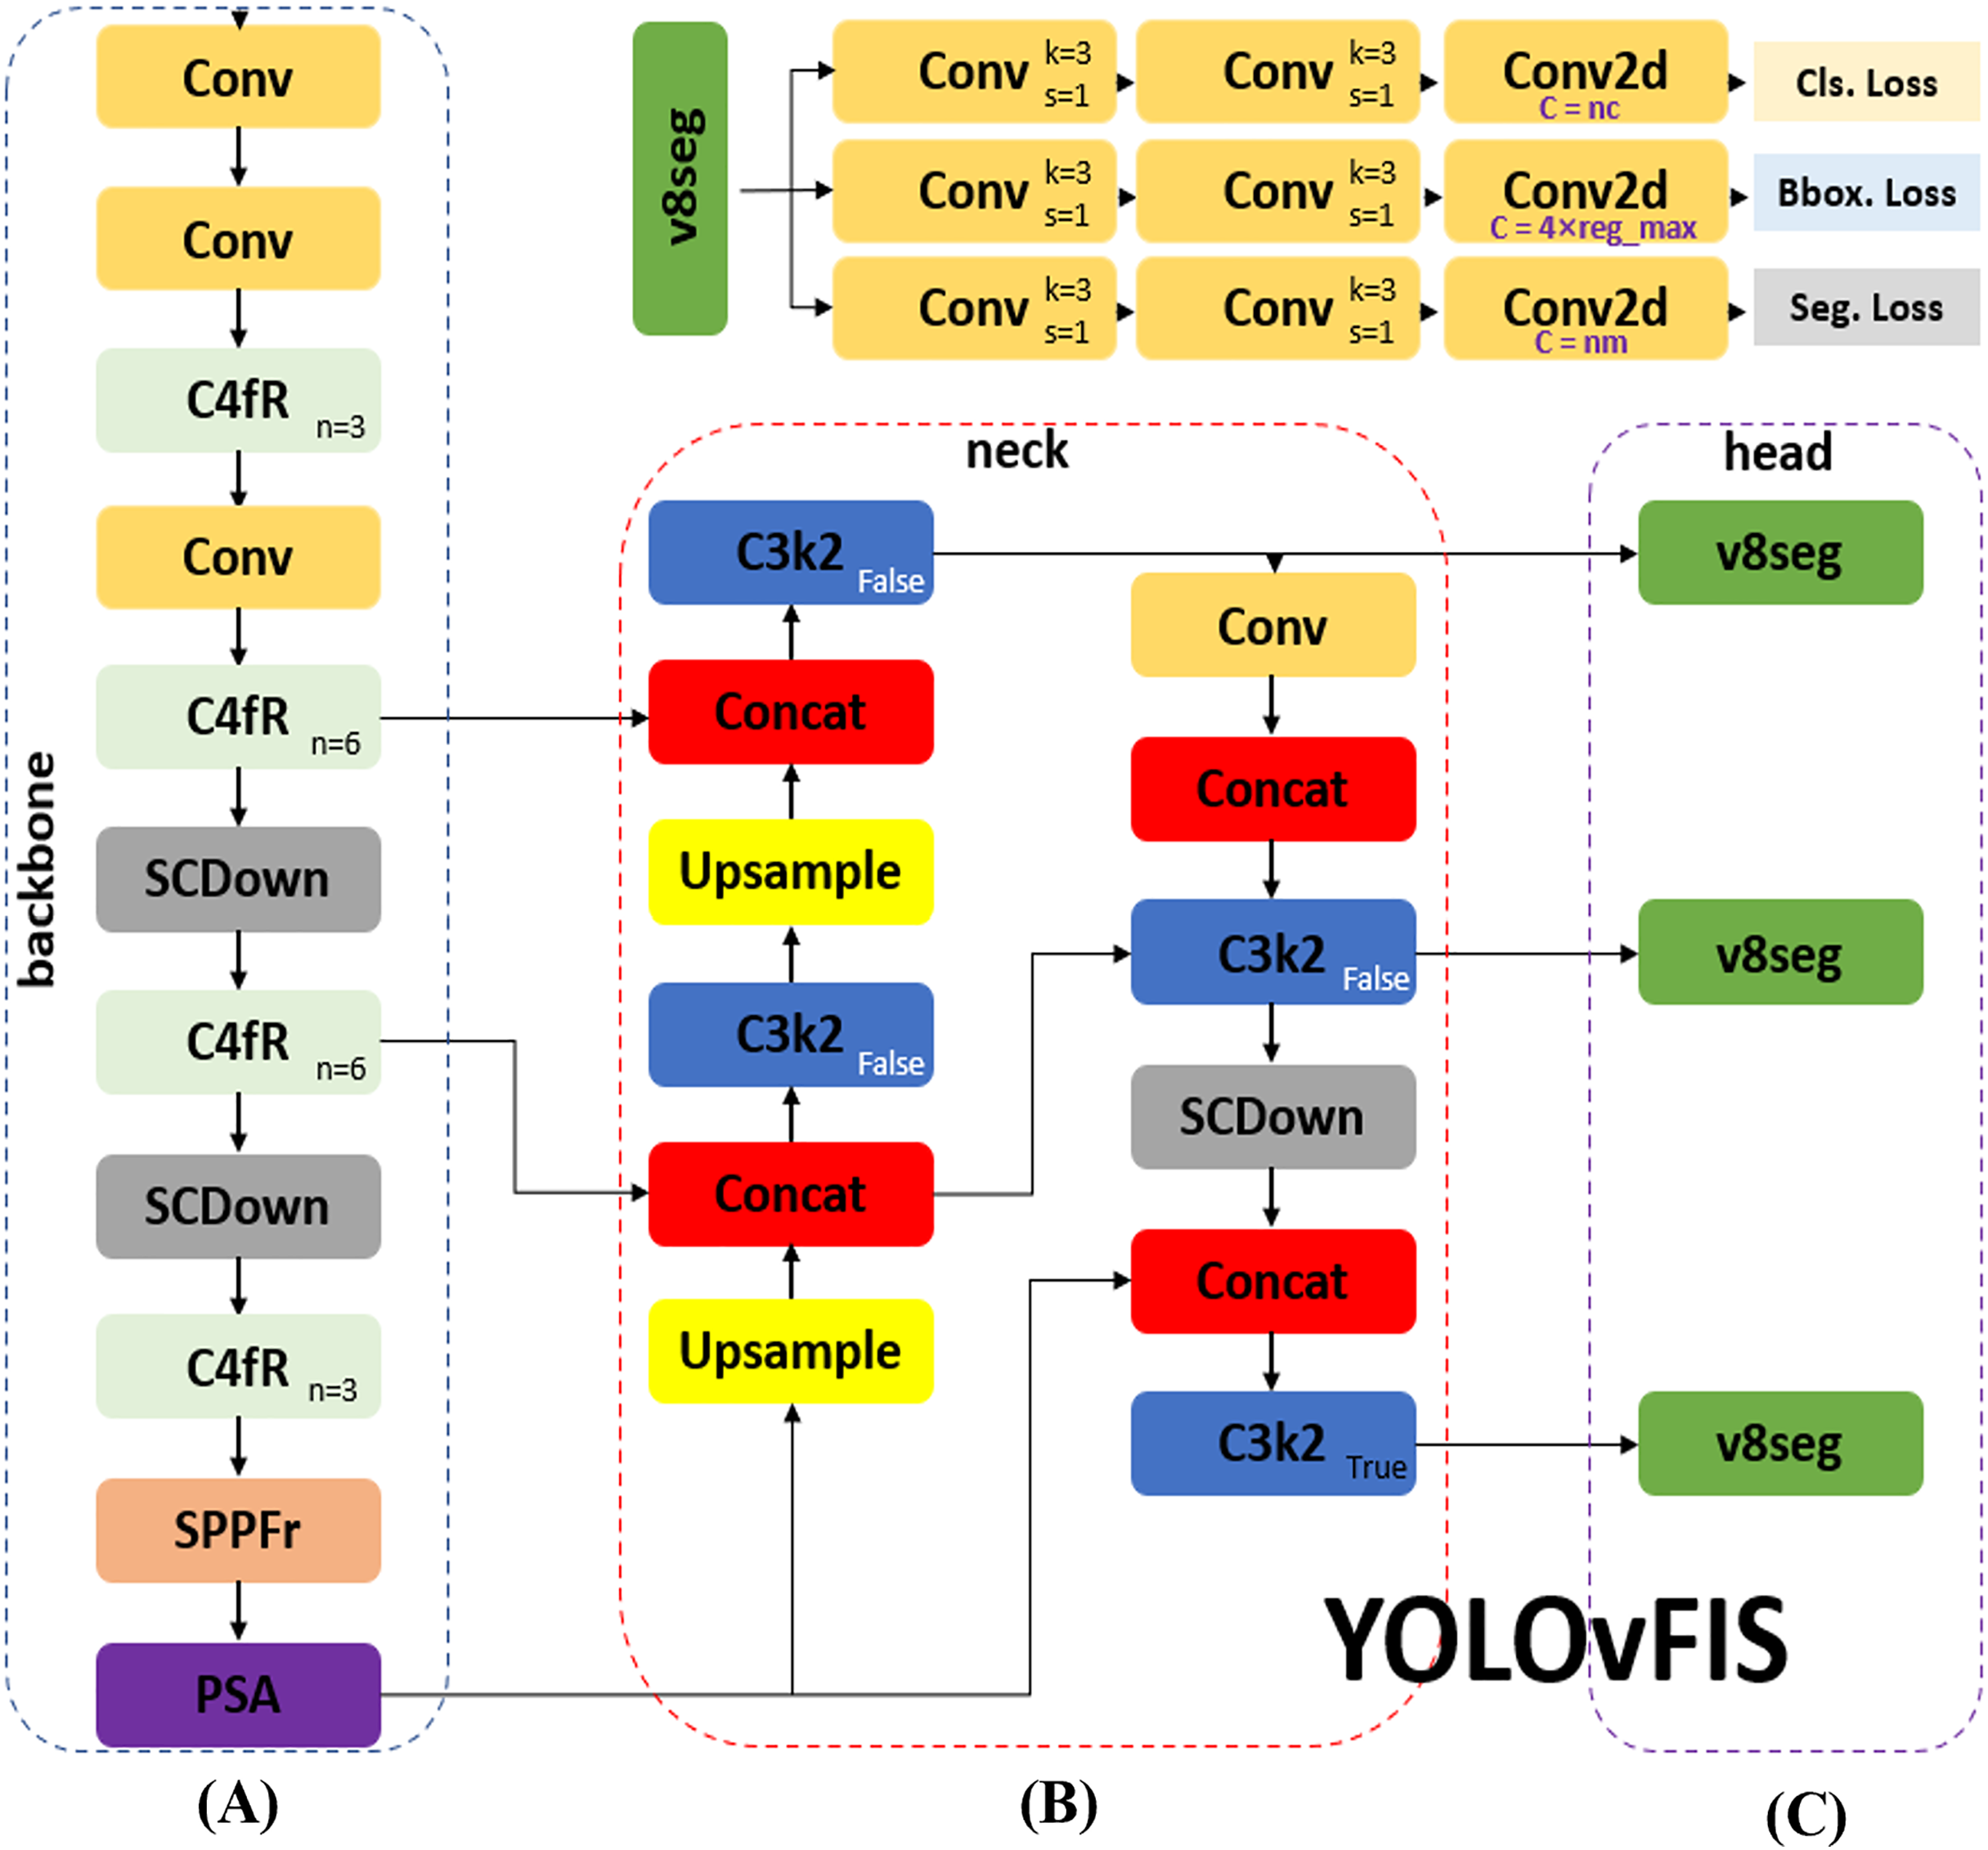
The architecture of YOLOvFIS, as shown in Fig. 3, which consists of an input, a backbone in Fig. 3A, a neck in Fig. 3B, and a head in Fig. 3C, draws inspiration from YOLOv8 (Ultralytics, 2023), YOLOv10 (Wang et al., 2023), and YOLOv11 (Khanam & Hussain, 2024), offering end-to-end training capabilities through its fully differentiable design. The input network integrates mosaic data augmentation and adaptive image scaling of 0.33 depth and 0.25 width. The backbone network is the primary feature extractor that utilizes the combination of Conv, C4fR, SCDown, SPPFr, and PSA modules to transform image data into multi-scale feature maps. The neck network serves as an intermediary processing stage by leveraging the added C3k2, Conv, and SCDown modules to aggregate and improve feature representations at various scales. It utilizes a path aggregation with feature pyramid network (PAFPN) structure that is similar to the neck network of YOLOv11 with an incorporated SCDown module. The head network acts as a prediction mechanism, generating the final outputs for target classification, localization, and segmentation based on the refined feature maps. YOLOvFIS employs the decoupled head structure of YOLOv8, which adopts an anchor-free approach. This decoupling allows YOLOvFIS to optimize each task independently. As depicted in Fig. 3, the v8seg. total loss is a weighted combination of multiple losses: binary cross-entropy (BCE) loss for classification (Cls. Loss), complete intersection-over-union (CIoU) loss with distribution focal loss (DFL) for bounding box (Bbox. Loss), and BCE with pixel-wise loss for segmentation (Seg. Loss). The loss ensures that each target instance receives an accurate pixel-level prediction, as well as integration with target detection and flexibility.
-
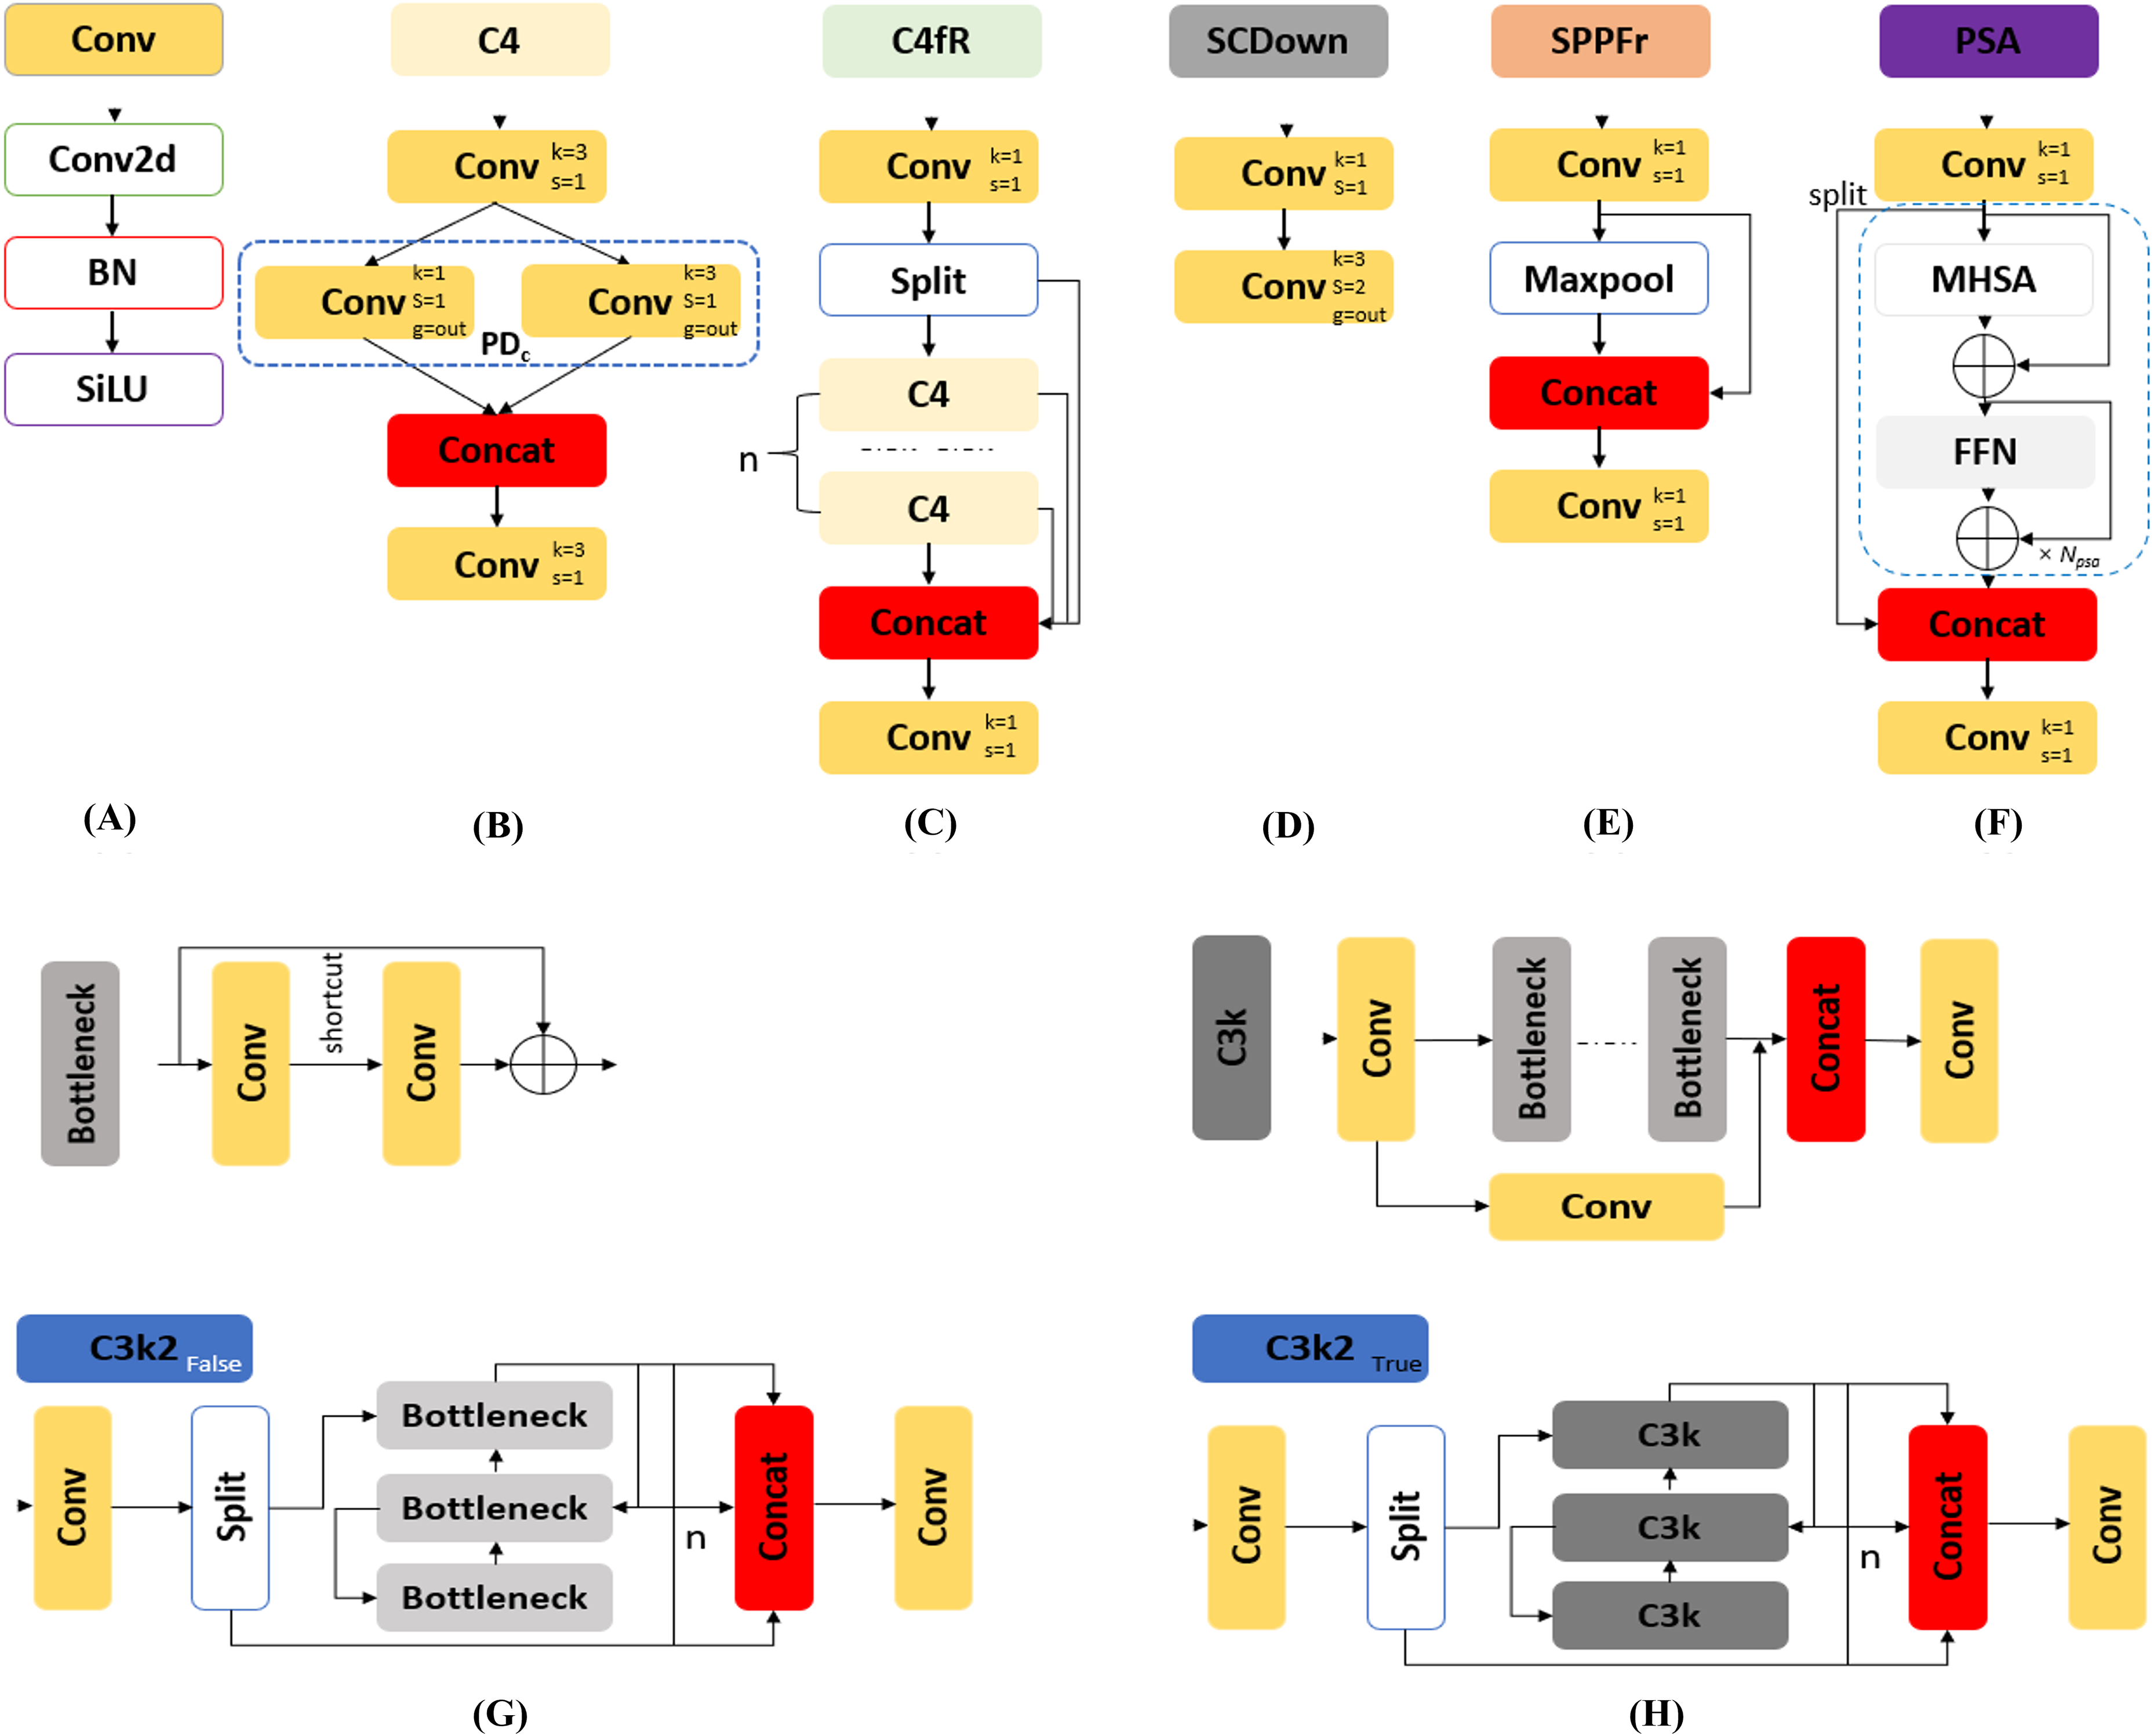
Conv: The Conv, as depicted in Fig. 4A, is the feature extraction process that utilized convolutional layers to downsample the image, reducing spatial dimensions while increasing the number of channels. It employs convolution (Conv2d) for extracting relevant features, batch normalization (BN) for stabilizing and normalizing the data flow, and the sigmoid linear unit (SiLU) activation function for non-linearity, which improves network performance.
C4fR: A significant improvement in YOLOvFIS is the introduction of the C4fR module in Fig. 4C, which replaces the C2f adopted by YOLOv8. The C4fR module is a more computationally efficient implementation of the C4 module in Fig. 4B that improves mAP and speed. It enables learning multi-scale features and extracting contextual information from images, especially beneficial for detecting and segmenting small targets. The C4 module consists of two standard convolution and concatenated Pointwise-Depthwise convolution (PDc) layers. This feature concatenation that enables YOLOvFIS’ capacity to learn more diverse features is defined by Eq. (1), (1) where P ∈ RH×W×C1 is for Pointwise, D ∈ RH×W×C2 is for Depthwise, C ∈ RH×W× (C1+C2) is the concatenated features of C1+C2 channels, height (H) and width (W) (Lawal, Zhu & Cheng, 2023). The number of channels changes produced by the Pointwise convolution concatenates the multi-scale spatial features extracted by Depthwise convolution to create new features (Dai et al., 2023), thus lowering the number of parameters needed to be practical for low-power computing devices.
SCDown: The SCDown module displayed in Fig. 4D is for downsampling with separable convolutions. The downsampling operation utilizes the combination of pointwise and depthwise convolutions, where the pointwise convolution reduces the number of channels and the Depthwise convolution performs the spatial downsampling. The module was incorporated because it reduces computational complexity and enables the capture of larger contextual information, thereby enhancing the YOLOvFIS’s robustness against occlusions or small targets.
SPPFr: The added SPPFr in YOLOvFIS, as indicated in Fig. 4E, was a build on SPPF designed by YOLOv5 (Ultralytics, 2020) and YOLOv8 (Ultralytics, 2023). It basically enhances the feature extraction process by pooling features from different spatial scales while keeping the computational cost manageable without sacrificing performance. SPPFr takes only one maxpooling as shown in Fig. 4E, unlike the three maxpooling utilized by SPPF. The purpose of the incorporated SPPFr is to foster faster inference times while improving overall robustness and multi-scale in fruit detection and instance segmentation tasks.
PSA: The last component of YOLOvFIS’s backbone network is the PSA module (Wang et al., 2023). The PSA, as shown in Fig. 4F, includes two concatenated and fused convolutions, and NPSA blocks that are comprised of a multi-head self-attention module (MHSA) and a feed-forward network (FFN). The PSA was added because it enhances spatial attention in the feature maps by allowing the backbone of YOLOvFIS to focus more effectively on important regions within the image for the purpose of improved mAP, faster processing, and better generalization.
C3k2: The C3k2False of Fig. 4G and C3k2True of Fig. 4H as introduced by YOLOv11 (Khanam & Hussain, 2024) are differentiated by bottleneck and C3k modules, respectively. It is intended to be faster and more efficient, therefore improving the overall performance of the feature aggregation process. The neck network of YOLOvFIS incorporated the C3k2 module after upsampling and concatenation for computational efficiency, enhancing feature extraction and speed performance.
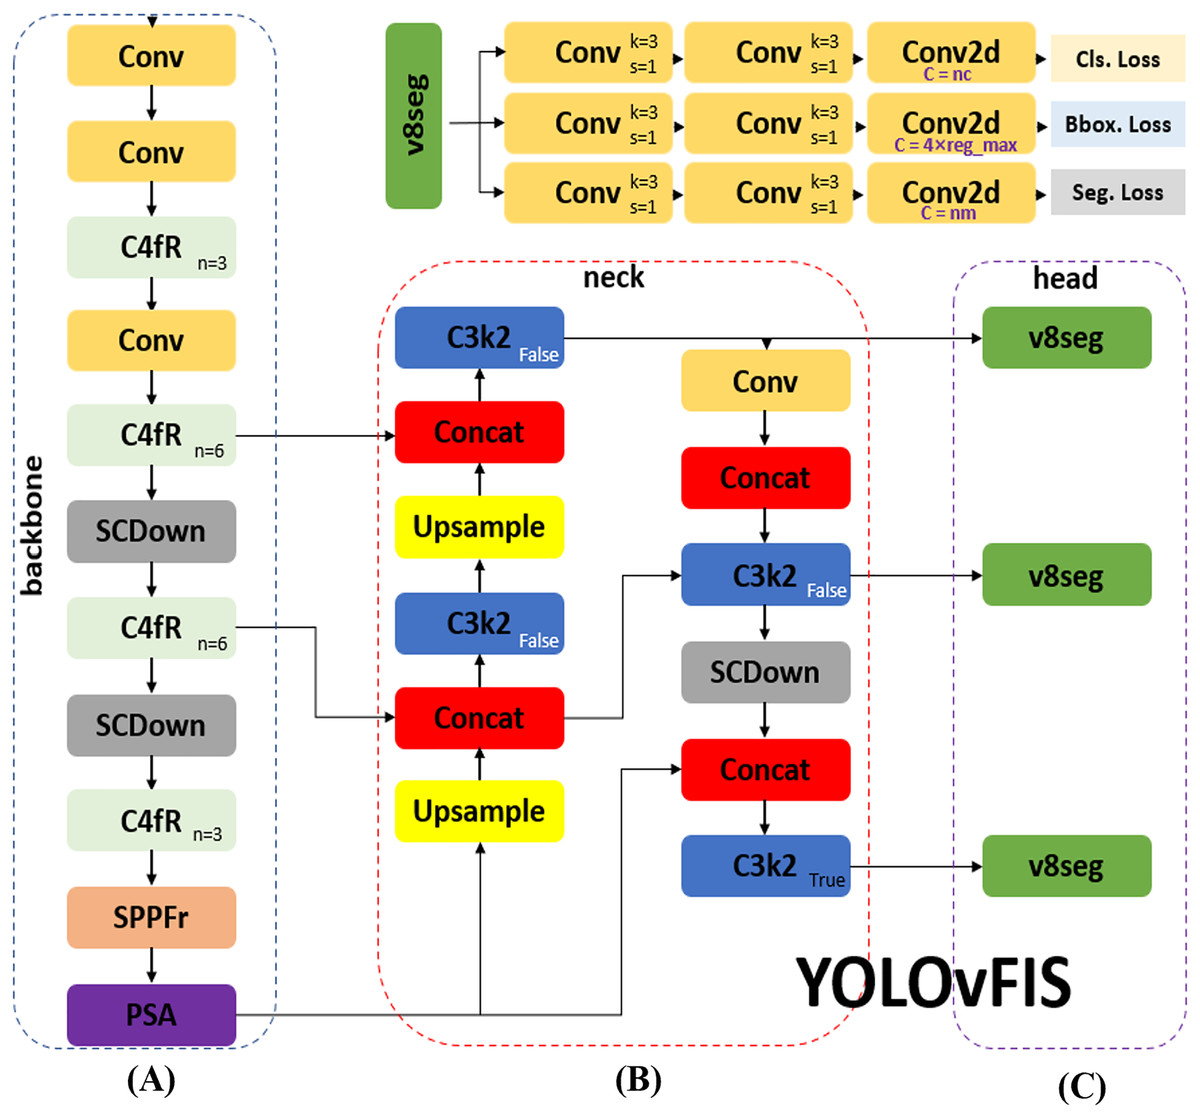
Figure 3: The YOLOvFIS includes (A) backbone, (B) neck, and (C) head network.
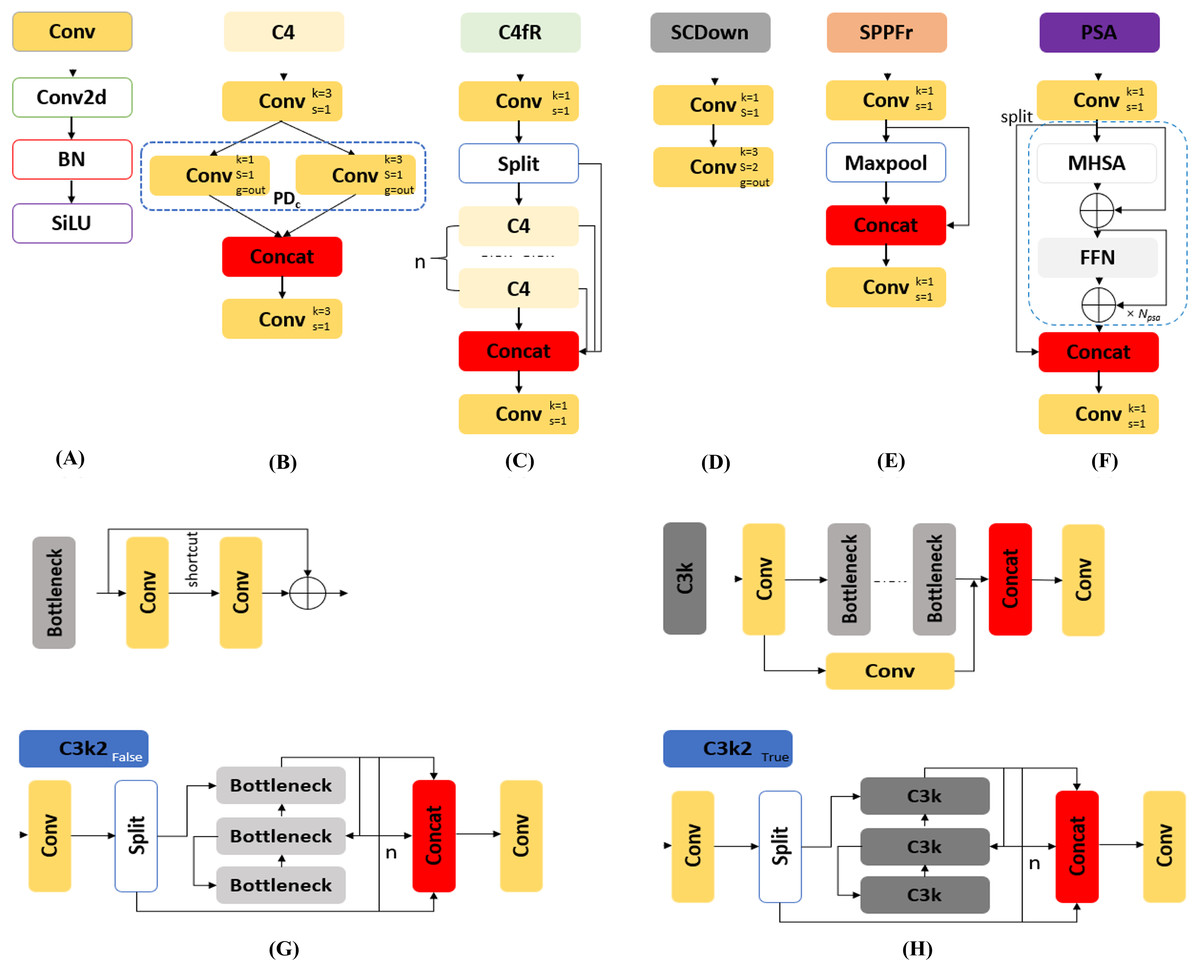
Figure 4: The lists of modules that make up the network of YOLOvFIS (A) Conv, (B) C4, (C) C4fR, (D) SCDown, (E) SPPFr, (F) PSA, (G) C3k2False, and (H) C3k2True.
Experiment details
The experiment involving YOLOvFIS and the comparison of networks such as YOLOv5n (Ultralytics, 2020), YOLOv6n (Li et al., 2022), YOLOv7t (Wang, Bochkovskiy & Liao, 2023a), YOLOv8n (Ultralytics, 2023), YOLOv9t (Wang, Bochkovskiy & Liao, 2023b), YOLOv10n (Wang et al., 2023), and YOLOv11n (Khanam & Hussain, 2024) was conducted using the Ultralytics 8.3.39 platform, with the hardware and environment detailed in Table 2. The networks, whose weight was randomly initialized from scratch, received an input image of 640 × 640 × 3 pixels, 32 batch, 0.937 momentum, 0.0005 weight decay, 1.0 mosaic, 7.5 Bbloss, 0.5 Clsloss, 1.5 DFloss, 4 mask-ratio, 200 epochs, and other default values. The combined module that makes up the backbone network of YOLOvFIS in Fig. 3A was used to replace the backbone of YOLOv5n, YOLOv6n, YOLOv7t, YOLOv8n, YOLOv9t, YOLOv10n, and YOLOv11n, which are set for improved networks and compared to original networks. Table 3 provides experimental details. The purpose of this is to investigate the effectiveness of YOLOvFIS’s backbone network in application to other YOLO-based networks for fruit detection and instance segmentation.
| Hardware | Configure | Environment | Version |
|---|---|---|---|
| System | Ubuntu20.04 | Python | 3.8.16 |
| CPU | Intel(R) Xeon(R) E-2276M | Conda | 23.1.0 |
| GPU | Quadro RTX 5000 (16G) | PyTorch | 1.12.1 |
| RAM | 64G | CUDA | 11.3.1 |
| Hard-disk | 1.0T | CUDNN | 8.8.0 |
| Networks | Backbone | Neck | Head |
|---|---|---|---|
| Original (YOLOv5n to YOLOv11n) | Original | Original | YOLOv8 |
| Improved (YOLOv5n to YOLOv11n) | YOLOvFIS | Original | YOLOv8 |
| YOLOvFIS | YOLOvFIS | YOLOvFIS | YOLOv8 |
Evaluation metrics
The networks were evaluated using the metrics stated in Eqs. (2)–(8), respectively, for precision (P), recall (R), average precision (AP), mAP, number of parameters (params), giga floating point operations per second (GFLOPs), and detection time. TP is the true positive for correct detections, FN is the false negative for missed detections, FP is the false positive for incorrect detections, P(R) means that P is a function of R, AP is the area under the curve (AUC) for a single class, mAP is the mean AP value over multiple classes, C is the total number of classes, j is the serial number, i is the input size, k is the convolution kernel size, o is the output size, and H × W is the size of the outputted feature map. Params (106) is the number of trainable parameters, GFLOPs estimate the number of floating-point arithmetic operations, and detection time is used to measure the total real-time in milliseconds (ms).
(2)
(3)
(4)
(5)
(6)
(7)
(8)
Results and discussion
Backbone of YOLOvFIS incorporation
An examination of the findings reported in figures and tables revealed that incorporating the backbone of YOLOvFIS into YOLOv5n, YOLOv6n, YOLOv7t, YOLOv8n, YOLOv9t, YOLOv10n, and YOLOv11n networks is exceptional for fruit detection and segmentation. The validation loss for both box and segmentation typically reflects the mAP performance observed in both the original and improved networks. A decreasing loss constitutes an increasing mAP, confirming that when the network learns, performance improves. The mAP in Eq. (5) was chosen for this purpose instead of P in Eq. (2) and R in Eq. (3) because it provides more comprehensive values across multiple classes. Nevertheless, it was noted that the losses for the box are lower than the segmentation. This is due to the fact that box loss involves rectangle targets with less complexity compared to segmentation loss, which addresses pixel-wise masks.
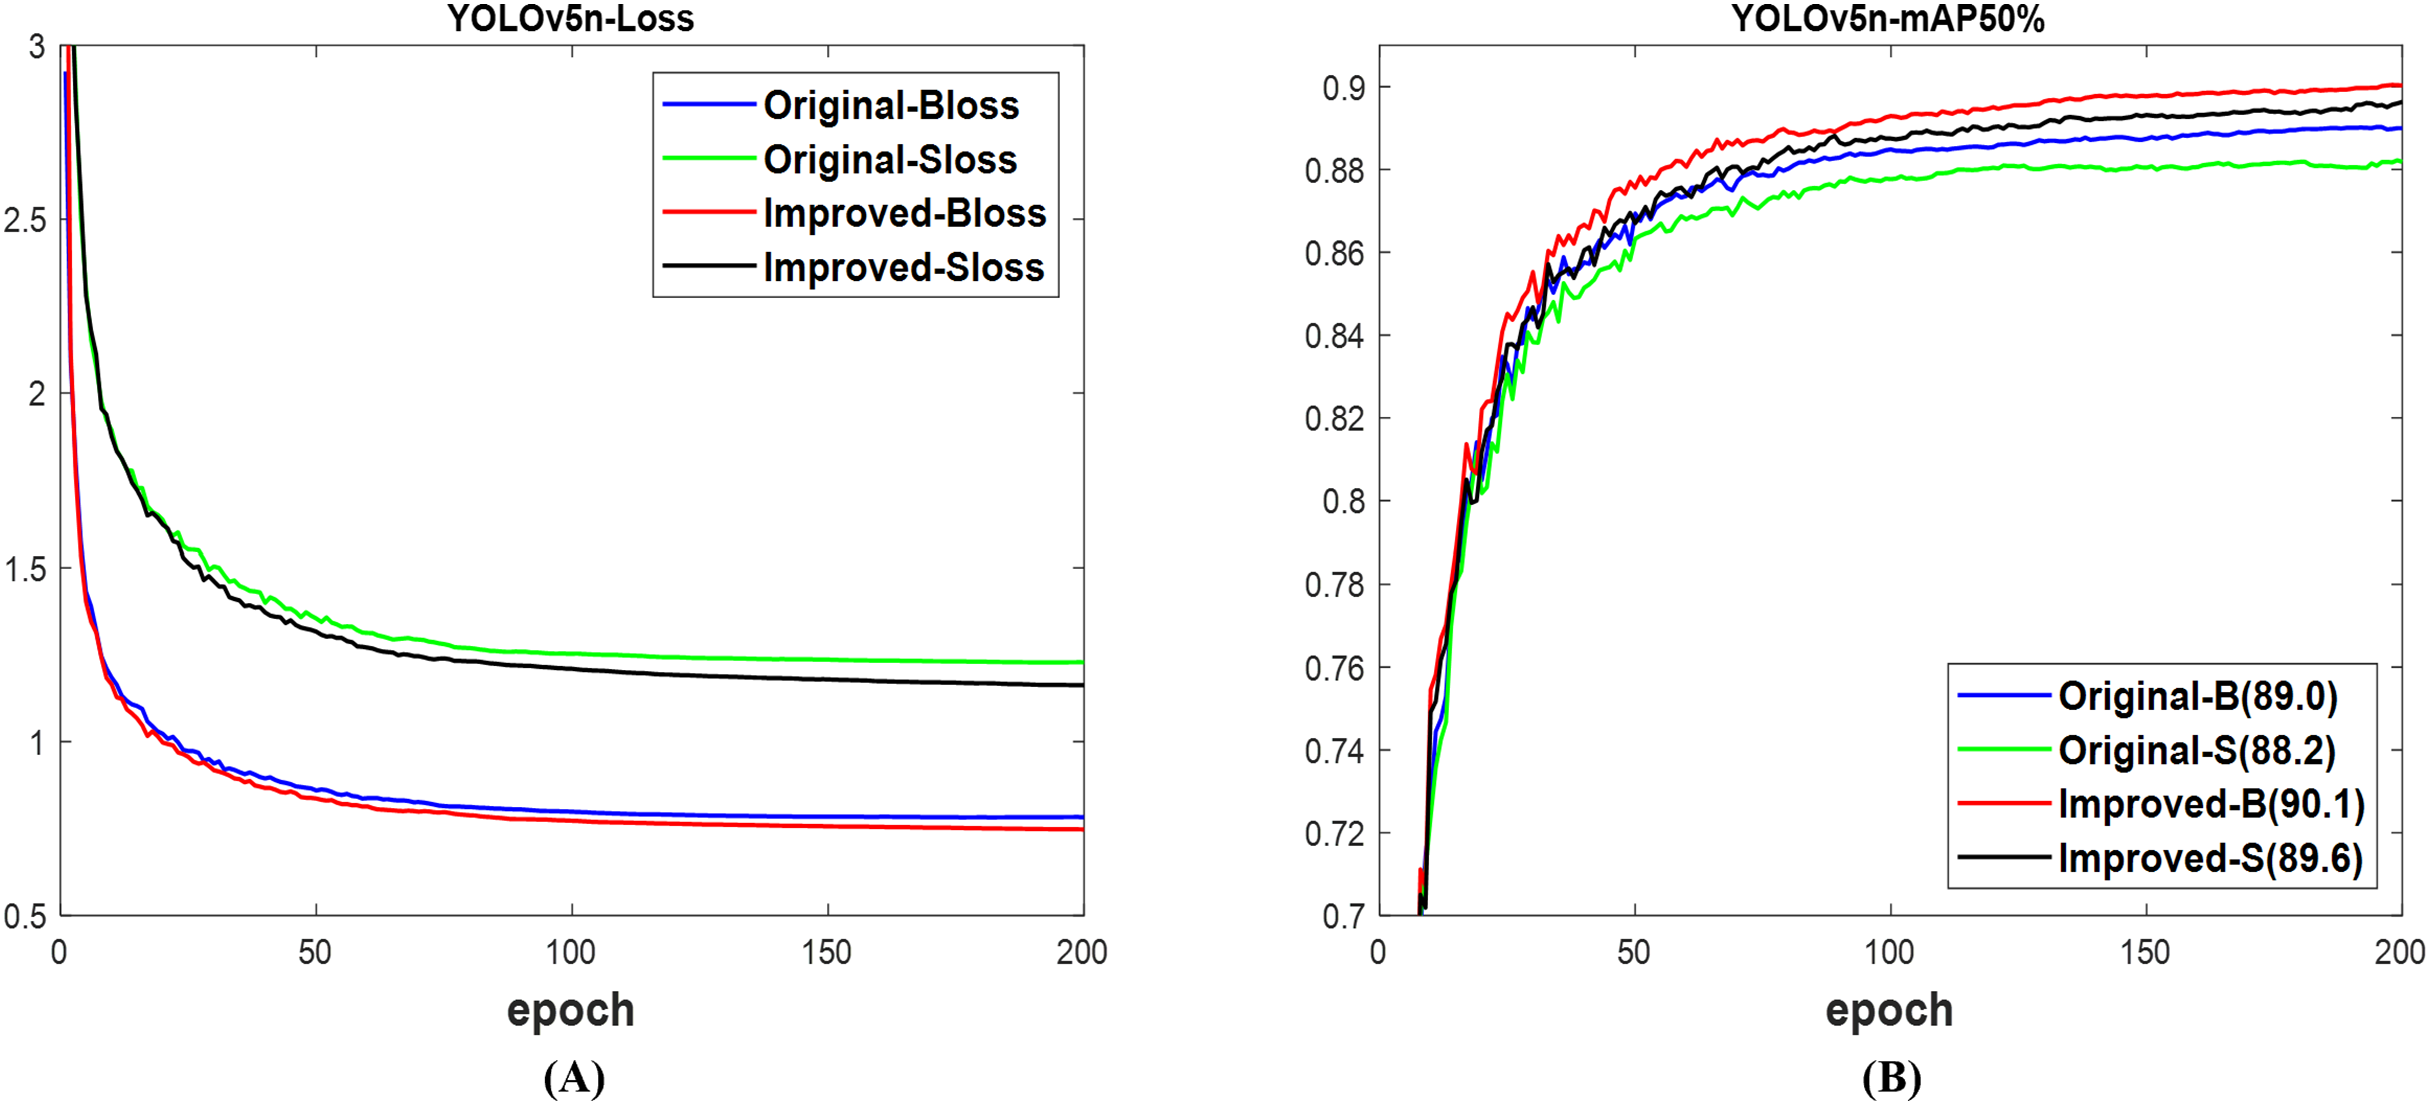
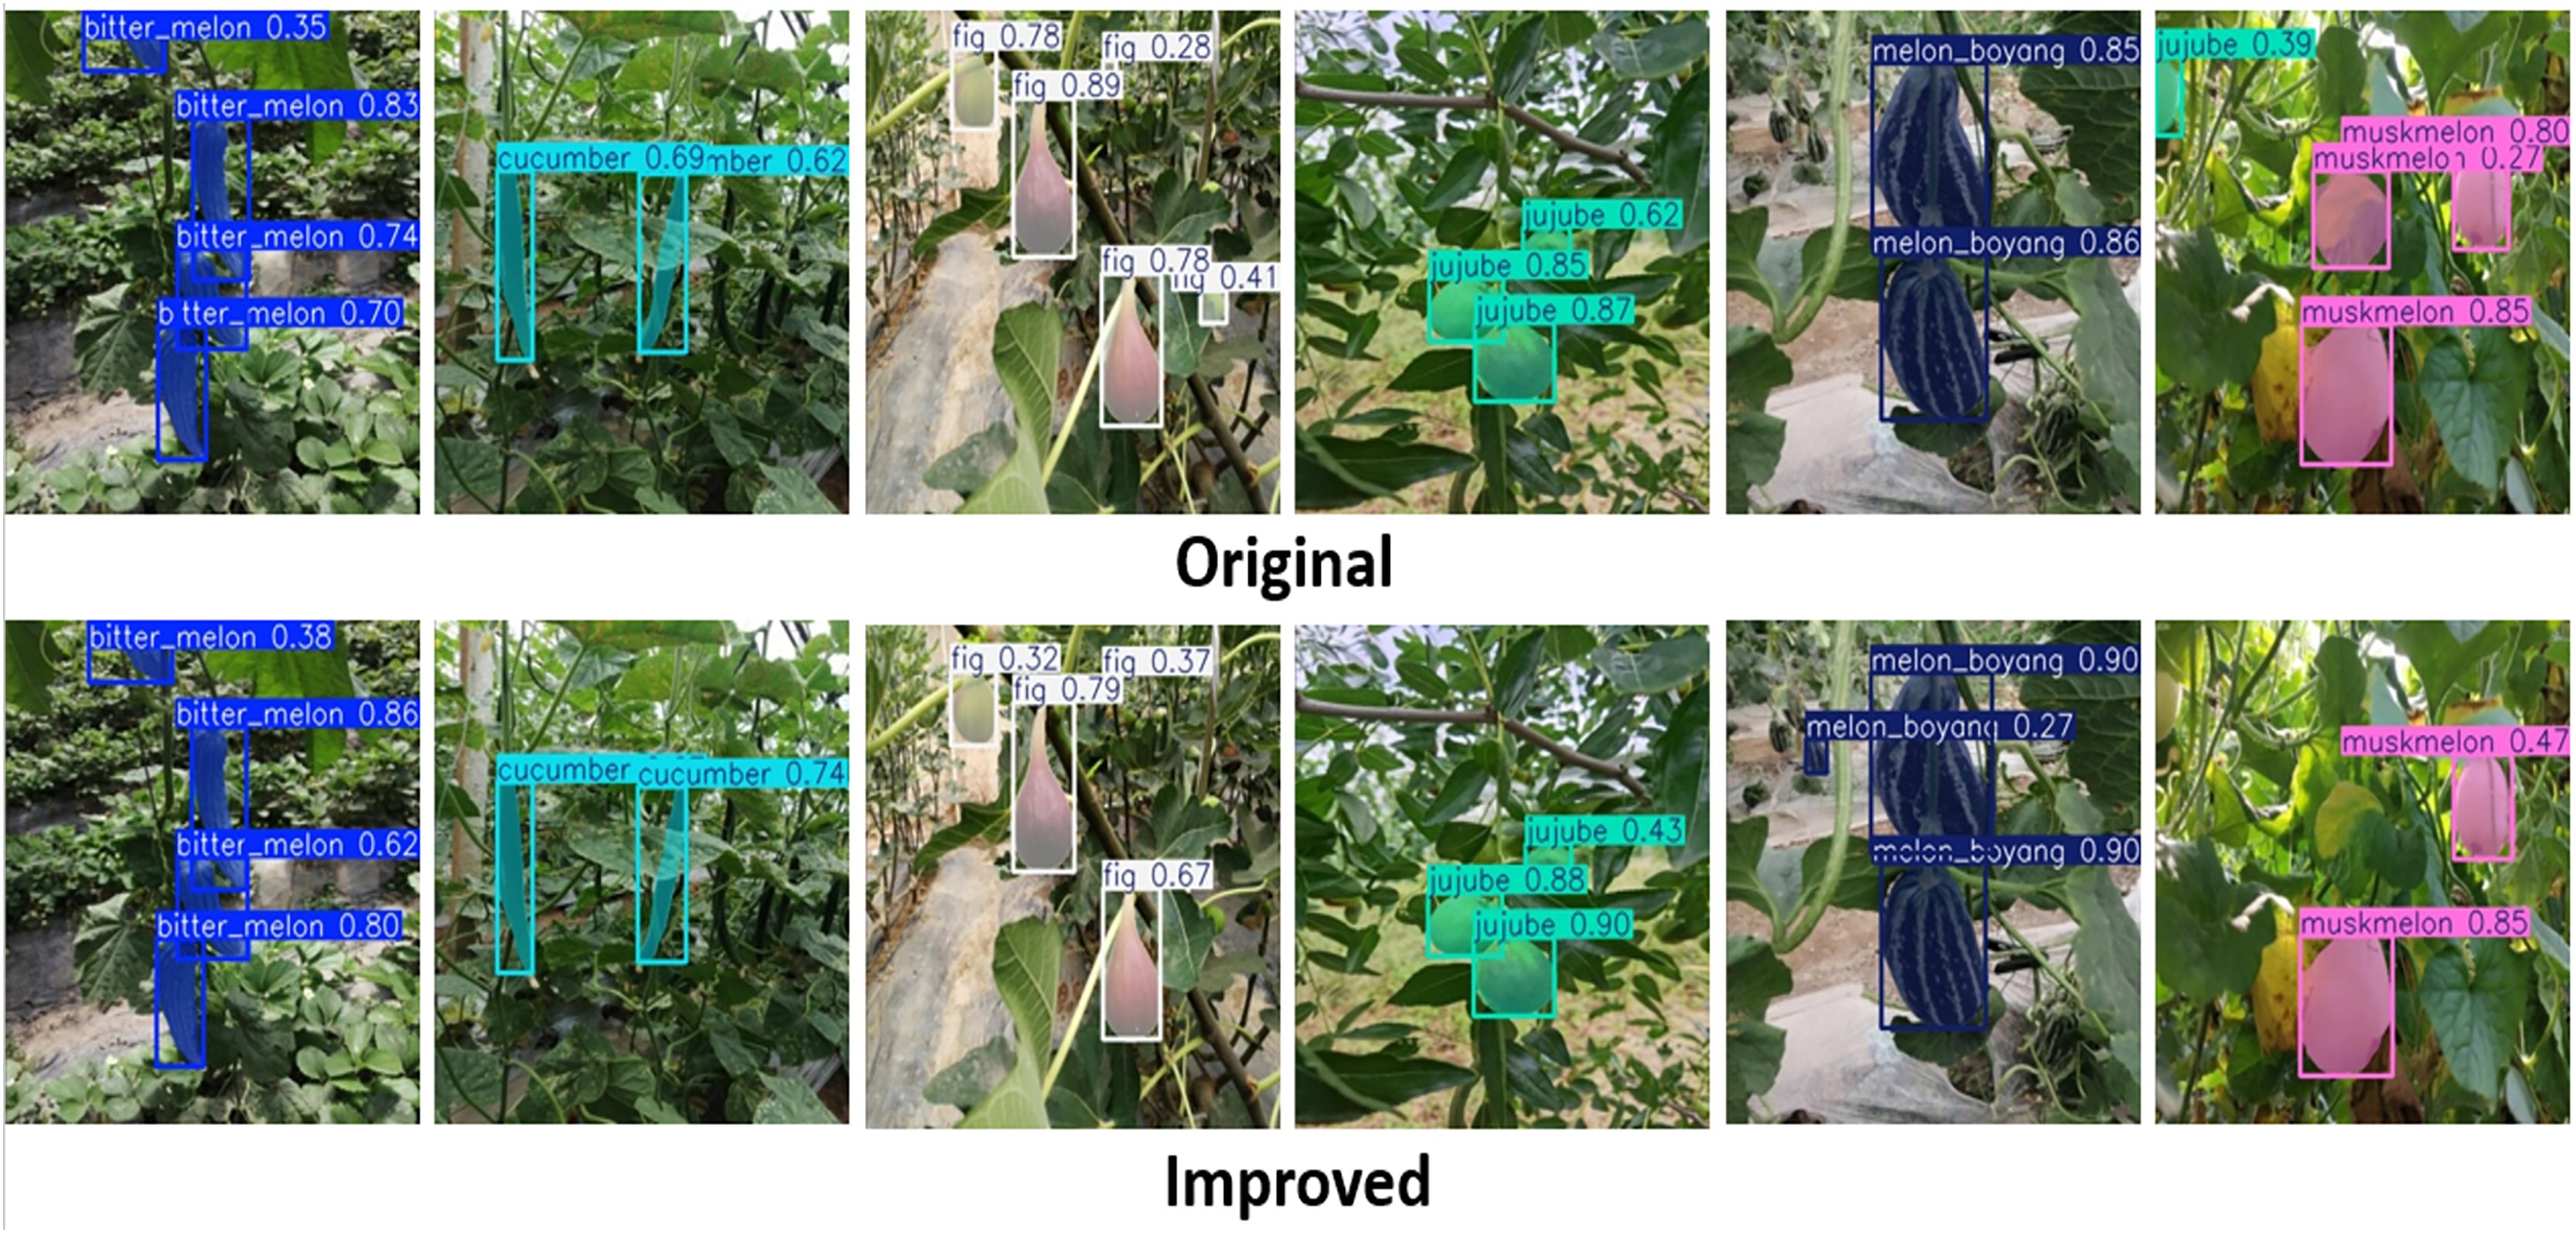
According to Fig. 5A, the validation loss for the box and segmentation of the improved network is lower than the original network of YOLOv5n (Ultralytics, 2020). These losses resulted in the mAP displayed in Fig. 5B, where the 90.1% for the box and 89.6% for the segment of the improved network are, respectively, greater than the 89.0% for the box and 88.2% for the segment of the original network. Utilizing the test set of the dataset for assessment, Fig. 6 illustrates that both networks successfully detected and segmented the quantities of fruit targets in the presented images; nevertheless, the confidence scores of the improved network surpass those of the original YOLOv5n network. The original network experienced missed and incorrect detection, unlike the improved network with only missed detection. The obtained results in Table 4 using the test set indicate that the computing costs, measured in params and GFLOPs, of the original and improved YOLOv5n networks exhibit no substantial difference. However, the improved network achieves 90.2% mAP box and 89.6% mAP segment, surpassing the original network’s 88.4% mAP box and 87.9% mAP segment, respectively. Similarly, the total detection time of the improved network is reduced in comparison to the original network. The improved network demonstrates superior mAP and speed compared to the original YOLOv5n network for fruit detection and instance segmentation.
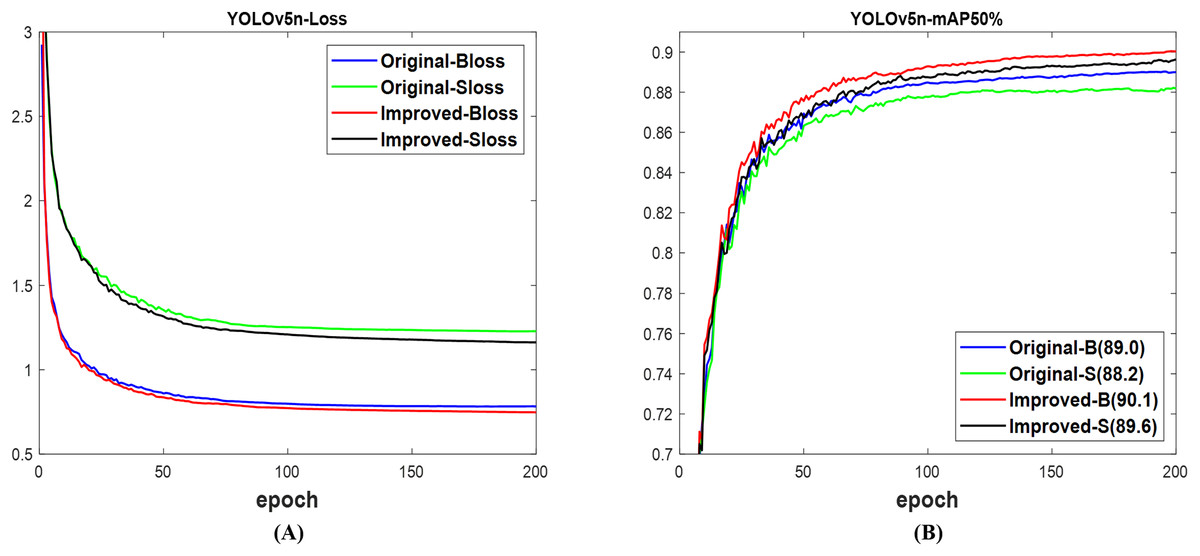
Figure 5: The results of original and improved networks of YOLOv5n using the valid set (A) valid loss and (B) mAP50%.
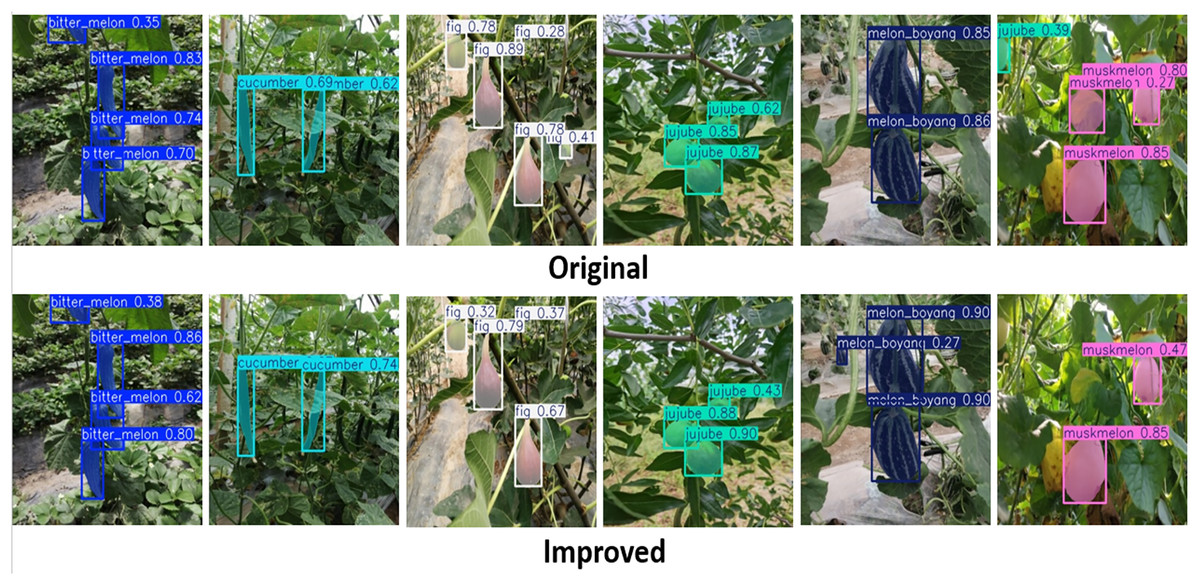
Figure 6: The detected fruit targets differentiate between the original and improved networks of YOLOv5n.
| YOLOv5n (test) |
Computation | Box@50% | Segment@50% | Time (ms) | ||||||||
|---|---|---|---|---|---|---|---|---|---|---|---|---|
| Params | GFLOPs | P | R | mAP | P | R | mAP | Tpre | Tinfer | Tpost | Total | |
| Original | 2.8 | 11.0 | 87.5 | 81.3 | 88.4 | 87.0 | 81.8 | 87.9 | 0.4 | 3.1 | 1.2 | 4.7 |
| Improved | 2.8 | 11.1 | 90.9 | 80.3 | 90.2 | 91.2 | 80.3 | 89.6 | 0.3 | 3.0 | 1.1 | 4.4 |
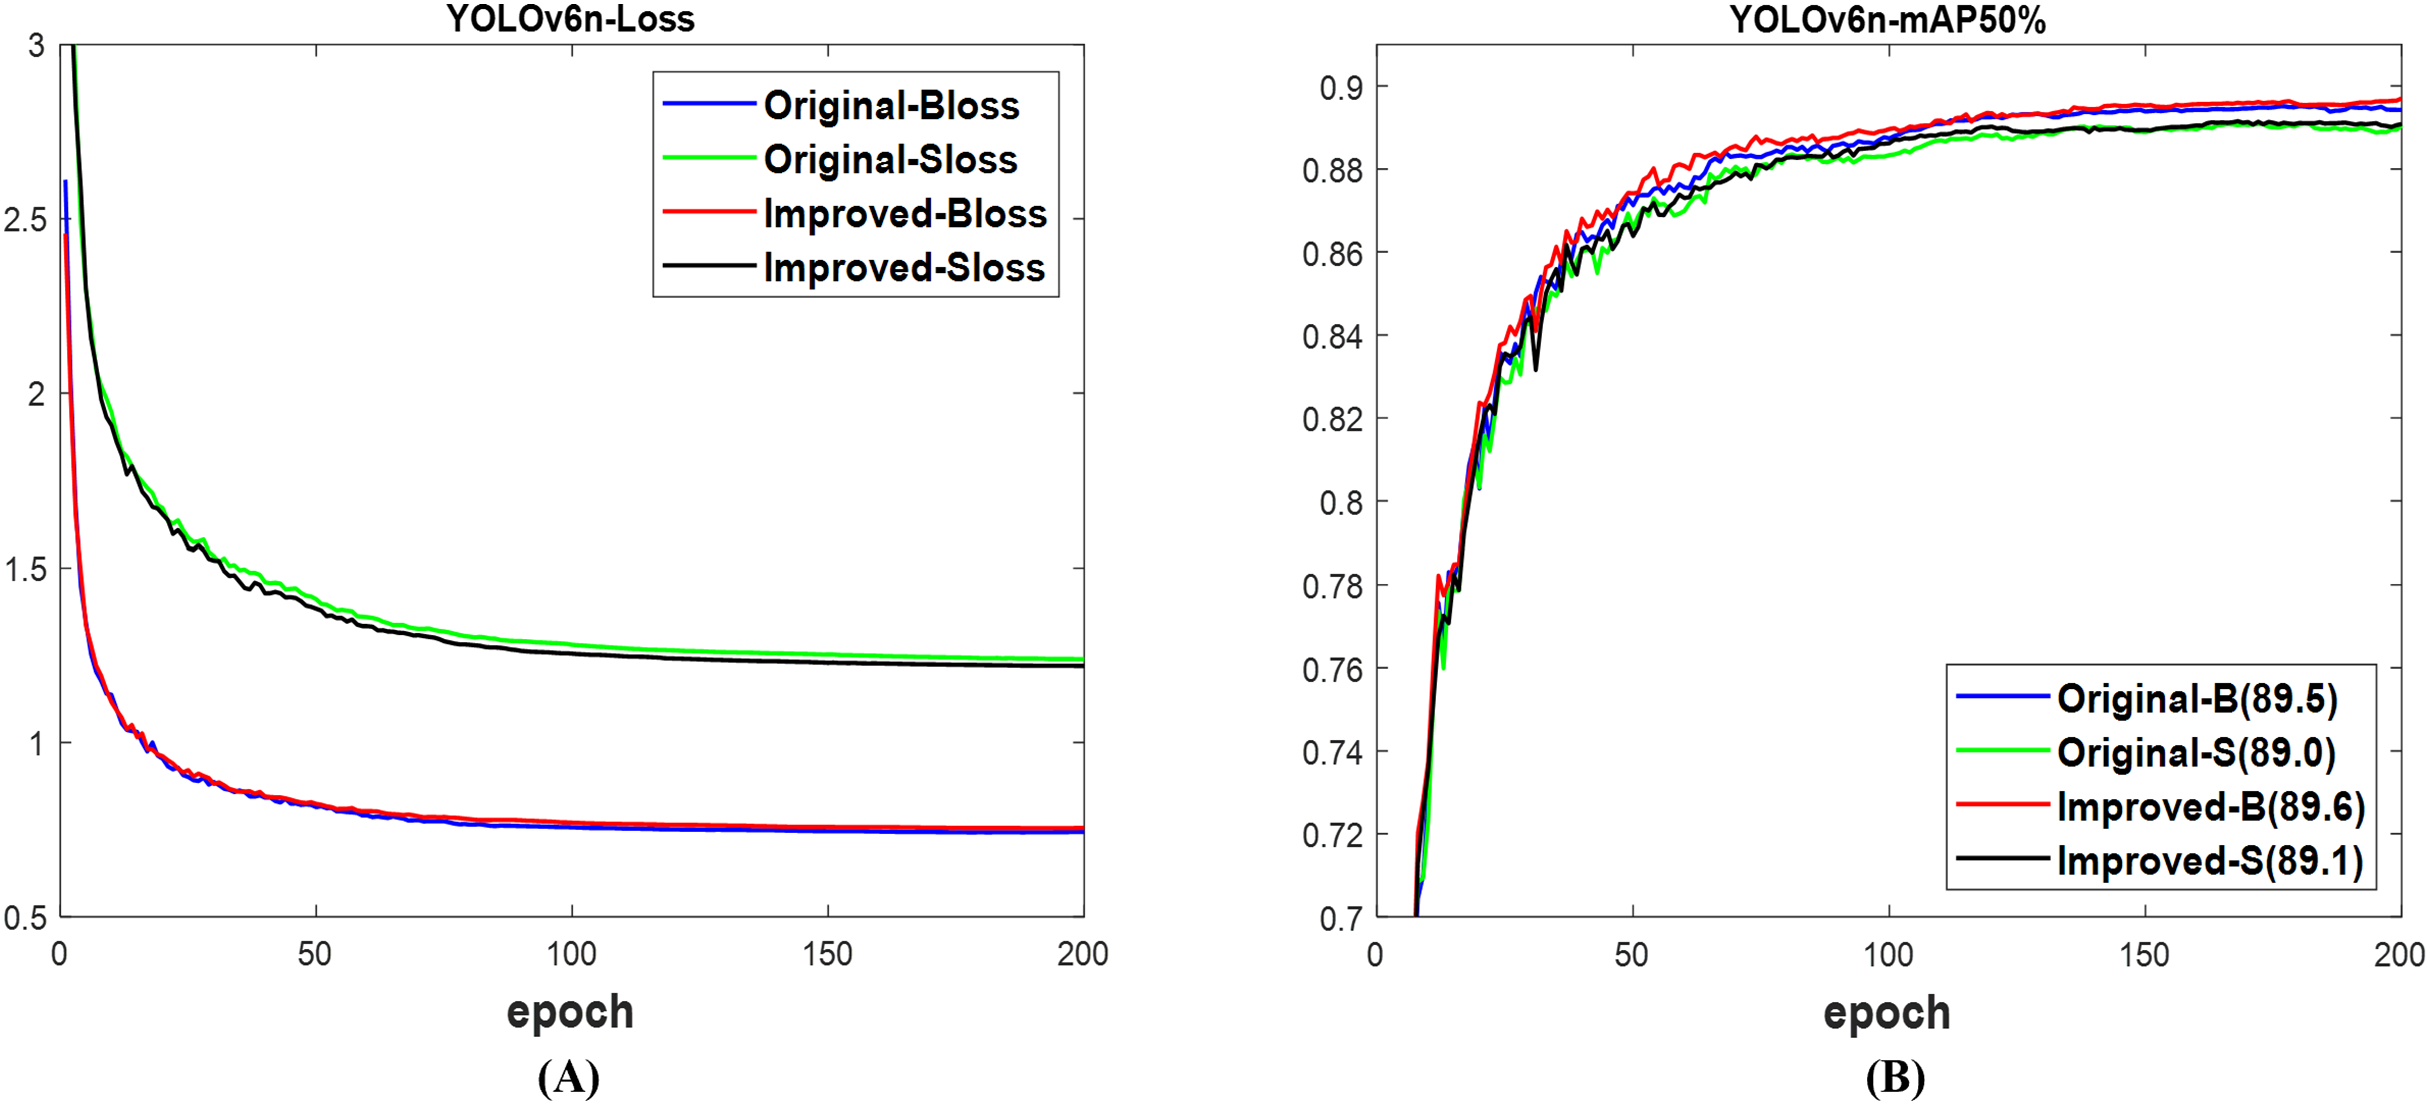
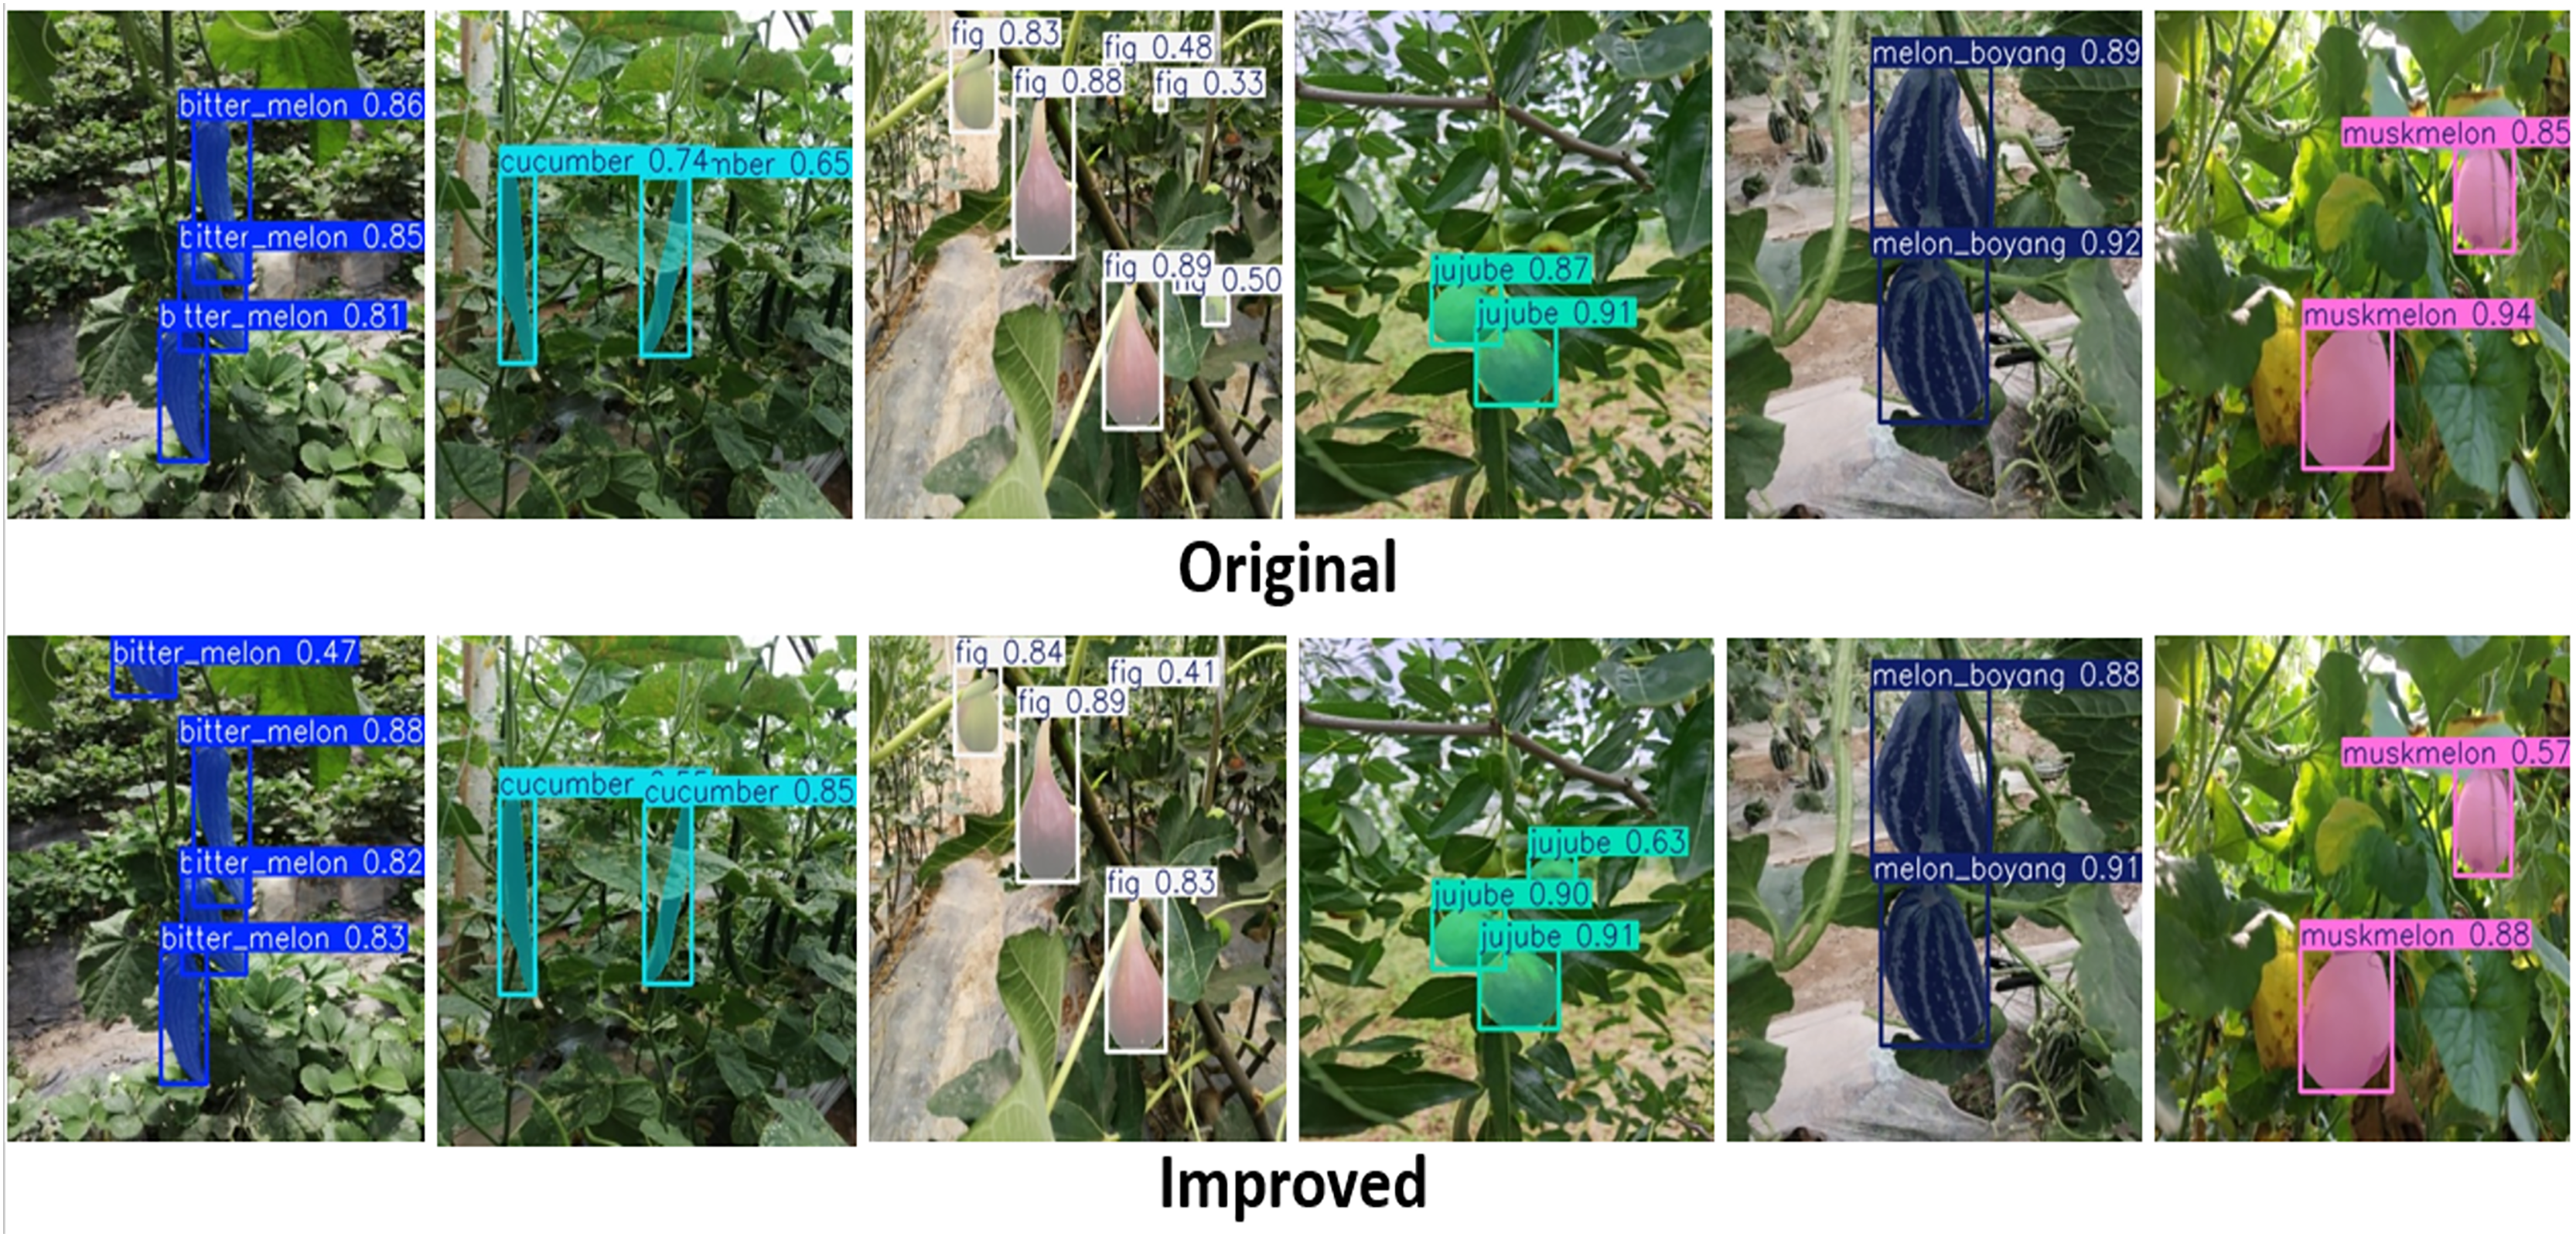
In the case of YOLOv6n (Li et al., 2022), as indicated in Fig. 7A, the validation loss for the box of the improved and original networks shows no significant difference, but the loss for the segmentation of the improved network is lower than the original network. Using Fig. 7B, the resulting mAP of 89.6% for the box and 89.1% for the segment of the improved network are, respectively, higher than the 89.5% for the box and 89.0% for the segment of the original network. The networks’ ability to detect and segment a number of fruit targets in the presented images is demonstrated in Fig. 8, while the improved YOLOv6n network’s confidence scores are higher than those of the original. In contrast to the improved network, the original network was linked to both missed and incorrect detection at the time. Table 5 shows that the computation cost in terms of params and GFLOPs of the improved network is lower than that of the original network. The improved network achieves 89.4% mAP box and 88.8% mAP segment, surpassing the original network’s 89.0% mAP box and 88.4% mAP segment, respectively. However, the total detection time of the improved network is slightly more than the original network. This indicated that the improved network outperformed the original network of YOLOv6n, but not for detection speed.
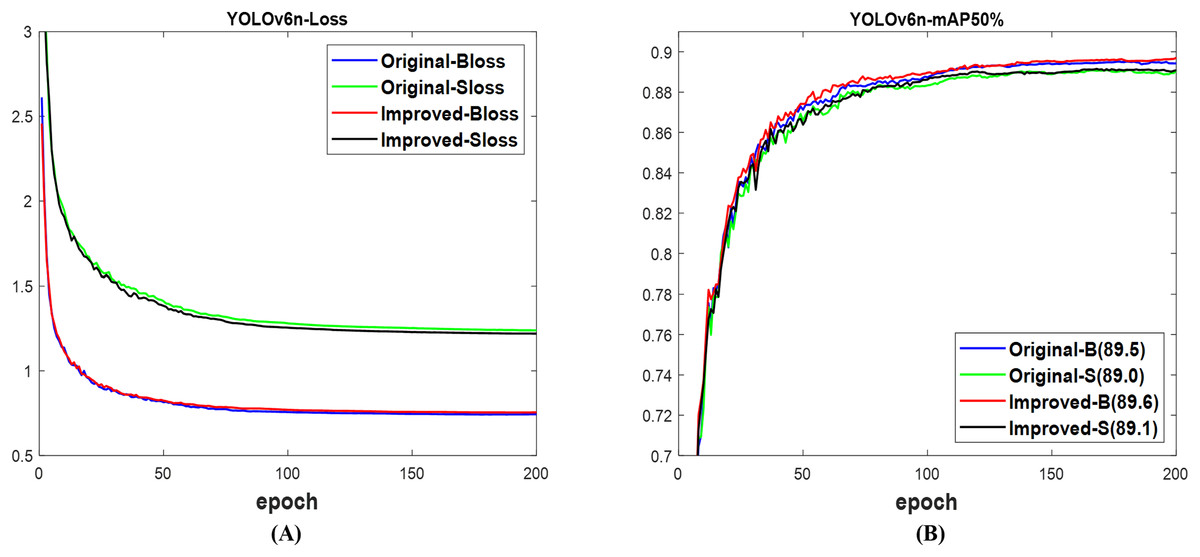
Figure 7: The results of original and improved networks of YOLOv6n using the valid set (A) valid loss and (B) mAP50%.
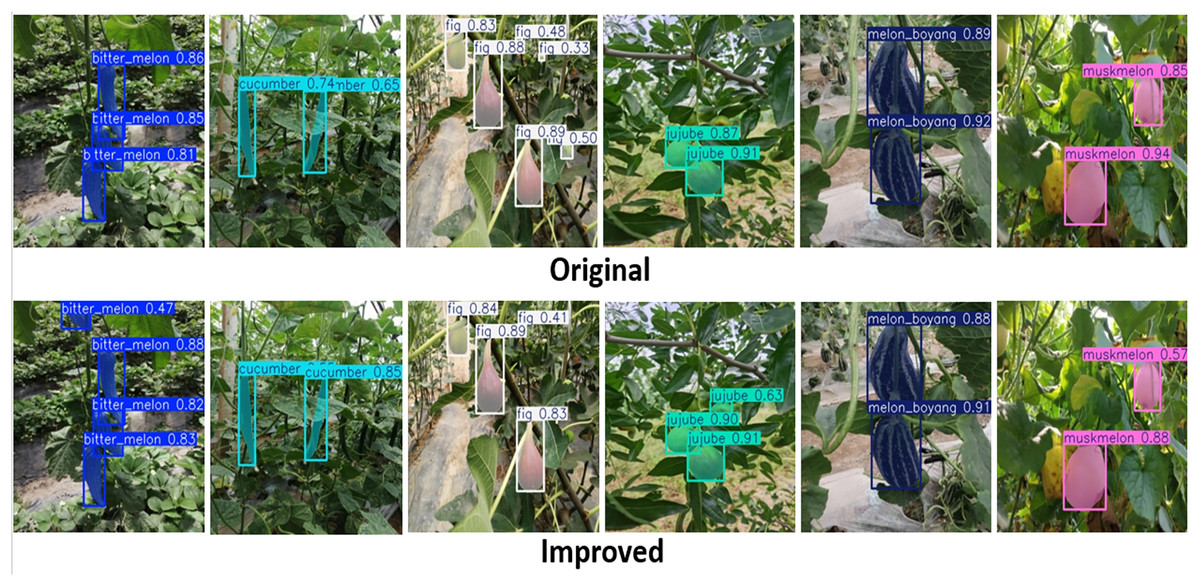
Figure 8: The detected fruit targets differentiate between the original and improved networks of YOLOv6n.
| YOLOv6n (test) |
Computation | Box@50% | Segment@50% | Time (ms) | ||||||||
|---|---|---|---|---|---|---|---|---|---|---|---|---|
| Params | GFLOPs | P | R | mAP | P | R | mAP | Tpre | Tinfer | Tpost | Total | |
| Original | 4.4 | 15.2 | 85.1 | 81.5 | 89.0 | 87.3 | 79.9 | 88.4 | 0.3 | 2.6 | 0.9 | 3.8 |
| Improved | 2.7 | 10.4 | 86.7 | 81.8 | 89.4 | 87.0 | 82.0 | 88.8 | 0.3 | 2.7 | 0.9 | 3.9 |
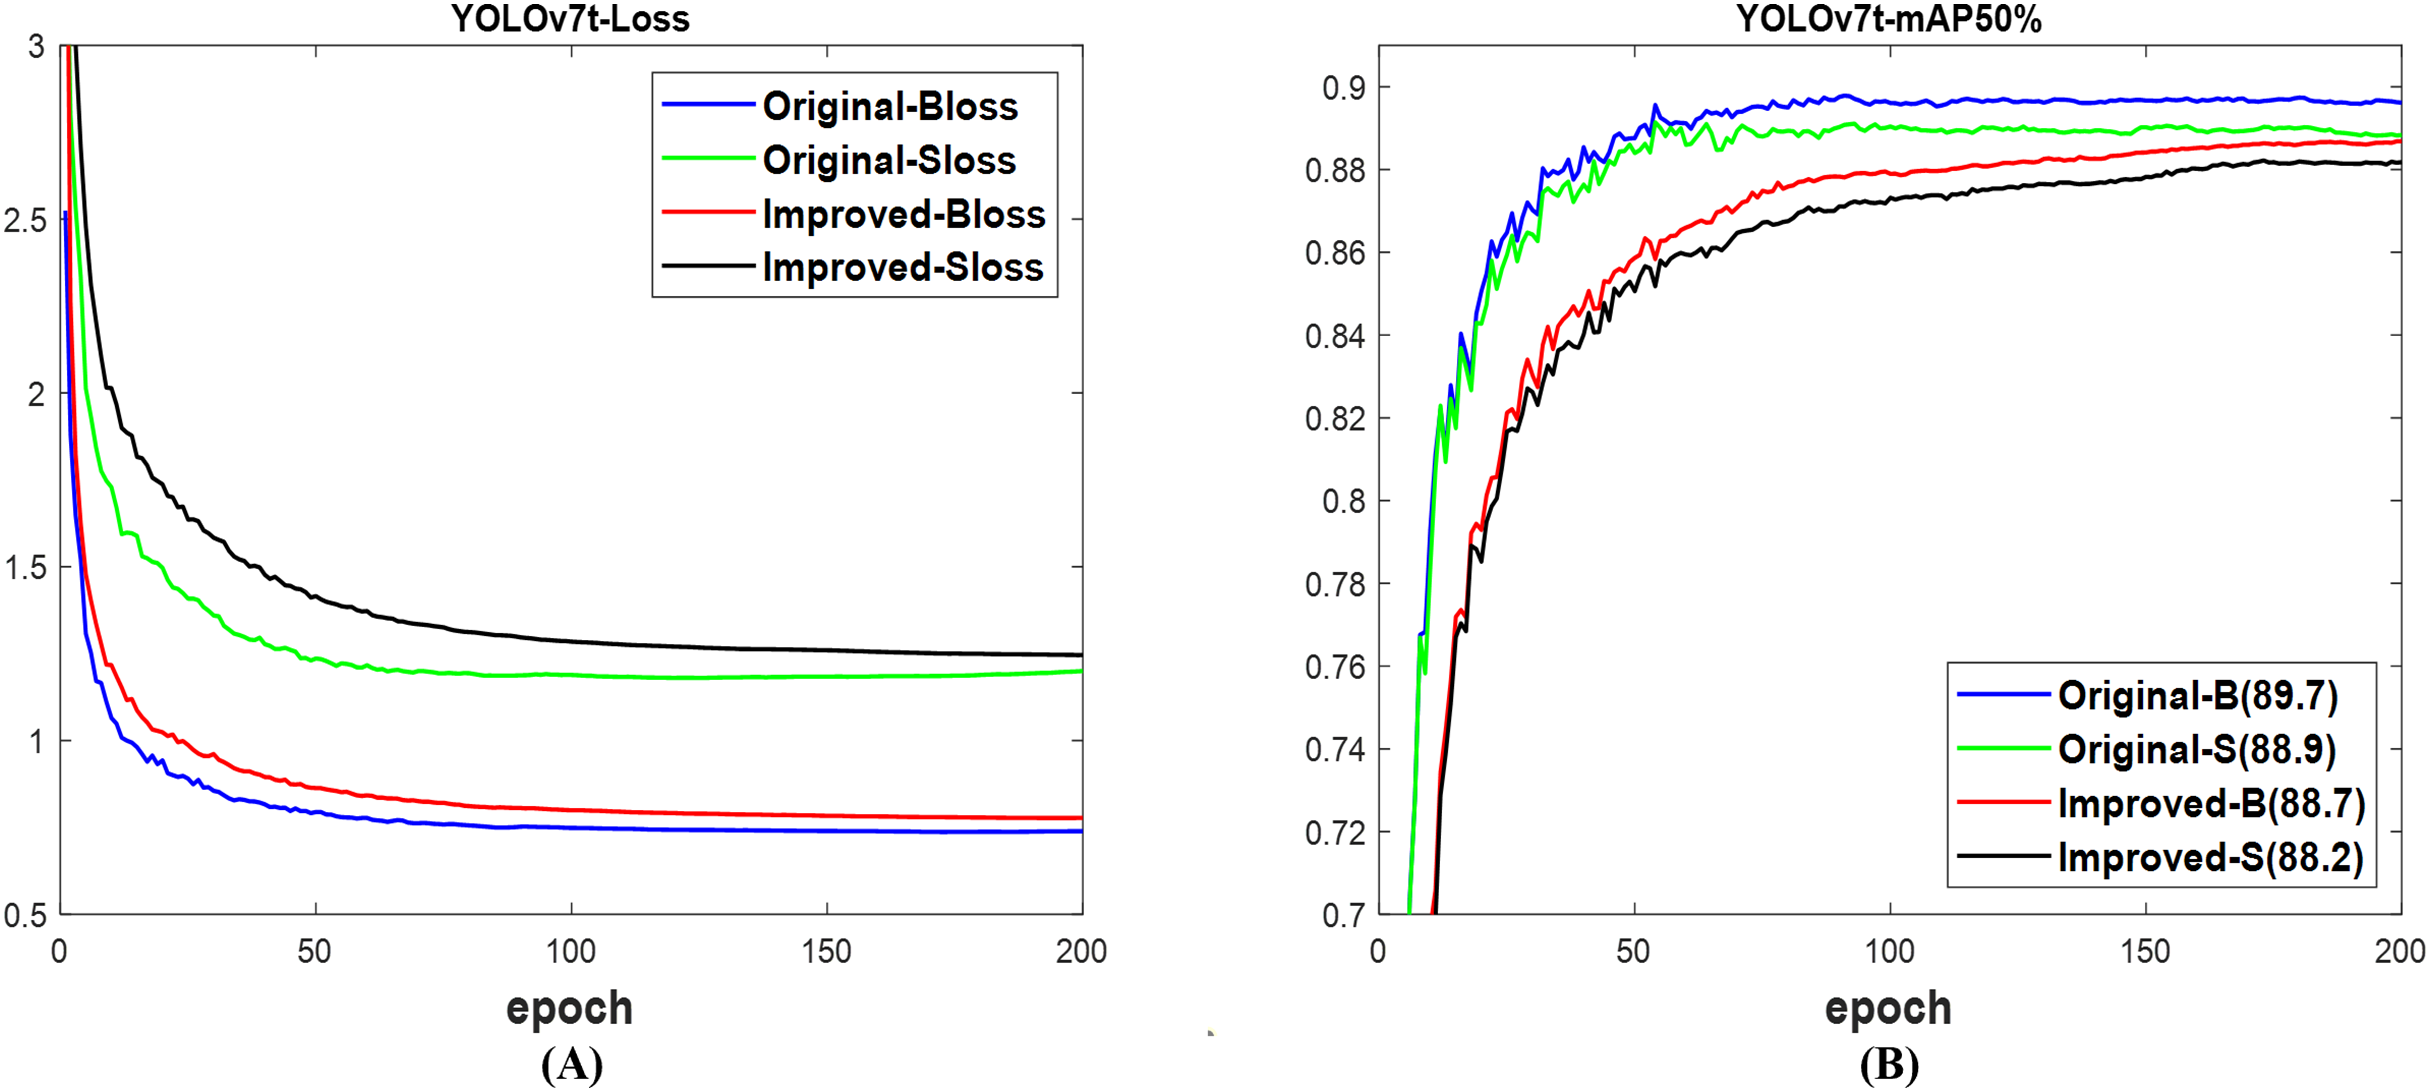
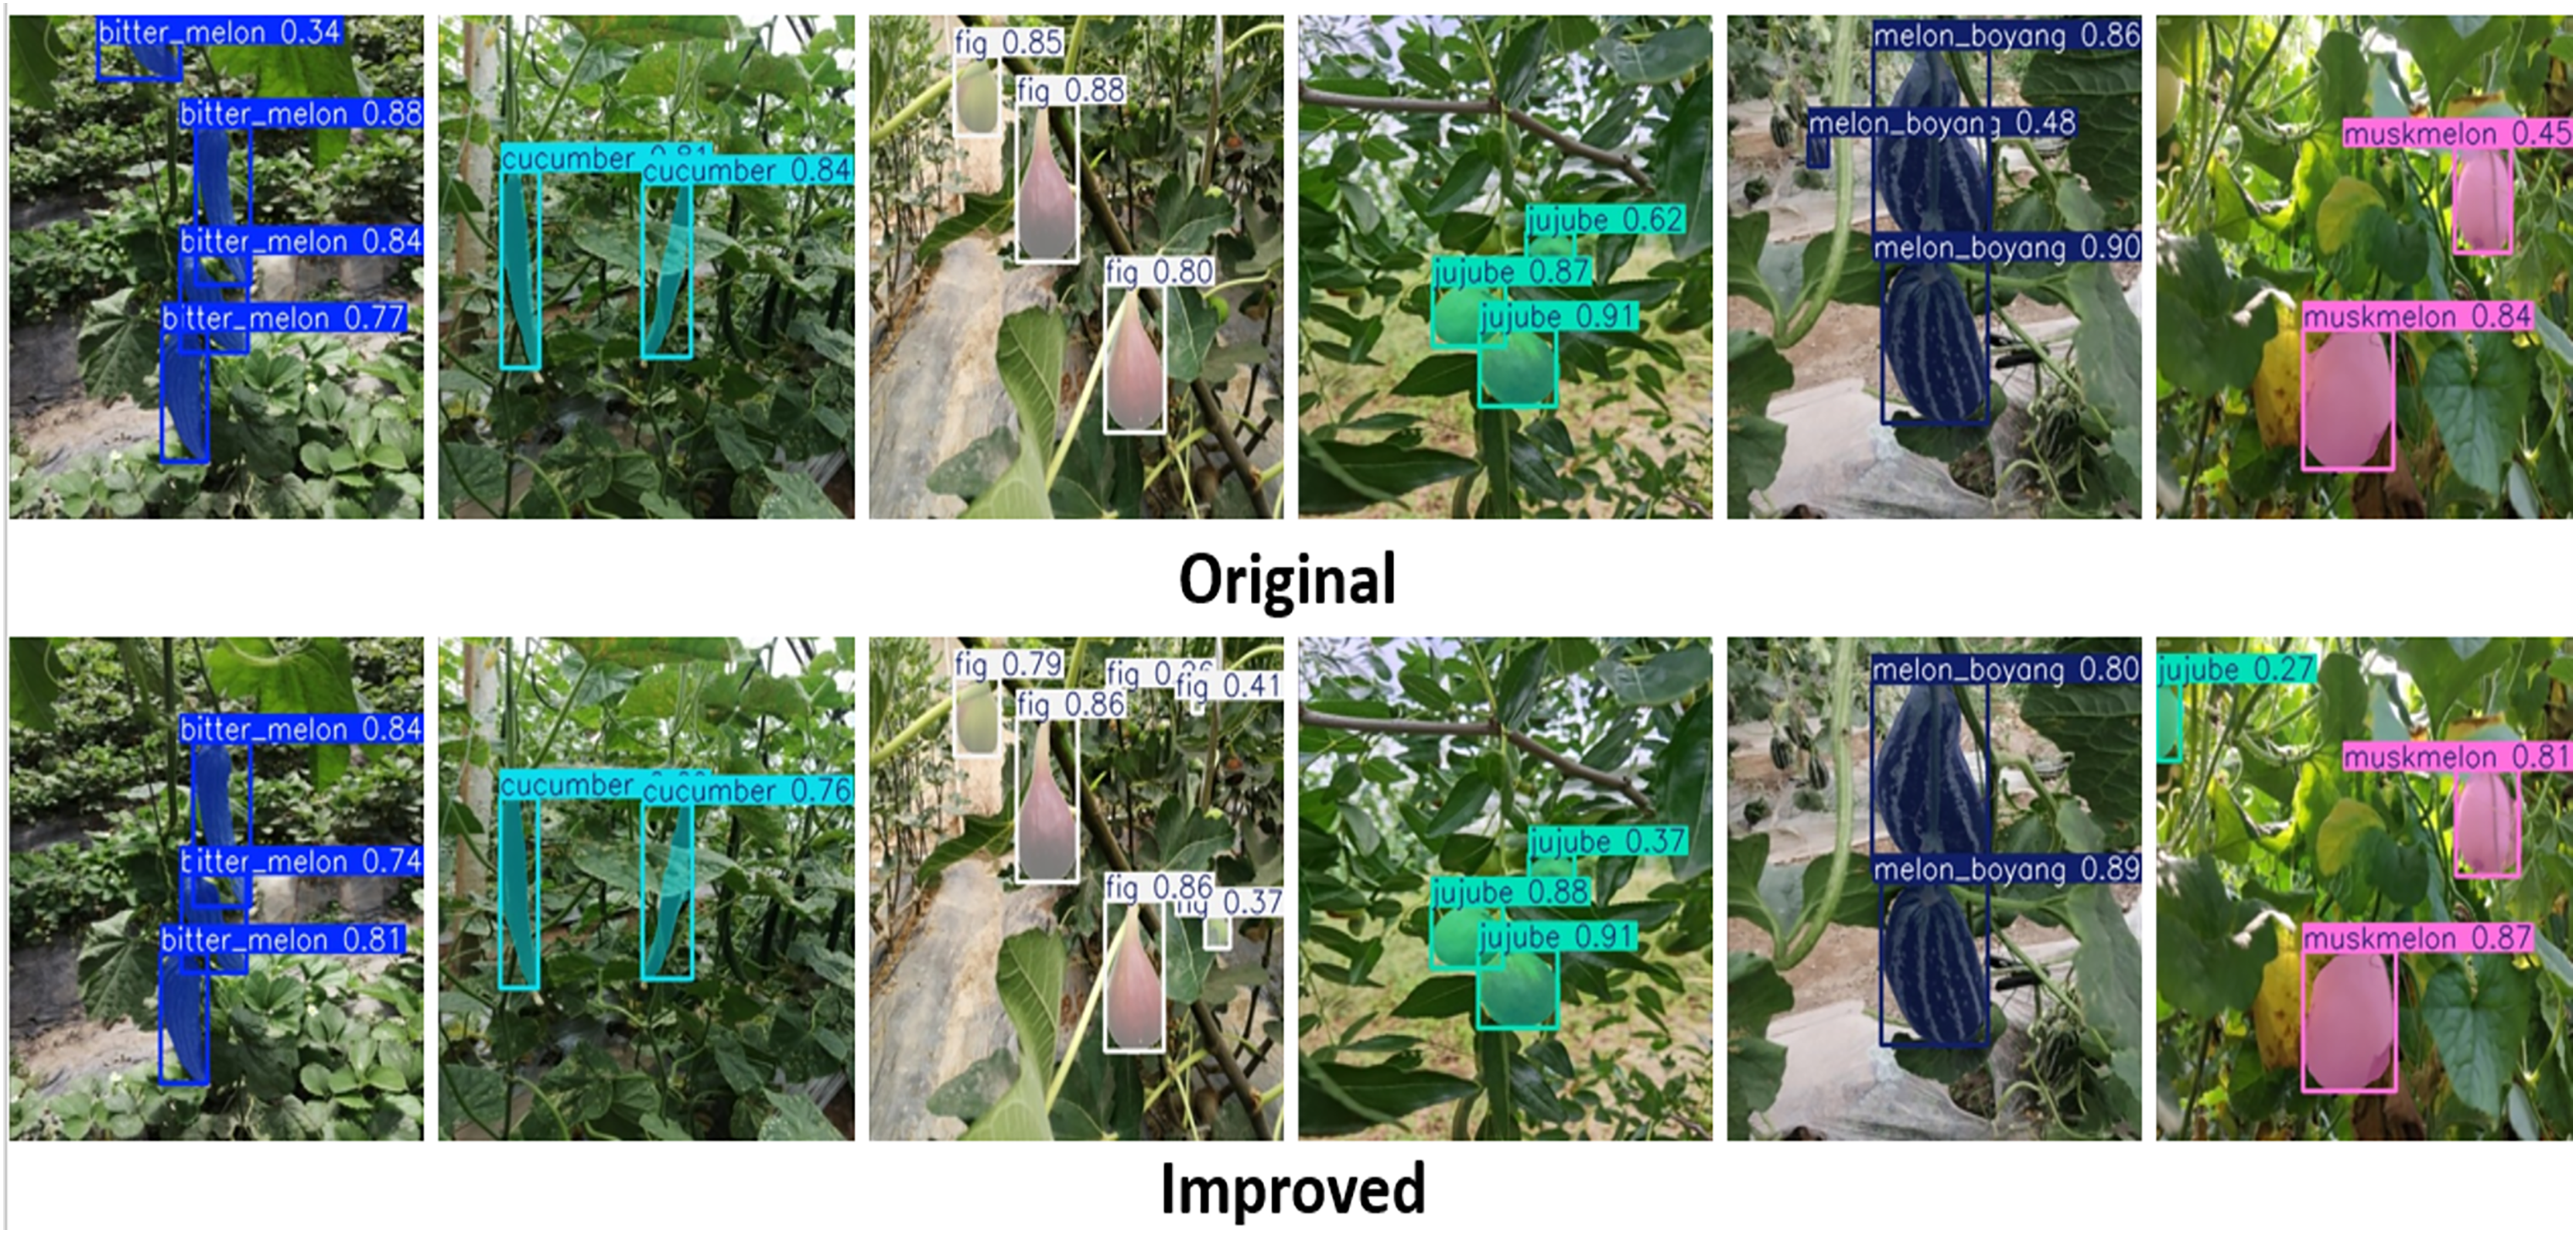
A different scenario was observed in YOLOv7t (Wang, Bochkovskiy & Liao, 2023a), where the validation loss in Fig. 9A for both box and segmentation of the original network is lower than that of the improved network. Fig. 9B indicates that the mAP of 89.7% for the box and 88.9% for the segment of the original network are, respectively, greater than the 88.7% for the box and 88.2% for the segment of the improved network. The results of Fig. 10 support the findings of Fig. 9B, which show that the confidence scores, including those without missed and inaccurate detection of the original YOLOv7t, outperformed the improved network on the test set of datasets. However, both networks successfully detected and segmented the numbers of fruit targets in the images. Interestingly, the obtained computation cost, as shown in Table 6, indicated that the improved network is lower than that of the original network. This resulted in the lower total detection time observed in the improved network compared to the original network. Meanwhile, the original network achieves 89.0% mAP box and 88.5% mAP segment, which are, respectively, more than the improved network’s 88.8% mAP box and 88.1% mAP segment. An indication that the improved network surpasses the original network of YOLOv7t, but not for detection mAP.
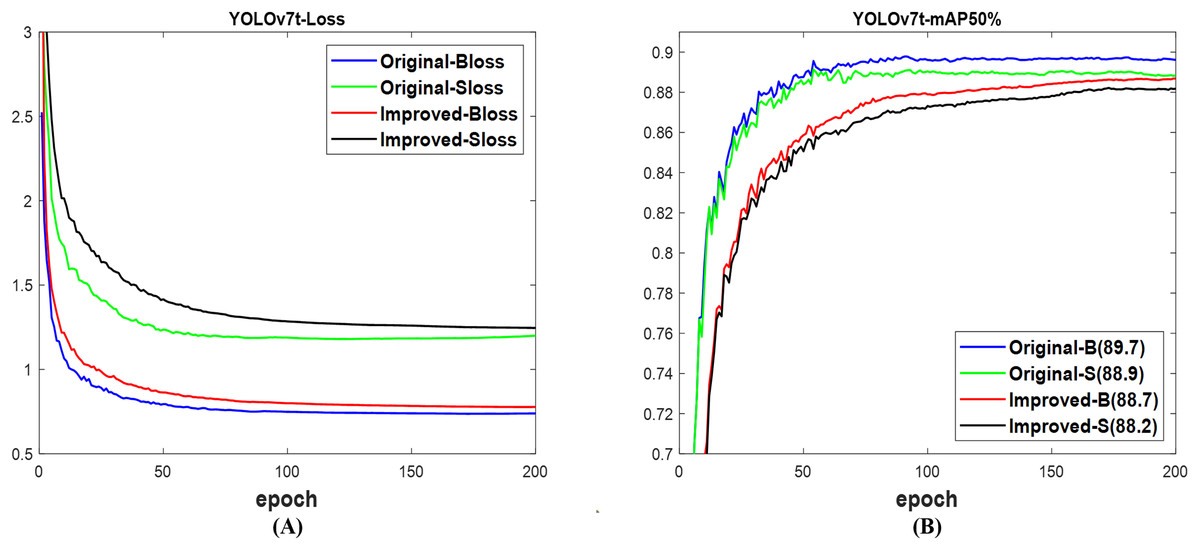
Figure 9: The results of original and improved networks of YOLOv7t using the valid set (A) valid loss and (B) mAP50%.
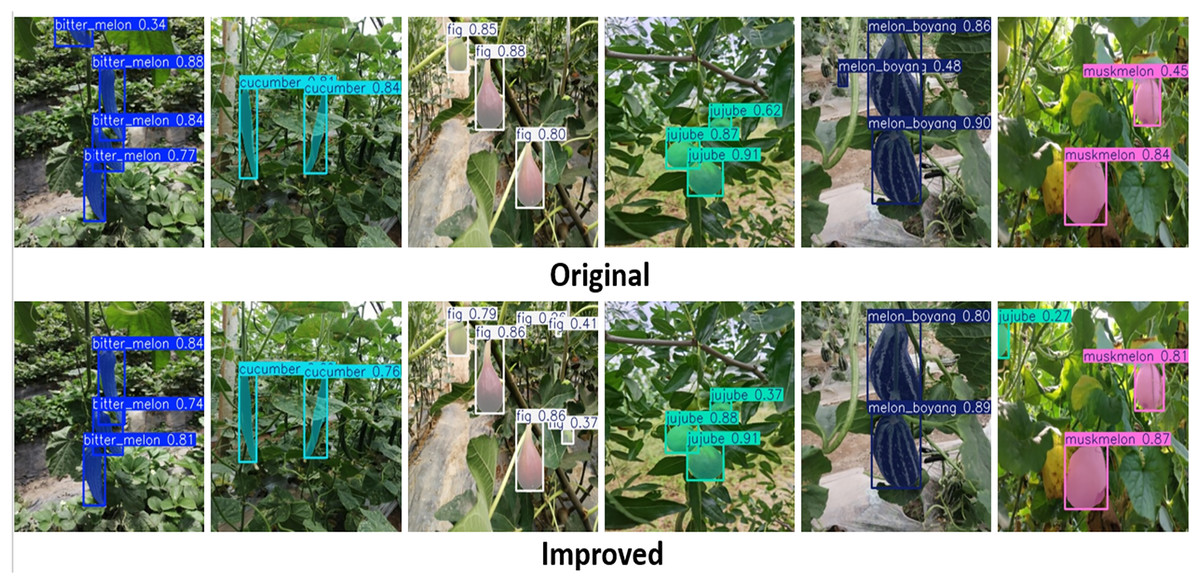
Figure 10: The detected fruit targets differentiate between the original and improved networks of YOLOv7t.
| YOLOv7t (test) |
Computation | Box@50% | Segment@50% | Time (ms) | ||||||||
|---|---|---|---|---|---|---|---|---|---|---|---|---|
| Params | GFLOPs | P | R | mAP | P | R | mAP | Tpre | Tinfer | Tpost | Total | |
| Original | 9.5 | 69.9 | 87.9 | 81.8 | 89.0 | 88.2 | 81.9 | 88.5 | 0.3 | 7.5 | 0.9 | 8.7 |
| Improved | 1.8 | 8.2 | 89.5 | 79.5 | 88.8 | 89.9 | 78.6 | 88.1 | 0.3 | 3.1 | 0.8 | 4.2 |
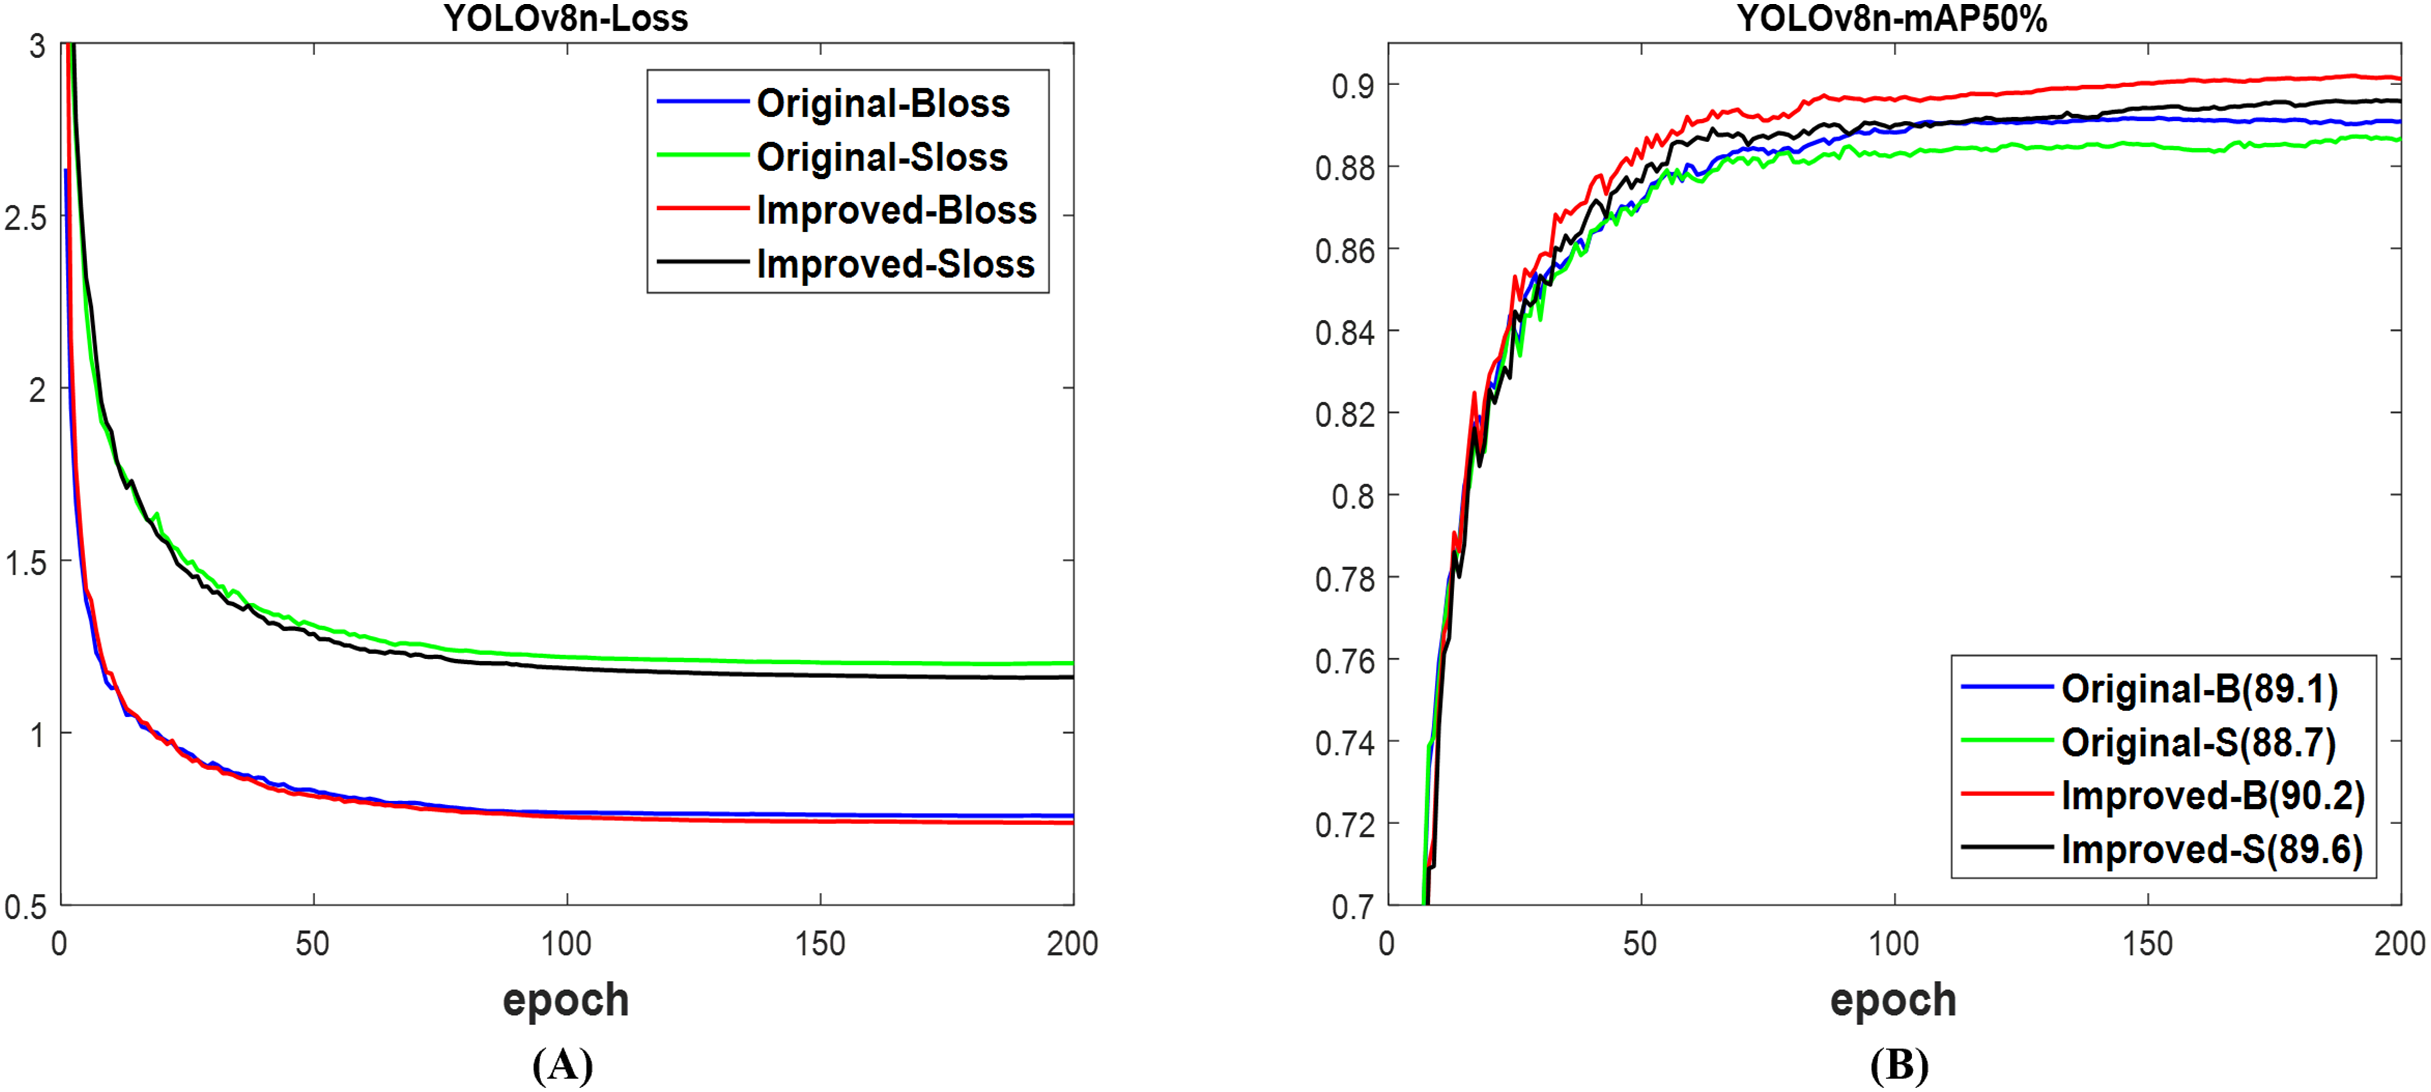
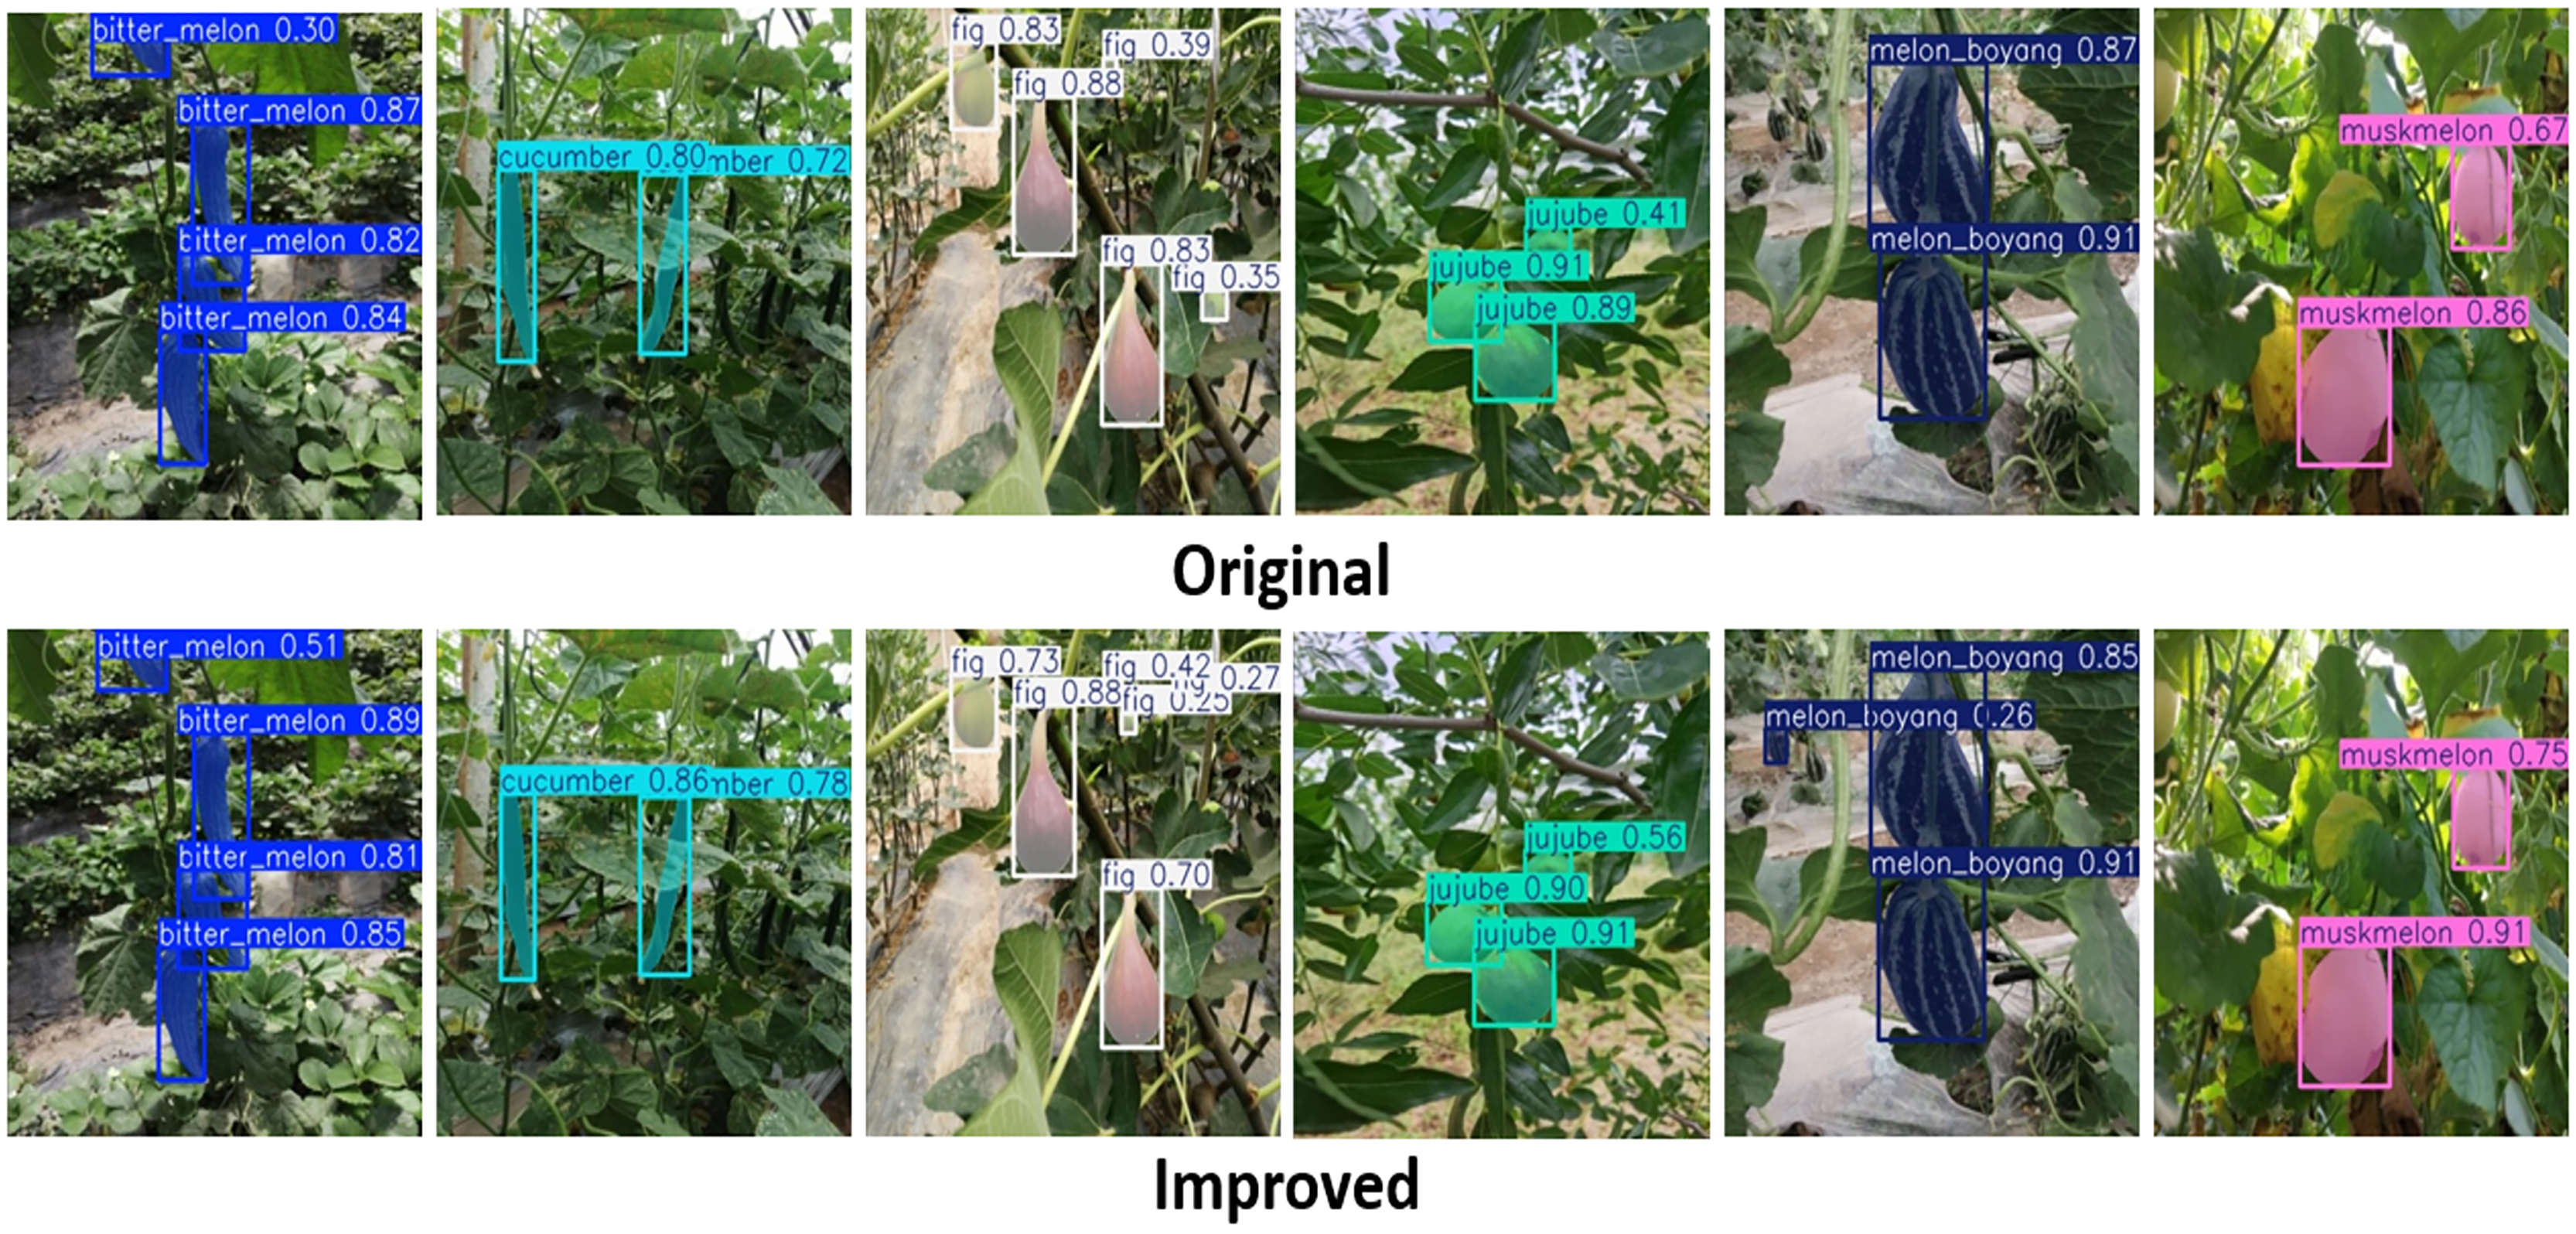
Based on the YOLOv8n (Ultralytics, 2023), the validation loss in Fig. 11A for both the box and segmentation of the improved network is lower than that of the original network. These losses constitute the presented results in Fig. 11B, where the mAP of 90.2% for the box and 89.6% for the segment of the improved network are, respectively, higher than the 89.1% for the box and 88.7% for the segment of the original network. Although both networks used the test set of datasets to effectively detect and segment fruit targets in the images as shown in Fig. 12, the confidence scores including those without missed and incorrect detection of the improved YOLOv8n surpassed the original network. With Table 7, the computation costs of the improved network outperformed the original network. Furthermore, the improved network outperforms the original network with 89.9% mAP box and 89.1% mAP segment, compared to 89.0% and 87.8%, respectively. Likewise, the total detection time of the improved network is lower than that of the original network. This illustrated the advantage of improved YOLOv8n networks over the original for fruit detection and instance segmentation.
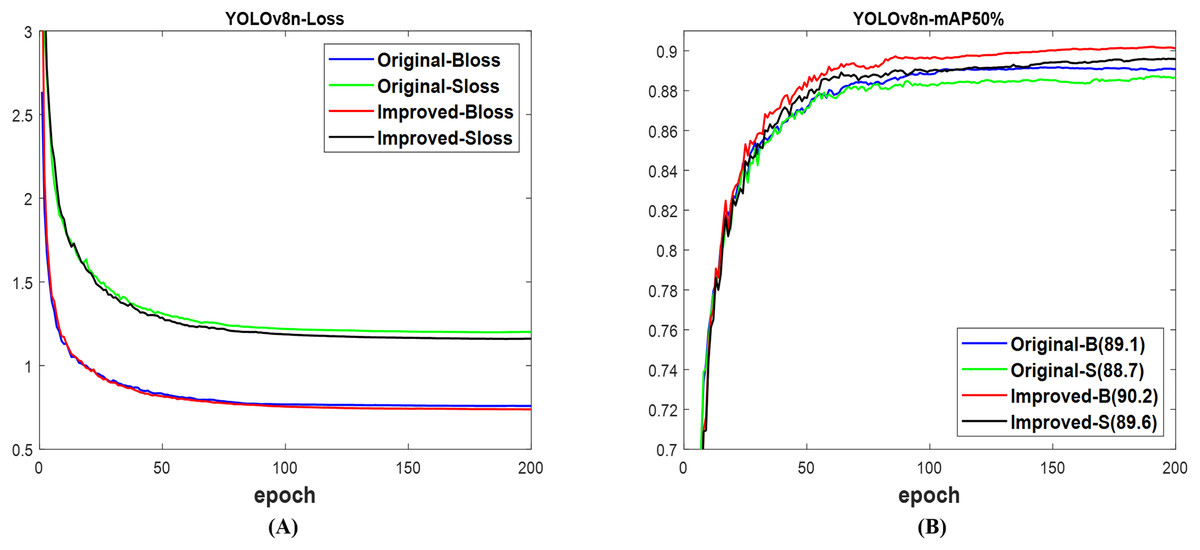
Figure 11: The results of original and improved networks of YOLOv8n using the valid set (A) valid loss and (B) mAP50%.
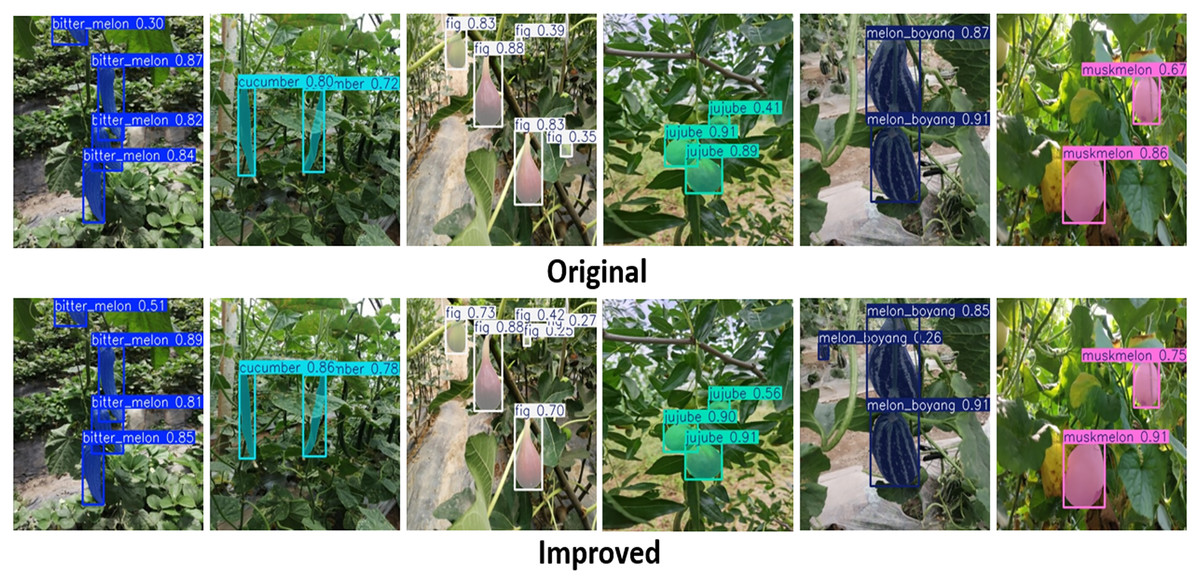
Figure 12: The detected fruit targets differentiate between the original and improved networks of YOLOv8n.
| YOLOv8n (test) |
Computation | Box@50% | Segment@50% | Time (ms) | ||||||||
|---|---|---|---|---|---|---|---|---|---|---|---|---|
| Params | GFLOPs | P | R | mAP | P | R | mAP | Tpre | Tinfer | Tpost | Total | |
| Original | 3.3 | 12.0 | 89.6 | 79.6 | 89.0 | 89.4 | 79.3 | 87.8 | 0.4 | 2.7 | 1.0 | 4.1 |
| Improved | 3.0 | 11.7 | 88.1 | 82.6 | 89.8 | 87.6 | 82.5 | 89.1 | 0.4 | 2.8 | 1.0 | 4.2 |
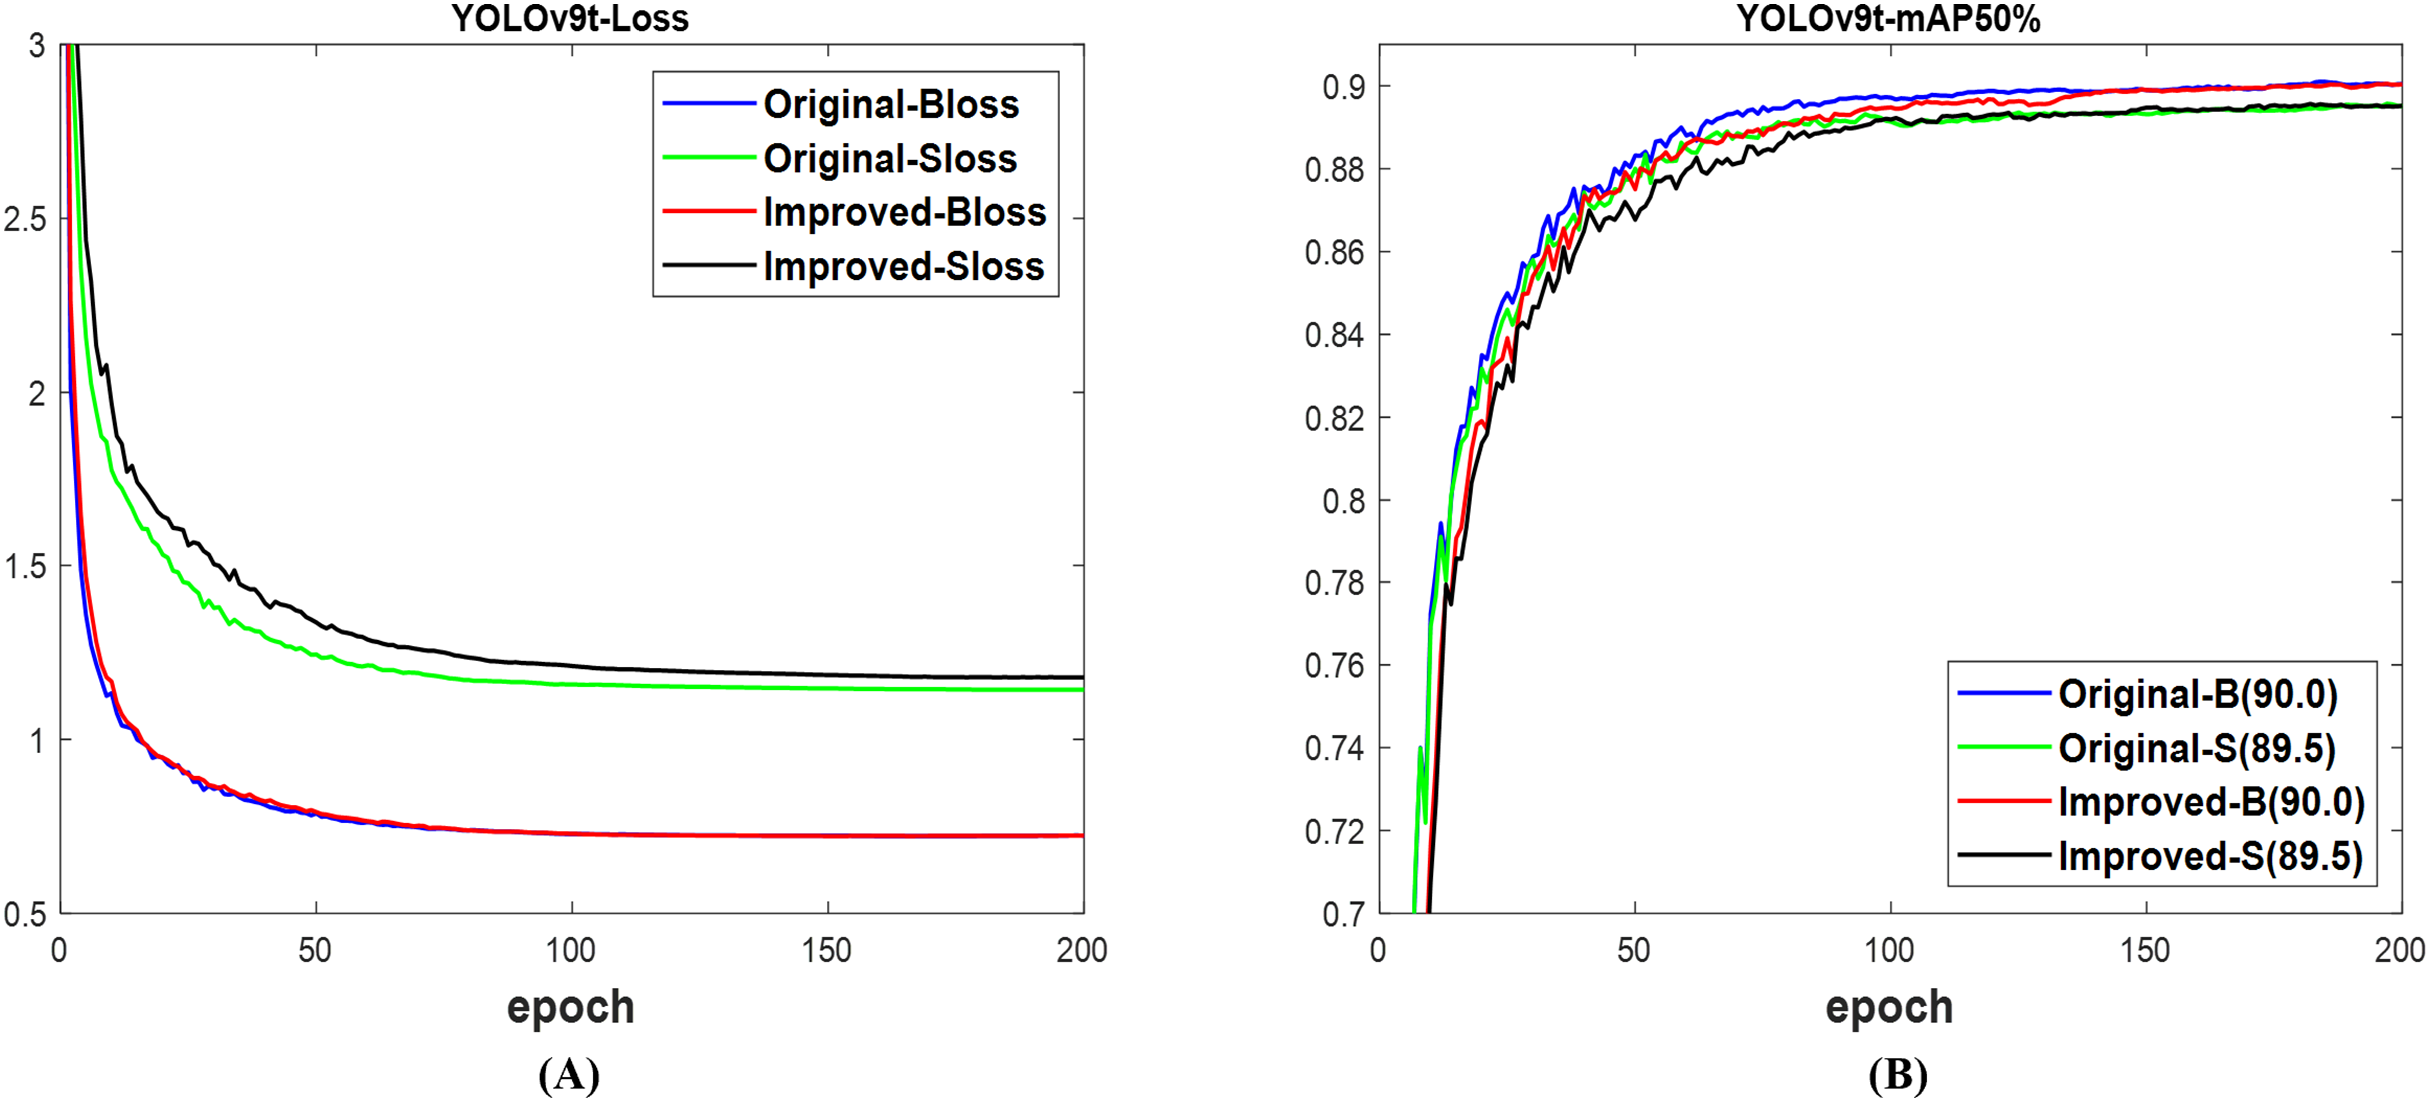
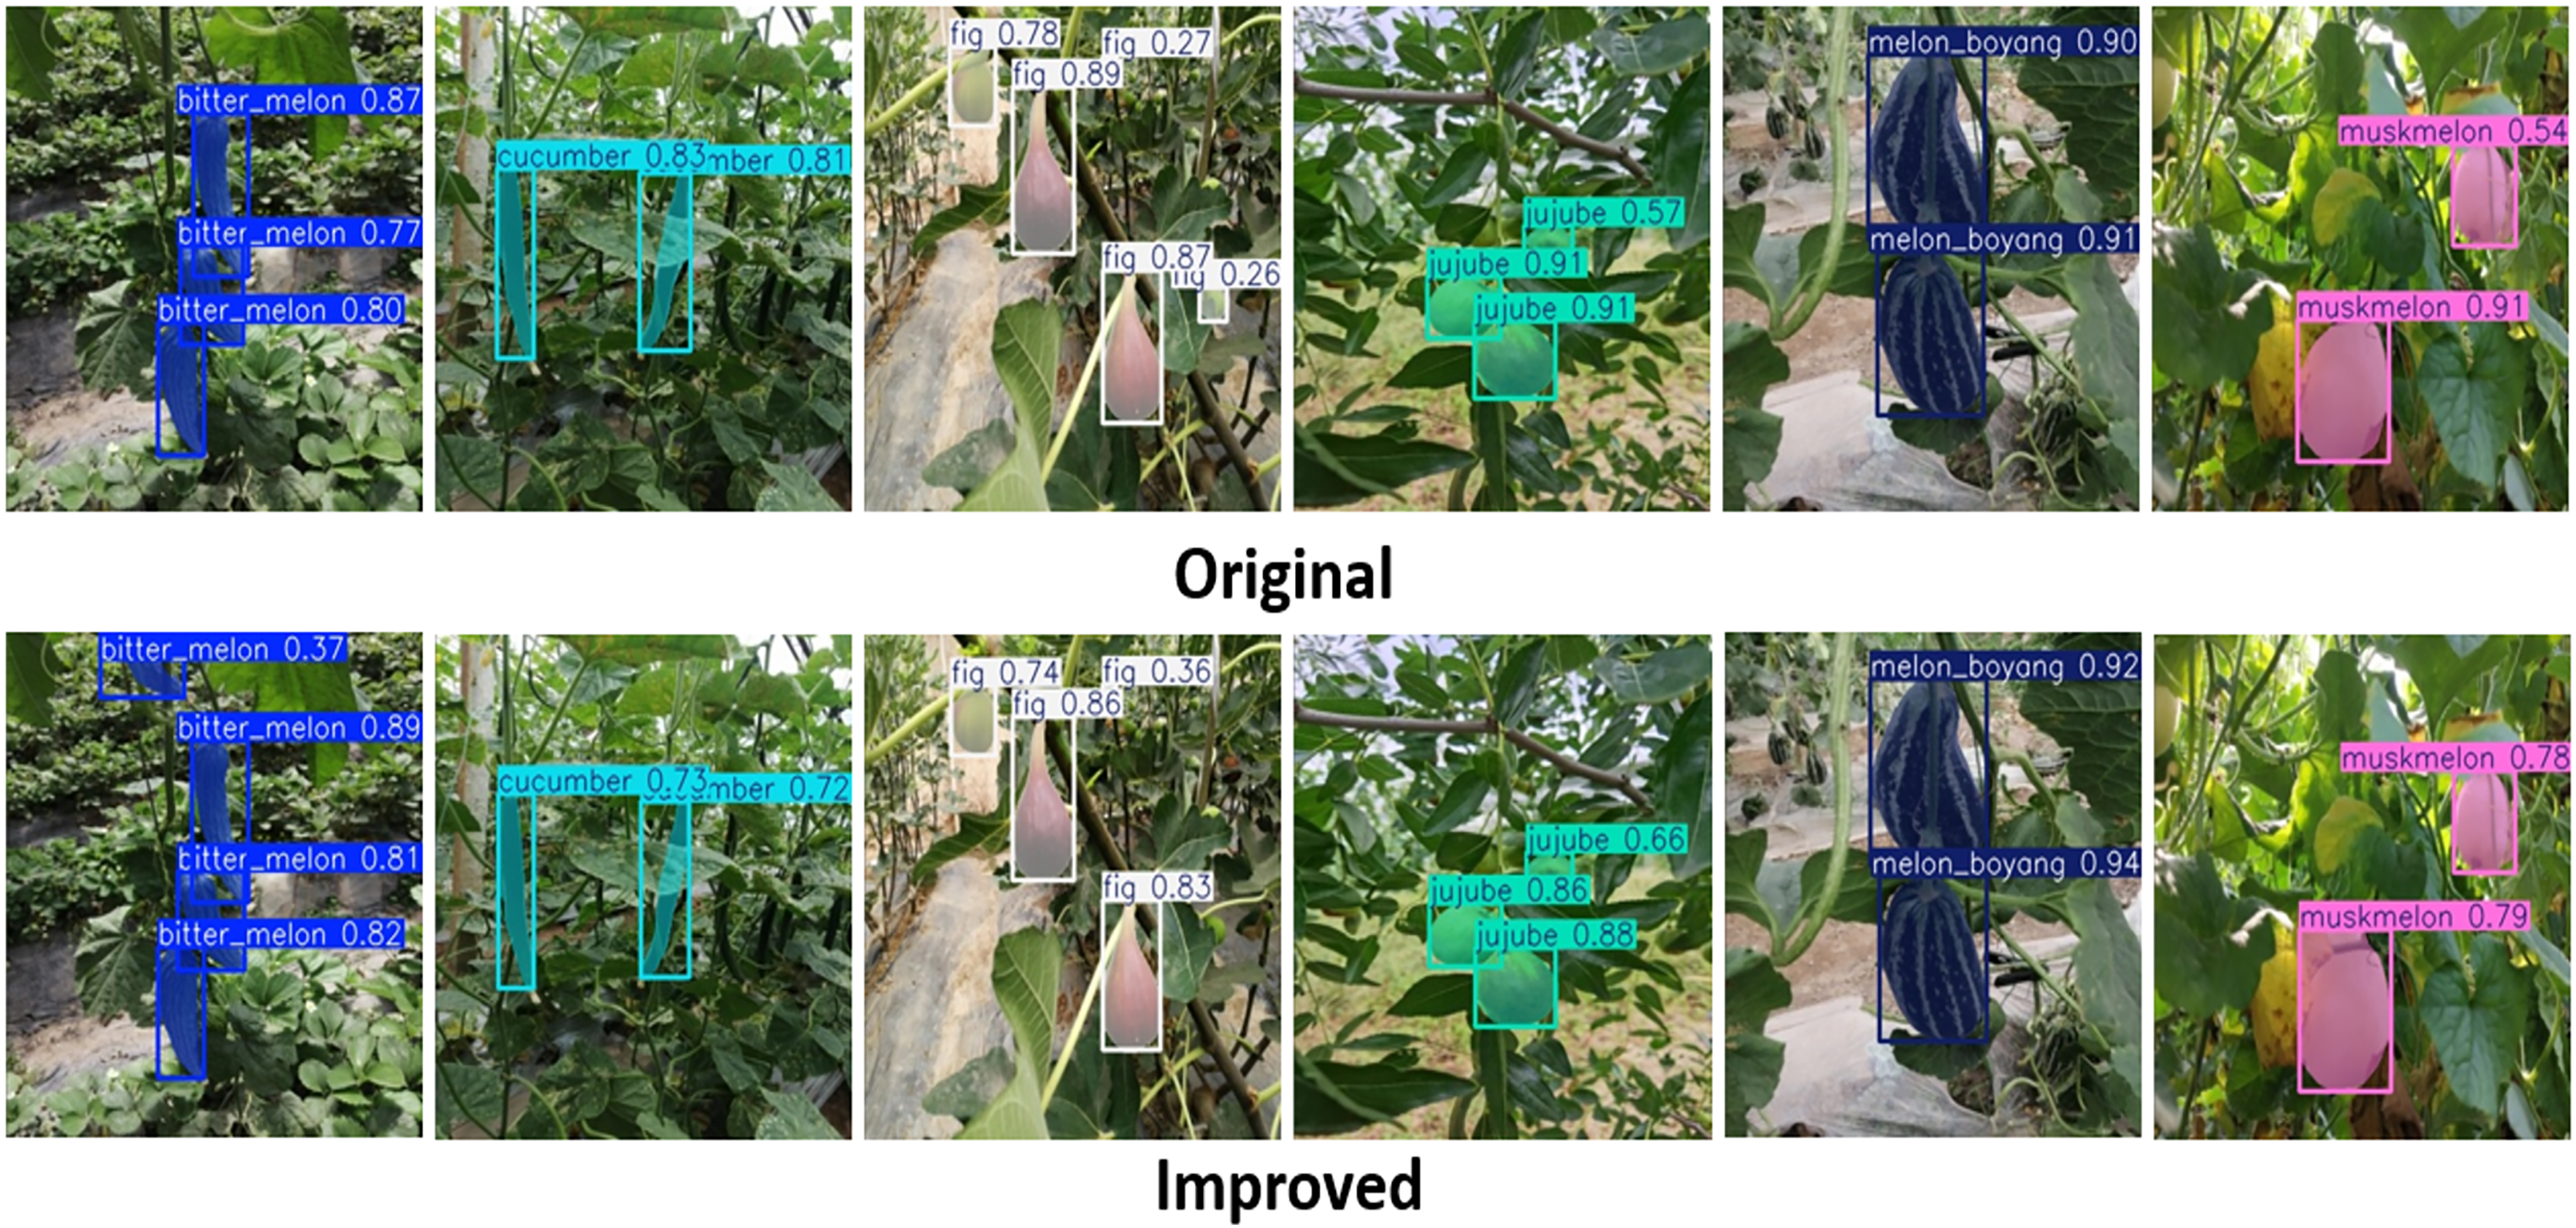
For YOLOv9t (Wang, Bochkovskiy & Liao, 2023b), the validation loss of the box between the improved and original networks, as depicted in Fig. 13A, experienced no significant difference, but the validation loss for segmentation of the original network is lower than that of the improved network. Fortunately, both the improved and original networks attain similar mAP box scores of 90.0% and mAP segment scores of 89.5%, as indicated in Fig. 13B. Based on the test set of the dataset, Fig. 14 illustrates that both networks successfully detected and segmented the numbers of fruit targets in the presented images; nonetheless, the confidence scores of the improved network are more than those of the original YOLOv9t network. The original network was associated with both missed and incorrect detection, in contrast to the improved network. Table 8 illustrates that the computation costs of the improved network outrightly surpass the original network. The improved network achieves 90.2% mAP box and 89.7% mAP segment, topping the original network’s 89.7% mAP box and 88.8% mAP segment, respectively. For total detection time, the improved network is less than the original network. Therefore, the improved network is outstanding compared to the original network of YOLOv9t for fruit detection and instance segmentation.
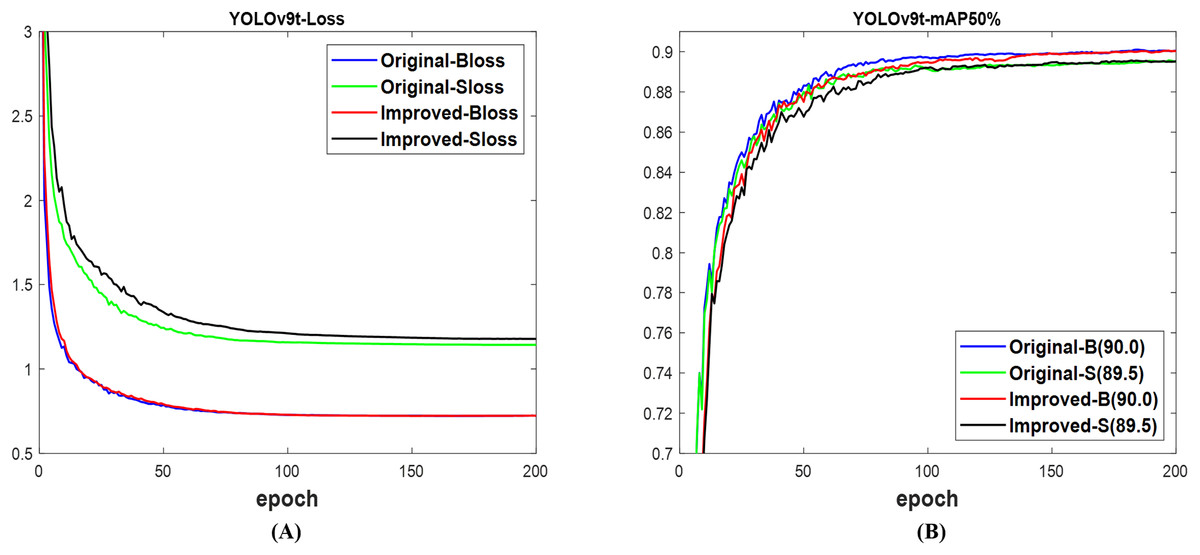
Figure 13: The results of original and improved networks of YOLOv9t using the valid set (A) valid loss and (B) mAP50%.
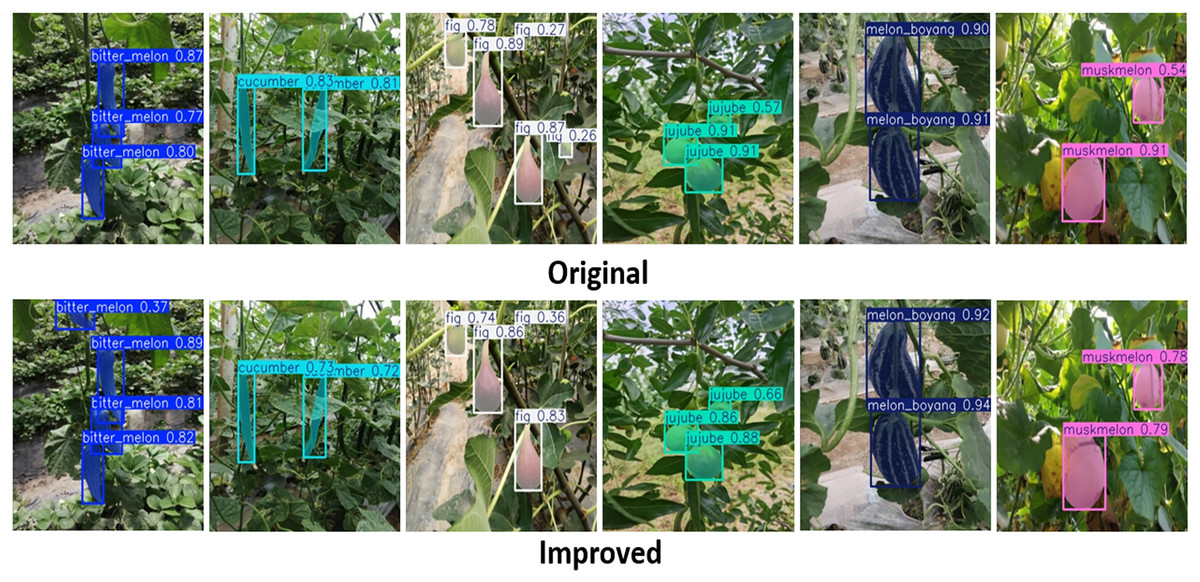
Figure 14: The detected fruit targets differentiate between the original and improved networks of YOLOv9t.
| YOLOv9t (test) |
Computation | Box@50% | Segment@50% | Time (ms) | ||||||||
|---|---|---|---|---|---|---|---|---|---|---|---|---|
| Params | GFLOPs | P | R | mAP | P | R | mAP | Tpre | Tinfer | Tpost | Total | |
| Original | 3.1 | 54.1 | 89.0 | 79.3 | 89.7 | 89.7 | 79.0 | 88.8 | 0.3 | 6.4 | 0.9 | 7.6 |
| Improved | 1.9 | 8.9 | 88.0 | 83.2 | 90.2 | 88.8 | 81.8 | 89.7 | 0.3 | 4.0 | 0.7 | 5.0 |
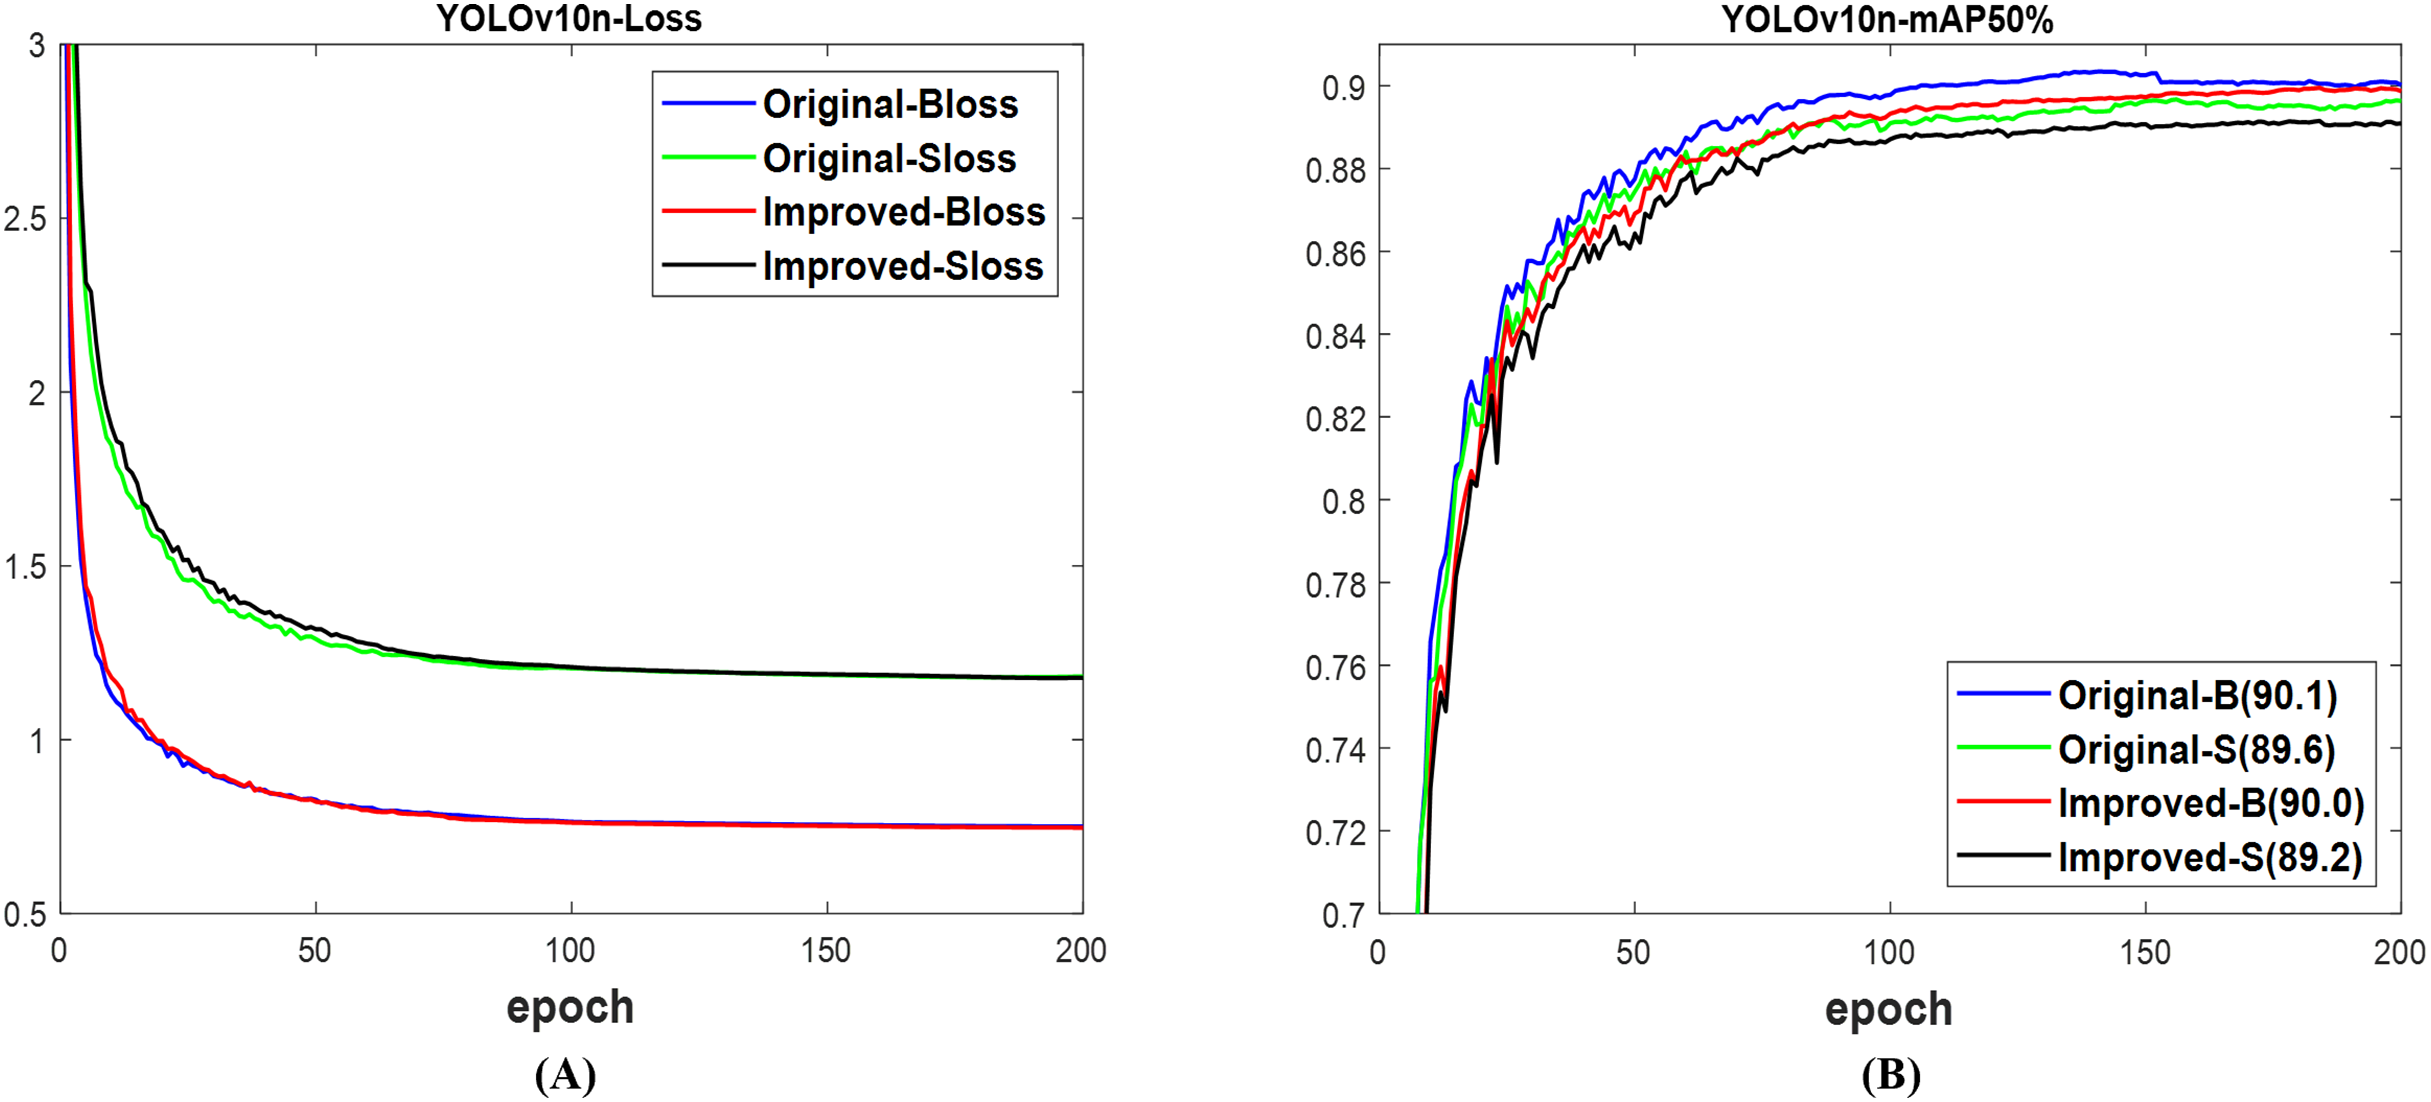
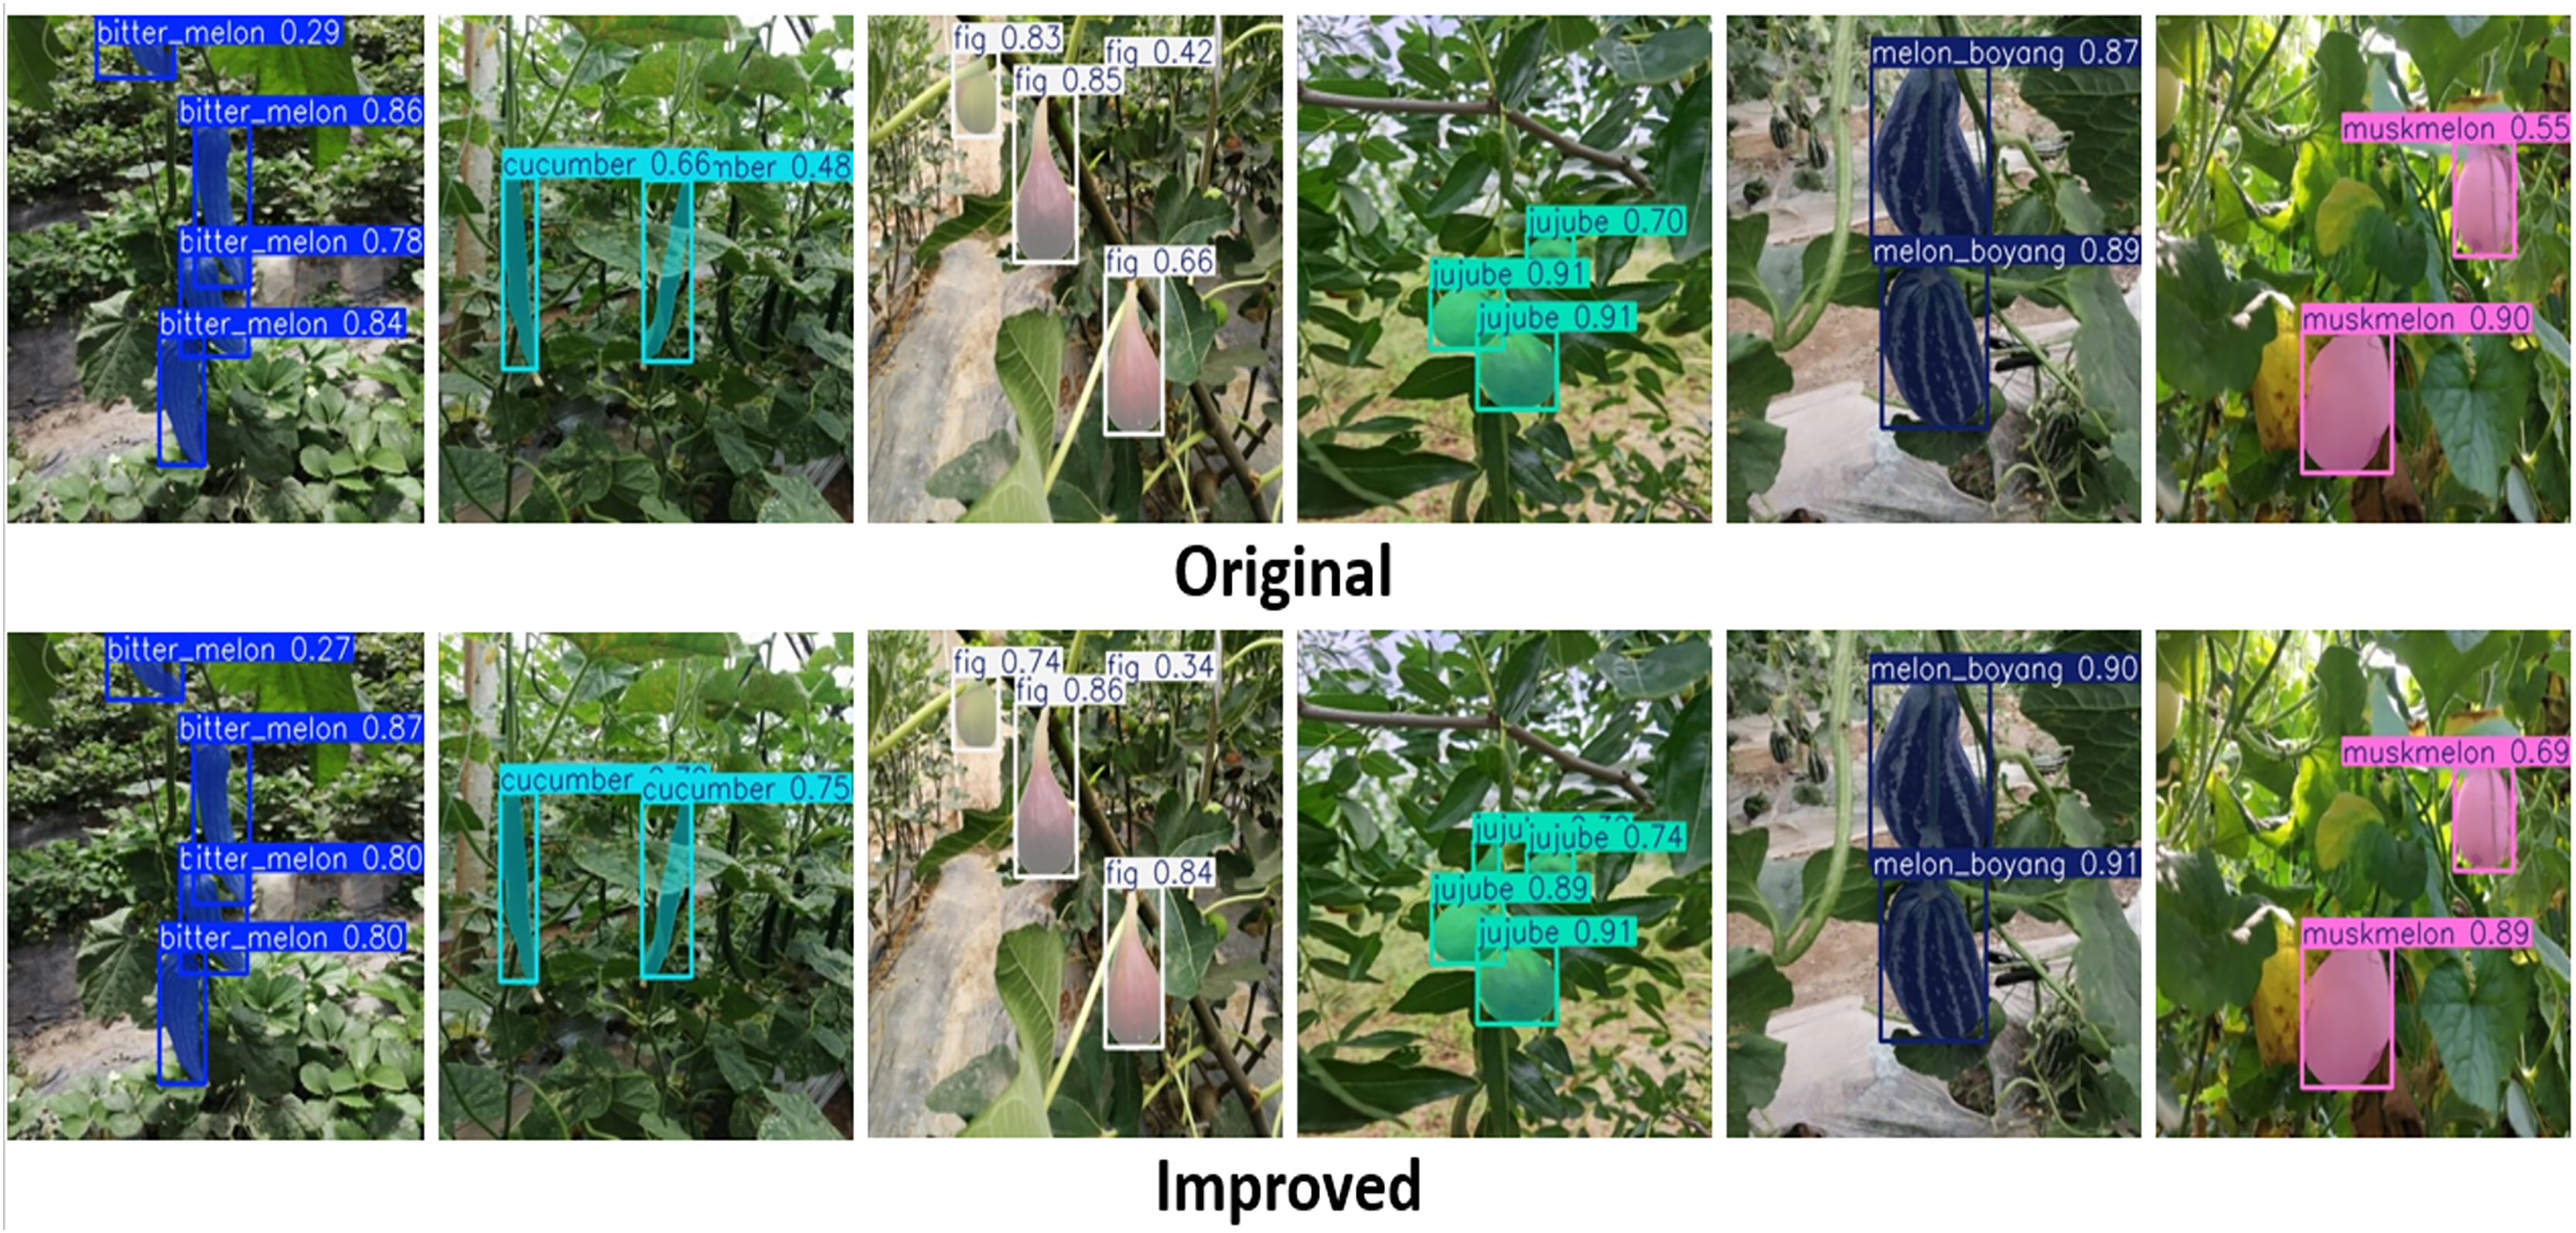
Using YOLOv10n (Wang et al., 2023), both validation losses of the box and segmentation between the improved and original networks indicate no significant difference, as displayed in Fig. 15A. Figure 15B shows that the original network slightly outperforms the improved network with a 90.1% mAP box and an 89.6% mAP segment, compared to 90.0% and 89.2%, respectively. Both networks used the test set of datasets to effectively detect and segment fruit targets in the images, as shown in Fig. 16. Interestingly, the improved YOLOv10n network’s confidence scores are higher than those of the original network. The justification for these results is shown in Table 9. The computation costs of the improved network surpassed those of the original network, as in Table 9. Meanwhile, the improved network attains 89.9% mAP box and 89.0% mAP segment, exceeding the original network’s 89.2% mAP box and 88.7% mAP segment, respectively. Simultaneously, the improved network has a lower overall detection time than the original network. This means that the improved network outperforms the original YOLOv10n network for fruit detection and instance segmentation.
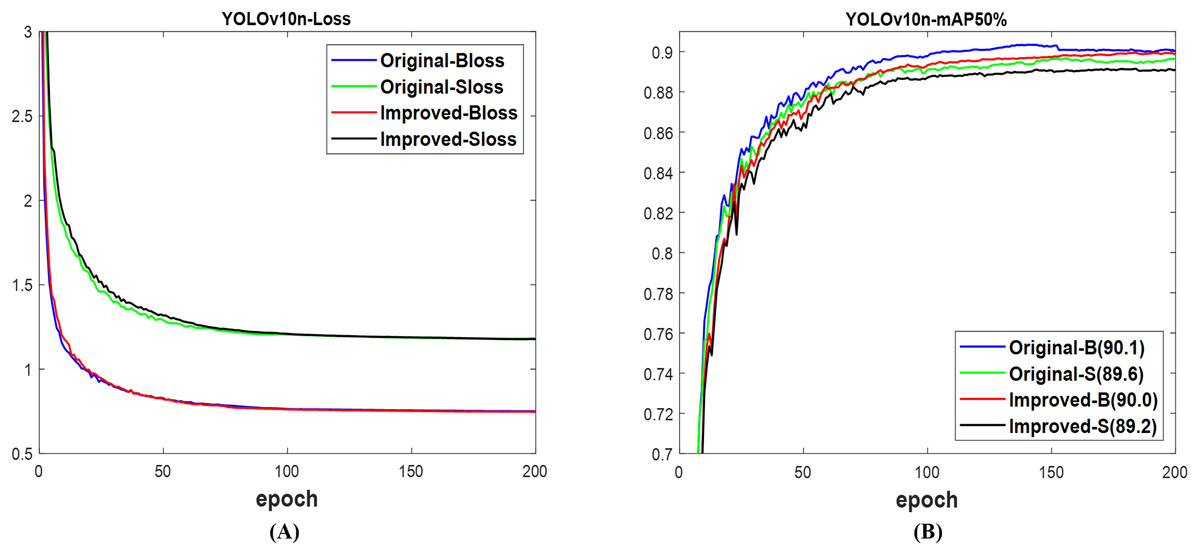
Figure 15: The results of original and improved networks of YOLOv10n using the valid set (A) valid loss and (B) mAP50%.
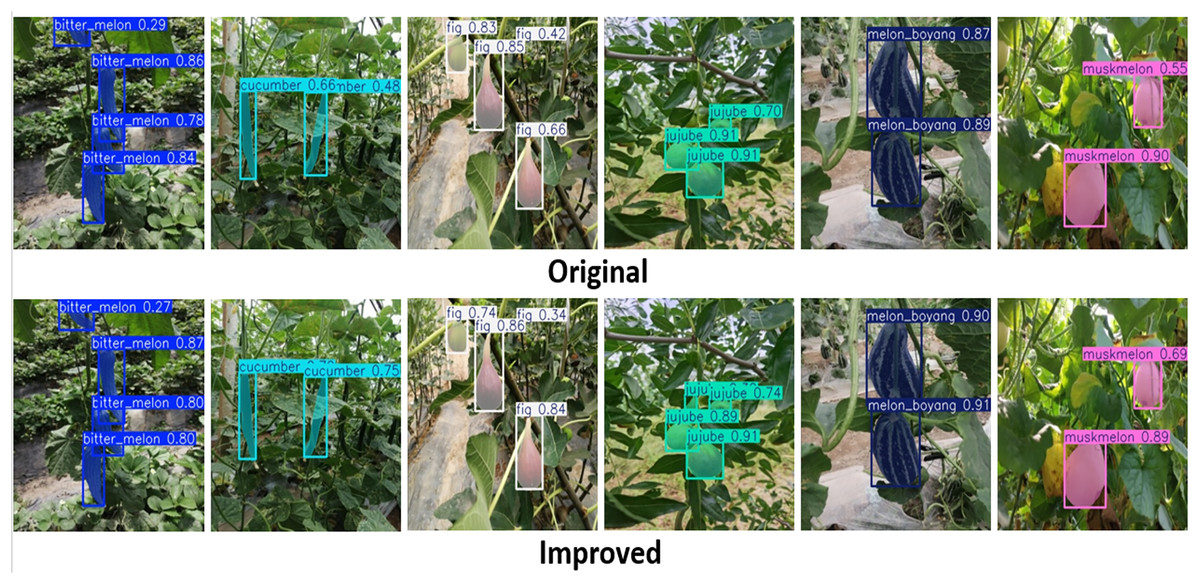
Figure 16: The detected fruit targets differentiate between the original and improved networks of YOLOv10n.
| YOLOv10n (test) |
Computation | Box@50% | Segment@50% | Time (ms) | ||||||||
|---|---|---|---|---|---|---|---|---|---|---|---|---|
| Params | GFLOPs | P | R | mAP | P | R | mAP | Tpre | Tinfer | Tpost | Total | |
| Original | 2.8 | 11.7 | 87.0 | 81.6 | 89.2 | 90.1 | 79.0 | 88.7 | 0.5 | 2.8 | 1.2 | 4.5 |
| Improved | 2.7 | 11.5 | 88.7 | 81.7 | 89.9 | 88.4 | 81.0 | 89.0 | 0.4 | 2.9 | 1.1 | 4.4 |
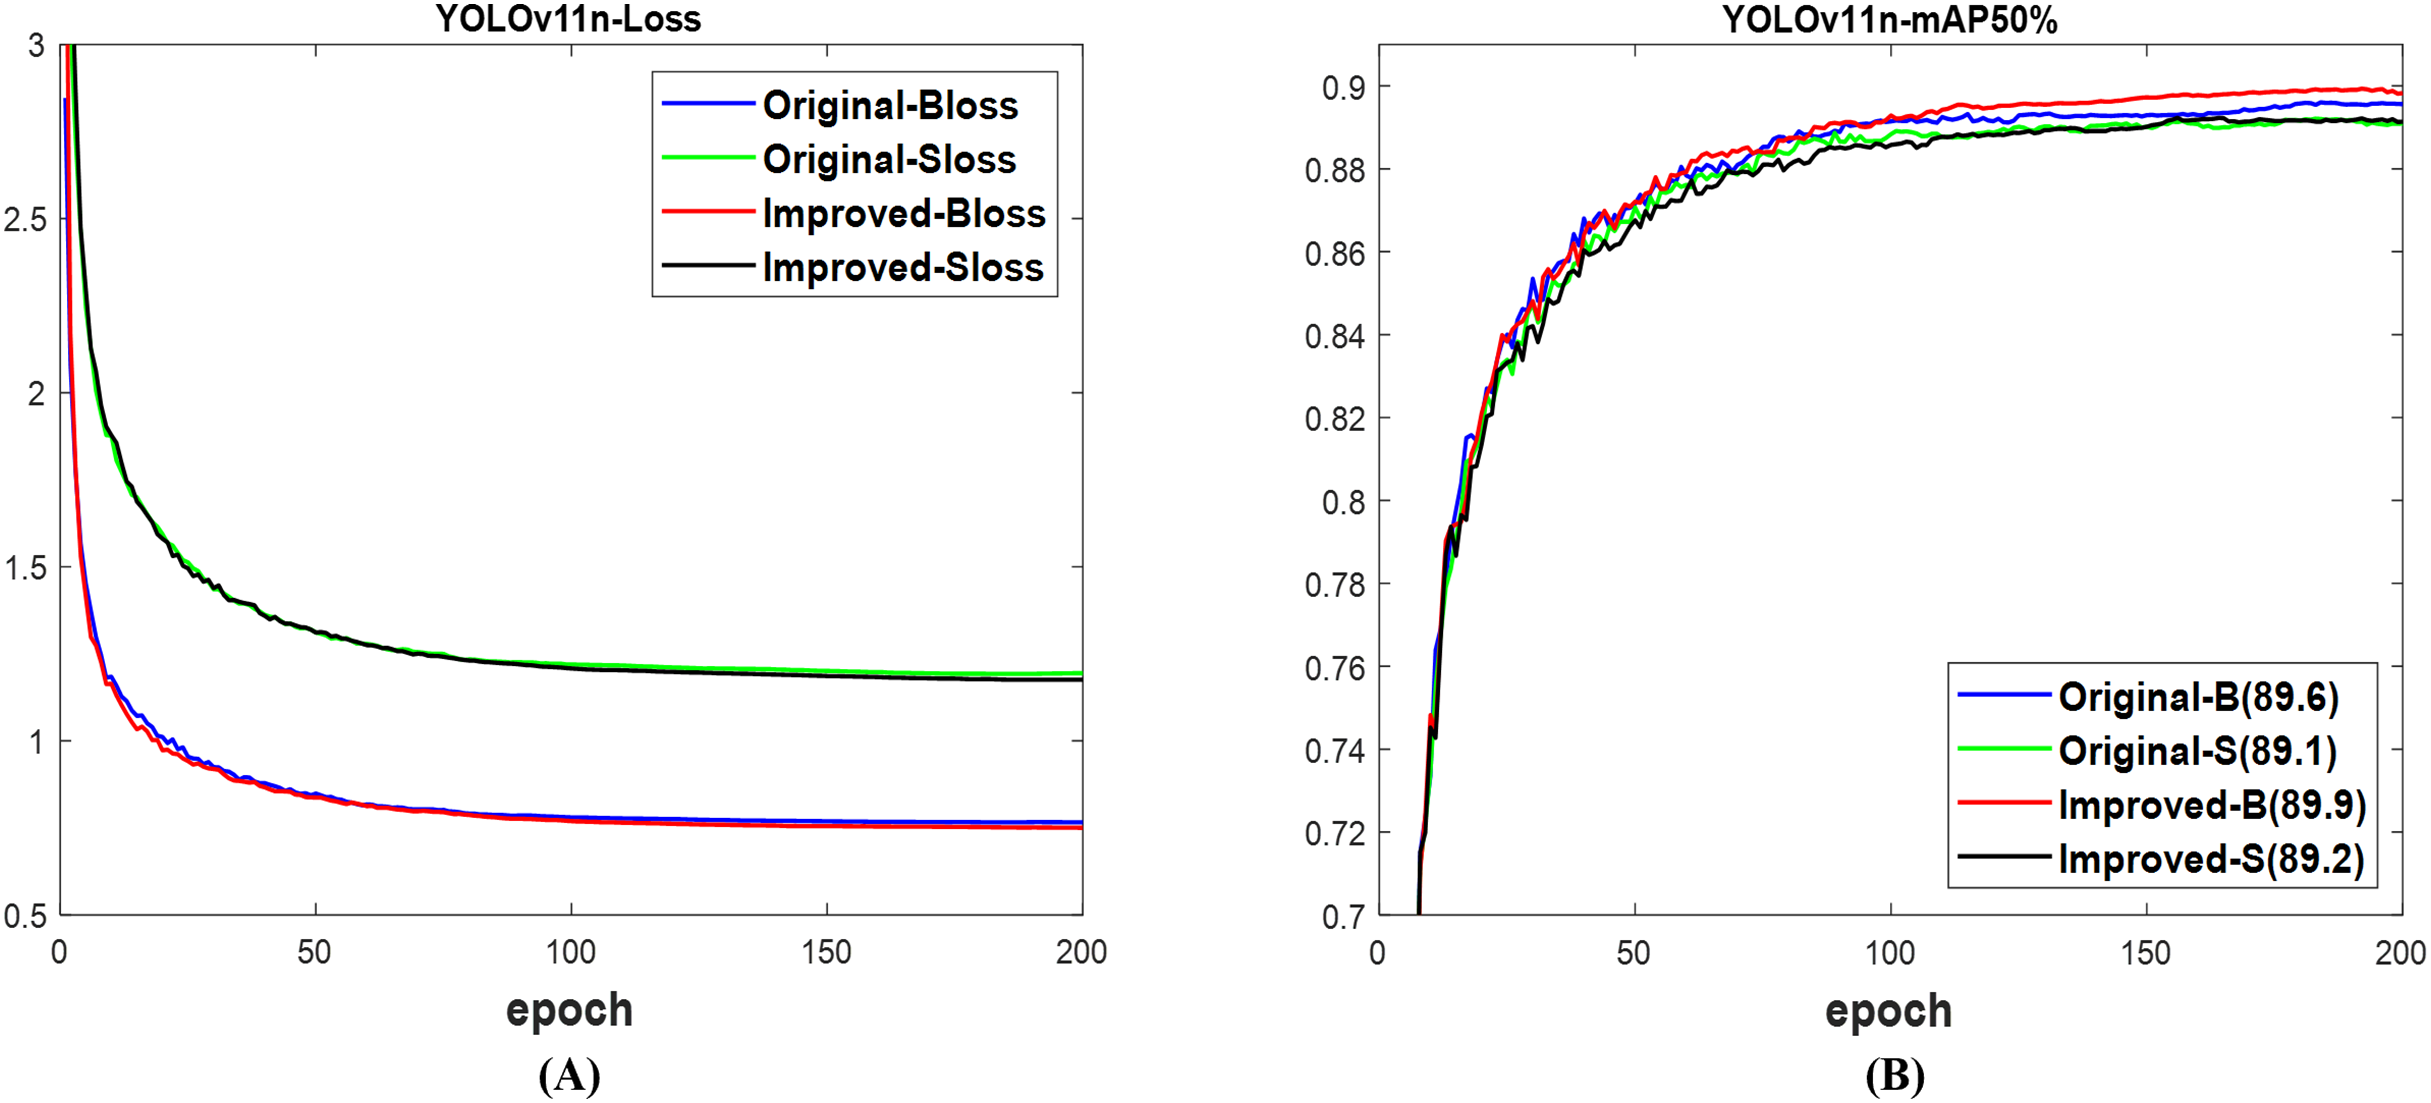
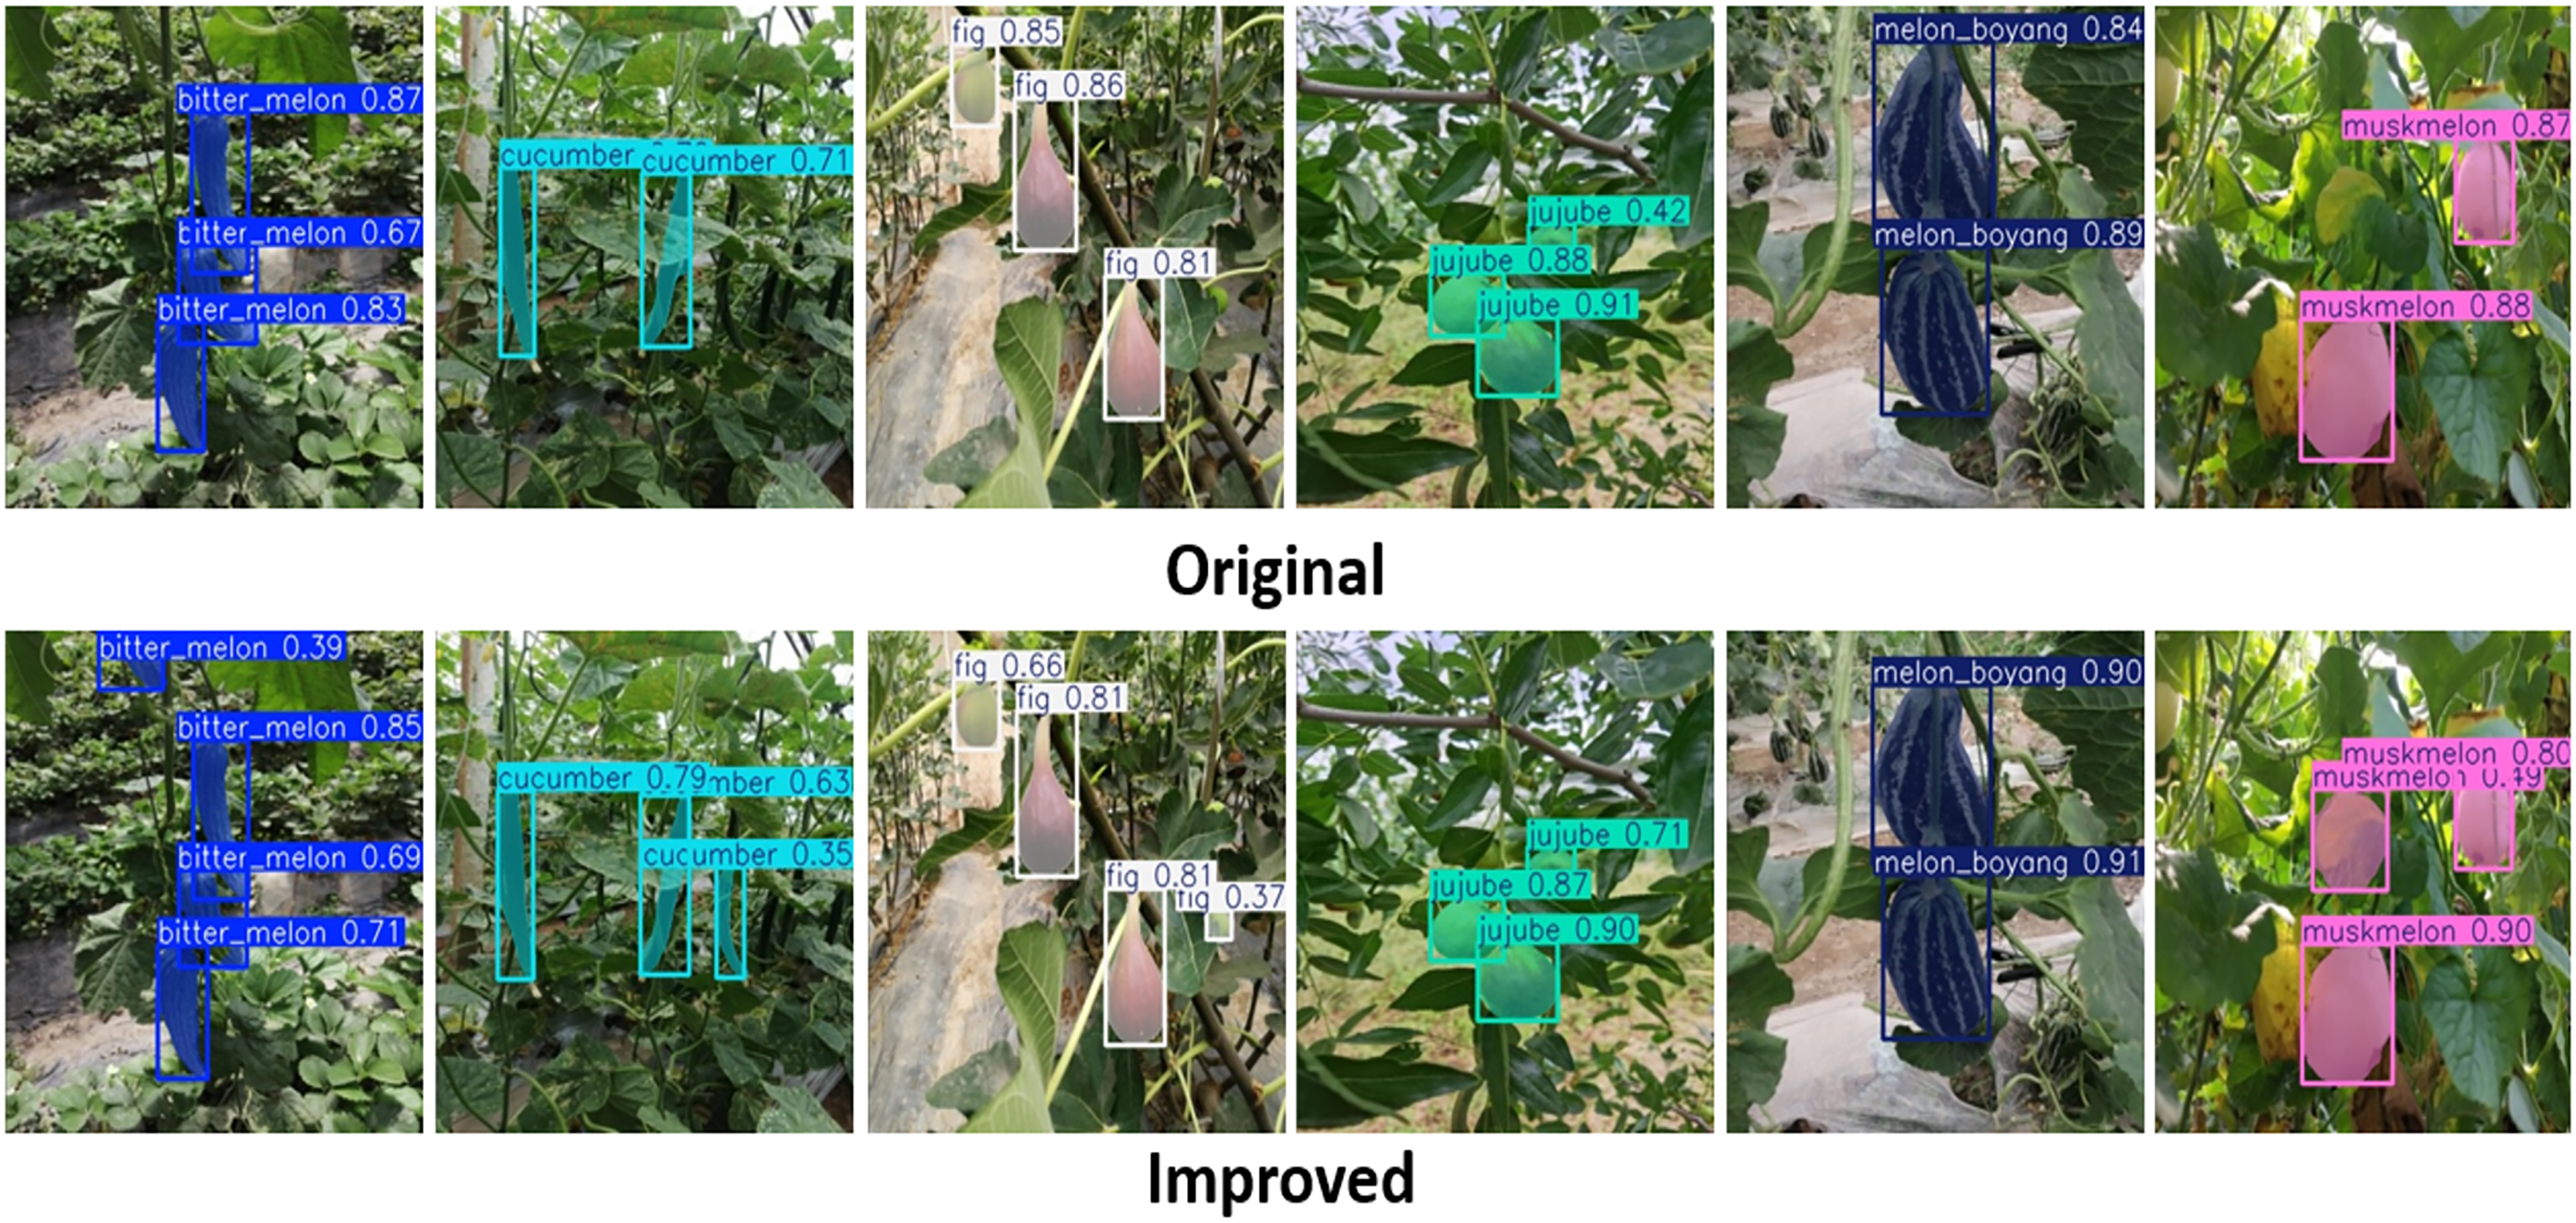
With YOLOv11n (Khanam & Hussain, 2024), both validation losses of the box and segmentation between improved and original networks show no significant difference, as displayed in Fig. 17A. The improved network outperformed the original network, achieving 89.9% mAP for the box and 89.2% mAP for the segment, compared to 89.6% and 89.1%, respectively, as shown in Fig. 17B. Just like other YOLO variants, Fig. 18 indicates that both networks successfully detected and segmented the numbers of fruit targets in the displayed images. Nonetheless, the improved YOLOv11n network’s confidence scores are greater than those of the original network. The original network was associated with missed detection, but the improved network was linked to incorrect detection, which can be accurately evaluated using Table 10. The evaluated results in Table 10 indicated that the computation costs of the improved network outperformed the original network. The improved network achieves 89.9% mAP box and 88.9% mAP segment, exceeding the original network’s 89.6% mAP box and 88.7% mAP segment, respectively. Concurrently, the improved network exhibits a reduced overall detection time compared to the original network. This establishes the outstanding performance of the improved network compared to the original network of YOLOv11n for fruit detection and instance segmentation.
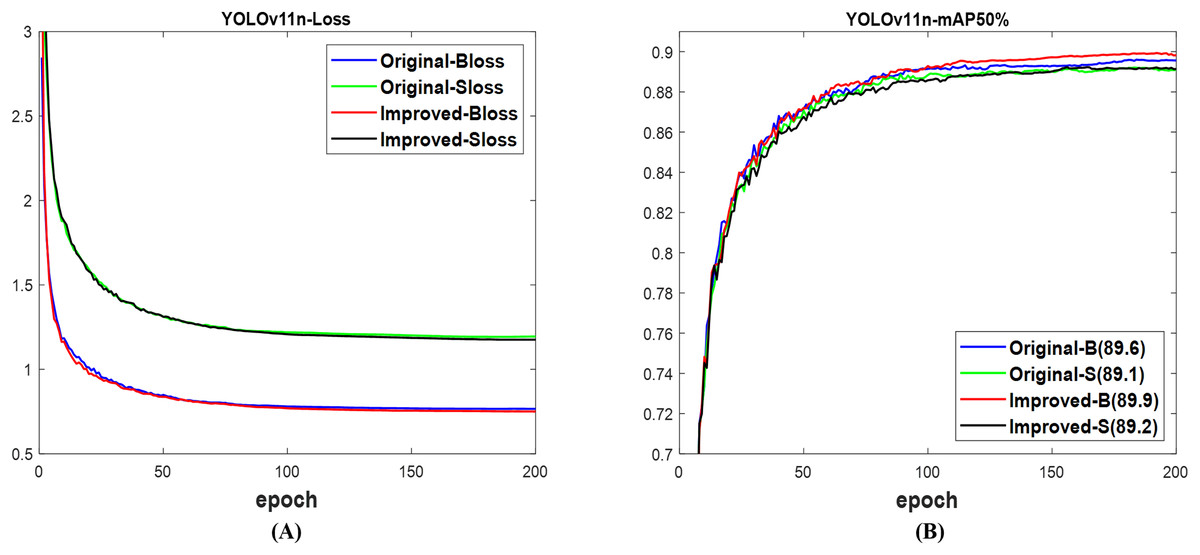
Figure 17: The results of original and improved networks of YOLOv11n using the valid set (A) valid loss and (B) mAP50%.
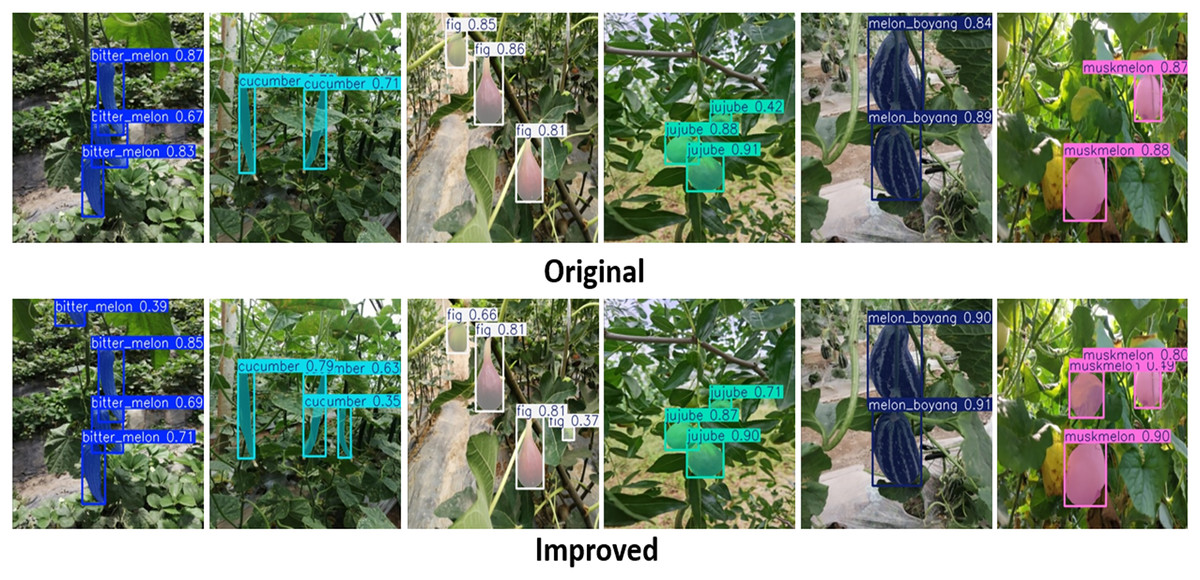
Figure 18: The detected fruit targets differentiate between the original and improved networks of YOLOv11n.
| YOLOv11n (test) |
Computation | Box@50% | Segment@50% | Time (ms) | ||||||||
|---|---|---|---|---|---|---|---|---|---|---|---|---|
| Params | GFLOPs | P | R | mAP | P | R | mAP | Tpre | Tinfer | Tpost | Total | |
| Original | 2.8 | 10.2 | 87.5 | 81.9 | 89.6 | 87.4 | 81.8 | 88.7 | 0.4 | 3.0 | 1.0 | 4.4 |
| Improved | 2.5 | 10.0 | 88.3 | 81.7 | 89.8 | 89.1 | 80.6 | 88.9 | 0.4 | 3.0 | 0.9 | 4.3 |
Comparison of YOLOvFIS with YOLO state-of-the-art
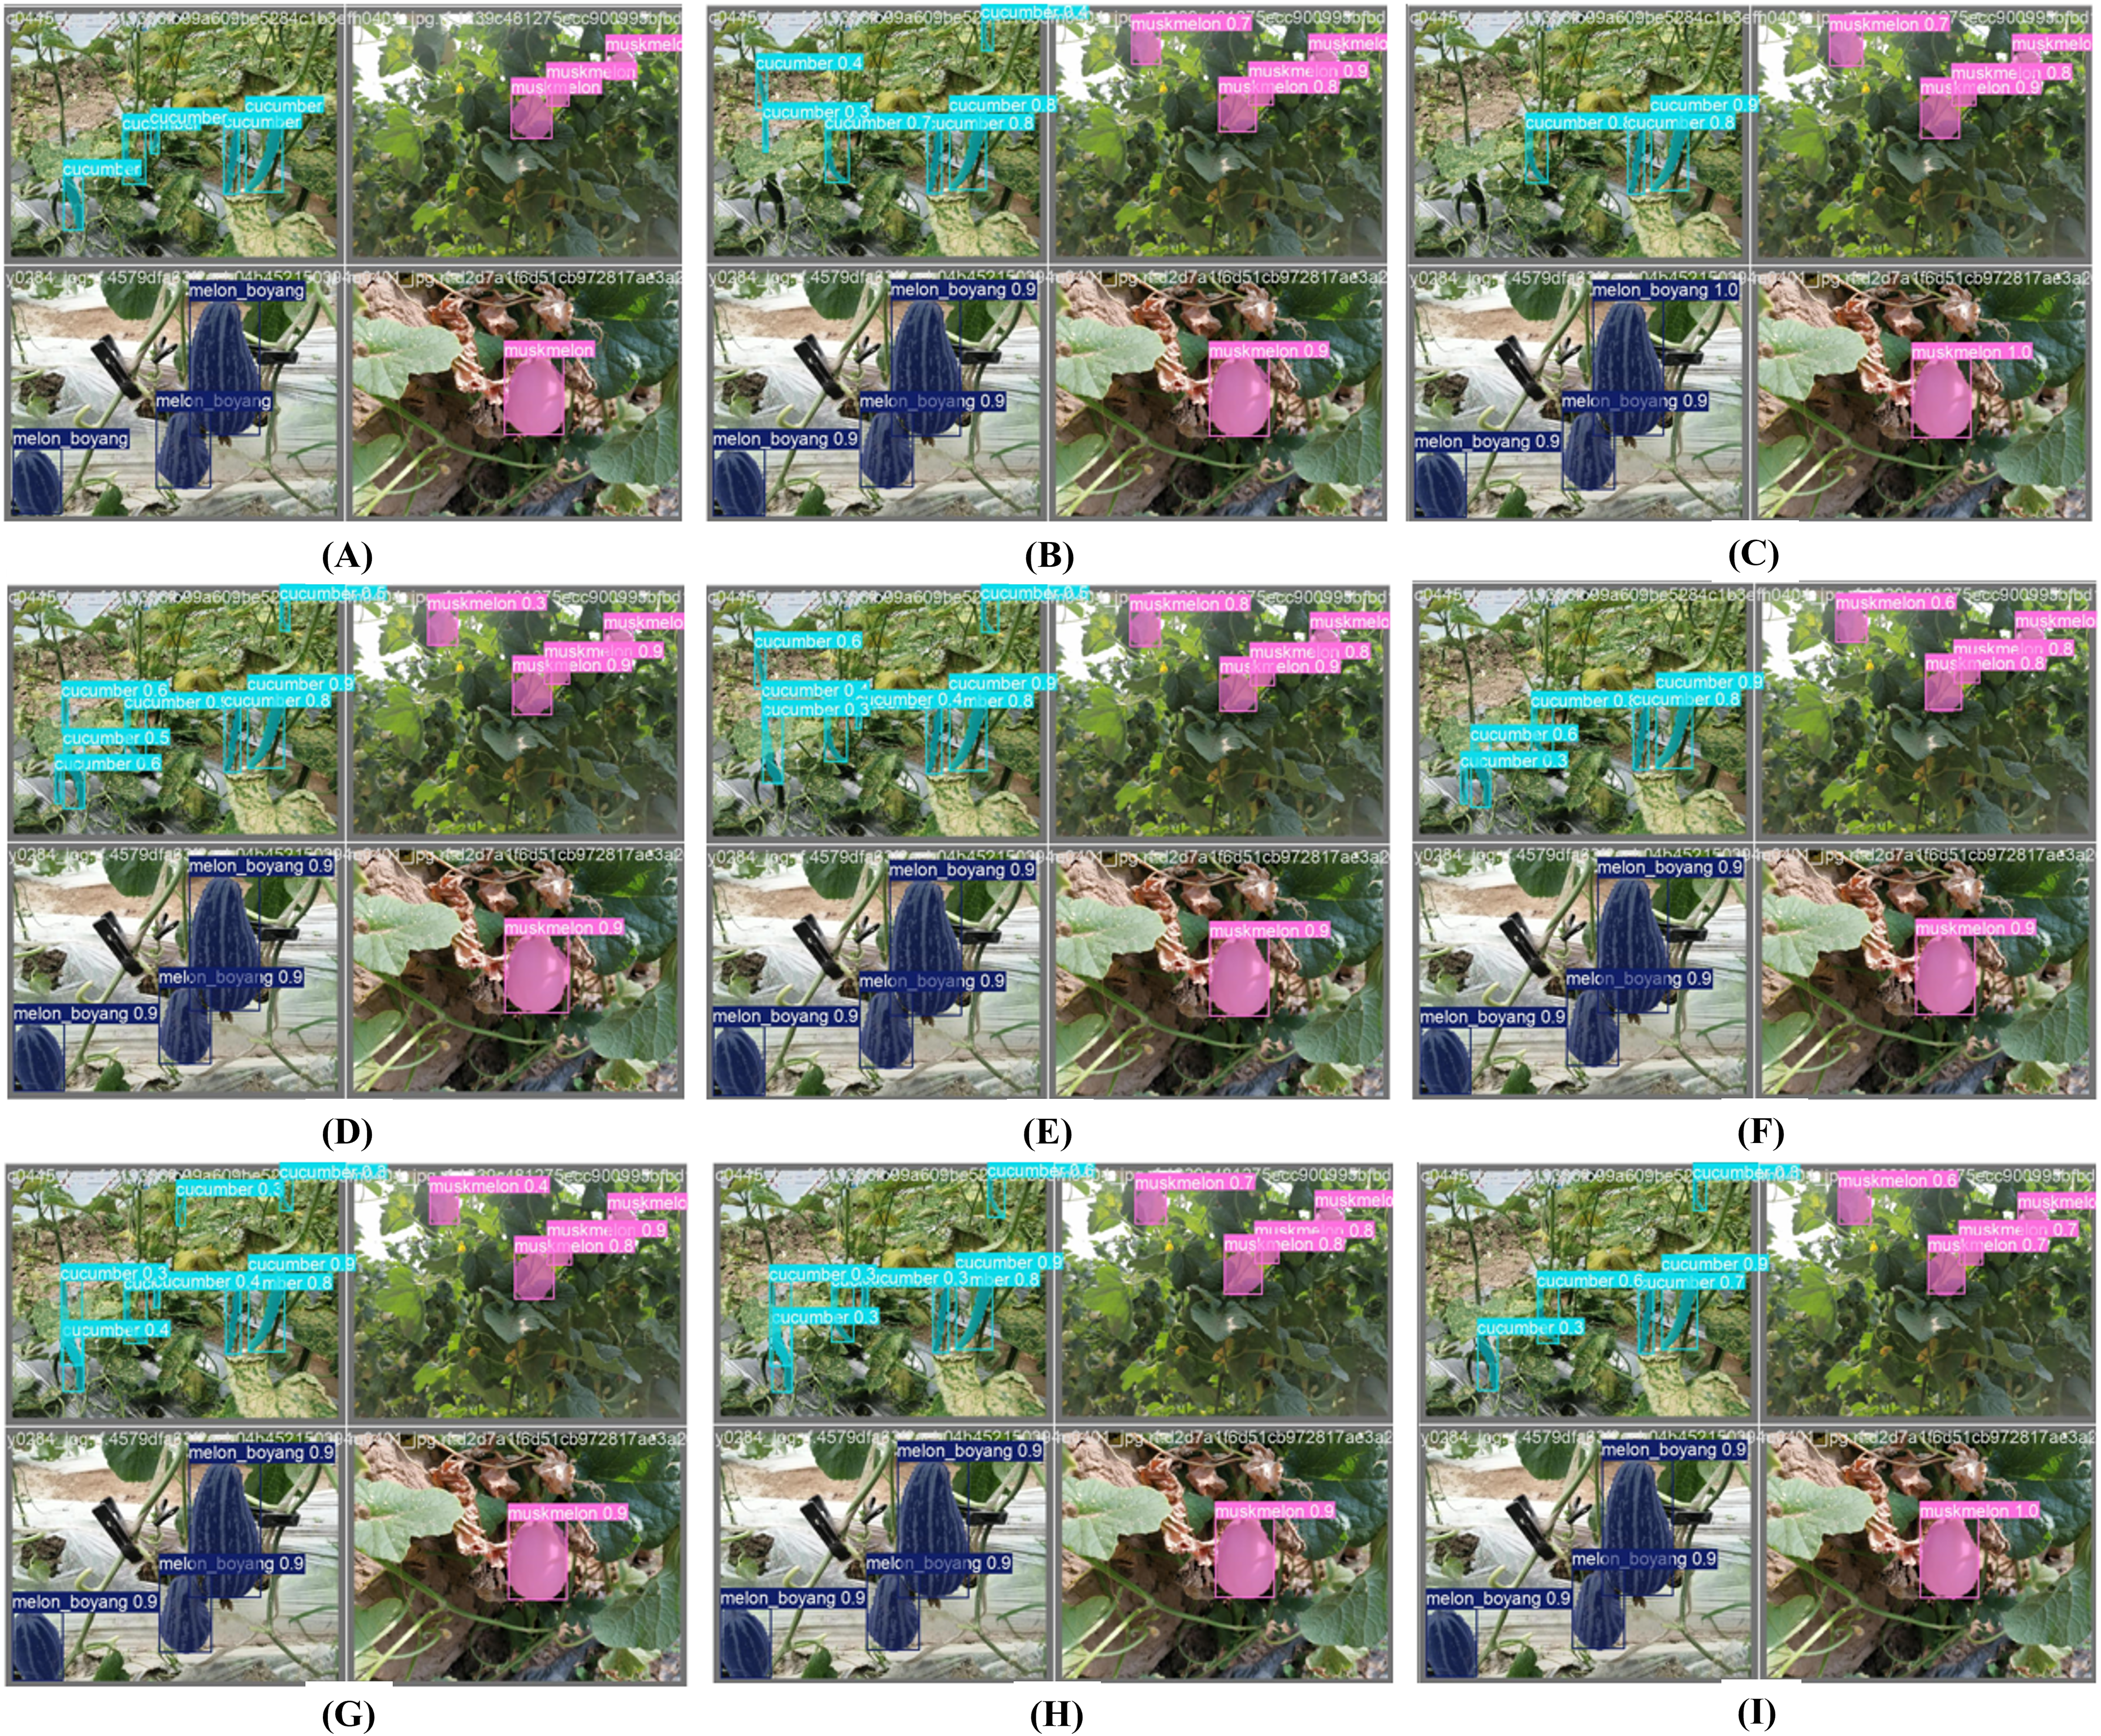
As shown in Fig. 19, the YOLO variants were able to detect and segment numbers of fruit targets in sample images to determine robustness and generalization. Nevertheless, the detected and segmented targets were associated with different confidence scores, missed detection, and incorrect detection. For example, the entire networks from Fig. 19B to Fig. 19I experienced incorrect detections against the actual label in Fig. 19A. In addition, Fig. 19I of YOLOvFIS gets the highest confidence score of a single muskmelon target in an image when compared to other YOLO networks from Fig. 19B to Fig. 19H. This is to say that the inherent limitations in the architecture of YOLO state-of-the-art networks are more than those of the YOLOvFIS network. Because it is very difficult to quantify the performance comparison between networks using the displayed images in Fig. 19, Eqs. (5) to (8) provide the evaluation metrics applied.
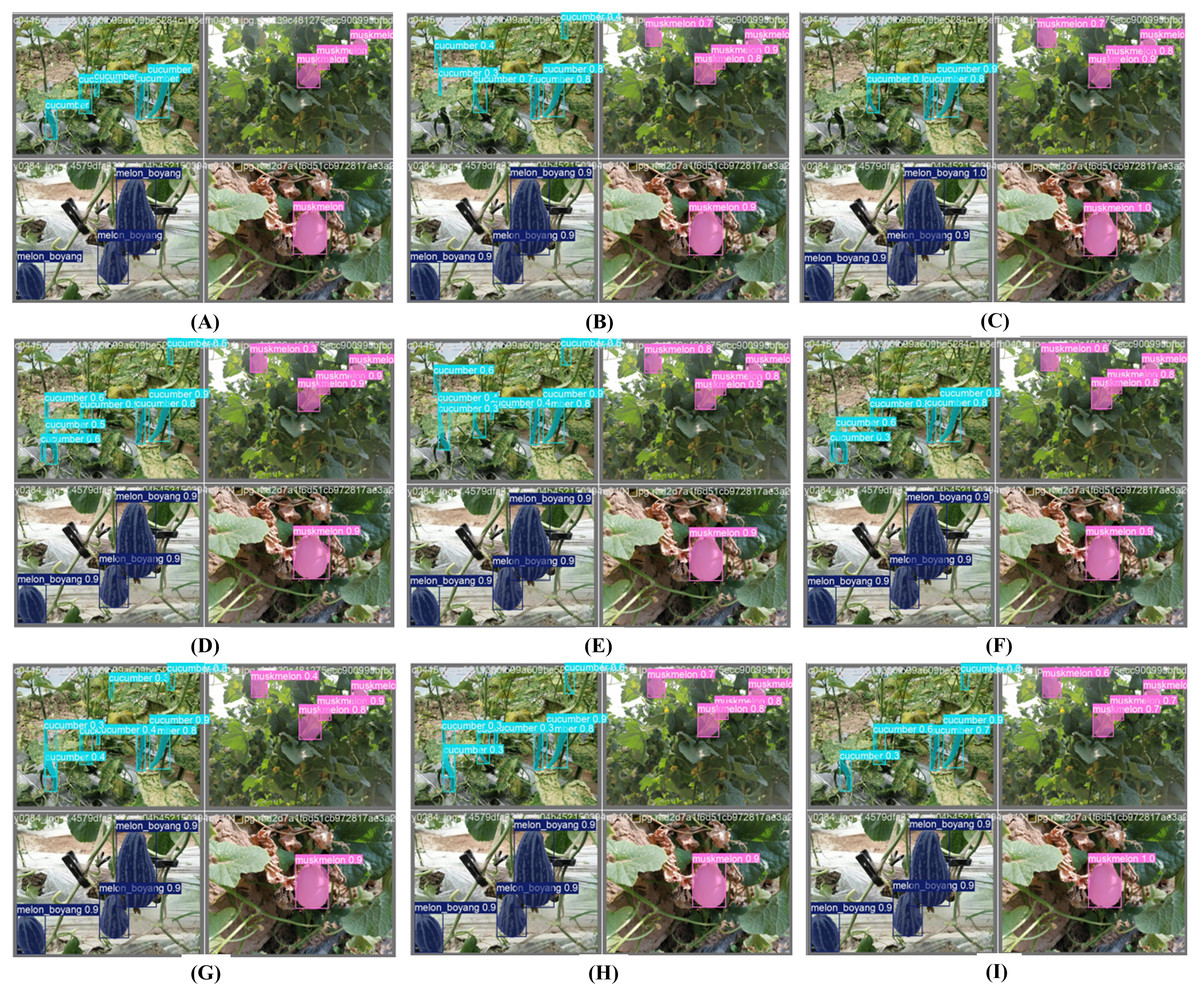
Figure 19: The detected and segmented fruit targets obtained from (A) actual label (B) YOLOv5n, (C) YOLOv6n, (D) YOLOv7t, (E) YOLOv8n, (F) YOLOv9t, (G) YOLOv10n, (H) YOLOv11n, and (I) YOLOvFIS networks.
The complete network structure of YOLOvFIS, as in Fig. 3, was evaluated using a test set and compared to YOLOv5n, YOLOv6n, YOLOv7t, YOLOv8n, YOLOv9t, YOLOv10n, and YOLOv11n. The collected findings are shown in Table 11. Using the computation costs, the params and GFLOPs of YOLOvFIS are 14.3%, 45.5%, 74.7%, 27.3%, 22.6%, 14.3%, and 14.3% decrease, and 9.1%, 34.2%, 85.7%, 16.7%, 81.5%, 14.5%, and 2.0% decrease of YOLOv5n, YOLOv6n, YOLOv7t, YOLOv8n, YOLOv9t, YOLOv10n, and YOLOv11n, respectively. The lower YOLOvFIS value results in a smaller weight size, making it more efficient in terms of memory, storage, and inference time. Suitable for real-time applications, edge devices, mobile devices, and other low-power computing devices. Table 11 indicates that the mAP of YOLOvFIS is 1.6%, 1.0%, 1.0%, 1.0%, 0.3%, 0.8%, and 0.4% more accurate than YOLOv5n, YOLOv6n, YOLOv7t, YOLOv8n, YOLOv9t, YOLOv10n, and YOLOv11n, respectively, for fruit detection. Similarly, it is 1.5%, 1.0%, 0.9%, 1.6%, 0.6%, 0.7%, and 0.7% more accurate than YOLOv5n, YOLOv6n, YOLOv7t, YOLOv8n, YOLOv9t, YOLOv10n, and YOLOv11n, respectively, for fruit instance segmentation. The mAP of YOLOvFIS enables optimized practices, increased efficiency, reduced wastage, and robotic integration compared to YOLO state-of-the-art networks. Meanwhile, the total time divided by 103 to obtain the detection speed in frames per second (FPS) shows that YOLOvFIS is 14%, −7.2%, 112.2%, 0.0%, 84.8%, 9.9%, and 7.5% faster than YOLOv5n, YOLOv6n, YOLOv7t, YOLOv8n, YOLOv9t, YOLOv10n, and YOLOv11n, respectively. Apart from YOLOv6n, which offers the fastest speed among the networks, the speed of YOLOvFIS drives efficiency, scalability, responsiveness, and better deployment.
| Networks (test) |
Computation | Box@50% | Segment@50% | Time (ms) | ||||||||
|---|---|---|---|---|---|---|---|---|---|---|---|---|
| Params | GFLOPs | P | R | mAP | P | R | mAP | Tpre | Tinfer | Tpost | Total | |
| YOLOv5n | 2.8 | 11.0 | 87.5 | 81.3 | 88.4 | 87.0 | 81.8 | 87.9 | 0.4 | 3.1 | 1.2 | 4.7 |
| YOLOv6n | 4.4 | 15.2 | 85.1 | 81.5 | 89.0 | 87.3 | 79.9 | 88.4 | 0.3 | 2.6 | 0.9 | 3.8 |
| YOLOv7t | 9.5 | 69.9 | 87.9 | 81.8 | 89.0 | 88.2 | 81.9 | 88.5 | 0.3 | 7.5 | 0.9 | 8.7 |
| YOLOv8n | 3.3 | 12.0 | 89.6 | 79.6 | 89.0 | 89.4 | 79.3 | 87.8 | 0.4 | 2.7 | 1.0 | 4.1 |
| YOLOv9t | 3.1 | 54.1 | 89.0 | 79.3 | 89.7 | 89.7 | 79.0 | 88.8 | 0.3 | 6.4 | 0.9 | 7.6 |
| YOLO10n | 2.8 | 11.7 | 87.0 | 81.6 | 89.2 | 90.1 | 79.0 | 88.7 | 0.5 | 2.8 | 1.2 | 4.5 |
| YOLOv11n | 2.8 | 10.2 | 87.5 | 81.9 | 89.6 | 87.4 | 81.8 | 88.7 | 0.4 | 3.0 | 1.0 | 4.4 |
| YOLOvFIS | 2.4 | 10.0 | 90.3 | 80.6 | 90.0 | 90.1 | 80.0 | 89.4 | 0.3 | 2.9 | 0.9 | 4.1 |
Conclusions
The designed YOLOvFIS for fruit detection and instance segmentation consists of backbone, neck, and head networks. The backbone network utilizes the combination of Conv, C4fR, SCDown, SPPFr, and PSA modules for the primary feature extractor. The neck network incorporated C3k2, Conv, and SCDown modules to aggregate and improve feature representations at various scales. It employs the head network of YOLOv8. A fruit image dataset with segmentation annotation was created for training, validation, and testing of YOLOvFIS, including other YOLO versions. The backbone of YOLOvFIS was added into YOLOv5n, YOLOv6n, YOLOv7t, YOLOv8n, YOLOv9t, YOLOv10n, and YOLOv11n to investigate its effectiveness for feature extraction, indicating that their improved network surpasses the original network. The improved network of YOLOv9t outperforms other YOLO networks but is lacking in total detection time. In comparison with the YOLO state-of-the-art networks, the entire YOLOvFIS network exceeds YOLOv5n, YOLOv6n, YOLOv7t, YOLOv8n, YOLOv9t, YOLOv10n, and YOLOv11n networks in terms of computing costs, mAP, and speed for fruit detection and instance segmentation. Consequently, YOLOvFIS demonstrates superior efficiency regarding optimized practices, memory, storage, and inference time, making it appropriate for real-time applications, robotic integration, and low-power computing devices compared to state-of-the-art YOLO networks. Future investigations will need to incorporate lightweight attention modules into the backbone to enhance the extraction of salient features. This improvement aims to boost the detection and segmentation of fruit in complex environments while ensuring real-time performance is maintained.