
Enhancing speech emotion recognition through parallel CNNs with transformer encoder and co-attention
- Published
- Accepted
- Received
- Academic Editor
- Aurora Saibene
- Subject Areas
- Algorithms and Analysis of Algorithms, Artificial Intelligence, Data Mining and Machine Learning, Natural Language and Speech, Sentiment Analysis
- Keywords
- Speech emotion recognition, Parallel networks, Transformer encoders, CNN, Co-attention mechanism, Deep learning
- Copyright
- © 2025 Hashem et al.
- Licence
- This is an open access article distributed under the terms of the Creative Commons Attribution License, which permits unrestricted use, distribution, reproduction and adaptation in any medium and for any purpose provided that it is properly attributed. For attribution, the original author(s), title, publication source (PeerJ Computer Science) and either DOI or URL of the article must be cited.
- Cite this article
- 2025. Enhancing speech emotion recognition through parallel CNNs with transformer encoder and co-attention. PeerJ Computer Science 11:e3254 https://doi.org/10.7717/peerj-cs.3254
Abstract
Speech emotion recognition (SER) plays a pivotal role in enabling machines to determine human subjective emotions based only on audio information. This capability is essential for enabling effective communication and enhancing the user experience in human-computer interactions (HCI). Recent studies have successfully integrated temporal and spatial features to improve recognition accuracy. This study presents a novel approach that integrates parallel convolutional neural networks (CNNs) with a Transformer encoder and incorporates a collaborative attention mechanism (co-attention) to extract spatiotemporal features from audio samples. The proposed model is evaluated on multiple datasets and uses various fusion methods. The parallel CNNs combined with a transformer and hierarchical co-attention yield the most promising performance. In version v1 of the ASVP-ESD dataset, the proposed model achieves a weighted accuracy (WA) of 70% and an unweighted accuracy (UW) of 67%. In version 2 of the ASVP-ESD dataset, the model achieves a WA of 52% and a UW of 45%. Furthermore, the model was evaluated on the ShEMO data set to confirm its robustness and effectiveness in diverse datasets, achieving a UW of 68%. These comprehensive evaluations across multiple datasets highlight the generalizability of the proposed approach.
Introduction
Human emotion recognition is crucial for successful human communication. It involves identifying and interpreting emotional states through cues such as facial expressions, body language, and tone of voice. This understanding enhances communication, fosters empathy, and strengthens social connections, thereby enriching our interactions and relationships (Khare et al., 2023). Automated human emotion recognition is one of the tasks that aims to enhance communication between humans and computers, which improves HCI (Cowie et al., 2001). It infers human emotions from various sources, including questionnaires, physical signals, and physiological indicators (Khare et al., 2023). Speech, as a form of physical signal, is essential in human communication and serves as a fundamental way of expressing emotions. It is one of the most commonly used mechanisms for identifying emotions among various physical signals (Shu et al., 2018). SER entails the automated prediction of a speaker’s emotional state by analyzing acoustic features in speech samples. The emotional state influences vocal characteristics, often displayed through prosodic, spectral, and other acoustic features (Hashem, Arif & Alghamdi, 2023). Therefore, research on SER systems has increased, as SER can be applied in real-life scenarios to address challenges in different domains and enhance communication between humans and computers (Cowie et al., 2001). Researchers have explored various fields of real-life applications. In the medical domain, SER significantly contributes to mental healthcare by automating the acquisition and analysis of emotional states from recordings. This technological approach provides crucial insights for formulating effective care strategies to monitor and treat mental illnesses (Madanian et al., 2022). In customer service, real-time customer emotion recognition proves advantageous in enhancing service quality and optimizing the overall customer experience (Han et al., 2020). In the educational domain, SER is utilized to determine students’ emotional states and measure their levels of engagement. This application contributes to advancing adaptive learning systems and enhancing overall student performance (Abdelhamid, 2023).
Recognizing human emotions from speech poses inherent difficulty and complexity, primarily attributed to the nuanced and subjective nature of emotions, which varies from one person to another (Bondi & Laurie, 2005). In SER systems, the fundamental components typically involve data pre-processing, feature extraction, and classification. Different algorithms used in SER incorporate machine learning (ML) and deep learning (DL) methodologies. Numerous possible approaches in SER can be categorized into three techniques. First, the process involves extracting handcrafted features and utilizing ML for classification. Second, adopting DL for classification can involve using handcrafted features or allowing DL to extract features through layers autonomously. Third, sound waves can be converted into images, such as Mel-frequency cepstral coefficients (MFCC) or spectrograms, and used as input for the DL model (Hashem, Arif & Alghamdi, 2023). DL methods tend to outperform traditional ML approaches, as most state-of-the-art results have been achieved using DL techniques due to their ability to learn hierarchical representations from data automatically. This enables them to capture complex patterns more effectively. DL models also demonstrate superior performance on tasks involving unstructured data, such as images, audio, and text, due to their capability to learn directly from raw inputs without the need for manual feature engineering (Sefara & Mokgonyane, 2020).
Audio signals represent temporal and spatial features. Combining these features provided a hybrid structure of information representations that contained important cues for conveying content and emotional nuances in SER (Ullah et al., 2023). Temporal features refer to the dynamic changes in the signal over time, including pitch modulation, intensity variations, and the duration of phonetic units. These temporal dynamics encode the rhythm, prosody, and timing of speech, contributing to the conveyance of emotion (Rosen, 1992). Through techniques like Fourier analysis, spatial characteristics reveal the spectral components of speech signals, where spatial features demonstrate energy distribution across various frequency bands (Radha, Bansal & Pachori, 2024). These spatial attributes provide insights into phonetic distinctions and vocal tract shaping, further enhancing the expressive capacity of speech. Thus, the fusion of temporal and spatial features in speech signals can enhance emotion recognition systems by encompassing various aspects of features, thereby enabling the interpretation of emotional states from acoustic cues. Ullah et al. (2023) observed that many existing SER systems are weak due to the absence of parallel neural architectures proficient at processing speech signals and extracting high-level deep spatiotemporal features. Therefore, some studies have addressed this issue by proposing a model that utilizes spatial and temporal feature representations of speech emotions through parallelizing convolutional neural networks (CNNs) and a Transformer encoder within the SER framework (Ullah et al., 2023; Han, Leng & Jin, 2021; Bautista, Lee & Shin, 2022; Saleem et al., 2023).
In SER, many existing models rely heavily on traditional feature extraction techniques, such as MFCC and spectrograms, which are often associated with CNNs. While these methods have succeeded, they overlook the intricate relationships between temporal and spatial features in speech data. Even when more advanced architectures, such as Parallel CNNs combined with Transformers, have been explored, the simple concatenation of feature outputs limits the ability to capture the complexity of emotions over time. It does not take into account the relative importance of features. This creates a gap in achieving reliable and robust performance in real-world applications where emotions are dynamically expressed.
This work addresses these challenges and presents an approach that recognizes emotions only from speech signals. The approach utilizes features extracted from these signals and leverages the strengths of DL models by combining parallel CNNs with Transformers and incorporating a collaborative attention mechanism (co-attention). While prior SER approaches have shown promise, they often struggle to effectively integrate spatial and temporal features within a unified framework, resulting in limited performance in capturing subtle emotional expressions. Previous studies have explored the combination of parallel CNNs and transformer encoders, often using simple concatenation methods to combine feature outputs (Ullah et al., 2023; Han, Leng & Jin, 2021; Bautista, Lee & Shin, 2022; Saleem et al., 2023), However, this study distinguishes itself by introducing a co-attention mechanism into this architecture, allowing the model to learn cross-representational dependencies between CNN and Transformer outputs dynamically. This work suggests adding a co-attention mechanism to combine these features more effectively. Instead of simply combining CNN and transformer outputs, the model learns to focus on the most relevant aspects of both, allowing it to capture subtle emotional cues in speech. The two-parallel CNN architecture extracts spatial features from MFCC and spectrogram inputs while expanding the receptive field. Meanwhile, the Transformer encoder captures long-term dependencies in the temporal domain. Unlike previous methods that treat all features as equally important, co-attention integration enhances the model’s ability to focus on global and local emotional cues within the speech signals, allowing for a deeper understanding of how emotions unfold over time. By focusing on the most salient features of the input data and mitigating the impact of less critical components, this framework offers a comprehensive analysis of speech data, thereby directly addressing the limitations in previous SER models related to the ineffective fusion of acoustic features.
The main contributions of this study are summarized as follows:
Leveraged a natural speech dataset with real-world conditions and diverse emotional labels, enhancing the model’s robustness and generalizability.
Proposed a co-attention mechanism to focus on relevant features and reduce the influence of less informative parts.
Explored four fusion strategies combining CNN and Transformer features:
-
–
Initial architecture: Simple concatenation of the three input streams.
-
–
Second architecture: Concatenation with co-attention fusion applied to the two CNN branches before integration with the Transformer.
-
–
Third architecture: Hierarchical co-attention fusion, inspired by prior research (Tian, Moore & Lai, 2016; Pascual et al., 2019), aiming to integrate features progressively from low to high levels in line with the hierarchical nature of speech.
-
–
Final architecture: A single co-attention mechanism applied across all three inputs (two CNNs and the Transformer) simultaneously.
-
Applied additive white Gaussian Noise (AWGN) for data augmentation to improve noise robustness.
Conducted ablation studies to evaluate the contribution of each system component.
The rest of the article is organized as follows: ‘Related Work’ presents the related work. ‘SER Framework’ covers the SER framework, explaining the SER model and the fusion methods. ‘Experimental Setup’ explains the experimental setup, which involves datasets, pre-processing, data augmentation techniques, feature extraction, model training, and evaluation metrics. ‘Results and Discussion’ presents the results and discussion. ‘Ablation Study’ represents the ablation study, and ‘Conclusions’ concludes this study. A complete list of acronyms used in this study is provided in ‘List of Acronyms’.
Related work
SER involves essential steps such as preprocessing speech signals, extracting salient features, and classifying emotions, where each step influences the final result. Exploring SER has been studied from different aspects for decades, focusing on different classifiers and speech features. Prior studies mainly used classical ML methodologies for the classification of emotions. During these earlier studies, researchers employed various ML algorithms in SER, such as support vector machines (SVM) (Sinith et al., 2015), Gaussian mixture models (GMM) (El Ayadi, Kamel & Karray, 2007), hidden Markov models (HMM) (Nwe, Foo & De Silva, 2003), k-nearest neighbors classifiers (kNN) (Lanjewar, Mathurkar & Patel, 2015).
Recent studies have turned towards using DL classifiers in emotion recognition. Various DL approaches used include deep neural networks (DNN) (Fahad et al., 2021a), deep Boltzmann machine (DBM) (Poon-Feng et al., 2014), convolutional neural networks (CNN) (Qayyum, Arefeen & Shahnaz, 2019), recurrent neural networks (RNN) (Mirsamadi, Barsoum & Zhang, 2017), and long short-term memory (LSTM) (Xie et al., 2019). This change indicates a developing approach in the methods used for recognizing emotions, where DL has become the most common (Sefara & Mokgonyane, 2020). Significant advancements have been made in the field of recognizing emotions in speech. These enhancements underscore a more robust emphasis on extracting and utilizing spatial and temporal features to enhance the accuracy and reliability of emotion recognition. This overview examines critical works within the domain, where researchers have strategically employed frameworks such as CNNs with recurrent models, including RNNs, LSTM networks, and Transformer architectures (Lim, Jang & Lee, 2016; Bautista, Lee & Shin, 2022). Recognizing emotional nuances in speech involves leveraging the spatiotemporal characteristics embedded in audio signals. Central to these investigations is incorporating widely recognized feature representations, specifically MFCC and mel-spectrograms, as input to the neural network architectures. Adopting these input features is a pivotal step toward capturing both the spatial distribution of acoustic information across frequency bands and the temporal dynamics inherent in spoken expressions.
Given the recent success of Transformers, an increasing number of researchers in the speech recognition field are combining them into their work, which has helped overcome some limitations associated with other models (Ullah et al., 2023; Han, Leng & Jin, 2021; Bautista, Lee & Shin, 2022; Saleem et al., 2023; Slimi, Nicolas & Zrigui, 2022).
Han, Leng & Jin (2021) introduced a parallel network architecture for speech emotion recognition, which combines three blocks: the Transformer encoder, CNN, and ResNet. The activation function employed in the ResNet is named Gaussian Error Linear Unit (GELU), which addresses the vanishing gradient problem that is often challenging in deeper networks. Additionally, CNN decreases the number of parameters, which improves the network’s expressive capability. To consider speech continuity over time, the Transformer encoder utilizes a multi-head self-attention layer to predict the frequency distribution of various emotions. The ResNet and CNN results are converted into one-dimensional vectors through a flattening process to combine models, and these vectors are concatenated with the Transformer result. Finally, a fully connected layer was followed by a softmax layer to classify eight emotions. MFCCs were used as input features and were tested on the RAVDESS dataset, achieving a classification accuracy of 80.89%.
A similar study was conducted by Bautista, Lee & Shin (2022), replacing ResNet with parallel CNNs. They explored different neural architectures and investigated the impact of various data augmentation methods. The evaluated data augmentation methods include Room Impulse Response (RIR), SpecAugment, Tanh Distortion, and Additive White Gaussian Noise (AWGN). The neural architectures under comparison include CNN2D (VGG16), CNN+BiLSTM+Attention, and parallel CNNs+Transformer. They used a linear layer for all three models to concatenate the inputs. The models employed the Mel spectrogram as an input feature and were evaluated using the RAVDESS dataset, achieving an accuracy of 89.33% for the Parallel CNN-Transformer network.
Following this, Ullah et al. (2023) introduced a model based on building a framework similar to the previous study (Bautista, Lee & Shin, 2022), where they developed a method to integrate temporal and spatial information in SER by utilizing parallel CNNs and a Transformer. The approach involves stacking two parallel CNNs for spatial features alongside a Transformer encoder for temporal features. They used a fully connected layer to combine the embedding lengths obtained from the CNN and the Transformer, thereby achieving the final result. However, this study incorporates skip connections between the two CNN modules (CNN-Skip) to preserve gradient flow in deep neural networks, thereby addressing the issue of vanishing gradients as the error signal propagates to prior layers. This simultaneous expansion of filter depth and reduction of feature maps enhances the hierarchical representation of features. The evaluation is performed on the RAVDESS dataset, incorporating data augmentation using AWGN to minimize overfitting. For eight emotions, the SER model achieves an accuracy of 82.31% using spatial and sequential feature representations. Furthermore, the SER system is evaluated using the IEMOCAP dataset, achieving a recognition accuracy of 79.42% for five emotions.
The co-attention mechanism proposed by Lu et al. (2019) involves concatenating two hidden-state vectors. In this mechanism, these vectors exchange key-value pairs in the inputs, enabling the incorporation of features from one input channel into the other. The co-attention mechanism has been utilized in SER for concatenation. To enhance the results of the SER, some researchers attempted to incorporate additional resources beyond the audio samples. Li, Bell & Lai (2022) proposed a hierarchical co-attention fusion model that integrates audio and text features. Different ASR outputs and fusion methods were examined. The fusion techniques included concatenation, concatenation with co-attention fusion, and hierarchical co-attention fusion. These techniques combine three encodings from the self-attention layer to generate a comprehensive vector for the classification task. The findings demonstrate that incorporating ASR and text through hierarchical co-attention fusion significantly improves SER performance within the context of joint ASR-SER training.
Zou et al. (2022) presented an end-to-end model for SER that utilizes multi-level acoustic information with a co-attention. The model extracts multi-level acoustic information using a CNN for spectrograms, BiL-STM for MFCC, and Wav2Vec2 for the embedded high-level acoustic information. These multimodal feature inputs are fused using a co-attention mechanism. The co-attention module combines different frames of weighted Wav2Vec2 embeddings (W2Es) with frame weights generated by MFCC and spectrogram features. The co-attention mechanism enables the fusion of multi-level acoustic information by focusing on different frames of the W2Es based on the importance assigned by the MFCC and spectrogram features. Recent studies have introduced alternative architectures aimed at addressing key limitations in DL models for SER, where proposed a capsule-enhanced neural network (CENN) (Zhang et al., 2024). This approach combines multi-head attention, ResNet blocks, and capsule layers to capture hierarchical and spatial relationships in acoustic features. This architecture demonstrated improvements in both performance consistency and reproducibility across multiple SER datasets. Unlike traditional CNN- or LSTM-based models, the CENN leverages capsule routing to retain pose and part-whole relationships within speech signals, providing a more structured representation of emotional cues.
Due to a lack of a natural emotional database, Dejoli et al. (2020) aimed to collect a realistic ASVP-ESD dataset containing six basic categories. Their approach consisted of two stages. First, silence detection was applied to obtain sound segments. The Mel-spectrogram feature was extracted from these segments, serving as the input for the first stage of processing. CNN-BLSTM was used for the recognition task. The second stage involved a combination of MFCC, ZRC rate, log-mel, and chroma features, with VGG being utilized to recognize the emotion. As a result, they achieved a 74.39% success rate. Zaiem et al. (2023) utilized the ASVP-ESD dataset to assess model generalization abilities for zero-shot testing in emotion recognition tasks. They used it to test the impact of larger-capacity probing heads on performance, inference costs, generalization, and multi-level feature exploitation in speech self-supervised learning (SSL) benchmarking. The best result on the dataset was a mean accuracy of 32.17% with the ECAPA-TDNN probing head, compared to 20.97% with a time-pooling followed by a linear decode. Malik et al. (2023) utilized the ASVP-ESD dataset and developed a non-speech emotion recognition system for edge computing, with a focus on scream detection and classification. Sawin (2023) studied the key aspects of SER, including feature extraction. Mel spectrograms are used as input for ML algorithms and neural networks. Various ML algorithms are compared, including SVM, Multi-layer Perceptron Classifier (MLP), and Decision Tree Classifier (DTC), each with its preprocessing requirements. Neural networks are central to the proposed framework, with a focus on CNNs and transfer learning using EfficientNet-B4. Comprehensive experiments conducted using datasets, preprocessing methods, algorithms, and network architectures demonstrate the effectiveness of CNNs and the proposed framework in accurately classifying emotions from audio files. The model achieved an accuracy of 50.27% and a recall (macro) of 51.01% on the ASVP-ESD dataset. Kakuba, Poulose & Han (2023) utilized the ASVP-ESD dataset and combined it with other datasets, such as RAVDESS, TESS, and SAVEE, to create a more diverse and realistic training set for bimodal speech emotion recognition experiments. This approach aimed to tackle data scarcity issues and thus enhance performance.
This study aims to integrate concepts from previous studies that leverage spatial and temporal features extracted from parallel CNNs and Transformers. Our contribution involves incorporating a co-attention mechanism with parallel CNNs and a Transformer model. Different fusion methods have been tested and explored to determine the most effective way of incorporating co-attention. Moreover, the study also investigates the effectiveness of various features and augmentation techniques in increasing the dataset’s diversity, thereby enhancing the robustness and generalizability of the proposed model.
SER framework
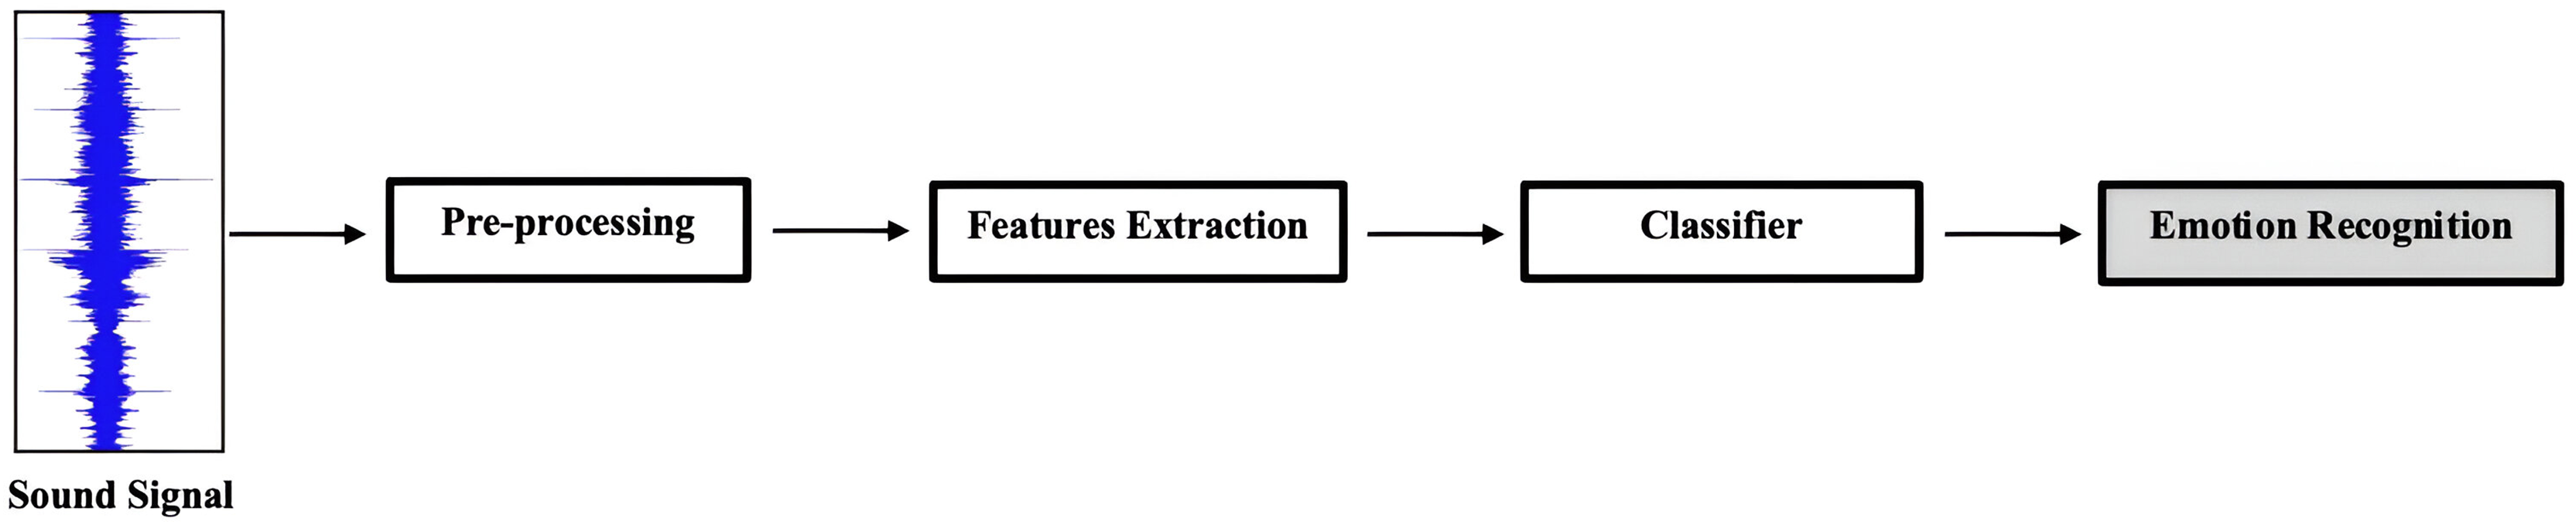
This section focuses on the main blocks of the model used to recognize emotional states from speech signals. As illustrated in Fig. 1, the general framework of SER begins with the input of an audio signal, followed by preprocessing steps such as denoising and pre-emphasis, and then feature extraction. The classifier analyzes the preprocessed features and predicts the corresponding emotion labels. Finally, the SER system outputs the recognized emotion based on the classification results obtained from the classifier. The proposed SER model includes two CNN blocks, a parallel multi-head attention Transformer encoder block, and a Co-Attention Mechanism. Using different methods, co-attention components are employed to share weights between the two inputs, which will be discussed in ‘Experimental Setup’. The approach combines a CNN for spatial feature representation and a Transformer for temporal feature representation. A fully connected dense network (FCDN) is incorporated to recognize the final emotional state from speech signals.
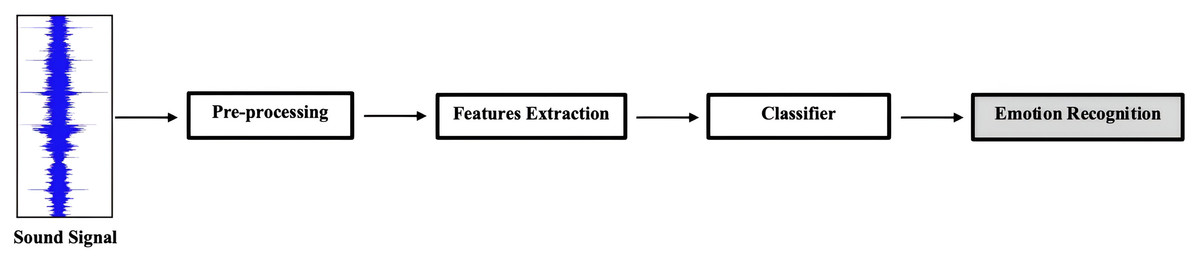
Figure 1: The general flow of the SER models begins with input audio, the pre-processing step, extracting the acoustic features used to train the classifier, and then recognizing the emotional state.
Parallel CNNs block
The size of the input region responsible for feature generation is known as the receptive field. There is a strong correlation between classification accuracy and receptive field size, indicating that an expanded receptive field contributes to improved classification performance (Araujo, Norris & Sim, 2019). To achieve this, two parallel CNNs are employed to expand the receptive field and enhance feature extraction by combining information from MFCC and spectrogram.
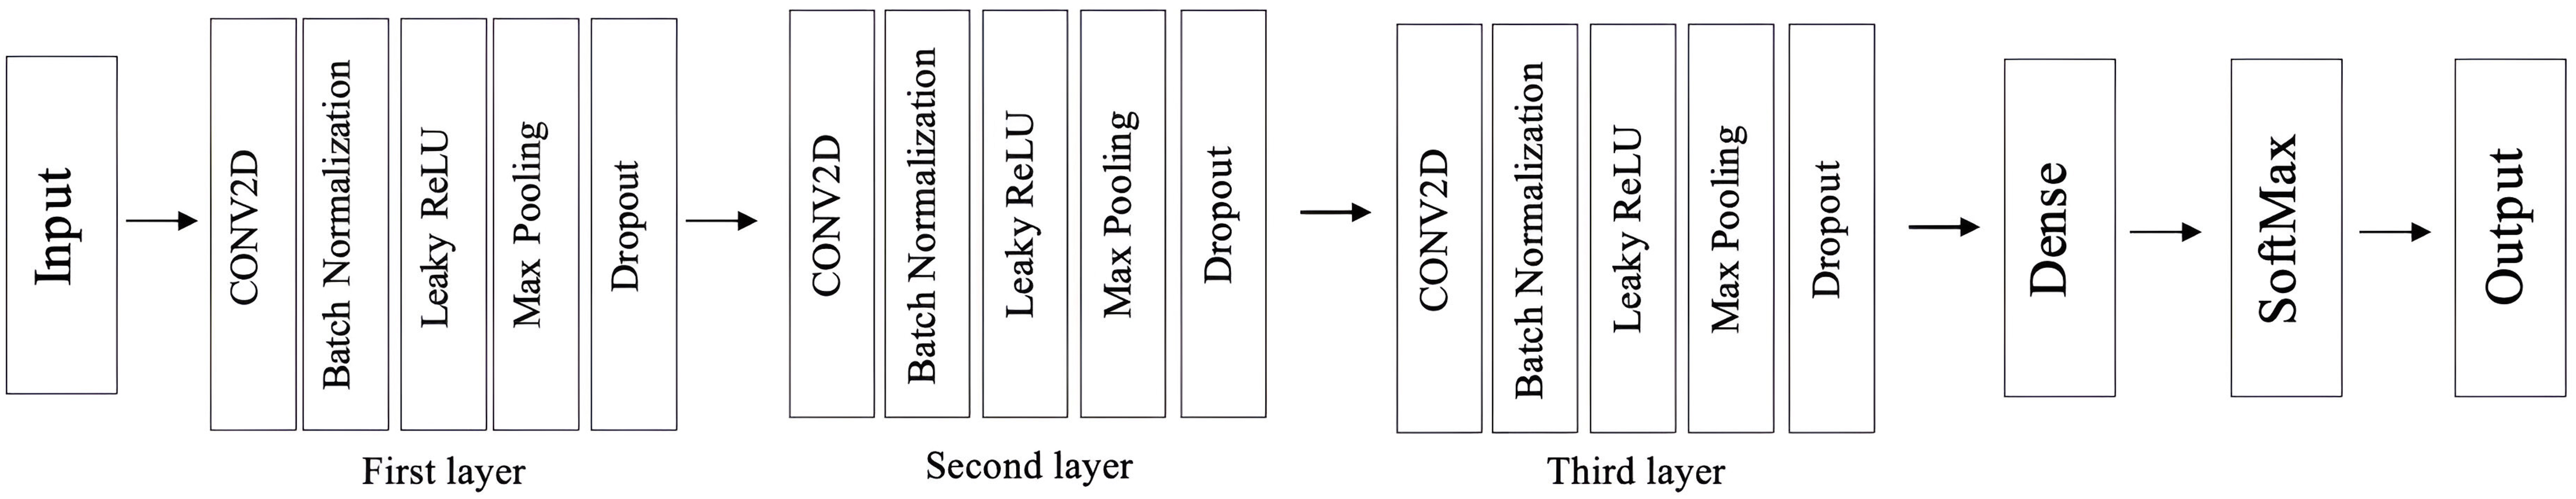
CNNs with 2D convolutional layers are the standard in image processing and are designed to process input feature maps in the format (batch size, channel, height, width) (Zenkov, 2020). The two parallel CNNs in this study are structurally identical and include multiple layers for feature extraction, consistent with previous works (Han, Leng & Jin, 2021; Bautista, Lee & Shin, 2022; Ullah et al., 2023). Each CNN consists of three sequential 2D convolutional layers, followed by batch normalization, Leaky ReLU activation, max-pooling, and dropout. The first CNN starts with an input channel depth of 1 and expands the output feature map depth to 16, 32, and 64 across the three convolutional layers. Each layer uses a 3 3 kernel with a stride of 1 and padding of 1. The max-pooling layers have kernel sizes of 2 2, 4 4, and 4 4, respectively. A 30% dropout rate is applied after each max-pooling layer. Figure 2 illustrates the CNN block architecture.
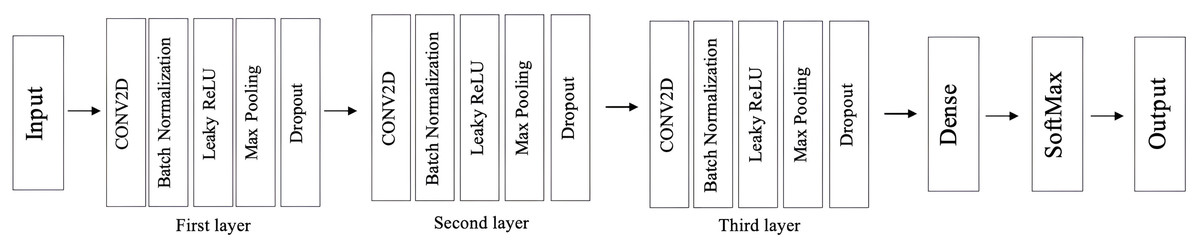
Figure 2: The architecture incorporates one CNN, while the proposed model integrates two parallel CNNs.
The second CNN mirrors the first, using the same configuration and hyperparameters. It also starts with an input channel depth of 1 and progressively increases the feature map depth to 16, 32, and 64. This architectural symmetry ensures uniform and concurrent processing of input data, enhancing feature extraction.
Transformer encoder block
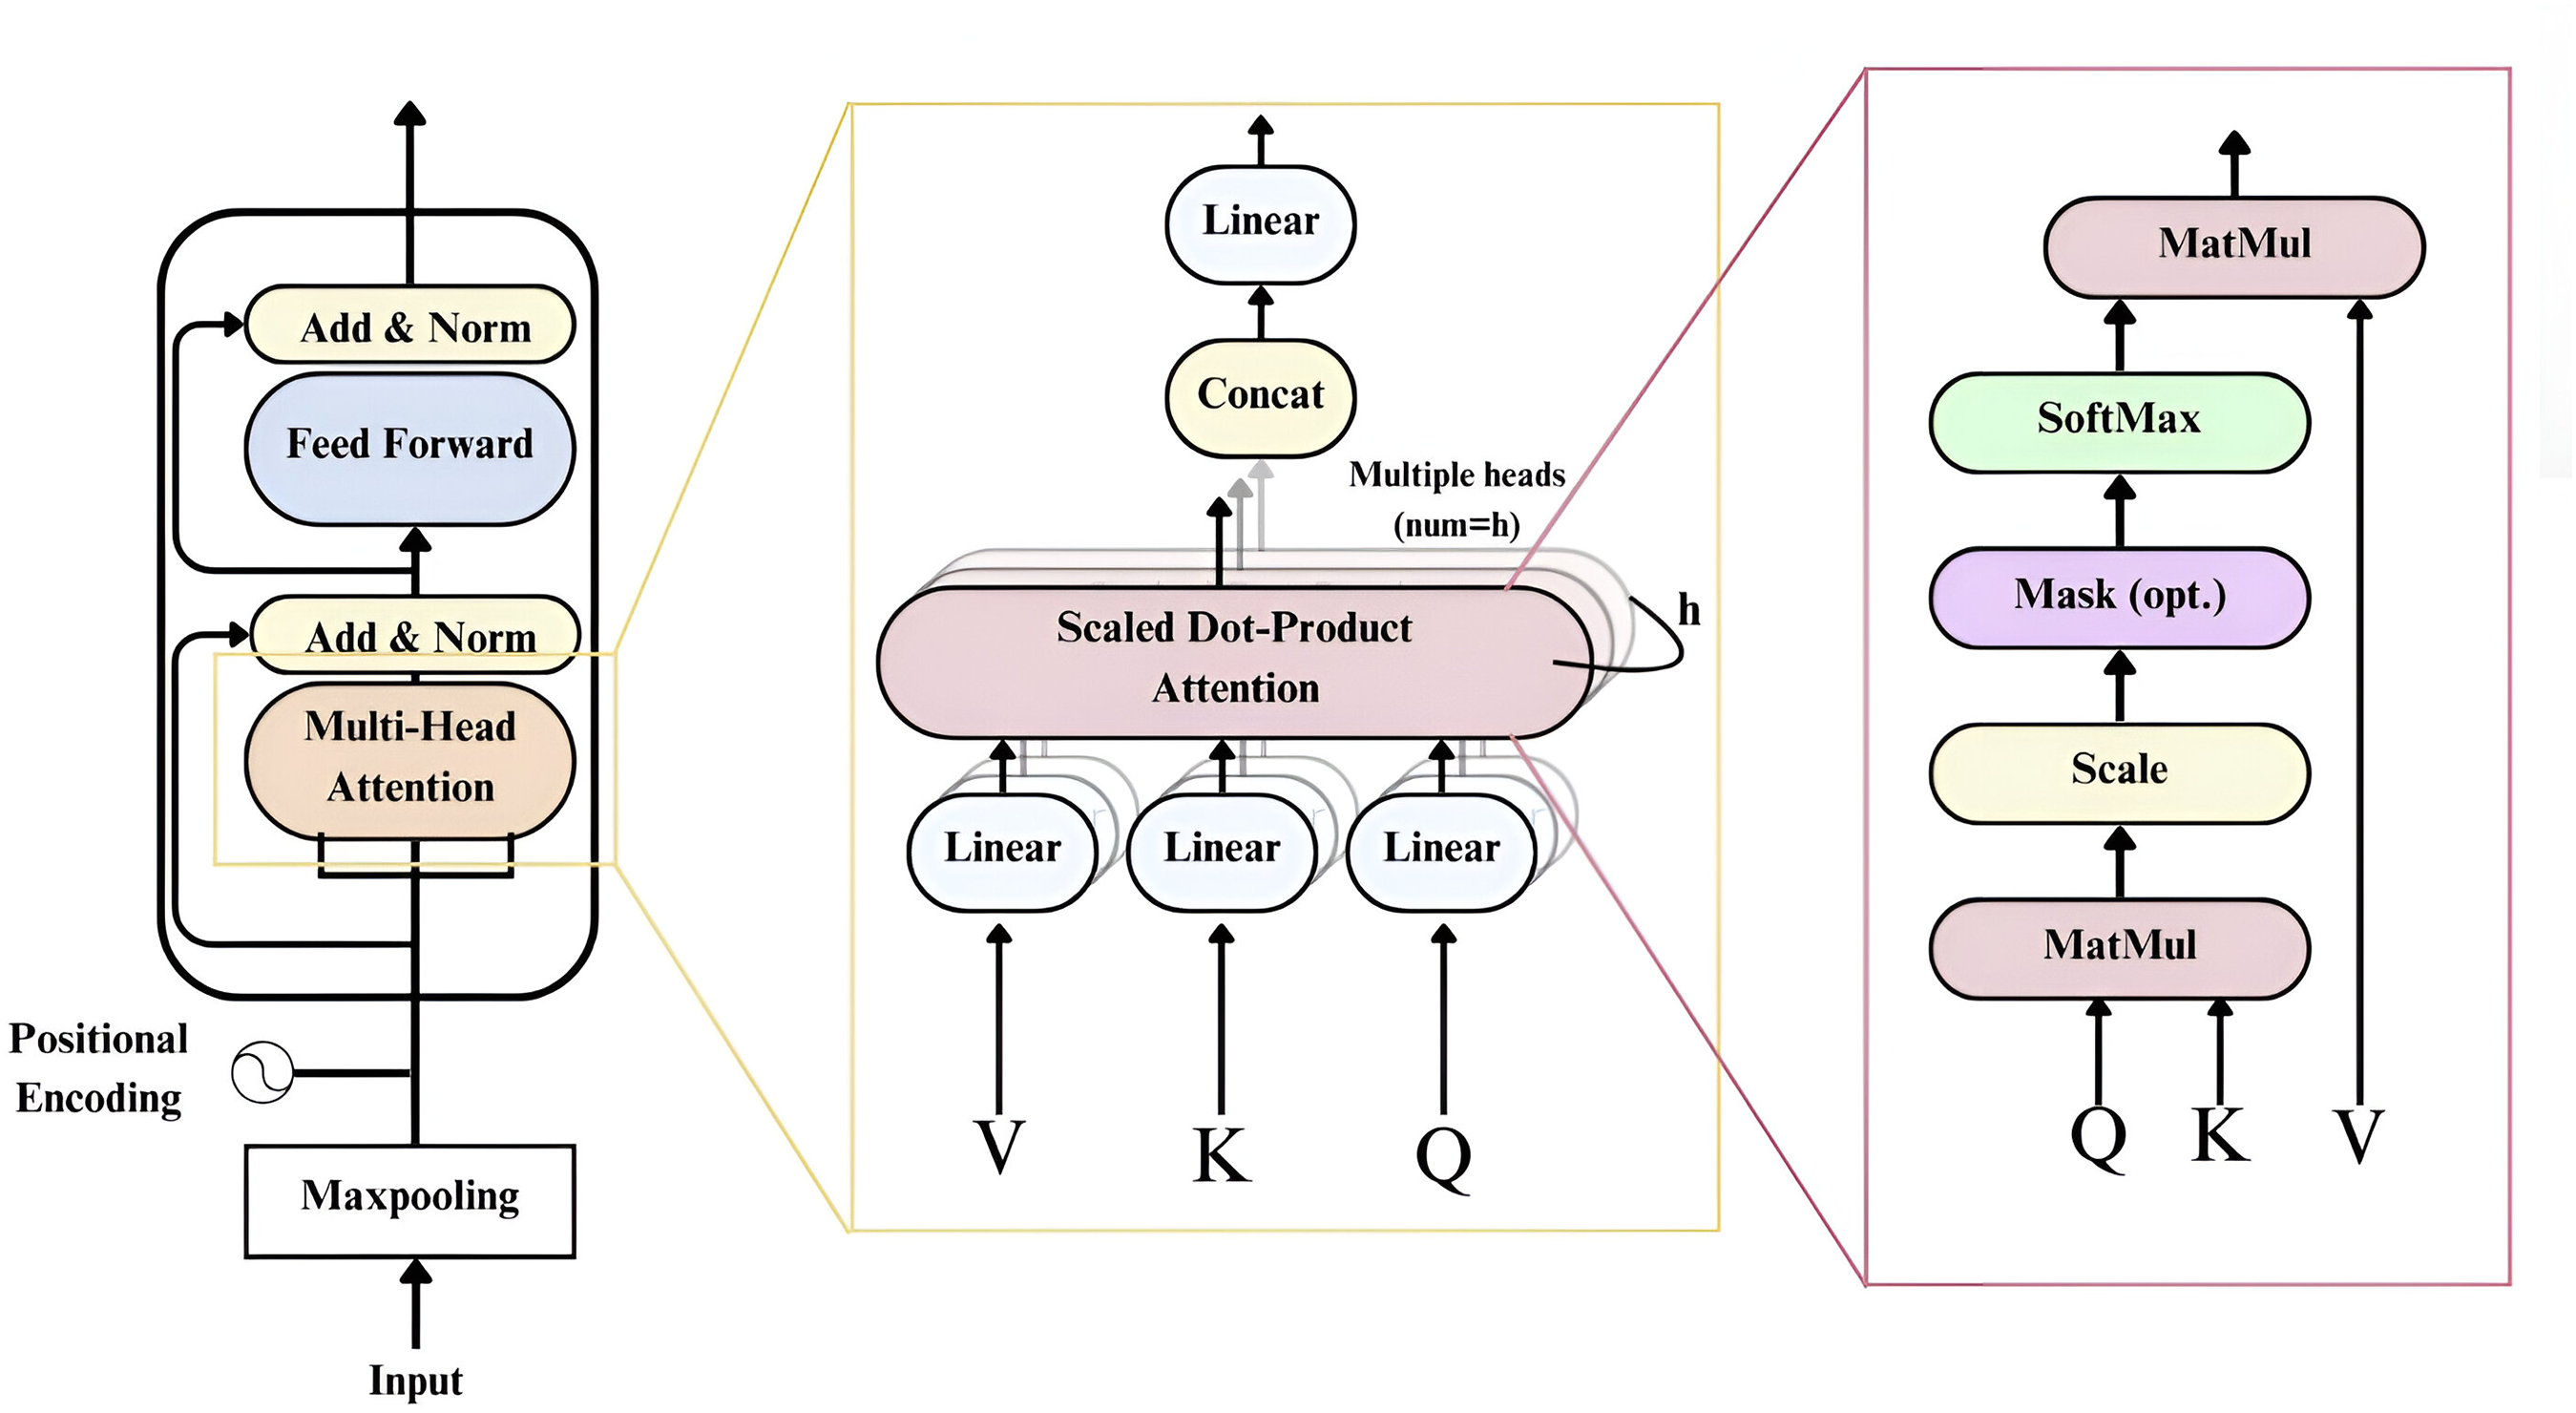
In prior studies, long short-term memory recurrent neural networks (LSTM-RNNs) were employed to learn the sequences associated with each emotion (Senthilkumar et al., 2022). However, these networks could only predict frequency distributions based on adjacent time steps. To address this limitation, introducing a Transformer encoder (Vaswani et al., 2017) allows the network to consider various previous time steps when predicting future ones. This enhancement is driven by the understanding that emotions span broader frequency distributions over multiple time steps rather than isolated ones (Han, Leng & Jin, 2021; Bautista, Lee & Shin, 2022; Saleem et al., 2023; Ullah et al., 2023; Slimi, Nicolas & Zrigui, 2022). Moreover, incorporating multi-head self-attention layers within the transformer architecture enables the model to capture temporal features from the input data based on its overall structure and content (Ullah et al., 2023).
The attention block functions as the third component, running in parallel with the two CNNs. The input features are first passed through a max pooling operation within the transformer to reduce the number of trainable parameters. Within the transformer, context vectors are encoded as Key-Value pairs (K, V), where both represent hidden states matching the input sequence length. At each time step, the previous output becomes a query Q. The decoder then generates output terms by mapping the Q, K, and V triples. Outputs are computed as the weighted sum of all values from the encoded representation:
(1)
Here, the dot product is scaled by the hidden state dimension . As described by Vaswani et al. (2017), self-attention mechanisms apply multiple scaled dot-product self-attentions across different subspaces, where each Q, K, and V has its weight matrix. This enables multi-head attention to assign varying importance to different parts of the input. The outputs of all heads are then concatenated and linearly transformed:
(2)
(3) where are the learnable weight matrices.
The transformer block, shown in Fig. 3, uses four self-attention heads. Each self-attention layer consists of a feedforward network with two linear layers. A dropout rate of 0.4 is applied to improve generalization, while ReLU activation prevents saturation and improves computation efficiency. This transformer block captures complex temporal dependencies and high-level representations from the input features (Vaswani et al., 2017).
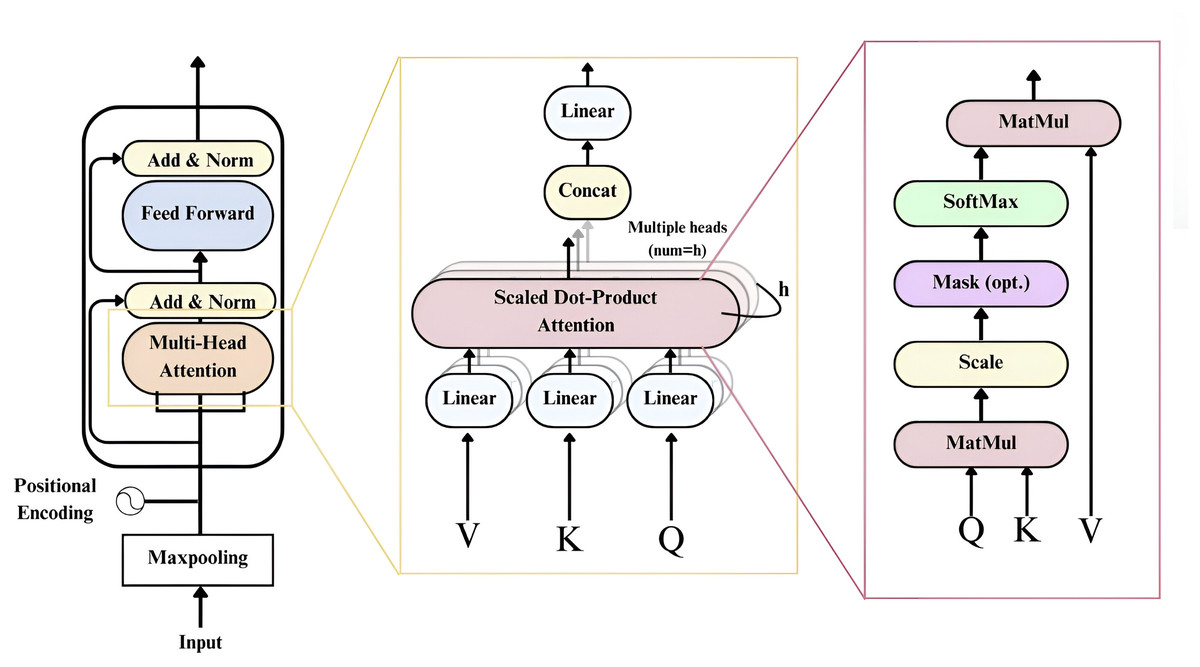
Figure 3: The architecture of the Transformer block in the model.
Co-attention-based fusion
Considering the similar roles of the three blocks of the acoustic information sources in the final emotion recognition, the correlation among them was utilized to guide the feature adaptation. Inspired by Li, Bell & Lai (2022), this study investigates four different methodologies for fusing input features to improve the model’s capabilities in SER. Here, a co-attention module is introduced to combine various input features. Firstly, a direct fusion approach is employed through concatenation, allowing the model to integrate features from multiple inputs. Attention weights are calculated by taking the sigmoid of the concatenated input as
(4) where att is the attention function used to compute the co-attention weights, and are the input embeddings from two separate branches (e.g., two CNNs or a CNN and Transformer), where B is the batch size and D is the embedding dimension. X′ represents the attention weights computed from the fused inputs.
These attention weights are applied element-wise to modulate the original embeddings, enhancing the interaction between the two representations:
(5) where and are the scaled versions of the original embeddings.
The final co-attended representation is formed by fusing the two modulated embeddings:
(6)
Here, denotes the final co-attended feature representation passed to the next stage.
The co-attention mechanism is crucial for capturing intricate relationships within input features (Lu et al., 2019). By calculating attention weights based on the element-wise sum of tensors, the model dynamically adjusts the importance of each feature. This process emphasizes informative elements while mitigating the impact of less relevant ones. Such an adaptive mechanism refines feature representations and facilitates the effective scaling of input features (Zou et al., 2022). This, in turn, promotes cross-modal interactions, extracting pertinent information essential for SER.
Experimental setup
This section introduces the audio sources of the dataset used in the experiments and the pre-processing implemented to enhance the speech signal quality. Extensive experiments were conducted using two datasets, natural and semi-natural speech emotion datasets for SER. Different features were utilized in the experiment, and various augmentation techniques were applied to the datasets. Model training and architecture were also discussed. The code used in this article is available to access (Ahlam7x, 2025). The datasets used in this study include ASVP-ESD.v1 (Dejoli, He & Xie, 2020), ASVP-ESD.v2 (Dejoli, He & Xie, 2021), and ShEMO (Mohamad Nezami, Jamshid Lou & Karami, 2019).
Datasets
This section introduces the audio sources of the dataset used in the experiments and the Pre-Processing implemented to enhance the speech signal quality. Extensive experiments were conducted using two datasets, natural and semi-natural speech emotion datasets for SER. Different features were utilized in the experiment, and various augmentation techniques were applied to the datasets. Model training and architecture were also discussed.
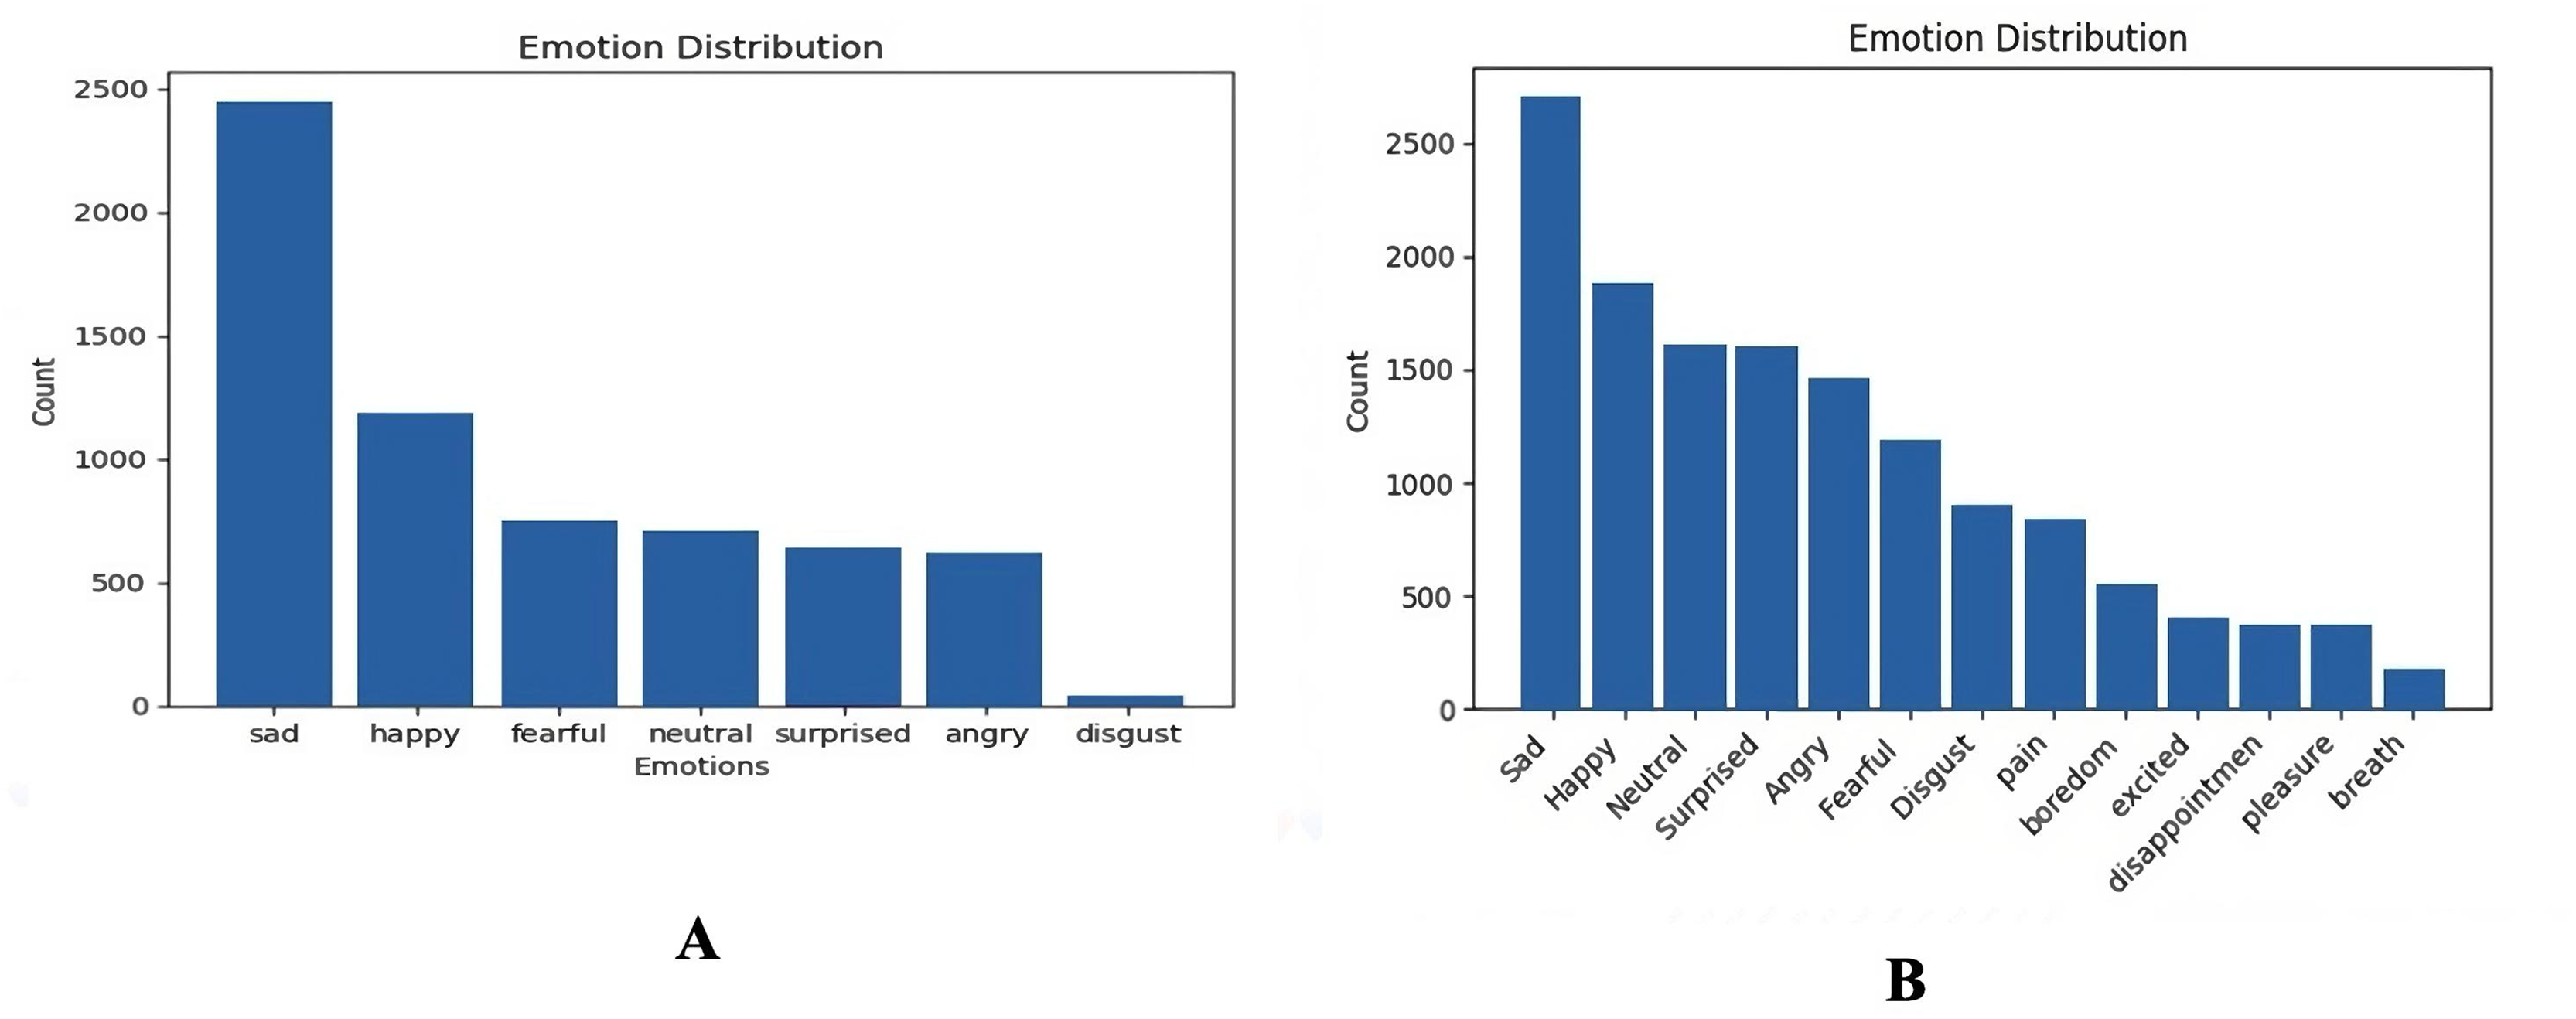
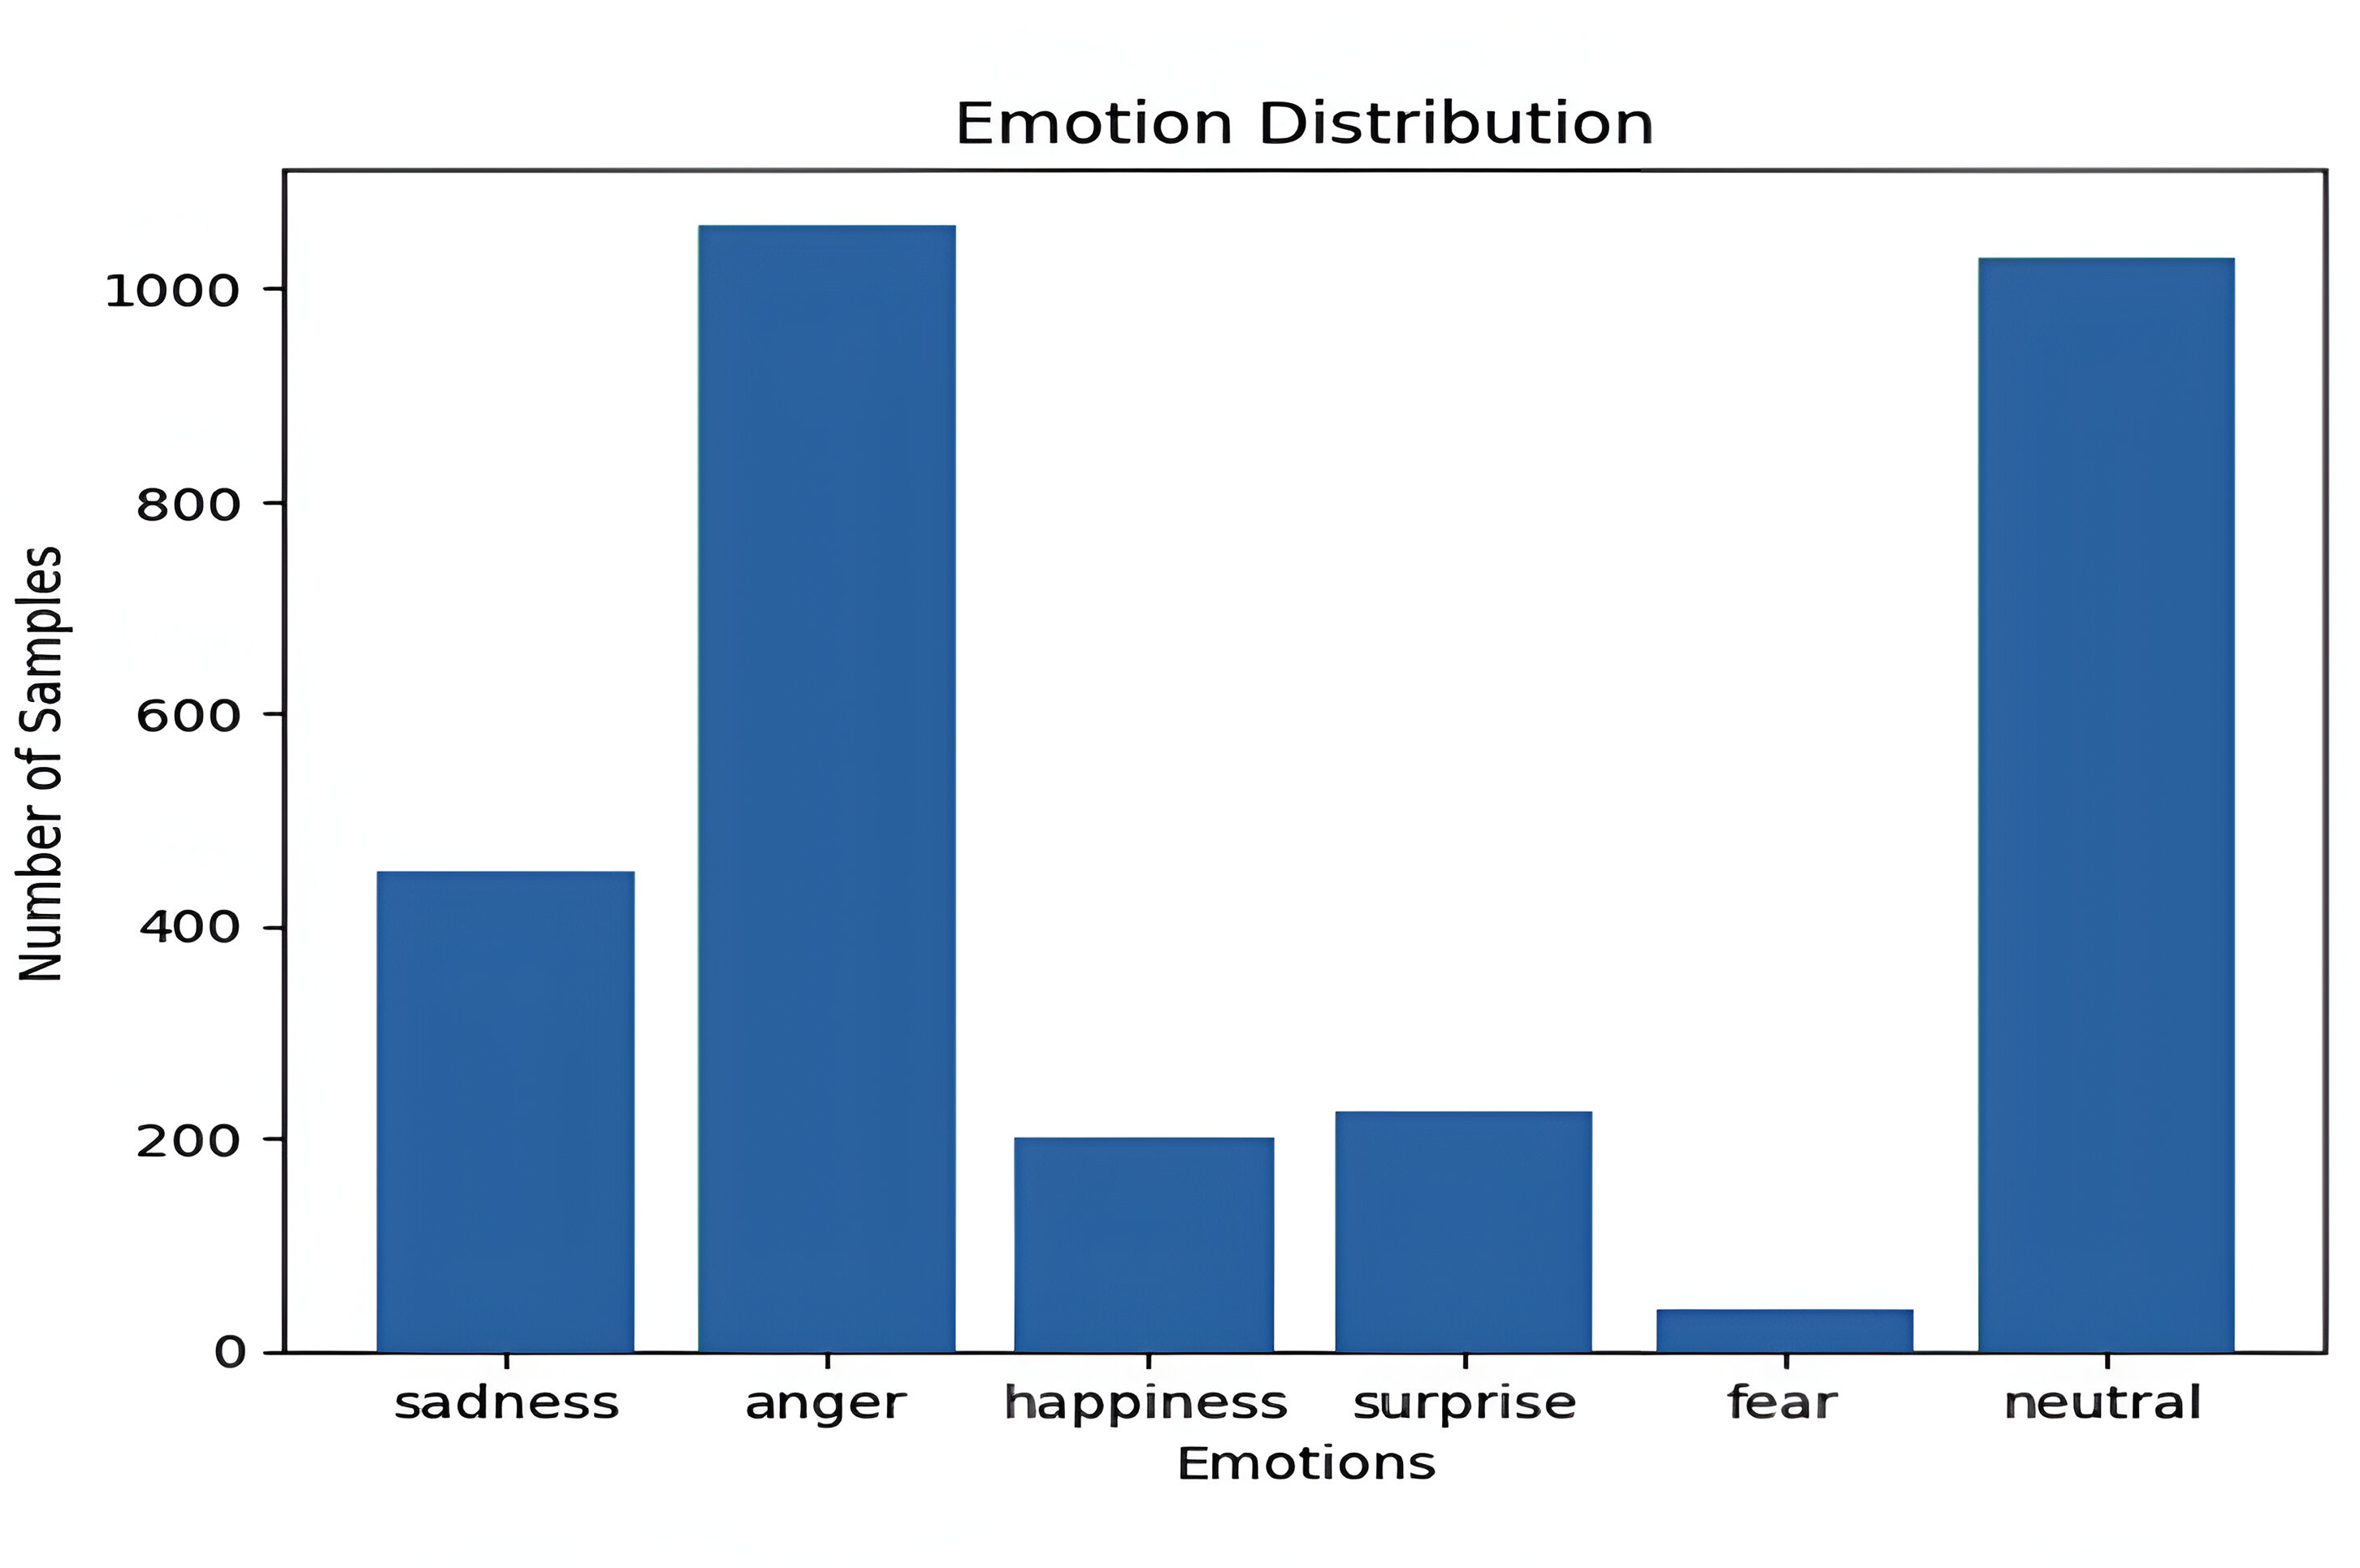
Two versions from the Audio Speech and Vision Processing Lab Emotional Sound database (ASVP-ESD) were used as the natural datasets (Dejoli et al., 2020), and the Sharif Emotional Speech Database (ShEMO) was used as a semi-natural dataset (Mohamad Nezami, Jamshid Lou & Karami, 2019). Table 1 summarizes the dataset utilized with emotion and sample numbers. The first version of the ASVP-ESD dataset contains 6,350 audio files (Dejoli, He & Xie, 2020). It is an emotion-based database containing both speech and non-speech emotional sounds. The emotional sounds within the database include neutral, happy, sad, angry, fearful, surprised, and disgusted expressions. The audio files were recorded and gathered from diverse sources such as YouTube channels and certain utterances captured during real-life human interactions within natural environments (Dejoli et al., 2020). Unlike other public emotional databases, the ASVP-ESD stands out for its heightened realism, unscripted nature, and absence of language restrictions. In this study, the disgust emotion was excluded because there was only a limited number of samples. The second version of the ASVP-ESD dataset (Dejoli, He & Xie, 2021) contains 13,965 audio files. This version expands beyond the conventional set to include 13 distinct labels for emotional expressions: boredom, neutral, happy, sad, angry, fearful, disgust, surprise, excited, pleasure, pain, disappointment, and breath. The initial 5,105 audio files were annotated by five individuals based on their emotional perception, followed by a voting process to determine the predominant emotion. For subsequent audio files, three annotators employed the same procedure. As in the first version, there are no language restrictions, and the audio files cover Chinese, English, French, Russian, and other languages. Figure 4 illustrates the distribution in both versions of the ASVP-ESD dataset, representing the difference between versions 1 and 2, where complex emotions have been added to the new version.
| Ref. | Dataset | Emotion number | Samples number |
|---|---|---|---|
| Dejoli, He & Xie (2020) | ASVP-ESD Version 1 | 7 | 6,350 samples |
| Dejoli, He & Xie (2021) | ASVP-ESD Version 2 | 13 | 13,965 samples |
| Mohamad Nezami, Jamshid Lou & Karami (2019) | ShEMO | 6 | 3,000 samples |
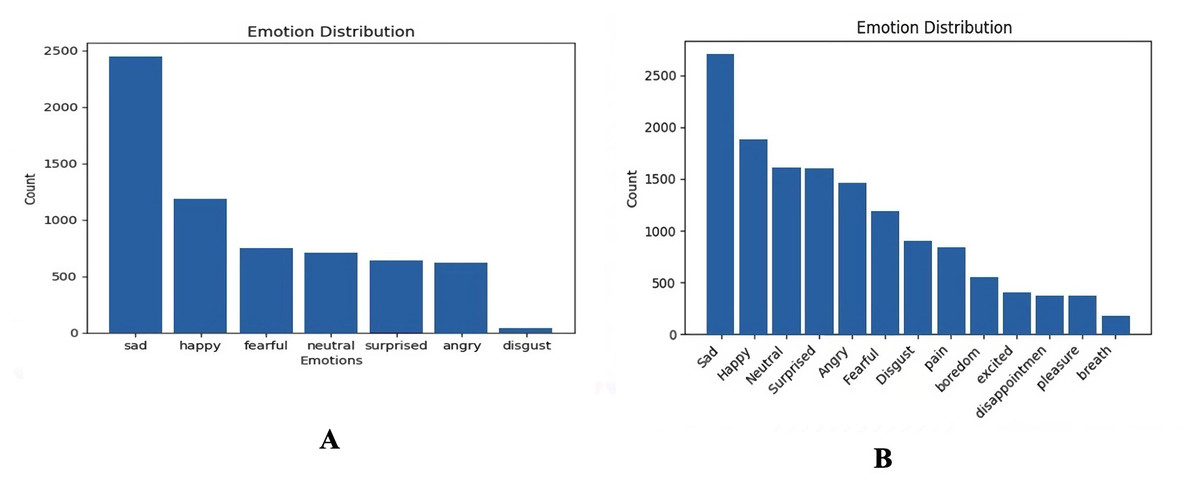
Figure 4: Data distribution based on emotions for the ASVP-ESD dataset, (A) ASVP-ESD version 1, (B) ASVP-ESD version 2.
The ShEMO dataset (Mohamad Nezami, Jamshid Lou & Karami, 2019) contains 3,000 semi-natural speech files, totaling 3 h and 25 min of speech samples sourced from online broadcast radio plays. These audio files are provided in .wav format, with a 16-bit resolution, a sampling rate of 44.1 kHz, and a single-channel configuration. It is also orthographically and phonetically transcribed according to the International Phonetic Alphabet (IPA). The dataset involves 87 individuals, including 31 females and 56 males, whose native language is Persian. These participants expressed the five primary emotions of anger, fear, happiness, sadness, surprise, and a neutral state. Emotion labels for the speech files were assigned by 12 individuals, including six males and six females, through tagging, and a voting mechanism determined the final labels. The average duration of utterances in this dataset is 4.11 s, with a standard deviation of 3.41 s. Figure 5 shows the distribution of the ShEMO dataset.
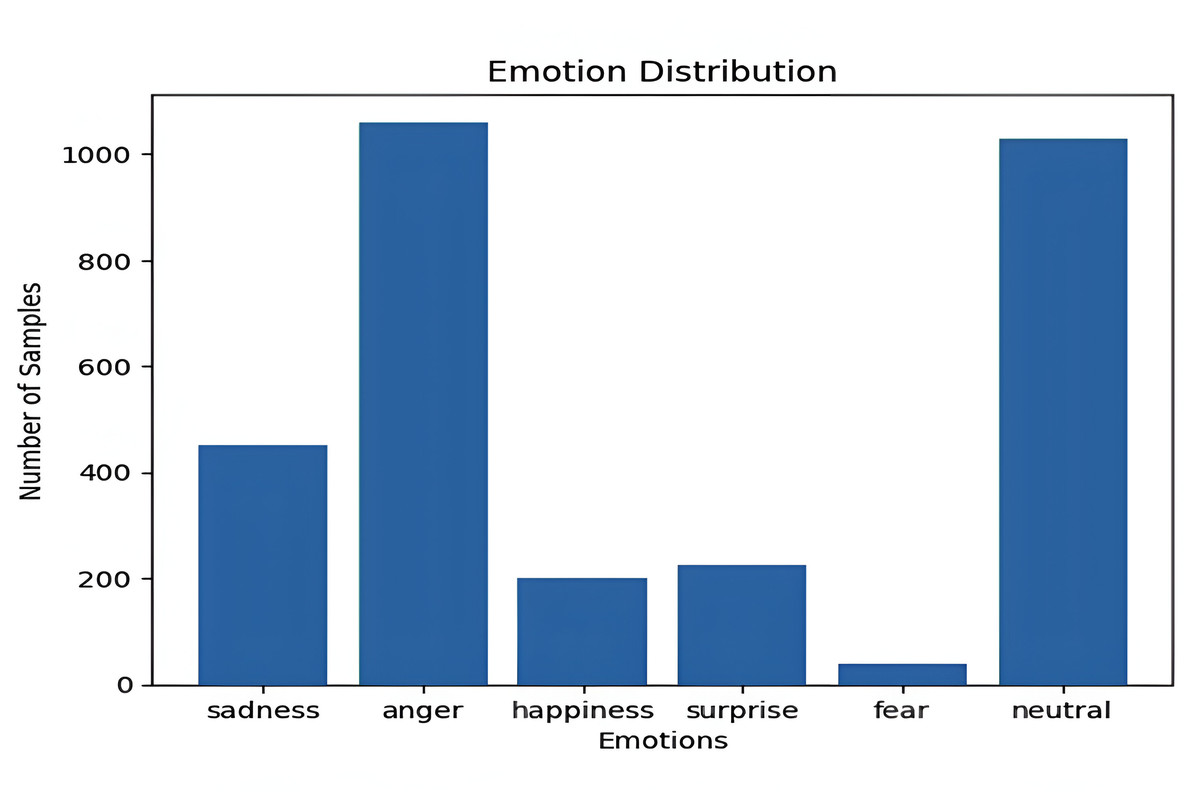
Figure 5: Data distribution based on emotions for the ShEMO dataset.
The use of cross-cultural datasets further supports the generalization ability of our model. Employed ASVP-ESD Versions 1 and 2, which contain multiple languages, including Chinese, English, and French, capturing a wide range of expressive variations. Additionally, utilized the ShEMO dataset, which comprises Persian emotional speech in a single language context. Since our approach focuses on acoustic features rather than textual input, it allows the model to generalize emotional cues across languages. This is particularly advantageous in speech emotion recognition, as it minimizes the impact of linguistic differences and highlights the universal nature of emotional expression in audio signals.
Pre-processing
The preprocessing pipeline for the audio data involves several critical steps to enhance the quality and relevance of the input waveform data. Firstly, the silence removal process utilizes the WebRTC voice activity detector (VAD) Wiseman (2016) (fied) to identify and remove silent regions within the waveform. This is achieved by converting the waveform to an int16 format for compatibility with Webrtcvad and then splitting the waveform into frames, where each frame’s duration is represented in milliseconds. The minimum silence duration represents the minimum duration required for a segment to be considered silent; this study used 30 and 500 for frame duration and minimum silence duration, respectively. The waveform is segmented into frames of the specified duration using the sample rate. The VAD analyzes each frame to determine whether it contains speech or silence. Frames classified as containing speech are considered “non-silent” frames. If no non-silent frames are detected, indicating that the entire waveform is silent, the original waveform is returned unchanged.
Following silence removal, the denoising methodology utilizes a technique known as spectral subtraction (Lu & Loizou, 2008). It involves transforming the input signal from the time domain to the frequency domain using the Short-Time Fourier Transform (STFT), which represents the time-frequency characteristics of the signal. The magnitude spectrum is then computed by taking the absolute value of the complex-valued STFT coefficients. By estimating the noise spectrum from portions of the signal containing only noise and subtracting it from the magnitude spectrum of the original signal, spectral subtraction effectively attenuates the noise components in the spectrum. The denoised magnitude spectrum is then transformed back to the time domain using the inverse STFT operation. This process reconstructs the denoised waveform from its frequency-domain representation, yielding the final denoised waveform output.
The preemphasis process aims to enhance the high-frequency components of an audio waveform, thereby improving its clarity and intelligibility (Paliwal, 1984). This process begins by taking the input waveform and applying a mathematical operation, as shown in Eq. (1), which emphasizes the differences between consecutive samples. For each sample in the waveform, except the first one, a fraction of the previous sample is subtracted from the current sample. The strength of this emphasis is controlled by a preemphasis coefficient, with a default value of 0.97. By boosting the higher frequencies relative to the lower frequencies, preemphasis helps mitigate the effects of noise and distortion in the audio signal.
(7) where waveform [ ] represents the current sample in the waveform, waveform [ − 1] represents the previous sample, coefficient is the preemphasis coefficient 0.97, and waveform_preemphasized [ ] is the preemphasized sample at index . Combining these techniques aims to prepare the audio data for subsequent analysis and modeling by minimizing noise and irrelevant information. The input samples used in the experiments have a fixed duration of 5 s. In cases where the original audio samples are shorter than 5 s, padding is applied to ensure uniformity in the input duration across all samples.
Data augmentation techniques
The challenge of small and imbalanced natural data for emotion recognition is a common problem, where certain emotions have more samples than others (Fahad et al., 2021b), resulting in a model being prone to bias toward emotions that have a majority of samples. Additionally, small datasets are more sensitive to overfitting, which further complicates the training process. To address this issue, data augmentation techniques are employed to increase the dataset’s variety, ensuring a more balanced representation of emotions and reducing overfitting. Several approaches have been used in the data to address this issue, including various augmentation methods, class weighting, and the generation of synthetic samples for minority classes (Haixiang et al., 2017; Alex et al., 2023; Abdelhamid, 2023; Shih, Chen & Wang, 2017; Bautista, Lee & Shin, 2022; Schlüter & Grill, 2015). Data augmentation serves as a method to enhance the performance of models by artificially increasing the amount of data used in training (Bautista, Lee & Shin, 2022). Additionally, it also helps improve the small-sized dataset, which tends to overfit (Van Dyk & Meng, 2001). Therefore, more training samples will be generated to help mitigate this problem. In this work, several attempts have been made using various techniques to increase the variety of the data and prevent overfitting. These techniques include Additive White Gaussian Noise (AWGN) and Synthetic Minority Oversampling Technique (SMOTE) (Chawla et al., 2002), as well as augmenting the data with pitch-shifting, class weights, and under-sampling the majority class. To preserve emotional clarity, a small amount of noise was added during the augmentation, ensuring that the emotional characteristics of the speech signals remained recognizable and consistent.
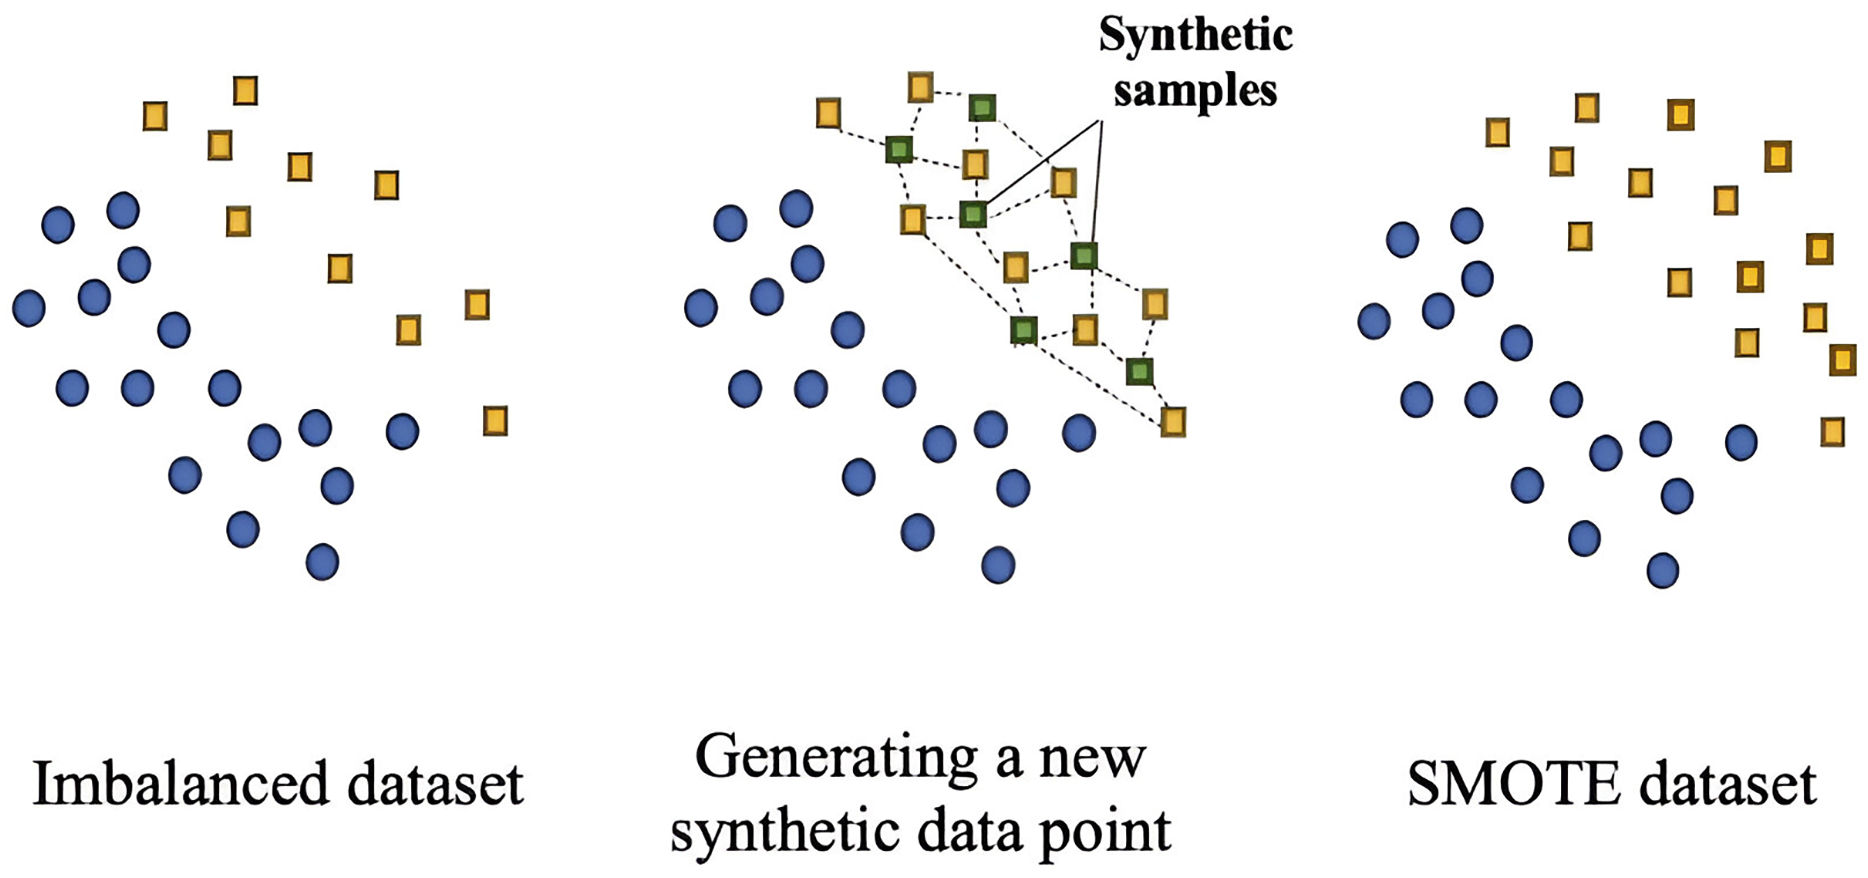
SMOTE is specifically developed to handle instances of minority classes by generating synthetic samples for that class. It specifies the minority class and creates synthetic examples. This process involves discovering the minority class, locating k-nearest neighbors, and creating synthetic instances along the line segments connecting the original instance to its neighbors. By introducing synthetic samples, SMOTE helps balance class distribution, contributing to improved model performance and mitigating bias toward majority classes (Chawla et al., 2002). Figure 6 illustrates the process of generating synthetic samples for the minority class.
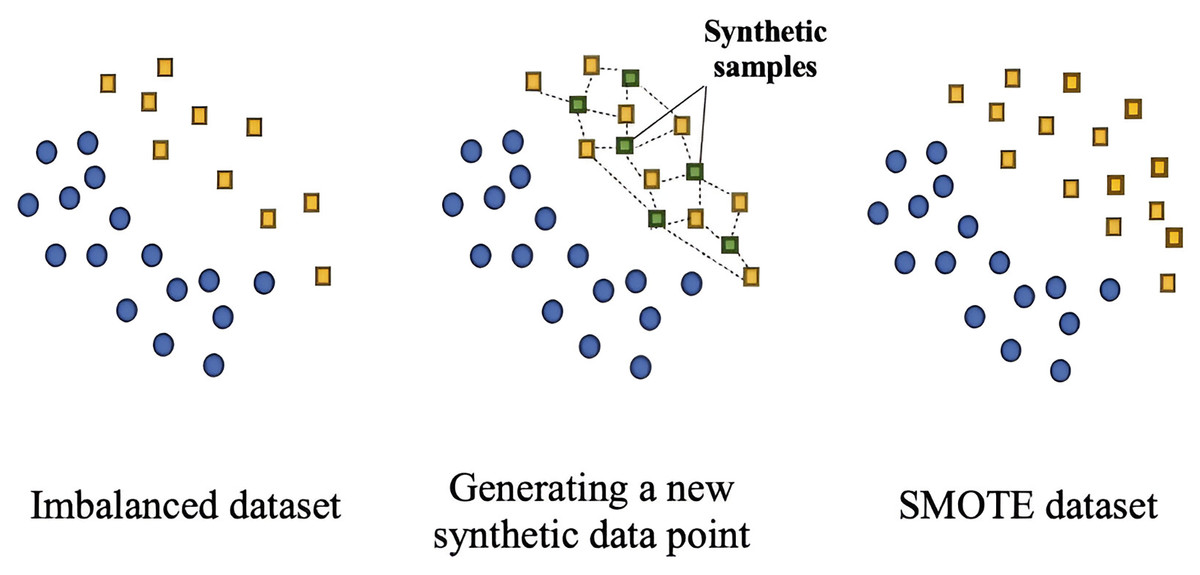
Figure 6: The synthetic minority oversampling technique generates synthetic samples in the minority class by creating new instances along the line segments that join the k-nearest neighbors of existing minority class instances.
Class weighting is a technique used to address imbalances in the distribution of classes within a dataset. It involves assigning different weights to different classes based on their representation in the dataset, where higher weights are given to classes with fewer samples (minority classes) and lower weights to classes with higher samples (majority classes). By assigning higher weights to minority classes and lower weights to majority classes, the algorithm prioritizes the underrepresented classes during training (Singh, 2023). Sampling techniques for addressing class imbalance involve adjusting the distribution of samples to achieve a more balanced representation of the classes. One approach is under-sampling, where the goal is to mitigate the impact of an imbalanced distribution by discarding instances from the majority class. A straightforward and highly effective undersampling method is Random Under Sampling (RUS), which involves randomly removing examples from the majority class (Tahir et al., 2009). Pitch-shifting is a technique that involves altering the audio signal’s pitch (frequency) to create variations in the dataset. It includes modifying the pitch of the original audio signal without affecting its temporal characteristics (Sturm, Daudet & Roads, 2006). This augmentation method is valuable for training models that may encounter pitch variability across different speakers and emotional states.
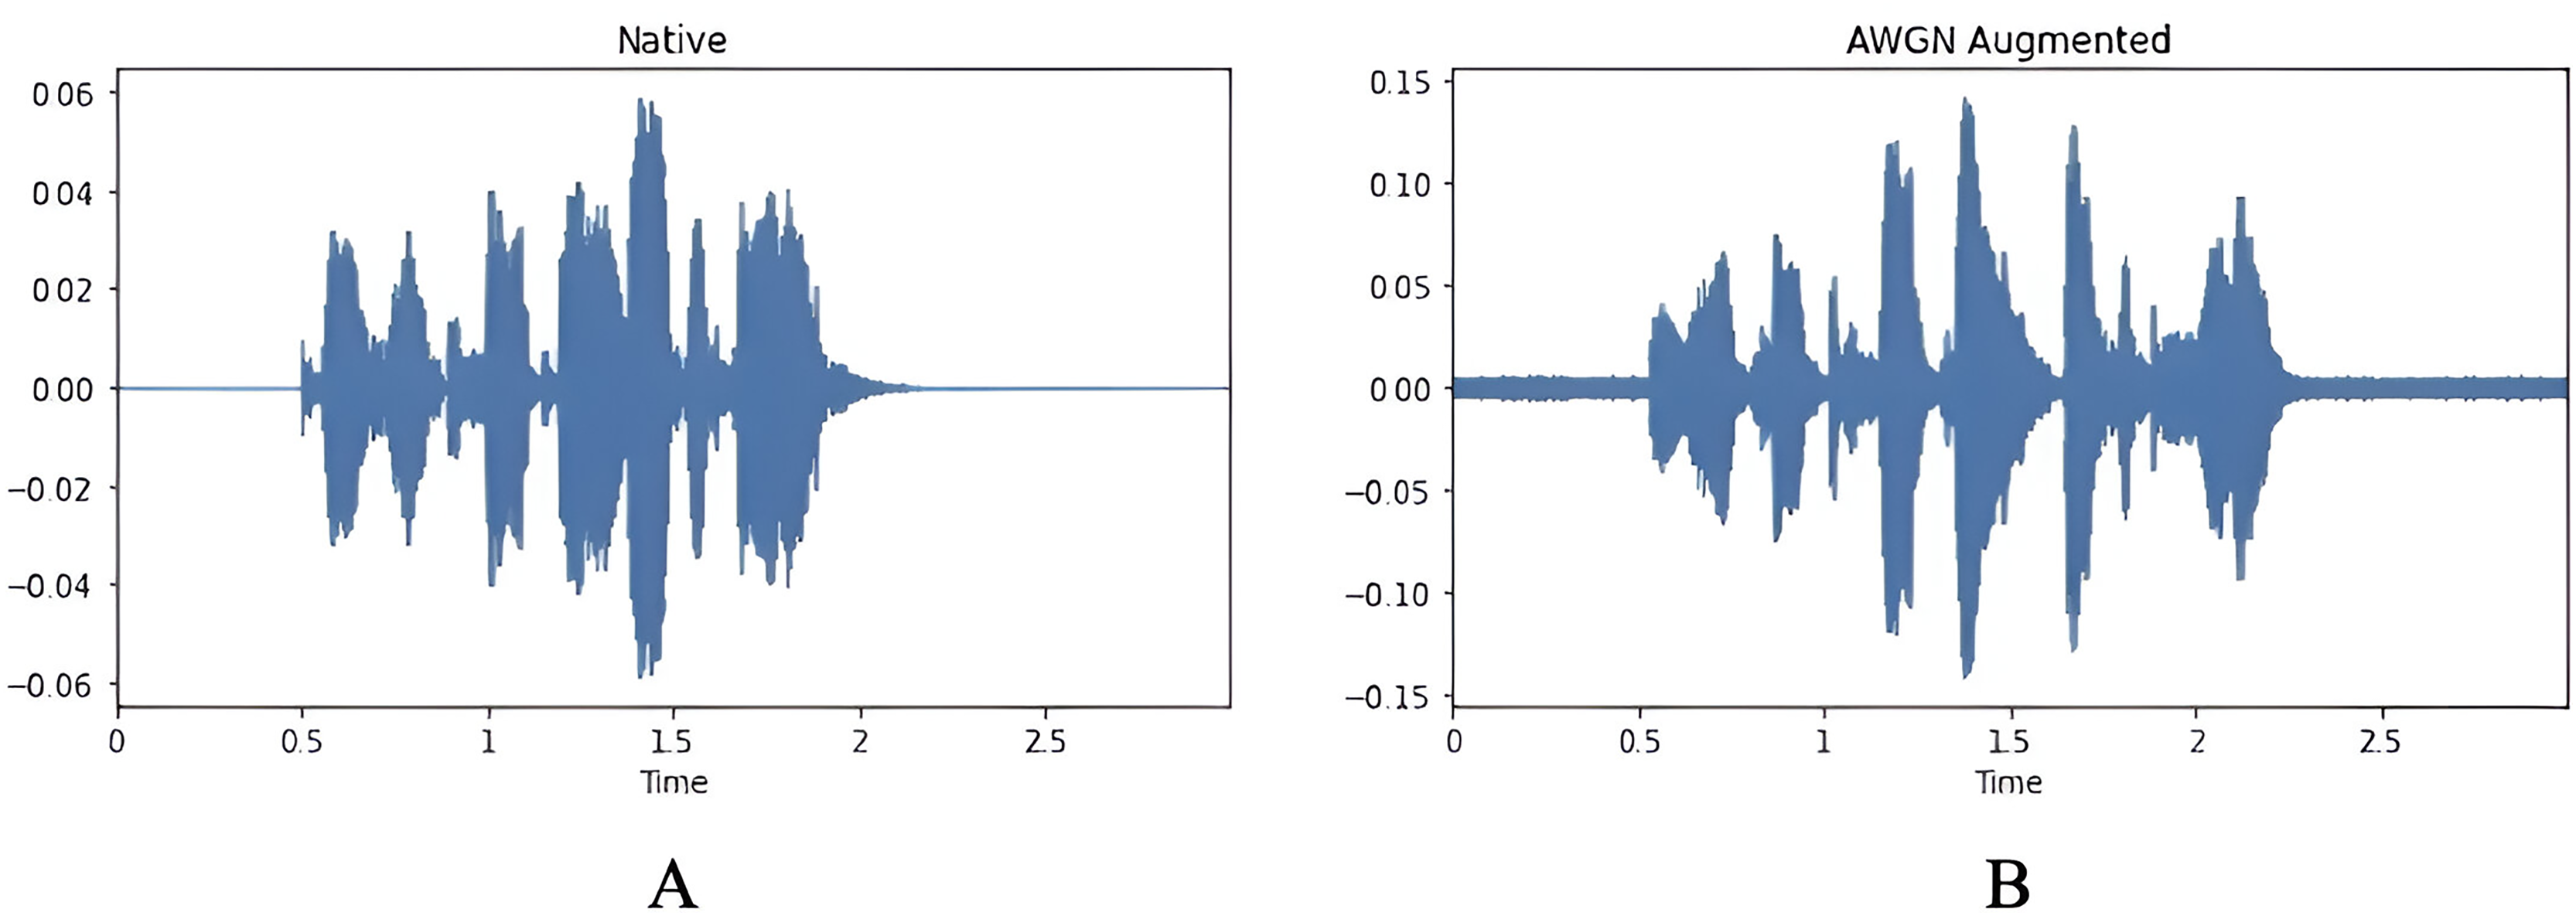
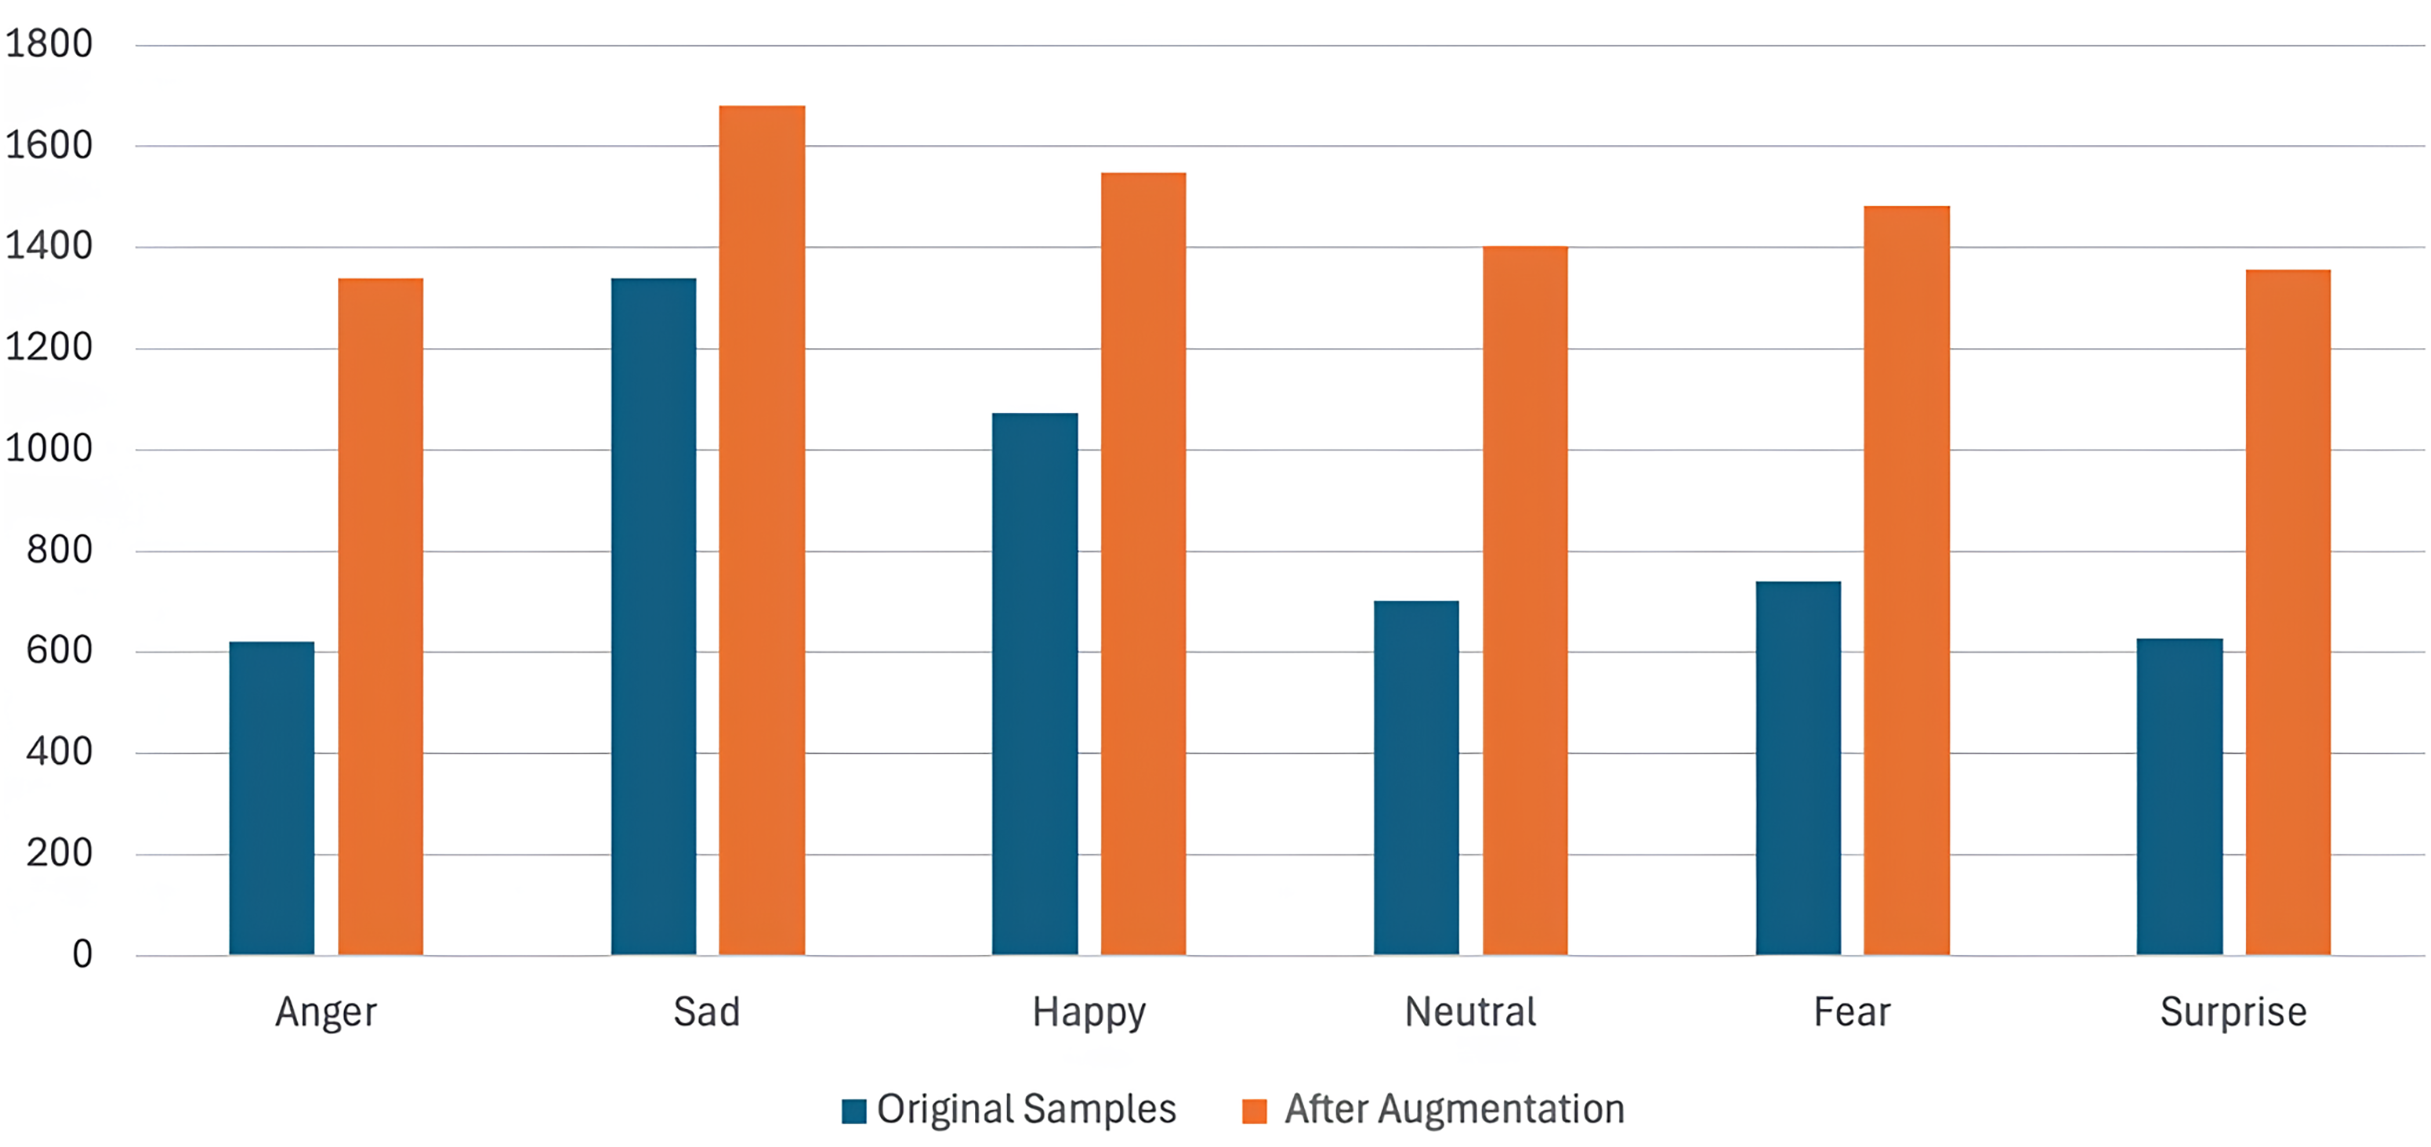
The AWGN technique involves adding Gaussian noise to a signal. This noise, derived from a normal distribution with a zero-mean time average, is evenly distributed across the frequency range. The process involves combining two signals, and the resulting output is the signal-to-noise ratio (SNR), which can be adjusted by signal scaling. The SNR is randomly chosen between 15 and 30 dB. It follows a uniform distribution on the decibel scale, corresponding to a logarithmic scale similar to the one used in human hearing. A previous study (Huang et al., 2013) has noted that including AWGN has benefited the performance of various classifications in audio tasks. Figure 7 illustrates the waveform signal before and after applying AWGN, and Fig. 8 shows the number of samples per emotion before and after augmentation, highlighting increased dataset size and improved class balance.
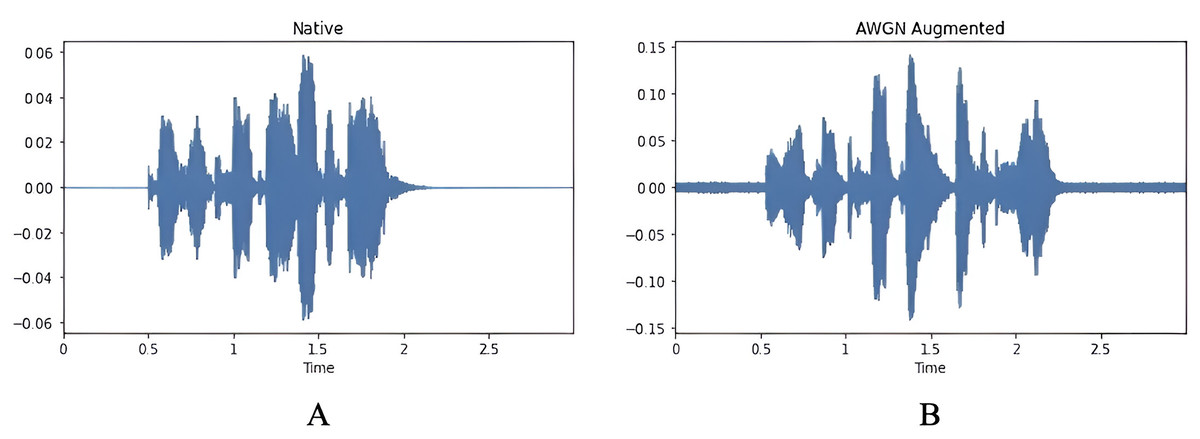
Figure 7: Waveform of the signal, (A) original audio signal, (B) waveform after applying AWGN.
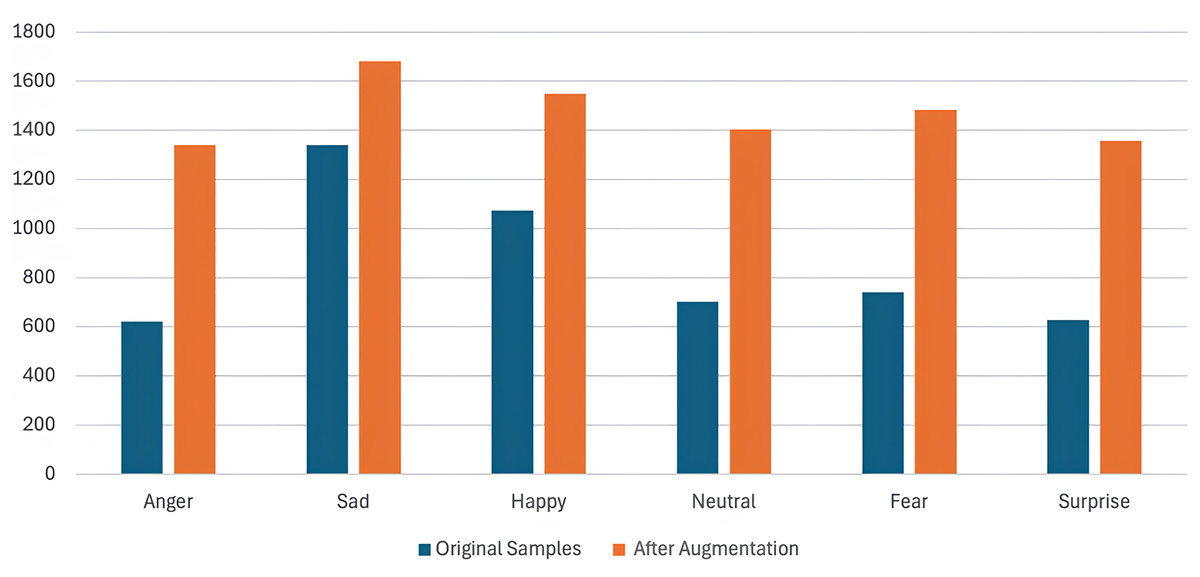
Figure 8: Comparison of the number of samples per emotion before and after augmentation.
Features and model training
This section focuses on the critical aspect of feature extraction within the SER framework. Robust feature extraction enables the model to capture and understand the intricate patterns in audio signals, facilitating accurate emotion recognition. In this context, we explore the extraction of Mel Spectrograms and MFCCs as fundamental input features for the SER model. Additionally, the architecture of the various models is also covered. All experiments were conducted using Python v3.10.12 in Google Colab with CUDA v11.8. The main deep learning framework used was PyTorch v1.13.1, along with torchaudio v0.13.1 and torchvision v0.14.1. Feature extraction and signal processing relied on librosa v0.10.1, while IPython v8.12.2 was used for audio and image display during interactive analysis. These specifications ensure reproducibility and consistency of results.
Features extraction
Two commonly used features in speech recognition tasks are the Spectrogram and MFCC. Both have been extensively used in previous studies (Ullah et al., 2023; Han, Leng & Jin, 2021; Bautista, Lee & Shin, 2022; Saleem et al., 2023), as each captures distinct aspects of the audio signal. Their key difference lies in how they represent frequency. The Mel spectrogram transforms an audio signal’s spectrum into the Mel scale. This involves segmenting the signal into small overlapping frames, applying a Fourier transform to each frame to obtain the spectrum, and then mapping it onto the Mel scale. The Mel scale is linearly spaced and derived through STFT (Joshi, Pareek & Ambatkar, 2023). In this study, we used a window length of 512 samples and a hop length of 256 samples to compute the Mel spectrogram features, which control the temporal resolution of the analysis.
We experimented with 40 and 128 Mel bins to represent the frequency content of audio signals. Mel spectrograms are effective in SER tasks as they capture variations in pitch, tone, and rhythm—key elements in emotional expression. Representing frequency content on a Mel scale allows the model to focus on spectral areas most relevant to human auditory perception, which is essential for detecting subtle changes in vocal intonation.
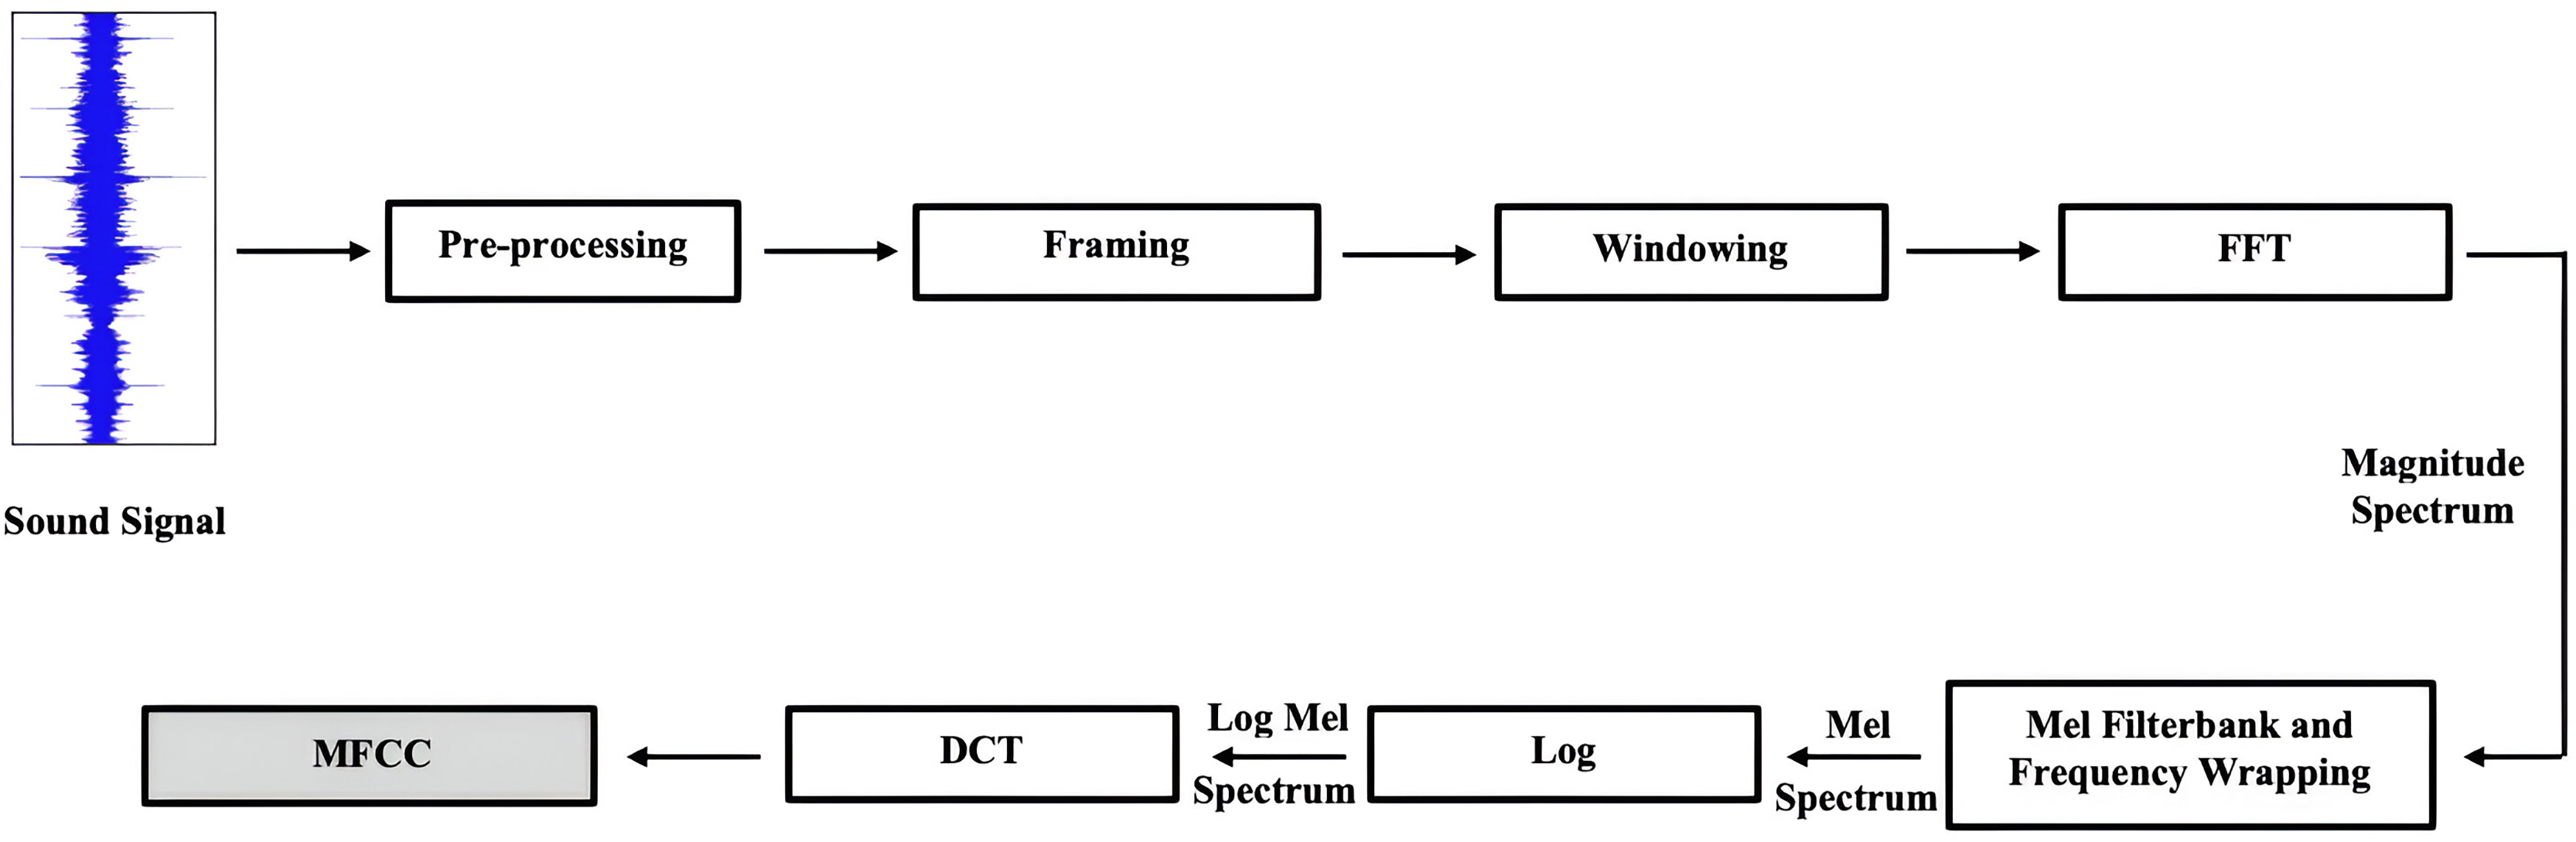
MFCCs, on the other hand, use a quasi-logarithmic frequency scale. These coefficients represent the short-term power spectrum of an audio signal (Bui, Oh & Yi, 2020), obtained by applying the Discrete Cosine Transform (DCT) to the log Mel power spectrum, with a focus on the spectral envelope (Hashem, Arif & Alghamdi, 2023). The parameters are the same, but MFCCs typically use 40 Mel bins. MFCCs are valuable in SER because they compress the audio into a lower-dimensional space, emphasizing essential spectral features while minimizing noise and irrelevant information. This enables the model to focus on significant speech characteristics that vary with emotion, such as timbre (Abdul & Al-Talabani, 2022).
In this work, we combined MFCCs and Mel spectrograms to help the model capture both fine-grained frequency variations and broader temporal patterns in speech. This combination, supported by a co-attention mechanism, enables the model to dynamically weigh and focus on the most informative aspects of each representation based on the input (Zou et al., 2022), allowing it to detect subtle emotional shifts in speech.
We also conducted experiments using MFCCs and Mel spectrograms separately to assess their impact on emotion recognition. Figure 9 illustrates the steps involved in MFCC extraction.
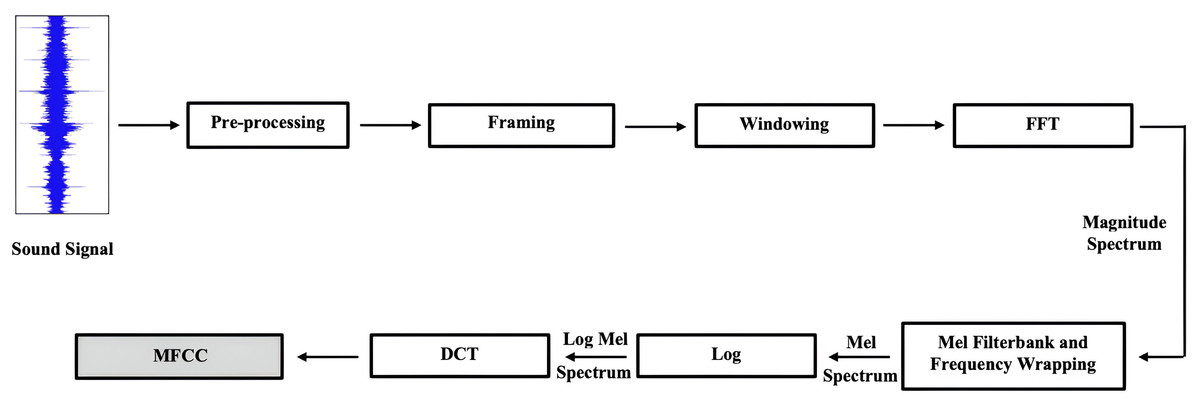
Figure 9: The steps used to extract the Mel frequency cepstral coefficients feature.
Features concatenation
A simple concatenation method combines Mel-spectrogram and MFCC features, which leverage the complementary strengths of each feature set. Mel-spectrogram features capture spectral information, offering insights into the frequency content of the audio signal over time. At the same time, MFCCs represent temporal characteristics by depicting the short-term power spectrum of the signal. This concatenation operation results in a combined feature set where the features from both MFCCs and Mel-Spectrogram are stacked vertically with the same timesteps. By concatenating these two feature sets along the feature dimension, the resulting fused feature set provides a comprehensive representation of the audio signal, integrating spectral and temporal information. This fusion enhances the discriminative power of the features, enabling the SER model to capture a broader range of acoustic cues associated with emotional expressions in speech, thus improving the model’s performance in emotion recognition tasks.
Emotion recognition using proposed DL methods
Version one of the ASVP-ESD dataset was used in the four different models. Figure 10 illustrates all models utilized in this study, where Mmel is the mel spectrogram features, MMFCC is MFCC features, and Mtotal is a concatenation of Mmel and MMFCC. The time steps are represented as N. The mel spectrogram has a size of , while the MFCC has a size of . After combining them, the resulting size is . Figure 10A illustrates the outputs from the two parallel convolutional blocks and the transformer block concatenated to form a complete embedding. Figure 10B shows a similar framework. However, this model includes co-attention between the two parallel convolutional embeddings and combines them with the Transformer, identical to the previous model. The third model in Fig. 10C resembles the one in Fig. 10B. Nevertheless, it incorporates an additional co-attention mechanism between the outputs of the CNNs and the Transformer, creating a hierarchical structure. The final model, depicted in Fig. 10D, utilized co-attention among the three inputs, specifically parallel CNNs with Transformer embeddings. All models share the same architecture, where a linear layer takes these embeddings as input and produces output logits. The softmax function calculates probabilities associated with each emotion label, generating the final output probabilities for classification.
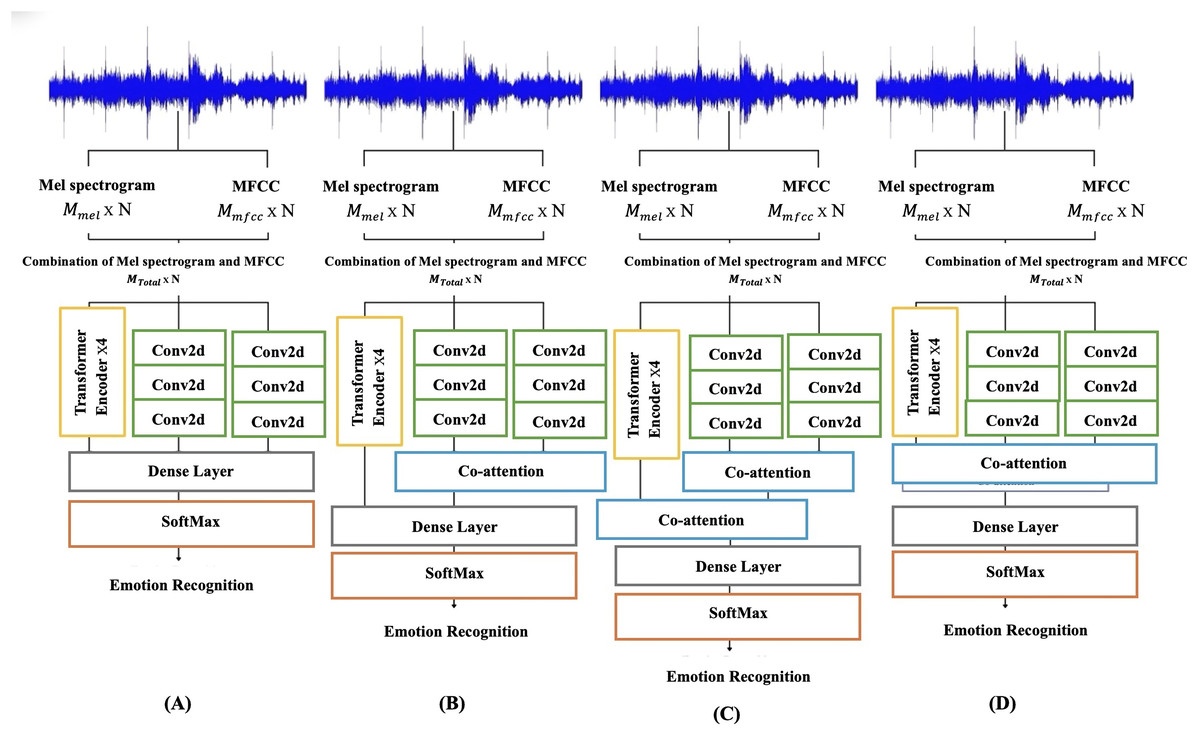
Figure 10: Proposed model with different fusion methods: (A) parallel CNNs with transformer using concatenation fusion. (B) Parallel CNNs with a transformer using concatenation and co-attention fusion. (C) Parallel CNNs with transformer using a hierarchical co-attention fusion. (D) Parallel CNNs with transformer using one co-attention fusion.
Where Mmel is the mel spectrogram, Mmfcc is MFCC, MTotal is concatenated of Mmel and Mmfcc, and N is the time steps.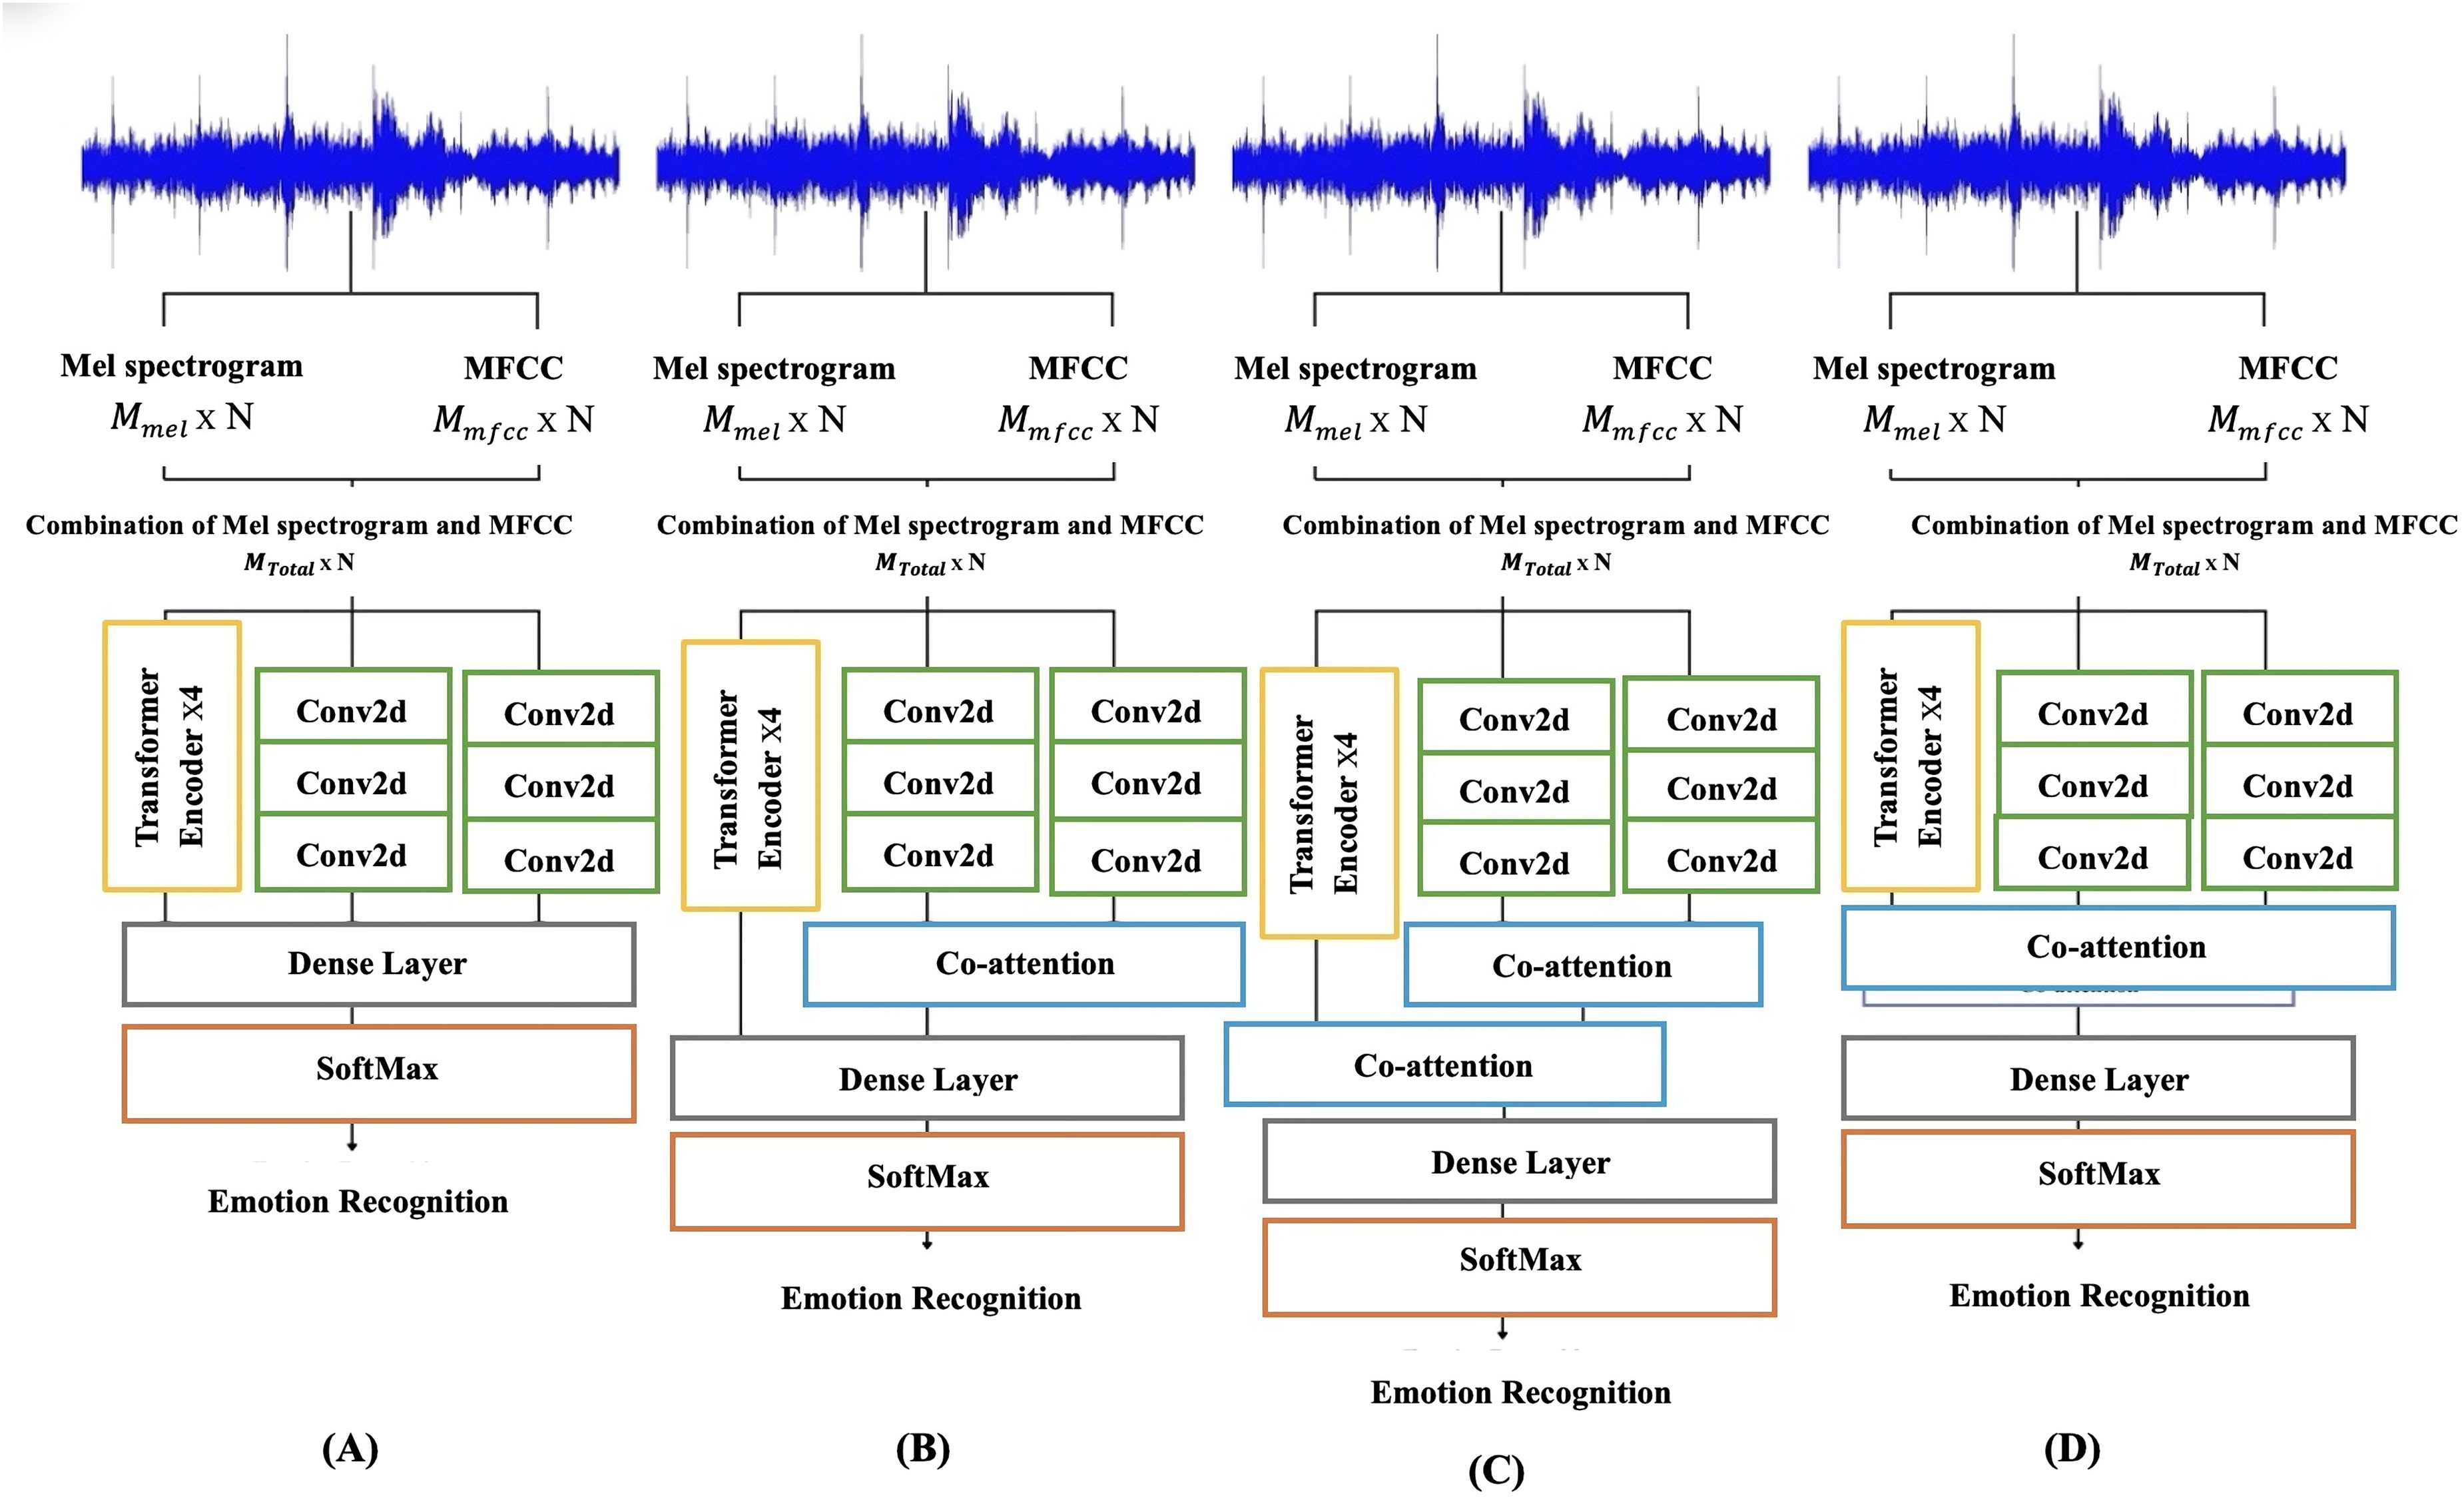
The input consisted of a combination of MFCC and mel spectrogram for all four models. The models were trained using stochastic gradient descent (SGD) with focal loss (FL) as the objective function. The initial learning rate was set to 0.01, with a weight decay of and a momentum of 0.8. A batch size of 32 was selected based on empirical testing; it offered a good trade-off between training stability, convergence speed, and model generalization on the validation set. The learning rate value of 0.01 was determined through a learning rate range test, where it was identified as the point at which the steepest decrease in validation loss occurred. Early stopping was implemented as a regularization strategy to prevent overfitting and reduce training time. The validation loss was monitored during training, and if no improvement was observed for 10 consecutive epochs, the training process was terminated. This approach ensures that the model maintains good generalization performance while avoiding unnecessary computation and overfitting (Ferro et al., 2023). Various values for key hyperparameters, such as learning rate, batch size, and momentum, were systematically tested. The final values were selected based on the combination that achieved the best validation performance across several runs. All datasets were split into training, validation, and testing subsets using an 8:1:1 ratio, ensuring that each stage of the training pipeline received an appropriate amount of data coverage.
Evaluation metrics
Evaluation metrics, including WA, UW, precision, recall, F1-score, and confusion metrics, were employed to assess the predictive performance of the models. WA and UW are two metrics used to evaluate the performance of classification models, each with its significance. Weighted accuracy considers the distribution of samples across different classes by assigning a weight to each class based on its sample size. Classes with more samples are more critical in calculating overall accuracy. Weighted accuracy is particularly valuable in scenarios where the dataset is imbalanced, meaning some classes have significantly more samples than others. By giving more weight to classes with larger sample sizes, weighted accuracy provides a more accurate assessment of the model’s performance, especially for most classes (Glodek et al., 2011). Unweighted accuracy treats all classes equally, regardless of their sample sizes. Each class contributes equally to the overall accuracy calculation, irrespective of whether it is a majority or minority class (Gupta, Fahad & Deepak, 2020). Unweighted accuracy helps assess the model’s ability to classify all classes correctly without bias towards any particular class. However, in imbalanced datasets, unweighted accuracy may not adequately reflect the model’s actual performance, as the majority classes could disproportionately influence it.
The weighted accuracy and unweighted accuracy formulas are given by:
(8)
(9) where N represents the total number of classes, is the weight assigned to class , is the number of true positives, is the number of true negatives, is the number of false positives, and is the number of false negatives for class . Both weighted and unweighted accuracies are reported as percentages in this article.
The precision is defined as follows:
(10)
The recall formula is:
(11)
The F1-score is defined as follows:
(12) where TP is the number of true positive predictions, FP is the number of false positive predictions, and FN is the number of false negative predictions.
Results and discussion
This section covers the performance evaluation and discusses different aspects of the proposed SER models. The performance of various feature types is evaluated. The impact of different augmentation techniques is considered, and the performance analysis of the proposed models on the ASVP-ESD Version 1 dataset is discussed. The performance of parallel CNNs with the Transformer and Hierarchical Co-Attention architecture is also covered in this dataset. The evaluation includes the ASVP-ESD Version 2 and ShEMO datasets. These comprehensive analyses provide insights into the effectiveness of the models across various datasets, illuminating their potential for real-world applications in speech emotion recognition.
Evaluation of different augmentation techniques
As covered in the experiments section, various data augmentation methods were applied to the parallel CNNs with the Transformer model using MFCC features on version one of the ASVP-ESD dataset, with their outcomes summarized in Table 2. The results demonstrate the effectiveness of these techniques in enhancing model performance. When no augmentation was applied, the model achieved the baseline performance. Applying RUS and class weighting enhanced the result by 8%, highlighting their impact on addressing class imbalance. SMOTE and pitch-shifting also contributed positively, with pitch-shifting leading to the most significant improvement. This technique, which modifies the pitch of audio signals, introduces beneficial variations conducive to SER tasks. However, the highest accuracy was observed with AWGN, which enhanced the result by 12%, reducing the natural noise influence inherent in the natural dataset.
| Augmentation techniques | Results (Accuracy) |
|---|---|
| No augmentation | 51% |
| Class weighting | 59% |
| RUS | 59% |
| SMOTE | 60% |
| Pitch-shifting | 62% |
| AWGN | 63% |
To evaluate the specific impact of AWGN on individual emotions, Fig. 11 presents the result in confusion matrices with and without AWGN augmentation. The number of emotion classes that were classified correctly increased, and the number of misclassified samples decreased in most classes after applying the AWGN augmentation, with improvements in correct predictions for the happy and neutral classes. Although there is a slight decrease in some emotions, such as the surprise class, this is a minor change, given the progress in other emotions.
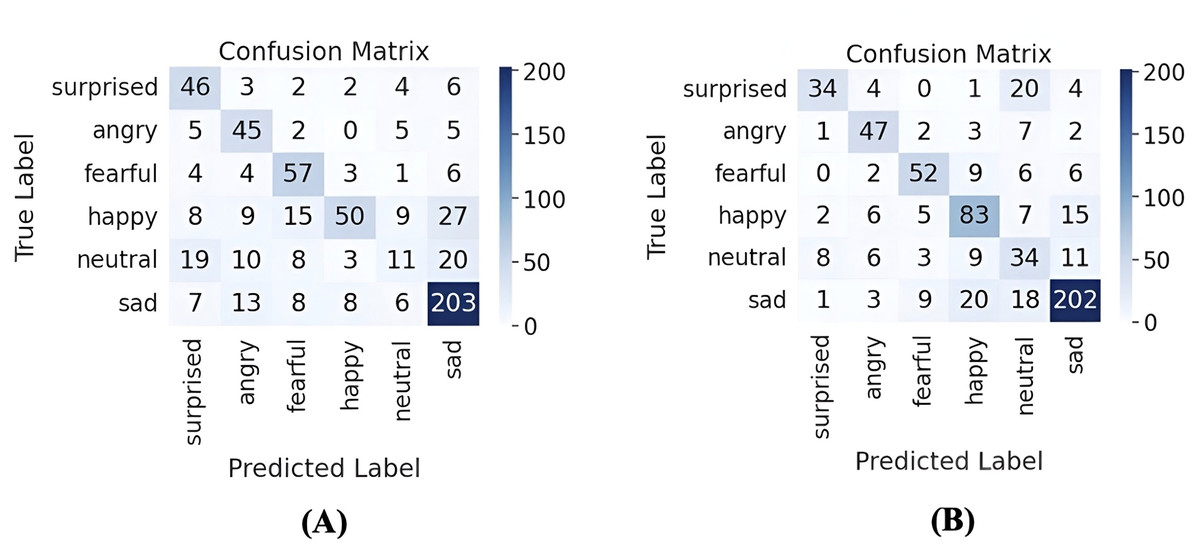
Figure 11: Confusion matrices of emotion recognition using parallel CNNs with transformer and hierarchical co-attention model with and without AWGN augmentation on ASVP-ESD version one.
(A) Confusion matrix without AWGN augmentation, and (B) confusion matrix with AWGN augmentation.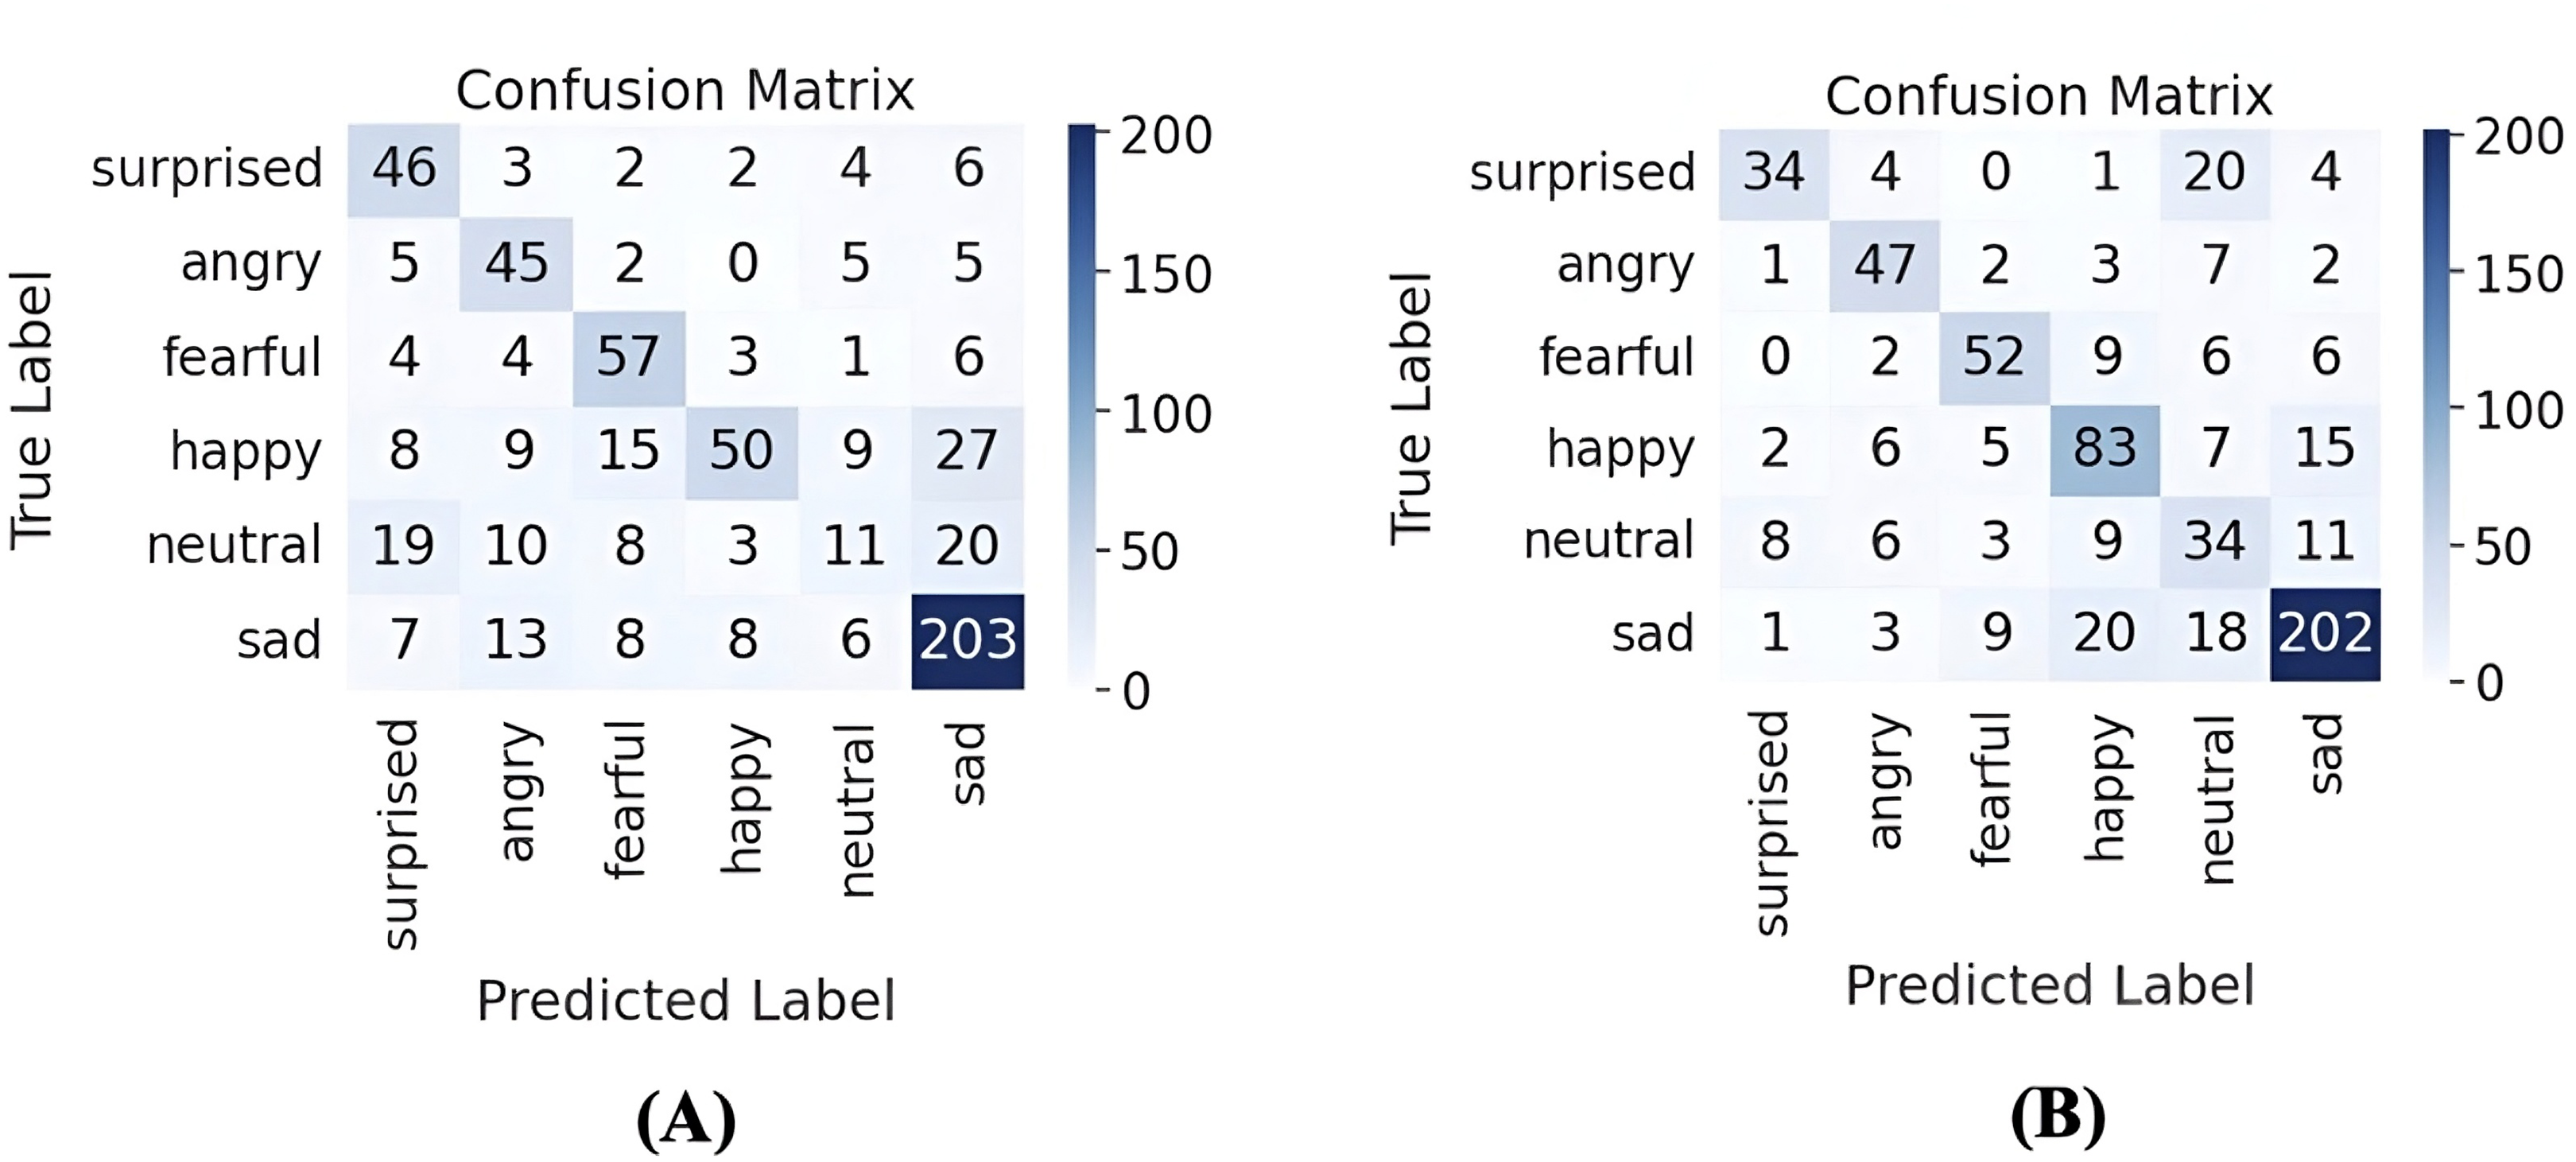
Table 3 provides insights into the impact of AWGN augmentation on the performance metrics of parallel CNNs with a Transformer and hierarchical co-attention model across various datasets. The results demonstrate improvements ranging from 3% to 7% in WA and UW. Without AWGN augmentation, the model exhibited varying performance across datasets. However, upon applying AWGN augmentation, enhancements in WA and UW were consistently observed across all datasets. Upon conducting a comparative analysis of these augmentation techniques and their corresponding results, it becomes evident that AWGN was the most promising method for performance enhancement in the experiments. This is attributed to its ability to introduce diverse noise patterns in the new synthetic samples, which improves the training data, balances the classes, and enhances the model’s robustness to various acoustic environments and speech variations. Therefore, AWGN was selected as the augmentation technique for all the following experiments due to its remarkable efficacy in enhancing model performance.
| Dataset | No AWGN augmentation | With AWGN augmentation |
|---|---|---|
| ASVP-ESD V 1 | WA: 67% | WA: 70% |
| UW: 62% | UW: 67% | |
| ASVP-ESD V 2 | WA: 47% | WA: 52% |
| UW: 42% | UW: 45% | |
| ShEMO | WA: 70% | WA: 76% |
| UW: 59% | UW: 68% |
Performance of different feature types
The influence of different input features on the model performance is explored. Mel spectrograms were extracted using diverse configurations, including Mel bands set to 128 and 40. The selection of Mel bands within the range of 40 to 128 is standard practice in speech and audio processing, with higher Mel values offering finer spectral details. However, this also increases feature vector dimensionality, potentially necessitating more computational resources and memory. Additionally, MFCCs were computed with 40 Mel bands. The investigation focused on combining the Mel spectrogram and MFCC under two scenarios: one with 80 features, where both Mel bands were set to 40, and another with 168 features, with Mel bands for the Mel spectrogram set to 128 and Mel bands of the MFCC to 40. As depicted in Table 4, the results highlight the impact of feature variations on model accuracy when utilizing parallel CNNs with a Transformer on version one of the ASVP-ESD dataset. The combination of the Mel spectrogram with 128 Mel bands and the MFCC with 40 Mel bands yielded the highest accuracy. This outcome underscores the efficacy of integrating these specific feature configurations, as it harnesses both the rich spectral information captured by Mel spectrograms and the temporal characteristics represented by MFCCs, thereby enhancing the overall model performance.
| Features | Test accuracy |
|---|---|
| Mel spectrogram, Mel = 40 | 59% |
| Mel spectrogram, Mel = 128 | 61% |
| MFCC, Mel = 40 | 63% |
| MFCC, Mel = 128 | 62% |
| Combination of Mel spectrogram Mel = 40 and MFCC Mel = 40 | 65% |
| Combination of Mel spectrogram Mel = 40 and MFCC Mel = 128 | 66% |
Performance of the proposed models on ASVP-ESD version 1
Different architectural designs were tested on the three datasets to determine the most effective way to incorporate co-attention mechanisms into the emotion recognition model. For the ASVP-ESD version 1, the first model, which included no co-attention and parallel CNNs with Transformer, yielded results as shown in Table 5. This low performance can be due to the narrow interaction between the CNN and Transformer outputs. Simple concatenation combines features and does not fully capture the complex relationships between the local patterns found by CNNs and the broader, sequence-based context handled by the Transformer. As a result, the model may ignore the important relationship between different characteristics, resulting in less accurate representations of emotions and poor overall performance. This baseline model establishes a reference point for evaluating the effectiveness of subsequent enhancements. The second model, parallel CNNs with Transformer and one co-attention between two CNNs, demonstrated improvements across all metrics. This suggests that incorporating a single co-attention enhanced the model’s ability to capture relevant features and relationships within the input data, thereby improving emotion recognition. The third model, parallel CNNs with Transformer and hierarchical co-attention, exhibited additional performance improvements. A hierarchical co-attention mechanism enabled the model to focus on different features, thereby improving its overall recognition capabilities. The model with One Co-attention fusion for all three inputs. Although this approach utilizes a unified co-attention for multiple inputs, it did not outperform the model with hierarchical co-attention. The results indicate that incorporating co-attention has a positive impact on emotion recognition performance, highlighting the significance of capturing both global and local dependencies within the input data, thereby enhancing the accuracy and robustness of emotion recognition models. Table 5 summarises the performance of the four models on the ASVP-ESD dataset version 1, giving more details about their accuracy in recognizing different emotions. The lower accuracy for emotions like happy, angry, and fear in the parallel CNNs with Transformer and hierarchical co-attention model may be due to its inability to capture complex interactions between features, which reduces its ability to emphasize direct features that simpler models can capture more effectively. Anger and Fear also share overlapping acoustic characteristics with sadness, such as heightened intensity, which can lead to confusion. Furthermore, since the data used in the experiment is natural, it contains background noise, which makes the model sensitive to these emotions; this explains why the model did not perform as well in those emotions, despite achieving the highest overall result.
| Model used | Happy | Sad | Angry | Fear | Surprised | Neutral |
|---|---|---|---|---|---|---|
| Parallel CNNs with Transformer | 70.33% | 70.20% | 72.58% | 62.66% | 58.73% | 49.29% |
| Parallel CNNs with Transformer and one co-attention | 59.32% | 76.73% | 75.80% | 80.00% | 60.31% | 49.29% |
| Parallel CNNs with Transformer and hierarchical co-attention | 66.10% | 79.59% | 70.97% | 64.00% | 74.60% | 47.89% |
| One Co-attention fusion for all inputs | 63.55% | 81.42% | 79.03% | 72.00% | 46.03% | 43.66% |
Performance of the parallel CNNs with transformer and hierarchical co-attention on ASVP-ESD dataset version 1
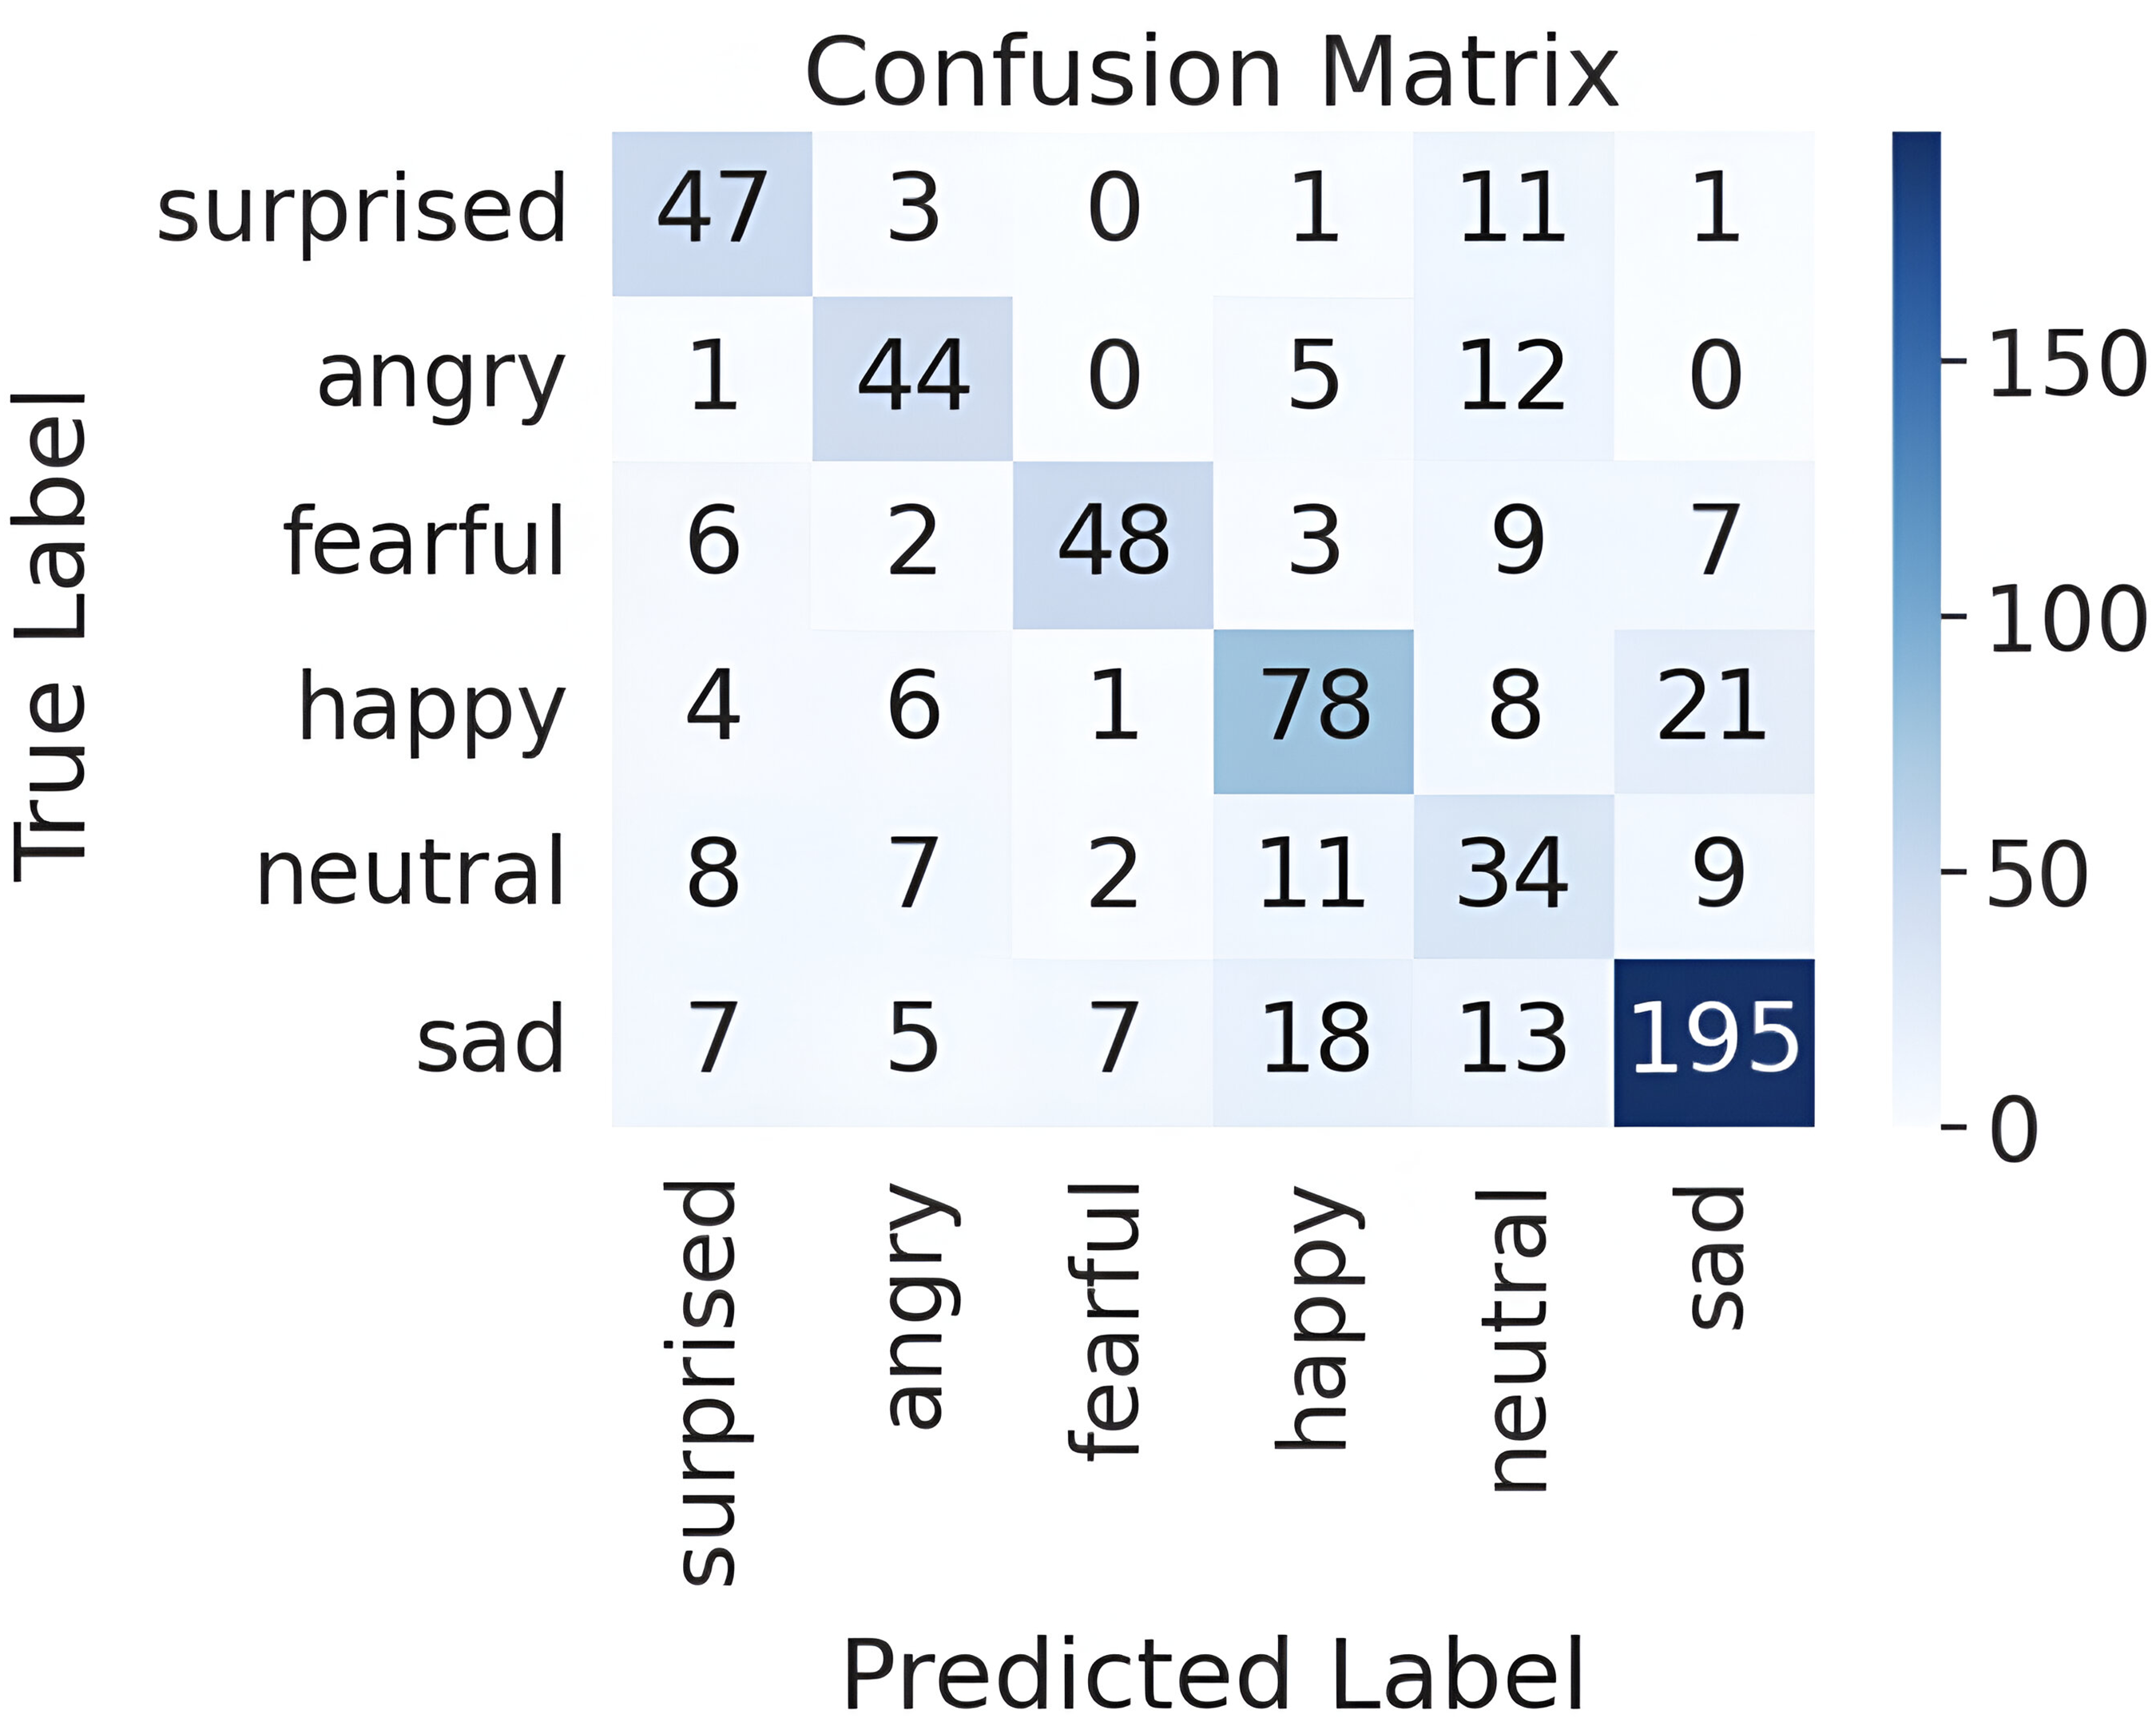
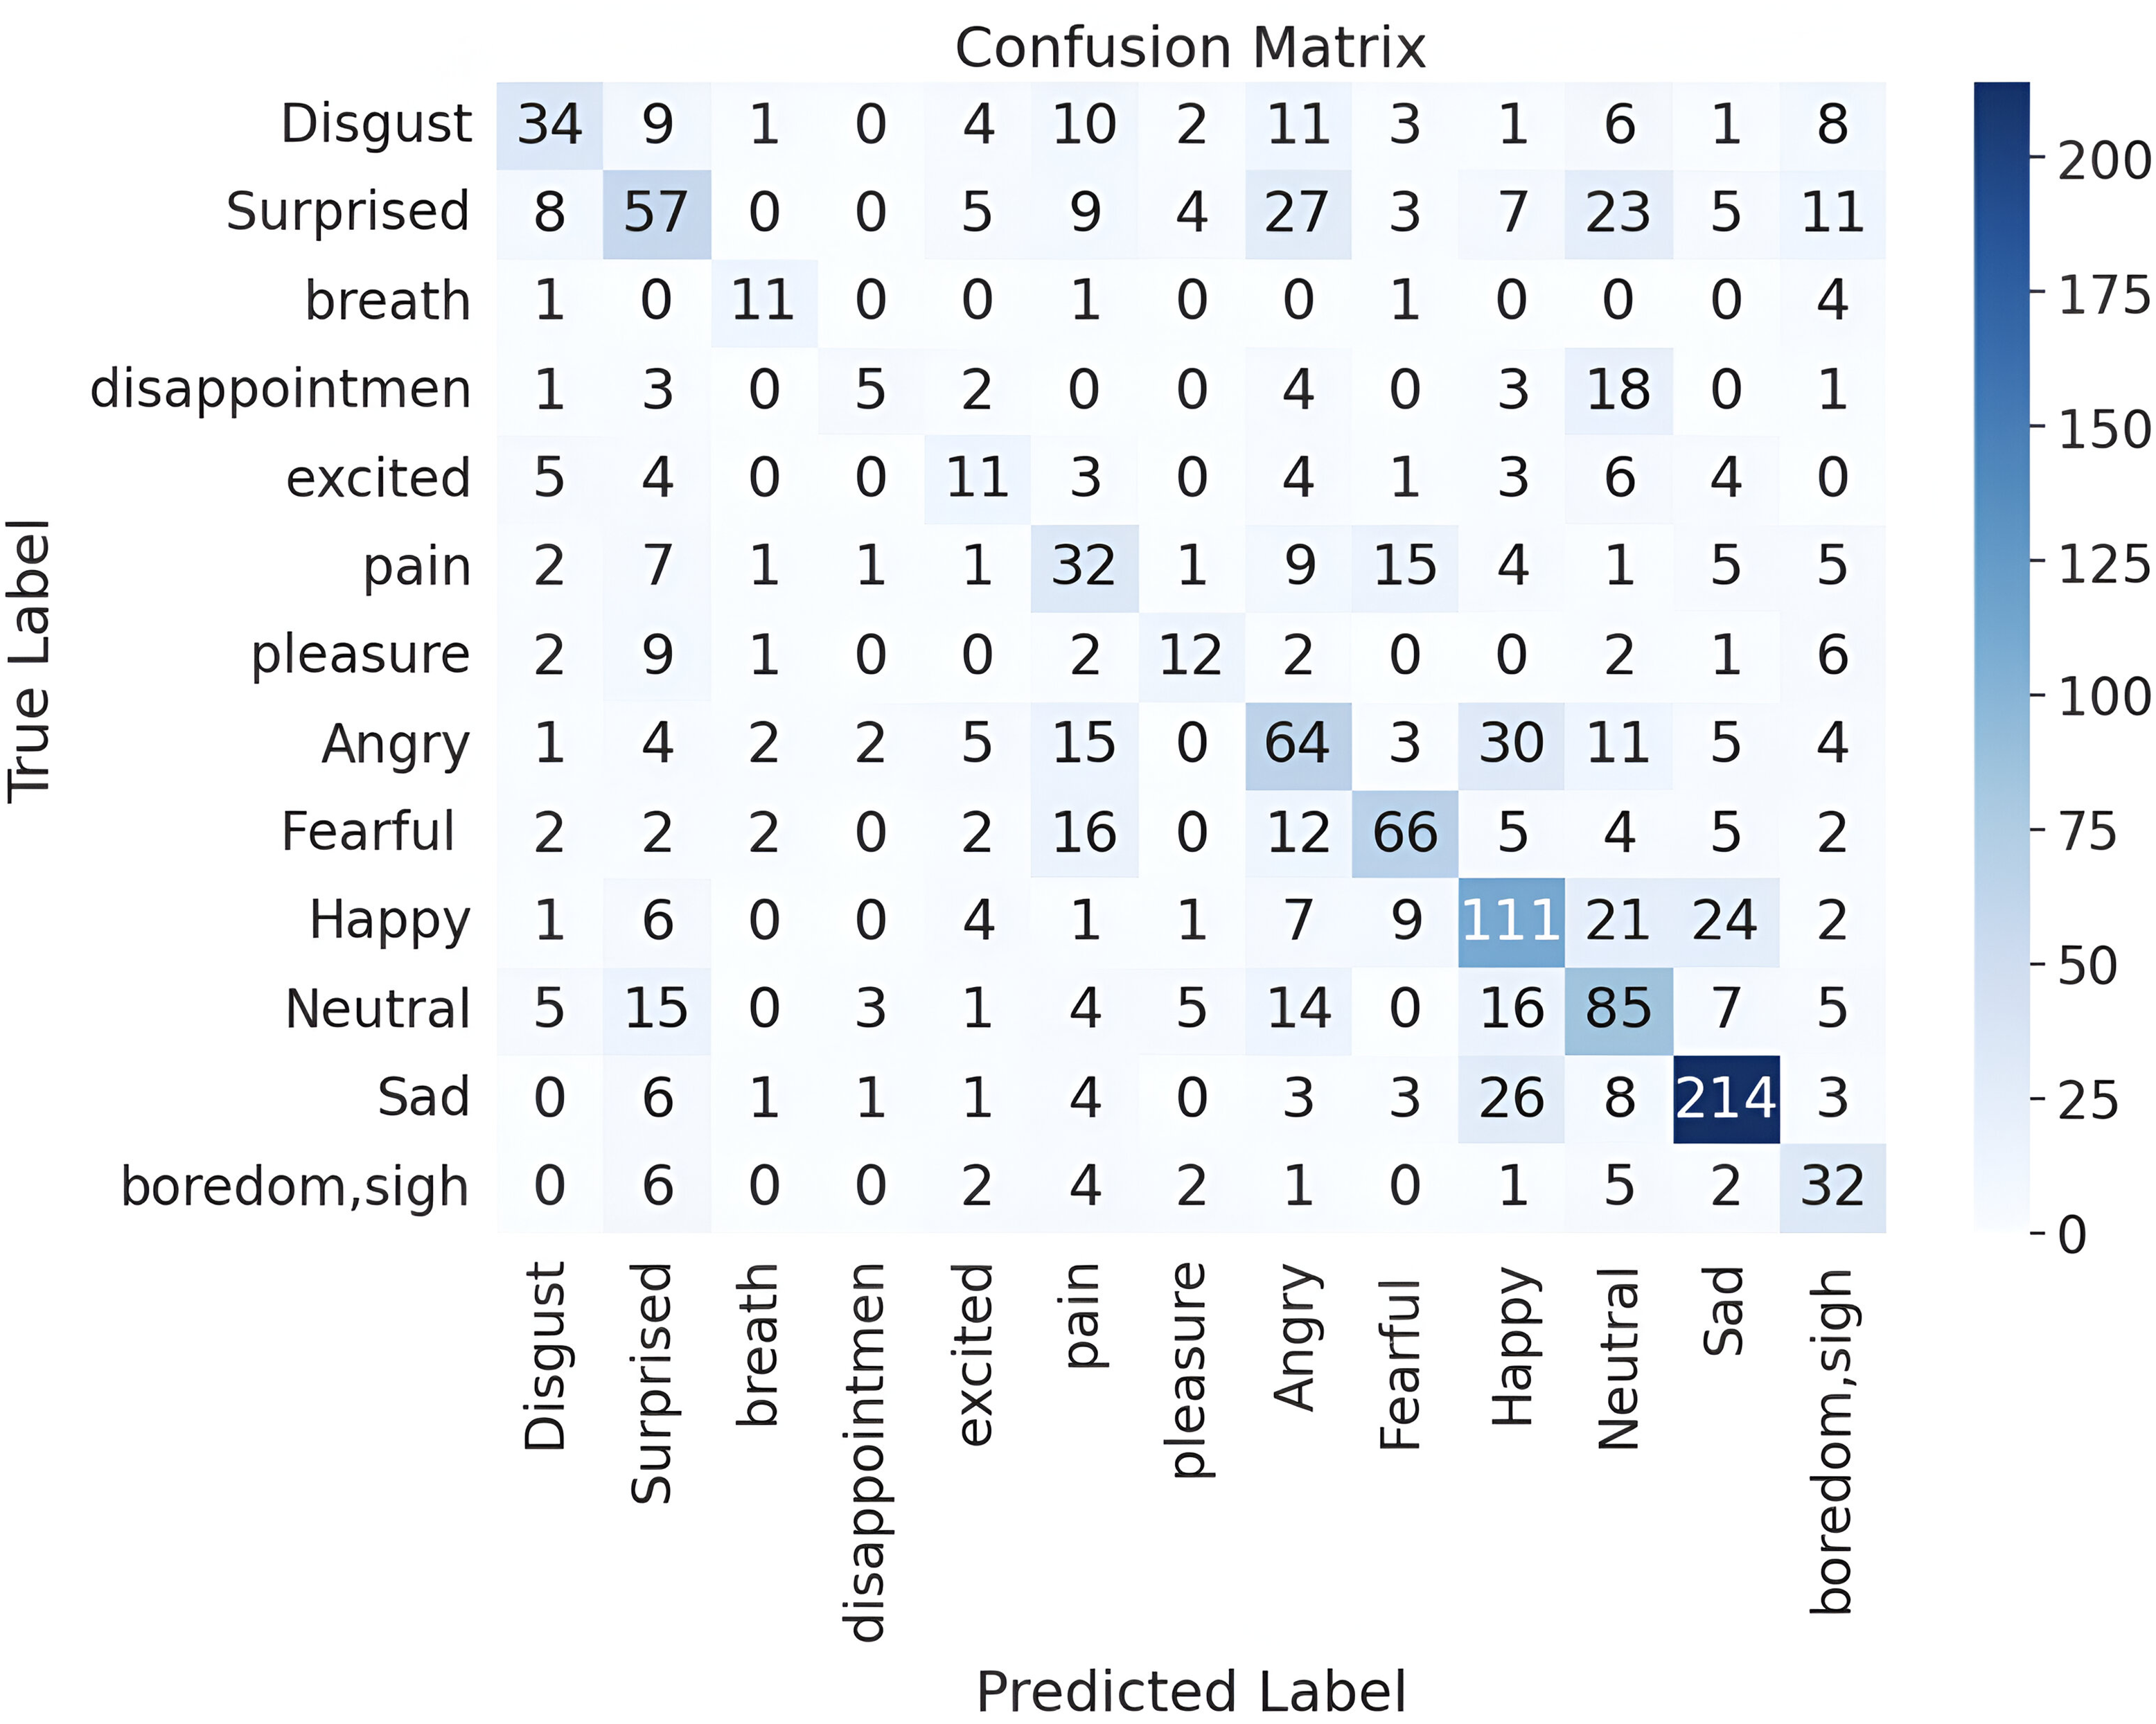
A detailed examination is conducted on the performance of parallel CNNs with the Transformer and Hierarchical Co-Attention model on the ASVP-ESD dataset. Building upon the results presented in ‘Performance of the Proposed Models on ASVP-ESD Version 1’, which highlighted the overall enhancements achieved with the inclusion of hierarchical co-attention, this section focuses on this model, which shows promising improvements. The hierarchical co-attention mechanism enables the model to distinguish and prioritize different features within the input data, thereby enhancing its recognition capabilities. The confusion matrix in Fig. 12 displays the model’s performance for emotion recognition. Based on the diagonal values, which indicate correct predictions, the model performs best at identifying sad, with the highest number of correct classifications, followed by happy. This indicates that the model has learned features that are quite distinct for these emotions, likely due to their expressive characteristics, which are easier to distinguish. It also performs relatively well with surprise, anger, and fearful emotions. However, the performance drops for the neutral class. The nature of the neutral samples in the data has limited sample and high-level variation between neutral sounds, including silence, yawn, and other similar sounds (Dejoli et al., 2020). After listening to the samples, it was observed that the natural emotion carries a slow, low tone, which might have contributed to the confusion with other emotions. This diversity introduces ambiguity in labeling and model training, making it inherently difficult to distinguish neutral emotions. Additionally, the overlapping acoustic features with other emotions, such as sadness or boredom, further increase classification challenges. Additionally, samples from the surprise class were misclassified as neutral. This aligns with the study introduced by the dataset (Dejoli et al., 2020), which found that specific emotions, such as surprise, realization, neutrality, and contempt, show close similarities in speech utterances. As Dejoli et al. (2020) reported, their model achieved an accuracy of 74.39%. Due to the lack of detailed information and the inability to communicate with the authors, we were unable to reimplement their model for a fair comparison. Some of their data preprocessing steps, such as data removal, were not specified. Therefore, we have reported their results as published. Table 6 comprehensively analyzes precision, recall, and F1-score metrics in the ASVP-ESD V1 datasets used for various emotions.
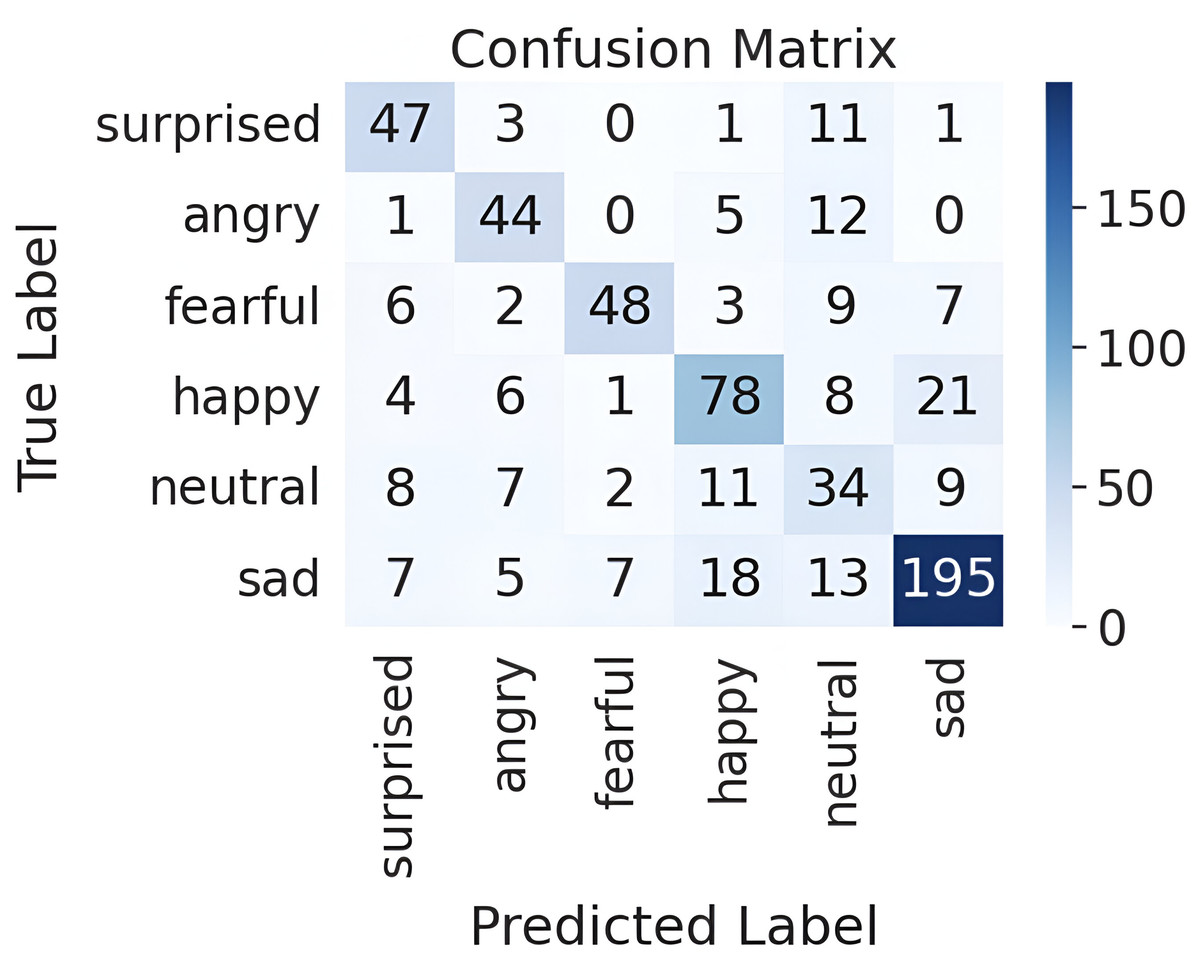
Figure 12: Confusion matrix for the parallel CNNs with transformer and hierarchical co-attention model on ASVP-ESD dataset version 1.
| Emotion | Precision | Recall | F1-score |
|---|---|---|---|
| Surprised | 64% | 75% | 69% |
| Angry | 66% | 71% | 68% |
| Fearful | 83% | 64% | 72% |
| Happy | 67% | 66% | 67% |
| Neutral | 39% | 48% | 43% |
| Sad | 84% | 80% | 82% |
Performance of the proposed models on ASVP-ESD version 2
Various architectural designs were tested on the ASVP-ESD version 2 dataset, mirroring the process used in version one. The baseline model, Parallel CNNs with Transformer, was compared against progressively enhanced versions. Adding a single co-attention layer resulted in slight improvements across all metrics. However, the most significant performance boost was observed in the third model, which incorporated hierarchical co-attention. This model improved performance in WA and UW compared to the baseline. The fourth model, which also utilized one co-attention layer, achieved results similar to those of the third model. Overall, the third model stands out as the most effective across most emotional categories. Table 7 presents a detailed comparison of the performance of the four models on the ASVP-ESD version 2 dataset, providing insights into their ability to recognize various emotions.
| Emotion | Parallel CNNs with Transformer | Parallel CNNs with Transformer and one co-attention | Parallel CNNs with Transformer and hierarchical co-attention | One co-attention fusion for all inputs |
|---|---|---|---|---|
| Disgust | 80% | 6.6% | 37.7% | 27.7% |
| Surprised | 4.4% | 42.7% | 35.8% | 56.6% |
| Breath | 38.8% | 0% | 61.1% | 66.6% |
| Disappointment | 0% | 0% | 13.5% | 8.1% |
| Excited | 0% | 0% | 26.8% | 21.9% |
| Pain | 39.2% | 10.7% | 38.0% | 16.6% |
| Pleasure | 5.4% | 10.8% | 32.4% | 29.7% |
| Angry | 23.9% | 39.0% | 43.8% | 41.7% |
| Fearful | 27.1% | 53.3% | 55.9% | 61% |
| Happy | 12.2% | 18.1% | 59.3% | 52.4% |
| Neutral | 55% | 73.7% | 53.1% | 36.2% |
| Sad | 79.2% | 74.0% | 79.2% | 82.5% |
| Boredom | 3.6% | 0% | 58.1% | 69% |
Performance of the parallel CNNs with transformer and hierarchical co-attention on ASVP-ESD dataset version 2
The second version of the ASVP-ESD dataset offers a more diverse and complex range of emotional expressions, capturing a broader spectrum of human experiences. This version includes emotions across multiple languages, including Chinese, English, and French. Our model leverages acoustic features that capture universal vocal cues, enabling it to generalize effectively across these languages without requiring language-specific adaptation. This enhances its robustness for cross-lingual SER. However, the increased diversity introduces challenges in capturing features, particularly complex emotions that may be difficult to distinguish and easily confused with similar emotions. Despite these challenges, implementing the dataset in parallel CNNs with a Transformer and hierarchical co-attention model yielded significant performance improvements. These results shed light on the complexities introduced by the expanded emotional categories and the associated class imbalances (Griffiths, 2002). The confusion matrix presented in Fig. 13 provides insights into the performance of an emotion recognition model. It performs well in identifying certain emotions, indicating a strong ability to capture the unique characteristics or patterns associated with those states. Conversely, the model tends to confuse certain emotions with others, which can be attributed to the subtle nuances and complexity inherent in natural, real-world data. The misclassifications may be a result of overlapping features between different emotional states. Emotions typically expressed with similar vocal tones and patterns might be more difficult for the model to distinguish. Moreover, since the data represents natural scenarios, the emotional expressions may not be as exaggerated as those in a controlled environment, further challenging the model’s accuracy. Table 8 represents the precision, recall, and F1-score metrics in the ASVP-ESD V2 dataset. ASVP-ESD V2 introduces more emotions for evaluation. Disappointment, breath, and excitement exhibit weaker overall performance than other emotions in the dataset. This could be attributed to their subjective and complex nature, which may involve subtle cues and contextual nuances that are challenging for the model to accurately capture and interpret.
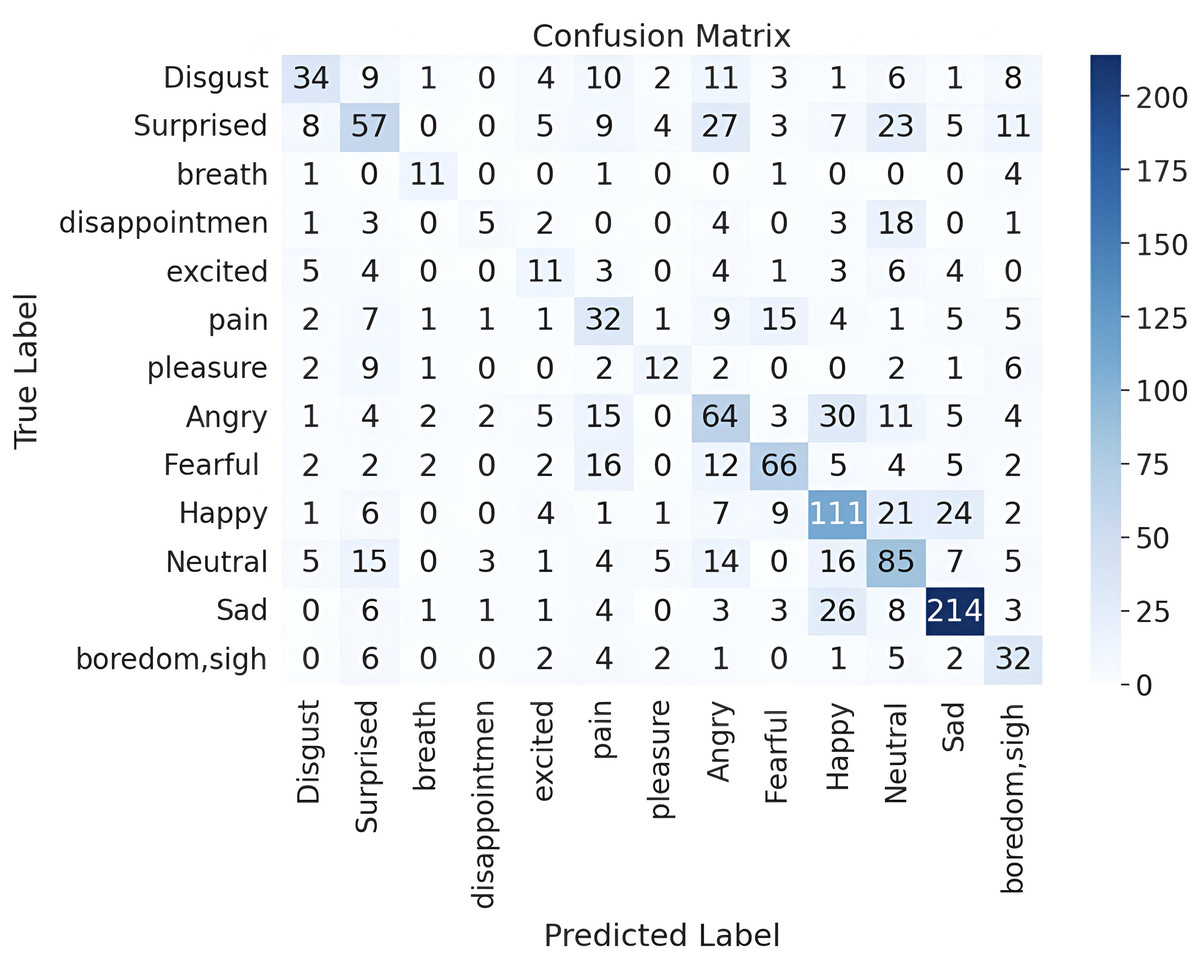
Figure 13: Confusion matrix for the parallel CNNs with transformer and hierarchical co-attention model on ASVP-ESD dataset version 2.
| Emotion | Precision | Recall | F1-score |
|---|---|---|---|
| Surprised | 45% | 36% | 40% |
| Angry | 41% | 44% | 42% |
| Fearful | 63% | 56% | 59% |
| Happy | 54% | 59% | 56% |
| Neutral | 45% | 53% | 49% |
| Sad | 78% | 79% | 79% |
| Disgust | 55% | 38% | 45% |
| Breath | 58% | 61% | 59% |
| Disappointment | 42% | 14% | 20% |
| Excited | 29% | 27% | 28% |
| Pain | 32% | 38% | 35% |
| Pleasure | 44% | 32% | 38% |
| Boredom | 39% | 58% | 46% |
Another experiment was conducted using the same filtering methodology as Sawin (2023), which involved removing all audio files labeled with breath sounds and filtering out all Chinese-language samples, resulting in 9,920 samples remaining. As a result, it improved by almost 2%, reaching an accuracy of 52% compared to the result reported by Swain (Sawin, 2023), which achieved an accuracy of 50.27%. Removing audio files labeled with breath sounds and filtering out Chinese-language samples reduced the dataset noise and eliminated potentially confusing elements. Breath sounds, while present in audio recordings, do not directly represent specific emotional states and may introduce ambiguity, thus confusing the model. Additionally, some Chinese-language samples contain high background noise levels, which may hinder the model’s ability to distinguish emotional features accurately. Excluding these sample results, more apparent distinctions between different emotional states are evident, which enhances performance.
Ekman’s theory posits six basic emotions: anger, neutrality, happiness, sadness, disgust, and fear (Ekman, 1999), and most studies use these emotions for recognition purposes. In light of this theory, an additional experiment was conducted using the second version of the ASVP-ESD dataset. A filtering process was employed to retain only those samples corresponding to the six basic emotions. As a result, out of the 13,965 samples in the dataset, 9,693 samples were selected for further analysis. The experiment evaluated the model’s performance when confronted with basic emotions. The results revealed a WA of 67%, UW of 65%, and accuracy of 68%. This outcome suggests that more complex emotion models face challenges in recognition compared to their counterparts, which are designed to identify the fundamental and widely recognized basic emotions.
Complex emotions often involve subtle variations in vocal tone, intensity, and timing, making their detection challenging. Additionally, their subjective and context-dependent nature makes interpretation from sound alone tricky. Unlike basic emotions, which have clearer acoustic correlates and are relatively universal, complex emotions may involve combinations of multiple emotions or exhibit overlapping features with other emotions, leading to ambiguity in classification; furthermore, cultural and individual differences further complicate the recognition of complex emotions, as expressions vary widely across different contexts and individuals (Ekman, 1999).
Performance of the proposed models on ShEMO dataset
In evaluating the emotion recognition models on the ShEMO dataset, the initial results of the Parallel CNNs with Transformer showed moderate performance. The integration of co-attention demonstrated discernible enhancements across various metrics. The parallel CNNs with Transformer and hierarchical co-attention further improved the results significantly. These findings highlight the crucial role of co-attention mechanisms, particularly hierarchical co-attention, in refining emotion recognition models designed explicitly for the ShEMO dataset. Table 9 summarizes the performance of the four models on the ShEMO dataset, providing detailed insights into their accuracy in recognizing various emotions.
| Model used | Anger | Happiness | Neutral | Sadness | Surprise |
|---|---|---|---|---|---|
| Parallel CNNs with Transformer | 96.2% | 0% | 65% | 13.3% | 8.6% |
| Parallel CNNs with Transformer and one co-attention | 83.9% | 14.2% | 85.4% | 53.3% | 52.1% |
| Parallel CNNs with Transformer and hierarchical co-attention | 80.1% | 28.5% | 91.2% | 48.8% | 60.8% |
| One Co-attention fusion for all inputs | 92.4% | 14.2% | 77.6% | 57.7% | 34.7% |
Performance of the parallel CNNs with transformer and hierarchical co-attention on ShEMO dataset
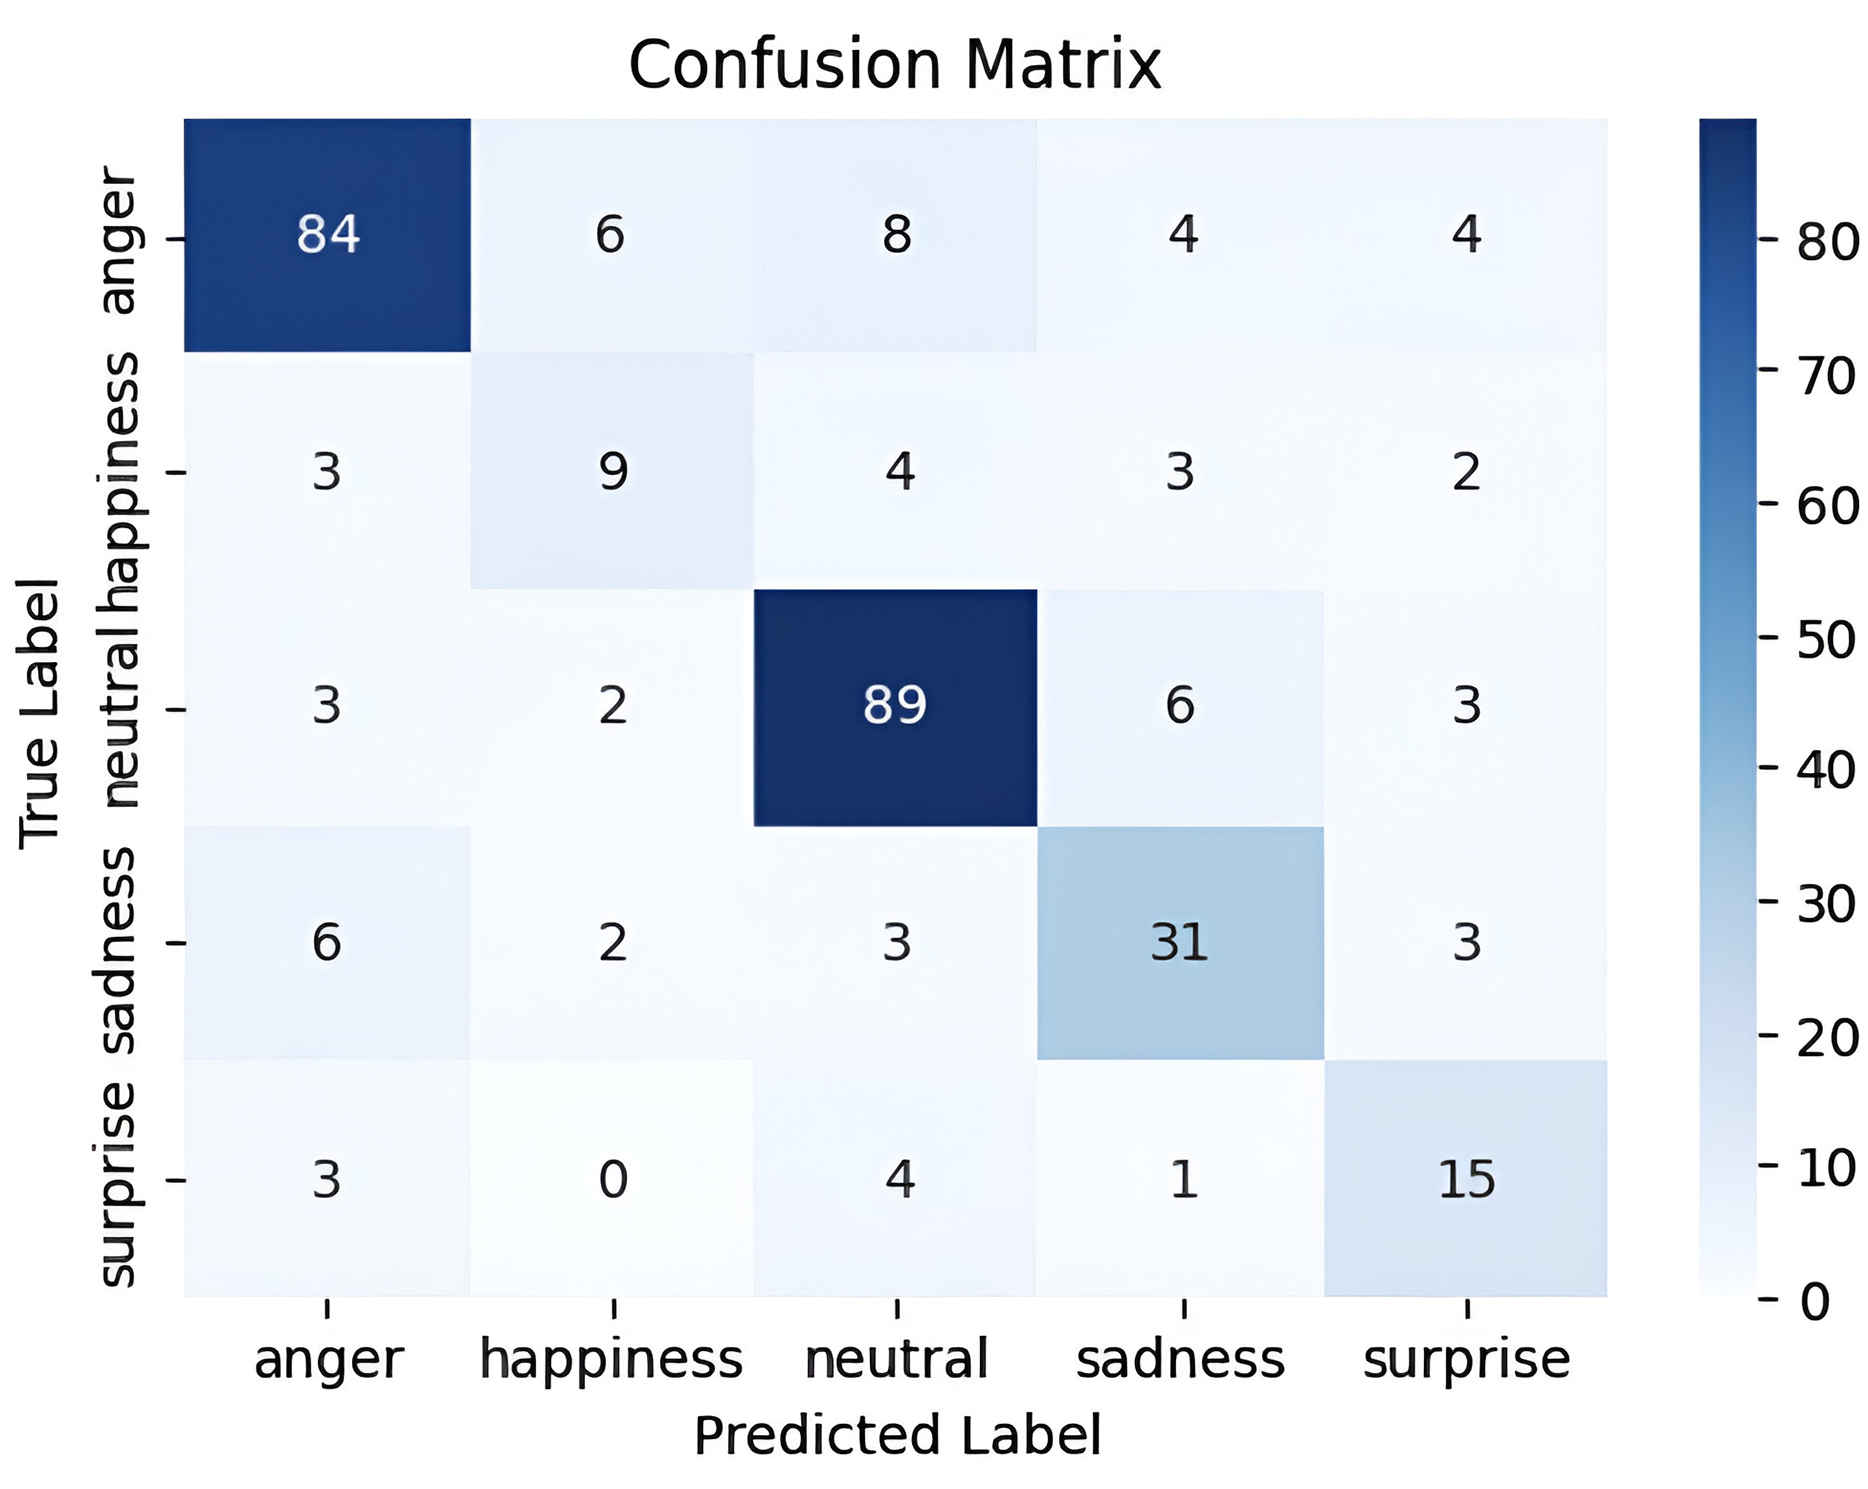
The ShEMO dataset represents semi-natural data that mirrors real-world scenarios. The experiment on Parallel CNNs with Transformer and hierarchical co-attention model yielded satisfactory results. It achieved a good performance compared to the results of Yazdani, Simchi & Shekofteh (2021), where a 1DCNN achieved a WA of 78.29% and UW of 65.20%. The baseline accuracy using SVM was reported as 58.2% in the article introducing the dataset (Mohamad Nezami, Jamshid Lou & Karami, 2019). Figure 14 shows the confusion matrix for this dataset. Table 10 provides a comprehensive analysis of precision, recall, and F1-score metrics in the ShEMO datasets. The ShEMO dataset demonstrates high precision and recall for anger and neutral emotions, while happiness shows difficulties in accurately capturing this emotion.
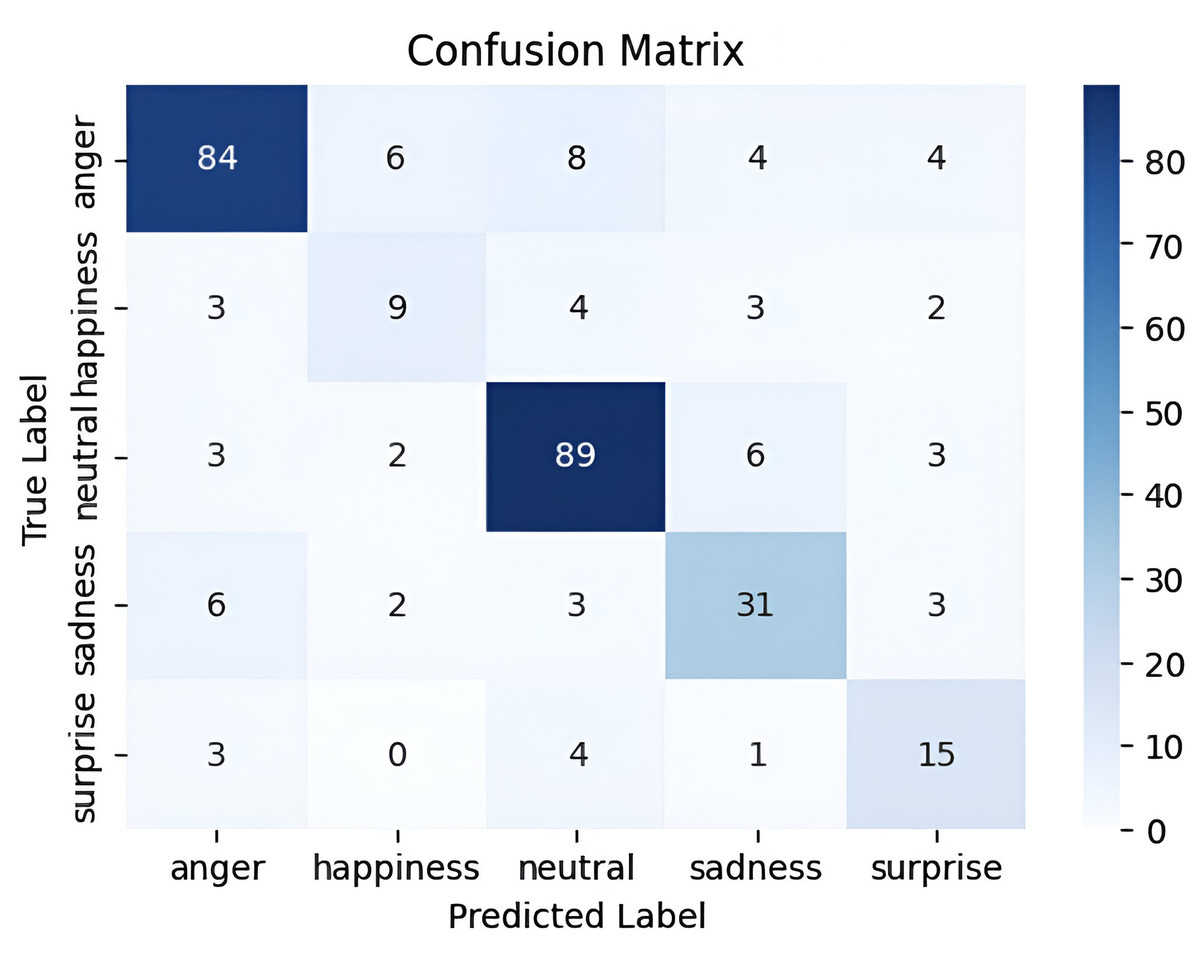
Figure 14: Confusion matrix for the parallel CNNs with transformer and hierarchical co-attention model on ShEMO dataset.
| Emotion | Precision | Recall | F1-score |
|---|---|---|---|
| Anger | 85% | 79% | 82% |
| Happiness | 47% | 43% | 45% |
| Neutral | 82% | 86% | 84% |
| Sadness | 69% | 69% | 69% |
| Surprise | 56% | 65% | 60% |
The performance evaluation across different datasets highlights the challenges and complexities of accurately recognizing emotions, particularly those that are nuanced and subtle. Despite these challenges, the model performs well across the datasets used, particularly for the natural dataset, demonstrating its robustness and effectiveness in capturing a wide range of emotional expressions. However, certain emotions pose difficulties for recognition due to their complexity or similarity to other emotions, akin to humans’ challenges in discerning subtle emotional nuances.
This study examined various architectures to determine the most effective way to integrate co-attention. Table 11 summarizes the results of the four models’ different experiments applied to versions one and two of the ASVP-ESD and ShEMO datasets.
| Model used | ASVP-ESD V1 | ASVP-ESD V2 | ShEMO |
|---|---|---|---|
| Parallel CNNs with Transformer | 66% WA | 36% WA | 67% WA |
| 63% UW | 28% UW | 45% UW | |
| 66% TA | 37% TA | 68% TA | |
| Parallel CNNs with Transformer and one co-attention | 69% WA | 39% WA | 72% WA |
| 66% UW | 25% UW | 57% UW | |
| 69% TA | 40% TA | 72% TA | |
| Parallel CNNs with Transformer and Hierarchical co-attention | 70% WA | 52% WA | 76% WA |
| 67% UA | 45% UA | 68% UA | |
| 70% TA | 52% TA | 77% TA | |
| Parallel CNNs with Transformer and one co-attention | 69% WA | 50% WA | 72% WA |
| 64% UW | 43% UW | 55% UW | |
| 69% TA | 51% TA | 72% TA |
Incorporating co-attention in emotion recognition models across all three datasets improved the performance by enhancing the ability to capture relevant features and relationships within the input data. Among the various methods employed, the parallel CNNs with Transformer and hierarchical co-attention consistently yielded the most promising results across all three datasets compared to the others, due to hierarchical co-attention being useful in fusing different types of features. Further experiments have been conducted on various datasets using the same model setup, yielding experimental results that demonstrate the generalizability of the proposed model across multiple datasets. The model consistently achieved good performance metrics, demonstrating its efficacy in diverse real-world scenarios, as shown in Fig. 15. While previous studies often focus on a single dataset, this study expands the scope by evaluating the model’s performance across various datasets, particularly on natural and semi-natural datasets, thereby providing a comprehensive assessment of its capabilities. The model’s performance remained comparable despite the inherent complexities and challenges of each dataset, including subtle emotional nuances. This highlights its versatility and reliability in real-world applications.
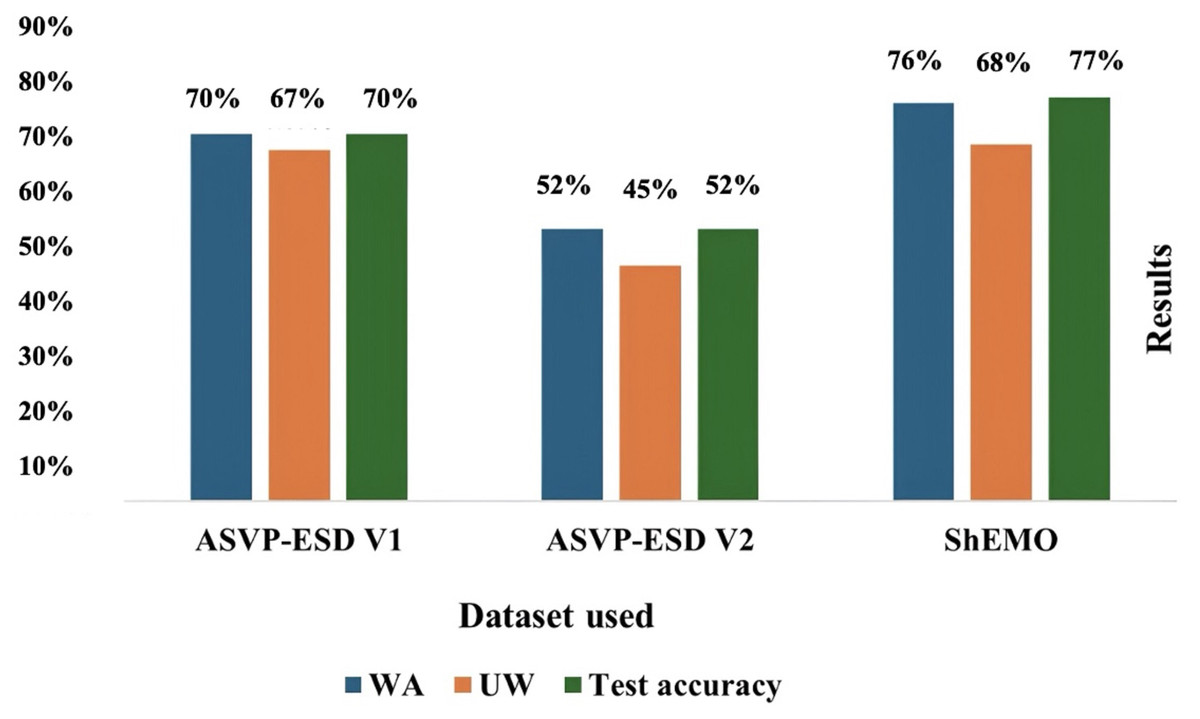
Figure 15: The performance of parallel CNNs with transformer and hierarchical co-attention model on ASVP-ESD version one and two, and ShEMO.
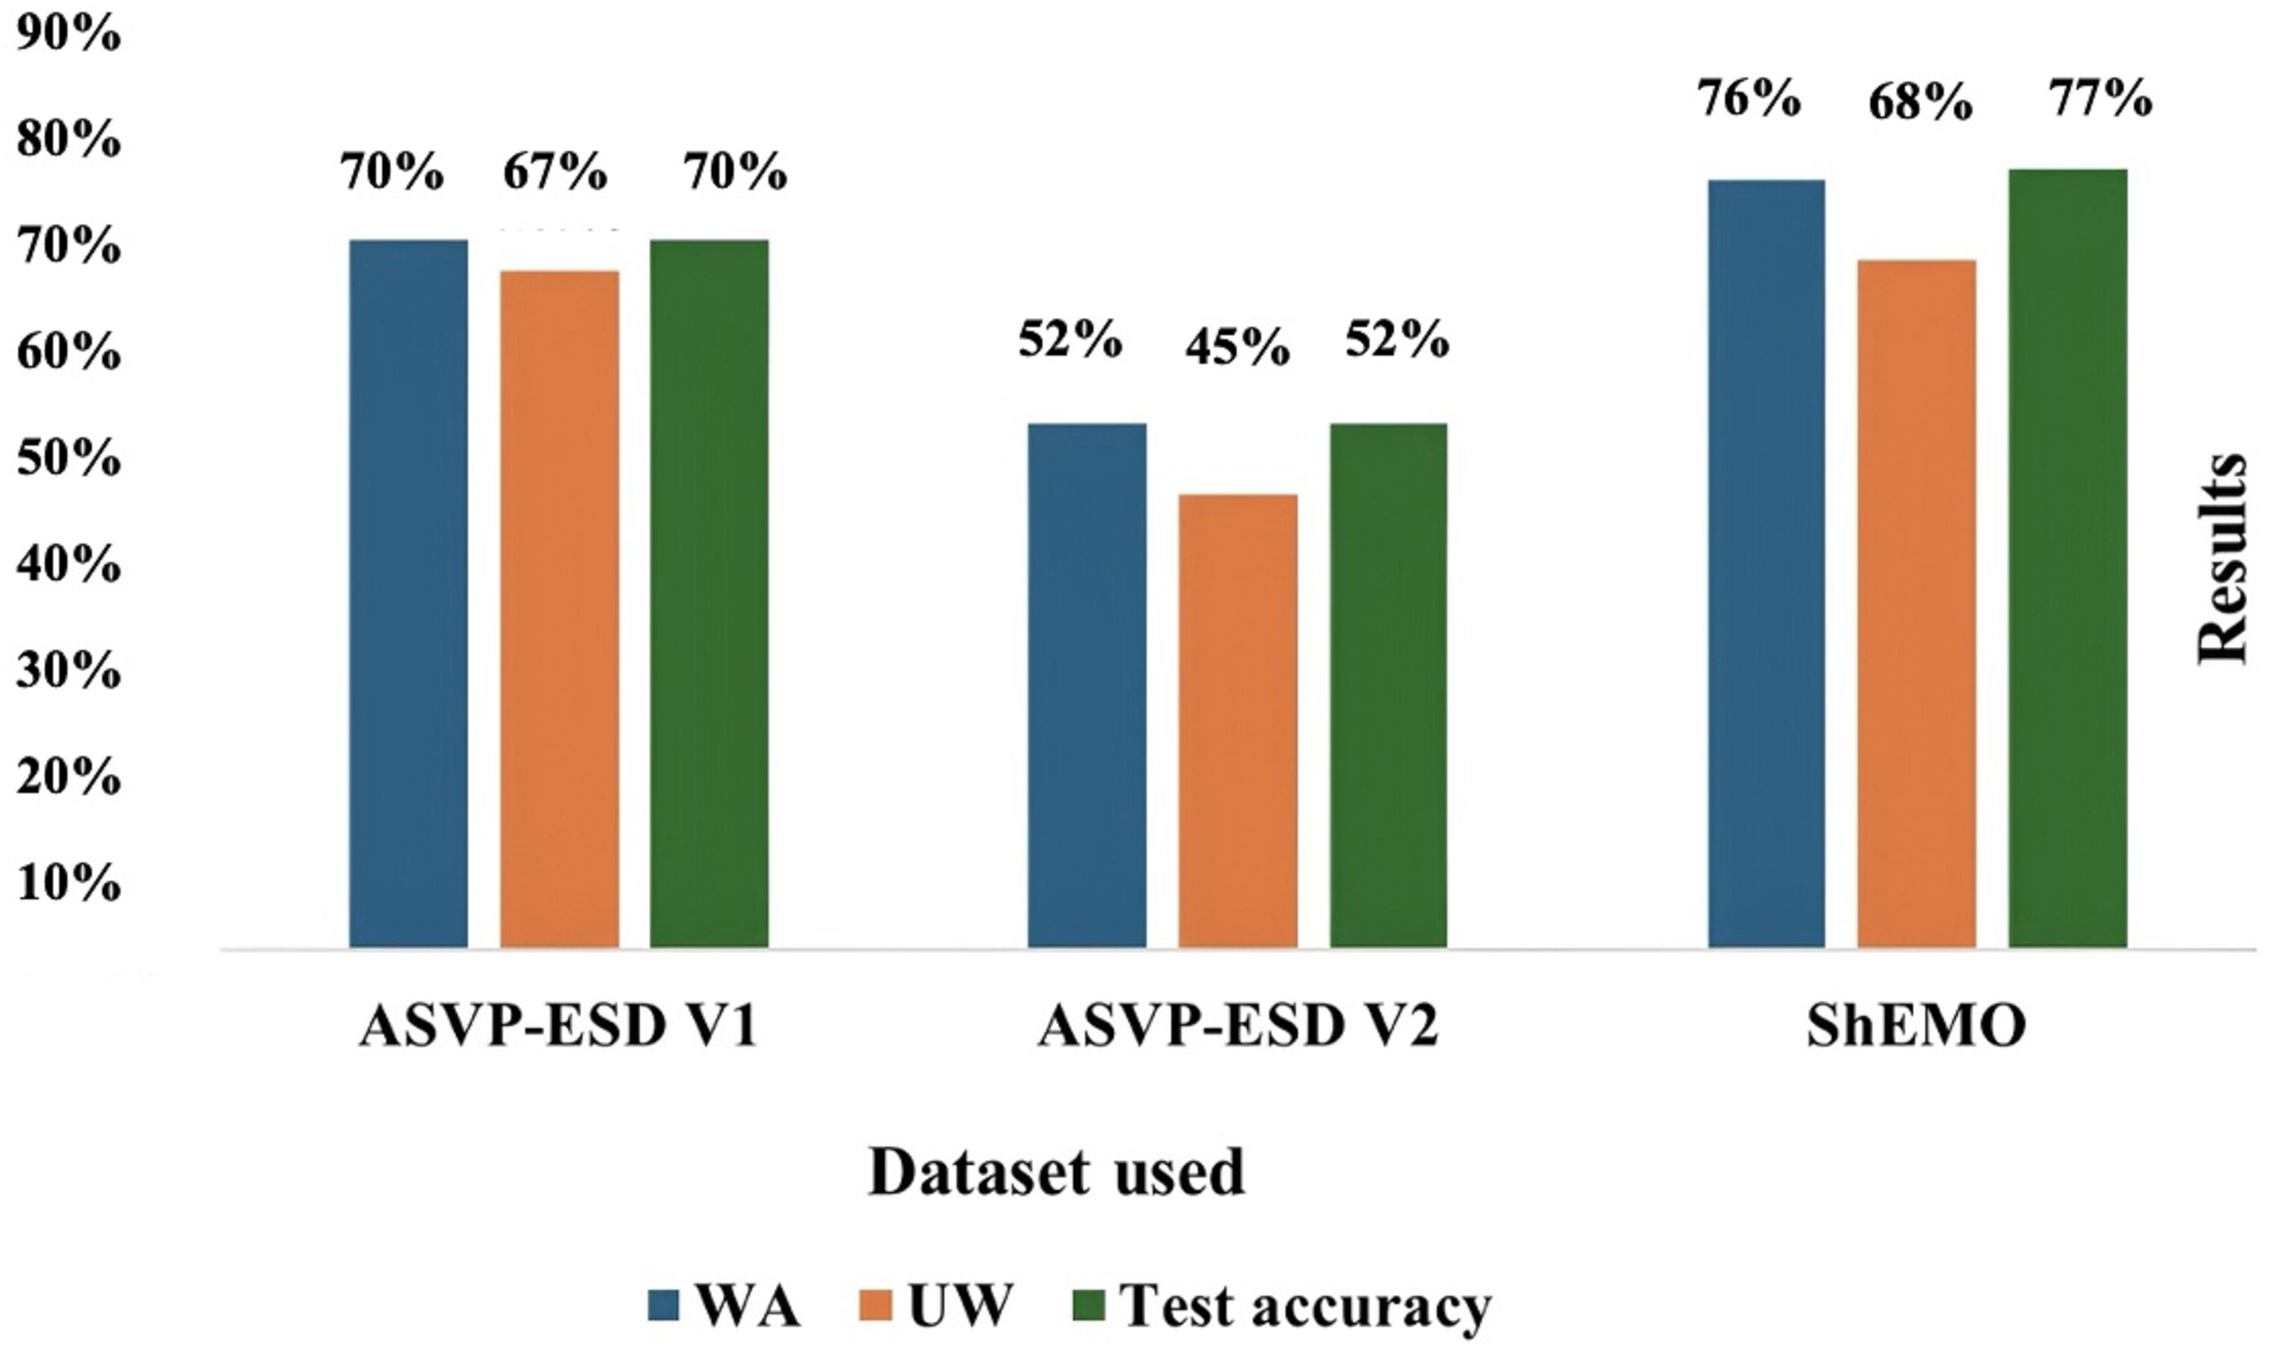
Table 12 compares the performance of various models on three datasets, highlighting the effectiveness of our proposed model. On the ASVP-ESD Version 1 dataset, the model performed slightly below the results reported by Dejoli et al. (2020). When evaluated on the more challenging ASVP-ESD Version 2 dataset, it outperformed the results reported by Sawin (2023). Since Version 2 is an extended version of Version 1, the model’s consistent performance across both versions is promising. Furthermore, on the ShEMO dataset, the model outperformed the one presented by Yazdani, Simchi & Shekofteh (2021). These outcomes demonstrate the effectiveness of our approach in improving classification accuracy across diverse datasets.
| Ref. | Dataset | DNN model | Model input | Result |
|---|---|---|---|---|
| Sawin (2023) | ASVP-ESD Version 2 | CNN | Mel spectrograms | Accuracy: 50.27% |
| Yazdani, Simchi & Shekofteh (2021) | ShEMO | CNN (1D) | Raw Audio | UA: 65.20% |
| Our | ASVP-ESD Version 1 | Parallel CNNs with Transformer and Hierarchical co-attention | Mel spectrogram + MFCC | Accuracy: 70% |
| Our | ASVP-ESD Version 2 | Parallel CNNs with Transformer and Hierarchical co-attention | Mel spectrogram + MFCC | Accuracy: 52.00% |
| Our | ShEMO | Parallel CNNs with Transformer and Hierarchical co-attention | Mel spectrogram + MFCC | UA: 68.00% |
To verify the reliability of the proposed model’s performance, we conducted a statistical analysis comparing each model with the baseline. The Wilcoxon signed-rank test was applied to assess whether the observed improvements were statistically significant. The results confirmed that Model C (Parallel CNNs with Transformer and hierarchical co-attention) achieved notably better performance, with a p-value of 0.001, which is below the standard threshold of 0.05. This provides that Model C offers a statistically significant enhancement over the baseline and other models.
To assess the practicality of the proposed model in real-world HCI applications, we evaluated three key metrics: the number of parameters, the number of floating-point operations (FLOPs), and inference time. These metrics were included to provide a more comprehensive view of the model’s efficiency beyond just accuracy, especially since SER systems are often expected to run smoothly on devices with limited resources or in real-time settings. The model contains approximately 13 million parameters, reflecting its capacity to learn complex patterns from the data. The FLOPs, estimated at 23 GFLOPs, represent the computational cost needed to process one input. The inference time, measured at around 40 ms per sample, indicates how quickly the model can make predictions.
Ablation study
To gain insights into the impact of different architectural components on the performance of our emotion recognition model, we conducted an ablation study. We progressively modified the model architecture, starting from a basic configuration and incrementally adding components to evaluate their contributions. The ablation study was conducted on version one of the ASVP-ESD dataset using a combination of MFCC and Mel spectrogram features. We designed experiments to systematically analyze the performance of different model configurations. Specifically, we examined the effects of different architectural elements, including the number of CNNs used and the incorporation of a co-attention mechanism. These configurations included a single CNN and transformer model with concatenation, a two-CNN and transformer model with concatenation, a single CNN and transformer model with co-attention, and a two-CNN and transformer model with co-attention. As depicted in Table 13, the single CNN and transformer model achieved a WA of 64%, UW of 62%, and accuracy of 63%. Introducing a second CNN into the architecture resulted in improvement, with the 2-CNN and transformer model achieving a WA of 66%, UW of 63%, and accuracy of 66%. Furthermore, a more significant performance boost was observed when co-attention was added to the architecture. The CNN and transformer model with co-attention yielded a WA of 67%, UW of 64%, and accuracy of 68%. The most substantial improvement was evident with the 2-CNN and transformer model with co-attention, achieving a WA of 70%, UW of 67%, and accuracy of 70%.
| Model | WA | UW | Test accuracy |
|---|---|---|---|
| 1 CNN + Transformer | 64% | 62% | 63% |
| 2 CNN + Transformer | 66% | 63% | 66% |
| 1 CNN + Transformer with co-attention | 67% | 64% | 68% |
| 2 CNN + Transformer with co-attention | 70% | 67% | 70% |
Introducing a second CNN increases the receptive field, facilitating the detection of subtle emotional nuances in speech (Zhu & Li, 2020). This allows the model to capture more complex spatial relationships within the input audio data, thus significantly enhancing performance. Co-attention further enhances the model’s ability to focus on critical features, thereby improving overall emotion recognition performance. These findings underscore the positive impact of incorporating additional CNN layers and co-attention mechanisms, enabling the model to capture complex features and relationships within the audio data and significantly improving its performance.
Conclusions
This article proposes a model that effectively extracts spatiotemporal features from audio samples by utilizing parallel CNNs with a Transformer encoder and incorporating a co-attention mechanism. Different fusion methods were explored, and the parallel CNNs with Transformer and hierarchical co-attention fusion approach outperformed the other fusion approaches on three datasets: ASVP-ESD version 1, 2, and ShEMO. Despite these improvements, the study has some limitations. One key challenge is recognizing neutral emotion, which remains difficult due to its lack of distinctive acoustic features, high intra-class variability, and overlap with low-intensity emotions such as calmness or boredom. These factors often lead to misclassification, especially when compared to more expressive emotional states. The model’s performance was also tested on a specific dataset (Natural and Semi-natural), which may limit its generalizability to other dataset scenarios. Additionally, while the current approach shows improvements, it is computationally intensive, which may impact scalability in practical applications. In our future work, we will evaluate the proposed model’s effectiveness on different emotional speech datasets to understand its performance across different contexts and conditions. This will help assess the model’s robustness and adaptability in various real-world scenarios. Furthermore, the model can be further developed using self-supervised learning (SSL) techniques, such as Wav2Vec2, as a feature extractor for an end-to-end network architecture. Also, we plan to integrate additional modalities, such as images or transcripts, into the model. This multimodal approach could enhance performance by incorporating diverse sources of information, as suggested by recent research (Khan et al., 2024).