
CIAE: a consistency- and informativeness-aware explanation framework for improving type 2 diabetes prediction and mechanistic insights
- Published
- Accepted
- Received
- Academic Editor
- Davide Chicco
- Subject Areas
- Bioinformatics, Algorithms and Analysis of Algorithms, Artificial Intelligence, Data Mining and Machine Learning, Neural Networks
- Keywords
- Gut microbiome, Type 2 diabetes, Explainable AI, KEGG orthology, Tabular deep learning
- Copyright
- © 2025 Wang et al.
- Licence
- This is an open access article distributed under the terms of the Creative Commons Attribution License, which permits unrestricted use, distribution, reproduction and adaptation in any medium and for any purpose provided that it is properly attributed. For attribution, the original author(s), title, publication source (PeerJ Computer Science) and either DOI or URL of the article must be cited.
- Cite this article
- 2025. CIAE: a consistency- and informativeness-aware explanation framework for improving type 2 diabetes prediction and mechanistic insights. PeerJ Computer Science 11:e3223 https://doi.org/10.7717/peerj-cs.3223
Abstract
The gut microbiome plays a significant role in the development of type 2 diabetes (T2D), yet its underlying mechanisms remain unclear. Explainable artificial intelligence offers a promising approach to elucidating machine learning models and enhancing our understanding of these mechanisms. However, identifying the most effective explainer for specific problems remains a significant challenge. To address this issue, we propose the consistency- and informativeness-aware explanation framework (CIAE), which integrates multiple explainers to improve the consistency and informativeness of explanations. Using the top 100 Kyoto Encyclopedia of Genes and Genomes (KEGG) Orthology (KO) features identified by CIAE, models achieved robust results on individual datasets (area under the curve (AUC): 0.870 and 0.808) and demonstrated strong cross-dataset generalization (AUC: 0.822 and 0.778). Notably, K00688 and K25026 were selected as key KOs in both datasets, and they are involved in the regulation of the starch and sucrose metabolism pathway and blood glucose homeostasis, which are closely related to the occurrence of diabetes.
Introduction
Background
According to the International Diabetes Federation (IDF), the global prevalence of diabetes among adults have exceeded one-tenth in 2021 (Sun et al., 2022). Type 2 diabetes (T2D) accounts for the majority of diabetes cases, with over 90% (Zheng, Ley & Hu, 2018). Recent efforts have been converging towards discovering the association between the gut microbiome and T2D (Wu et al., 2020; Fan & Pedersen, 2021; Zhao et al., 2018). Among them, the predominant emphasis has been on analyzing the associations between bacterial and T2D. Some prior research have identified impact of bacterial on T2D through statistical or machine learning (ML) approaches using the data obtained from 16S rRNA sequencing (Candela et al., 2016; Sedighi et al., 2017; Gou et al., 2021). The 16S rRNA sequencing normally provides resolution at the genus level, however, highly diverse species could belong to the same genus (Gurung et al., 2020), leading to inconsistency in genus-level analysis across various studies regarding T2D. In contrast, shotgun metagenomic sequencing can unveil a broader diversity of species and the functional information (Hugenholtz & Tyson, 2008). In Metagenomic prediction Analysis based on Machine Learning (MteaML) (Pasolli et al., 2016), two types of features was extracted: species-level relative abundances and presence of strain-specific markers. Subsequently, a random forest (RF) model was used to identify the most important species for various disease prediction. More recently, deep learning (DL)-based approaches, including convolutional neural networks and autoencoders (Li et al., 2021; Pinaya et al., 2020), have emerged to predict the relationships between species and diseases (Chen et al., 2022; Shen et al., 2022). Traditional gene sequencing techniques are only able to identify specific species associated with disease. However, species are multi-dimensional, and their functions in different diseases are not consistent. Gut microbes usually participate in the body’s metabolic activities through metabolites, and the production of metabolites is closely related to the function of enzymes carried by microorganisms. Therefore, the function performed by the gut microbiome may be related to the joint action of multiple species. Thus, it is one-sided to study the relationship between gut microbes and diseases only through a single species.
To address this issue, other studies attempt to discover the association between biological functions of gut bacteria with T2D by directly extracting functional biomarkers. The Non-supervised Orthologous Groups (eggNOG) (Jensen et al., 2007), the Kyoto Encyclopedia of Genes and Genomes (KEGG) (Kanehisa & Goto, 2000) and the Gene Ontology (GO) (Ashburner et al., 2000) are widely served as extensive knowledge bases of biological function. Several studies extracted function-related features, such as KEGG Orthology (KO) relative abundances through sequence alignment with the KEGG dataset. Further, conventional statistical approaches were applied to identify most relevant KOs for predicting T2D (Qin et al., 2012; Karlsson et al., 2013; Dash et al., 2023). Likewise, in the study (Zhang et al., 2021), the eggNOG and KEGG databases were used for gene annotation of microbiota. Incremental feature selection method were applied, followed by support vector machine (SVM) (Hearst et al., 1998) as the classification algorithm to predict T2D disease and identify latent biomarkers associated with T2D. In contrast, the relative abundance and GO hierarchical structure information were utilized in Liu, Zhang & Imoto (2021) to predict T2D and liver cirrhosis diseases. Incorporating GO hierarchical structure information, the work extracted two types of GO features and the effectiveness both features were evaluated through extensive experiments. However, these prior studies either overlooked complex correlation and interaction among functional features or ignored their relative abundance differences between T2D and healthy control groups, potential leading to incomplete analysis in T2D.
Functional features, due to the intricate nature of microbial functions, are often represented as high-dimensional tabular data. Most of recent works on high-dimensional tabular data use either gradient-boosted decision trees (GBDT) based ML approaches, including eXtreme Gradient Boosting (XGBoost) (Chen & Guestrin, 2016), Light Gradient Boosting Machine (LightGBM) (Ke et al., 2017), and Categorical Boosting (CatBoost) (Dorogush, Ershov & Gulin, 2018), or deep neural networks, including Feature Tokenizer + Transformer (FT-Transformer) (Gorishniy et al., 2021), Attentive Interpretable Tabular Learning neural network (TabNet) (Arik & Pfister, 2021) and Weight Predictor Network with Feature Selection (WPFS) (Margeloiu et al., 2023). While GBDT approaches often outperform DL models in many scenarios, some state-of-the-art (SOTA) DL models have been reported to perform better than GBDT in various cases (Gorishniy et al., 2021; Margeloiu et al., 2023). Although MLs and DLs have achieved promising performance in disease prediction tasks, the lack of transparency and explainability of models’ decisions poses a significant challenge. Currently, decision tree built-in feature importance, Local Interpretable Model-agnostic Explanations (LIME) (Ribeiro, Singh & Guestrin, 2016) and, SHapley Additive exPlanations (SHAP) (Lundberg & Lee, 2017) are widely used to identify important features in ML models (Hancock & Khoshgoftaar, 2020; Li, 2022; Alabi et al., 2023). In contrast, the post-hoc explanation methods, including Saliency (Simonyan, Vedaldi & Zisserman, 2013) SmoothGrad (Smilkov et al., 2017), and Integrated Gradients (Sundararajan, Taly & Yan, 2017) are employed to elucidate the decision-making process of DL models (Dwivedi et al., 2024; Liang et al., 2023). In reality, explanations provided by different explainers may vary, and it is challenging to identify a single explainer that performs best universally (Agarwal et al., 2022; Roy et al., 2022; Krishna et al., 2022). Different post-hoc explanation methods vary in their objectives, approximation domains and the loss functions they employ (Han, Srinivas & Lakkaraju, 2022; Agarwal et al., 2022). The suitability of post-hoc explanation methods varies with the type of input data across different tasks (Han, Srinivas & Lakkaraju, 2022). For example, continuous features are typically handled using additive continuous noise methods, such as SmoothGrad; binary features with binary noise methods, such as LIME; while most local function approximation-based methods are currently not applicable to discrete features. These fundamental differences collectively contribute to variations in the explanations generated by different explainers, with the quality of their results exhibiting clear distinctions across different tasks (Roy et al., 2022; Krishna et al., 2022). Therefore, selecting appropriate explainers or even designing specific explanation frameworks for specific tasks is particularly important.
Contribution
In this study, we propose consistency-and informativeness-aware explanation framework (CIAE), a novel explanation framework that effectively ensembles multiple explainers by considering both the consistency of explanations and the informativeness of the identified important features, to provide a reliable explanation on the most associated functional features in T2D prediction. Unlike traditional explainers that provide a single explanation result directly, CIAE starts from the perspective of the specific task and evaluates the outputs of multiple explainers in terms of consistency and informativeness. By doing so, it integrates various explainers to derive more effective and reliable explanations. Our extensive experiments show that functional features directly extracted from metagenomic sequences are informative for T2D prediction. The top 100 KOs identified by CIAE show promising performance in T2D prediction tasks, both within a single T2D dataset and across multiple T2D datasets. Finally, we investigate how certain KO functional features play significant roles in T2D and whether they collectively participate in a pathway to influence the T2D.
Structure of the article
First, this article begins with an abstract that summarizes the overall content, followed by an introduction that provides background information and outlines the main contributions. Then, the methodology section includes data preprocessing and feature extraction, feature selection, the choice of a classifier for T2D, computing infrastructure, and assessment metrics. Next, this article presents the performance evaluation of the KO features, the aggregation of the results from interpretable models, the evaluation of the proposed interpretation optimization framework, and the evaluation of the significant KOs identified by the CIAE in the T2D dataset. Furthermore, this article also discusses the potential implications of the KOs identified through CIAE in the development of T2D. Finally, the article concludes with a discussion and summary of the findings.
Materials and Methods
Data pre-processing and feature extraction
Our experiment analyzed two publicly available human gut microbiome datasets on T2D, including European female type 2 diabetes (EW-T2D) (Karlsson et al., 2013), and Chinese type 2 diabetes (C-T2D) (Qin et al., 2012). The two T2D datasets are shown in Table 1. C-T2D dataset contains total of 344 samples with 170 T2D samples and 174 control samples, while EW-T2D dataset contains total of 96 samples with 53 T2D samples and 43 control samples.
| Dataset | Total samples | Control samples | Case samples | KO features | Species features |
|---|---|---|---|---|---|
| EW-T2D | 96 | 43 | 53 | 7,155 | 573 |
| C-T2D | 344 | 174 | 170 | 7,434 | 764 |
Our feature extraction pipeline is shown in Fig. 1. The initial inputs are raw metagenome sequencing reads obtained from two previous T2D cohorts. Subsequently, we apply a quality control step using fastp (Chen et al., 2018) to filter out low-quality reads and trim adapters. Additionally, human genomes are removed using Bowtie2 (Langmead & Salzberg, 2012), with the reference genome specified as Genome Reference Consortium Human Build 38 (GRCh38). The obtained clean reads are used to extract functional features using Diting which serves as a pipeline for generating KO relative abundances from the KEGG database. Within Diting (Xue et al., 2021), MEGAHIT (Li et al., 2016) is used to assembles the metagenomic reads and generate contigs, while Prodigal (Hyatt et al., 2010) is used to predict genes from these assembled contigs. Following that, Diting maps the input metagenomic reads to the predicted genes to obtain gene relative abundances, and generates KO relative abundances by aligning predicted proteins to the KOfam (Aramaki et al., 2020) database using hmmsearch (Finn, Clements & Eddy, 2011). Due to variations in sequence data across individual samples, the KO functional categories matched also differ, with potentially significant distributional differences between the experimental and control groups. For functional features that are not matched in certain samples, a value of 0 can be assigned, which does not affect the end-to-end predictive performance of the model. To address outliers such as excessively high feature abundances, all data must be normalized before being fed into the model to ensure stable and effective training.
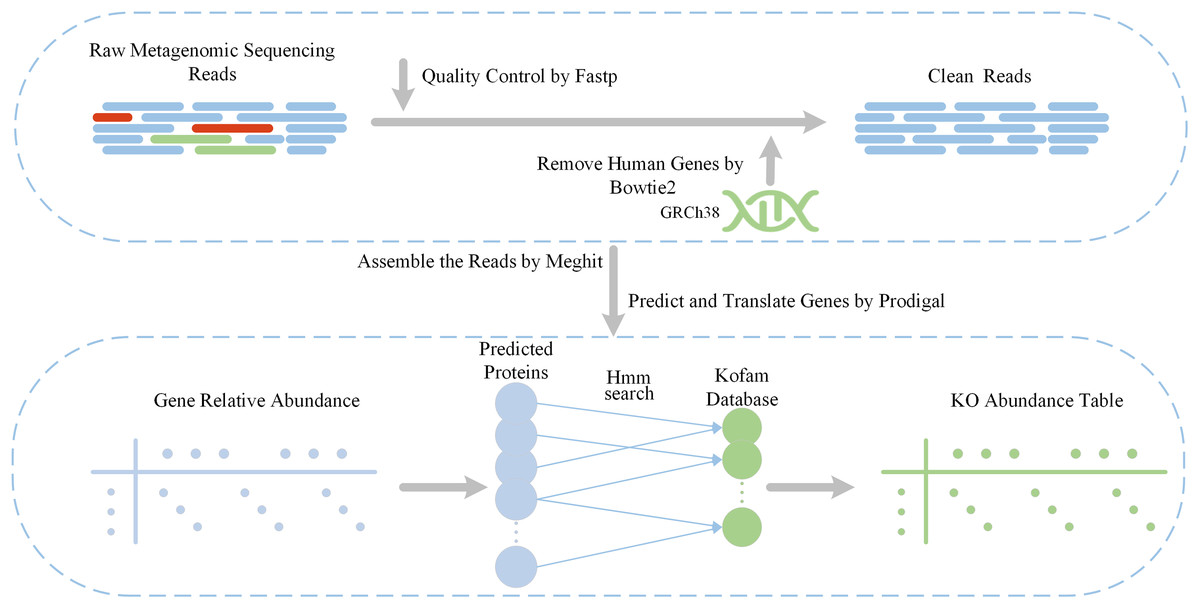
Figure 1: Data pre-processing pipeline and feature extraction.
Feature selection
Due to the high dimensionality and sparsity of the KO features, we apply feature selection based on the relative abundance and Pearson correlation coefficient.
Firstly, we filter out the KO features with relative abundances below 0.05% across all samples (Boscaro et al., 2022; Sereti et al., 2023), as calculated below:
(1) where represents the maximum element in the vector, while represents the maximum relative abundance value in the j-th KO feature. As mentioned in Zhou, Wang & Zhu (2022), the higher the correlation between features (closer to 1), the greater the redundancy among the features. Removing highly correlated features aims to eliminate redundant information.
Secondly, we calculated the correlation between features using the Pearson correlation coefficient and filtered out features with a correlation coefficient greater than 0.95. the correlation coefficient can be formulated as:
(2) where and represent the abundance features in the samples after z-score normalization. The final KO features are selected if > 0.0005 and < 0.95. Through the aforementioned feature selection methods, we are able to eliminate irrelevant and redundant features in the samples. The number of KO features decreased from 7,155 to 1,188 in EW-T2D and from 7,434 to 1,813 in C-T2D, respectively.
T2D classification
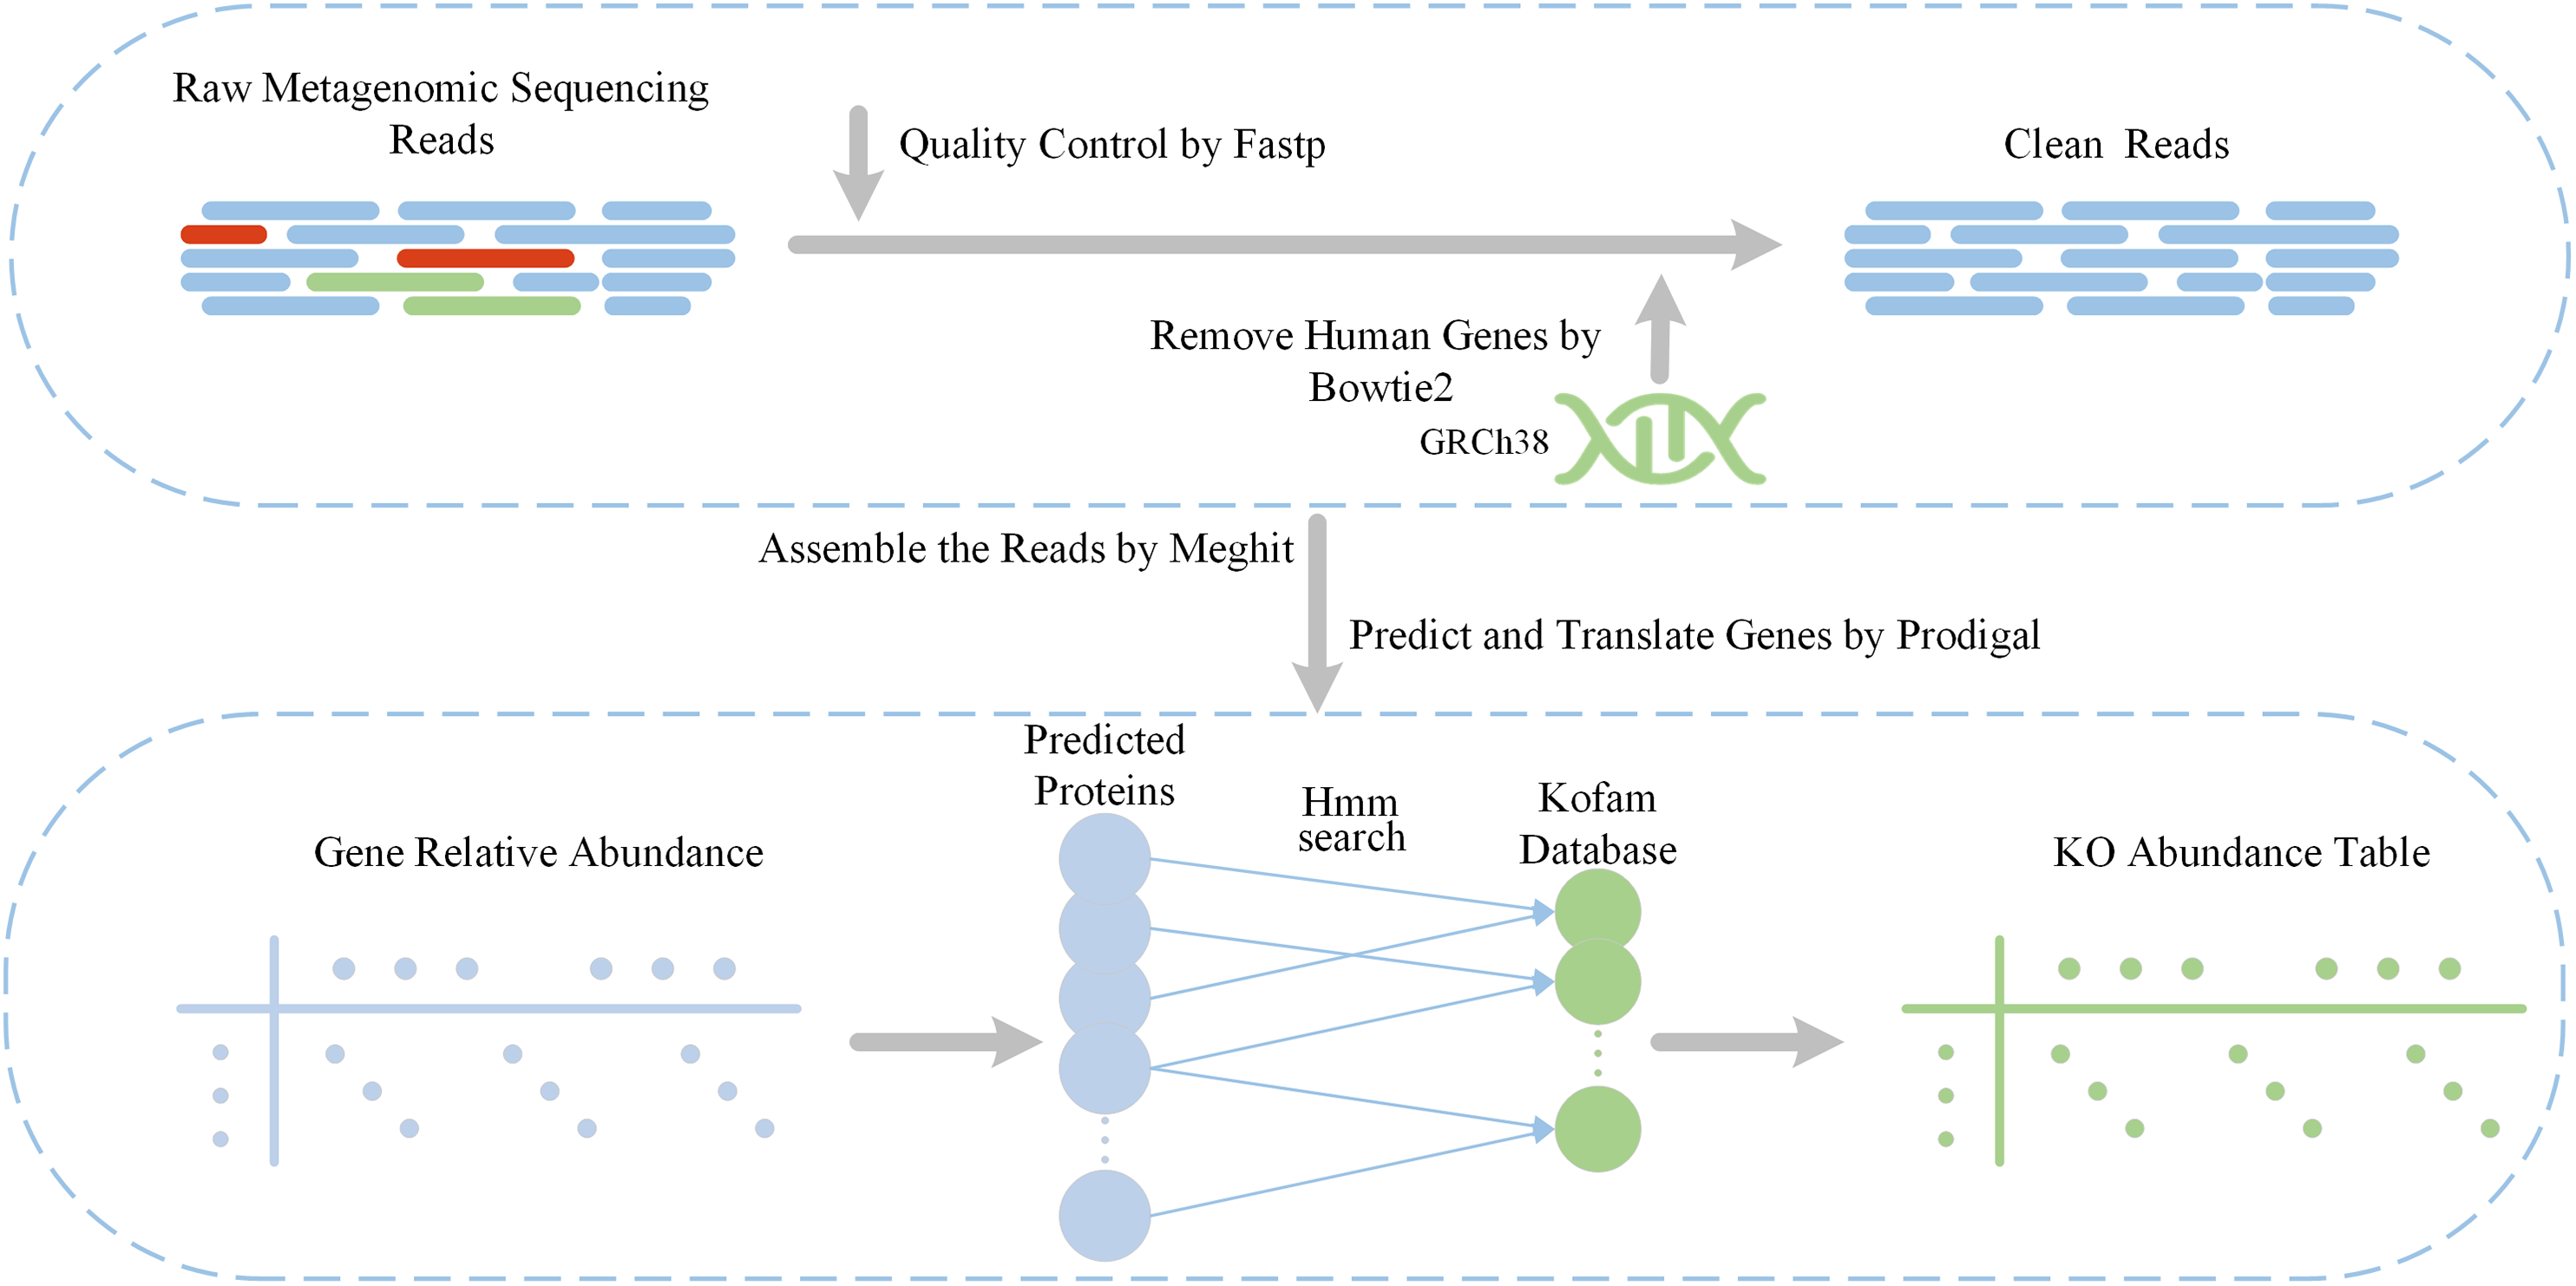
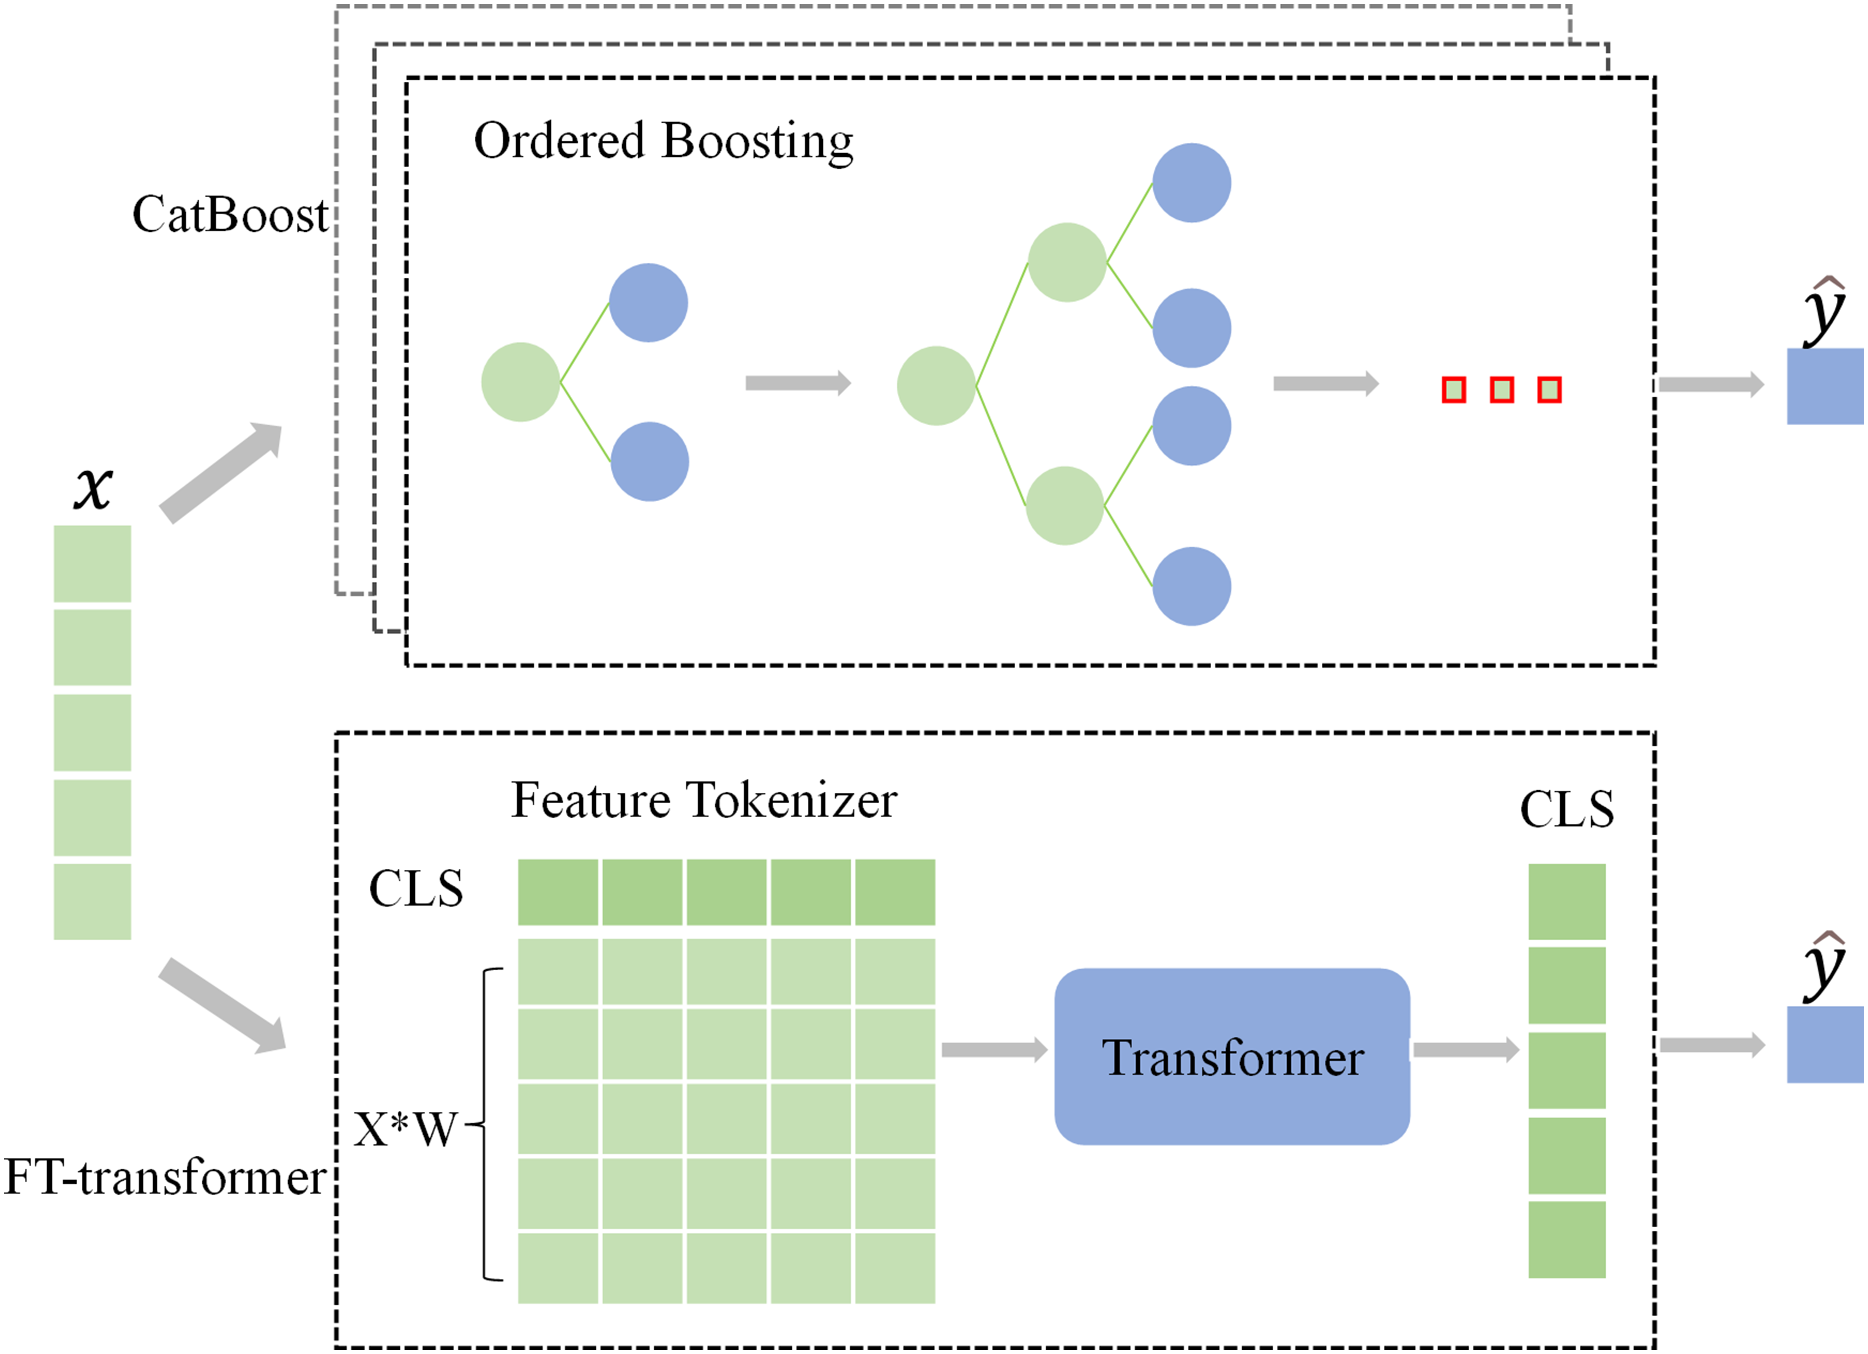
As discussed previously, CatBoost and FT-Transformer are two primary artificial intelligence (AI) models in classification tasks using tabular data (Borisov et al., 2022; Gorishniy et al., 2021). In all experiments in this work, we apply these two classifiers.
CatBoost incorporates an innovative algorithm that automatically transforms categorical features into numerical features. Additionally, it employs an ordered boosting approach, which prevent bias in gradient estimation, resolve prediction shift issues, and minimize overfitting occurrences. The CatBoostClassifier is trained by minimizing the expected loss, which can be represented by the formula:
(3) where represents the true output, represents the prediction value of the first trees, and represents the prediction of the current candidate decision tree.
FT-Transformer (Gorishniy et al., 2021) is a model designed for the tabular data, using the backbone of Transformer (Vaswani et al., 2017) architecture. It tokenizes features (categorical and numerical) into embeddings through random initialization and then feeds these embeddings into a Transformer architecture. The Binary cross entropy with Logits was utilized as the loss function:
(4) where represents the predicted value, represents the true label, and represents the sigmoid activation function. The frameworks of the classifiers are shown in Fig. 2.
Figure 2: The architecture of the classifiers.
Explanation framework
Feature Importance in CatBoost’s ensemble of decision trees is determined by assessing how frequently a feature is used for splitting and the consequent improvement in model performance resulting from these splits. LIME obtains local level explanation by training an interpretable model, such as a linear model, to gain the understanding of the behavior of a black-box model within a local neighborhood (Ribeiro, Singh & Guestrin, 2016). TreeSHAP is designed for interpreting and analyzing tree-based models (Lundberg et al., 2020). It captures the interaction effects among features, considering how features jointly influence predictions rather than affecting them in isolation. Compared to traditional Shapley values, which consider all possible subsets of features, TreeShap optimizes this by leveraging the tree structure (Lundberg et al., 2020). Integrated Gradients is guided by axioms and designed to attribute importance to features without requiring modifications to the original network, offering straightforward implementation. Saliency is previously used to interpret deep convolutional neural networks by highlighting the parts of an image that influence the class score. For tabular deep learning, it can be used to emphasize important features within tabular data. DeepShap is specifically tailored for interpreting deep learning models. It combines DeepLift (Shrikumar, Greenside & Kundaje, 2017), a method that backpropagates the contribution of all neurons in the network to each input feature by comparing each neuron’s activation to a ‘reference activation’, and Shapley values. These explainers fall into different categories within the same local function approximation framework (Han, Srinivas & Lakkaraju, 2022). For example, some explainers combine continuous perturbations with gradient matching loss, while others use discrete perturbations with squared error loss. Each explainer is based on specific modeling assumptions and approximation strategies, which may introduce biases under certain data or task conditions. By integrating multiple explainers, their strengths can complement each other, reducing explanatory errors caused by the limitations of any single explainer.
In this study, we identify the features that have a significant impact on the model’s overall prediction results by referring to the global explanation strategy of local function approximation (Han, Srinivas & Lakkaraju, 2022), which involves taking the absolute values of multiple local explanation predictions and averaging the attribution scores. To mitigate the inconsistency in explanations provided by individual explainers, we apply an aggregation strategy to improve their reproducibility. Conversion of multiple trails’ local explanations to aggregated global explanations can be expressed with the following formula:
(5) where represents a vector of attribution scores to each input feature for j-th trail’s k-th sample and represents the number of KO feature in T2D dataset. represents the global explanation result of i-th explainer. To eliminate prediction biases across different explainers, it is important to standardize the global explanations provided by each explainer. This process standardizes the attribution scores within a consistent range, facilitating the integration of various explanations. The formula for the standardized global explanation of j-th feature from i-th explainer. , can be expressed as:
(6) where represents the original attribution score of the j-th feature by the i-th explainer, and represents the standard deviation of contribution scores of all features.
The consistency of explanations and informativeness of identified most important features are two essential dimensions for measuring the effectiveness of an explainer. Consequently, we propose the CIAE framework, an algorithm ensembles multiple model explainers by considering both of these factors. The formula is as follows:
(7)
(8) where represents the performance of the explainers on the i-th reproducibility metric, and P represents the performance of the explainers on the area under the curve (AUC) metric. represents the degree of importance placed on the reproducibility of explanations. Further, we normalize the evaluation metrics to the same range. , and defaulting to (0, 1) indicates the scaling range.
Subsequently, the final attribution score of the j-th feature is determined by the weighted sum of the attribution score assigned to the j-th feature by each explainer. The is formulated as:
(9) where represents the standardized attribution score of the i-th explainer for the j-th feature, and represents the weight assigned to the i-th explainer based Eq. (8). Finally, the ranking of feature importance in CIAE can be expressed as:
(10) where = [ , , …, ] is a vector representing the attribution scores of all features, and F = [ , , …, ] is a vector representing the list of KO features. represents sorting the in descending order and mapping the indices to the F list to obtain the importance ranking of the KO features.
Computing infrastructure
All experiments were conducted on a system running Ubuntu 22.04. The deep learning models were implemented using PyTorch (version 1.12.1+cu116). The training and evaluation processes were performed on an NVIDIA A40 GPU to accelerate computation.
Assessment metrics
To comprehensively evaluate the performance of our classification models on the EW-T2D and C-T2D datasets, we employed five commonly used metrics: AUC, Accuracy (ACC), Recall, Precision, F1-score and Matthews Correlation Coefficient (MCC).
-
•
AUC: AUC measures the area under the receiver operating characteristic (ROC) curve, which plots the True Positive Rate (TPR) against the False Positive Rate (FPR). A higher AUC value indicates better discrimination between T2D and non-T2D samples, with 1.0 representing perfect classification and 0.5 indicating a random guess
-
•
ACC: ACC is the proportion of correctly classified samples among all samples and is computed as: (11)
where TP, TN, FP, and FN represent the number of True Positives, True Negatives, False Positives, and False Negatives, respectively.
-
•
Recall: recall measures the ability of the model to correctly identify positive samples (T2D cases) and is given by: (12)
A higher recall indicates fewer missed positive cases.
-
•
Precision: precision quantifies the proportion of correctly predicted positive cases among all predicted positives: (13)
High precision implies that most of the samples classified as T2D are indeed positive cases, reducing false alarms.
-
•
F1-score: F1-score is the harmonic mean of Precision and Recall, balancing both metrics in cases where one is disproportionately high or low: (14)
A high F1-score indicates a well-performing model, especially in datasets with class imbalance.
-
•
MCC: MCC is used to evaluate the performance of binary classification models, particularly suitable for imbalanced class scenarios. It ranges from −1 to 1, where −1 indicates completely incorrect prediction, 0 indicates prediction no better than random guessing, and 1 indicates perfect prediction. (15)
A higher MCC value indicates better discrimination between T2D and non-T2D samples.
Results
Performance evaluation
In this study, we adapted Feature Tokenizer + Transformer (FT-Transformer) (Gorishniy et al., 2021) and Categorical Boosting (CatBoost) (Dorogush, Ershov & Gulin, 2018) as our classifiers. Both models are are respectively the SOTA models in DL and ML for tabular data. During the experiments, we randomly split the dataset into 80% training and 20% testing sets. Further, within the training dataset, we reserved 20% of the data as the validation set to prevent overfitting. To increase the reproducibility of the results, we conducted five trials using different random seeds, while maintaining the same hyperparameters. Subsequently, we presented the averaged outcomes, ensuring a robust and reliable evaluation. We evaluated performance using the following five metrics: AUC, ACC, Recall, Precision and F1-score. The evaluation results for EW-T2D and C-T2D dataset are shown in Table 2. On the EW-T2D dataset, CatBoost using KO features outperform other model in terms of all five metrics, achieving an AUC of 0.830. While on the C-T2D dataset, CatBoost using KO features receive the best AUC of 0.777, the best Acc, Recall, F1-score are achieved by FT-Transformer using KO features with values of 0.715, 0.735, and 0.717 respectively. The best precision is achieved by both CatBoost and FT-Transformer on KO features, both with a precision of 0.702. Overall, on both datasets, models using KO relative abundance features outperform models using species relative abundance features, which evidence that KO relative abundance features are essential informative features in T2D prediction.
| Dataset | Feature | Methods | AUC | ACC | Recall | Precision | F1 |
|---|---|---|---|---|---|---|---|
| EW-T2D | Species | FT-Transformer | 0.783 | 0.680 | 0.690 | 0.713 | 0.699 |
| CatBoost | 0.806 | 0.730 | 0.745 | 0.754 | 0.742 | ||
| KO | FT-Transformer | 0.810 | 0.750 | 0.818 | 0.756 | 0.782 | |
| CatBoost | 0.830 | 0.770 | 0.836 | 0.772 | 0.799 | ||
| C-T2D | Species | FT-Transformer | 0.738 | 0.663 | 0.676 | 0.670 | 0.666 |
| CatBoost | 0.745 | 0.681 | 0.652 | 0.685 | 0.665 | ||
| KO | FT-Transformer | 0.765 | 0.715 | 0.735 | 0.702 | 0.717 | |
| CatBoost | 0.777 | 0.707 | 0.705 | 0.702 | 0.703 |
Model aggregation
In the field of model explainability, there is a lack of a common foundational approach and consistent conceptual or practical understanding of explanations. It is necessary to choose appropriate explainers for specific models and scenarios (Han, Srinivas & Lakkaraju, 2022). CatBoost, a type of GBDT-based approach, commonly uses LIME, TreeSHAP (Lundberg et al., 2020) and its inherent feature importance to provide model explanation (Hancock & Khoshgoftaar, 2020; Li, 2022; Alabi et al., 2023). In contrast, DL-based models like FT-Transformer normally adapt Integrated Gradients, Saliency, and DeepSHAP (Lundberg & Lee, 2017) to provide reliable explanations (Dwivedi et al., 2024; Liang et al., 2023). We adhere to the convention in this work. Furthermore, we assessed the reproducibility of the behavior of an individual explainer by comparing the overlapping and Spearman’s correlation of top 100 features identified by that explainer between pairs of trials. The average consistency results over all pairs of trials, represented by blue bars, are reported in Fig. 3. Subsequently, we introduced model aggregation, which was also used in Zhao, Shao & Asmann (2022), to average the contribution scores of features obtained through an explainer across multiple trails. The overall consistencies were calculated by averaging the consistency scores between the aggregated results and the results from each trail. They are represented by green bars in Fig. 3. The results indicate that the model aggregation can effectively reduce explanation biases cross different trails, thus improve the reproducibility of model’s explanation.
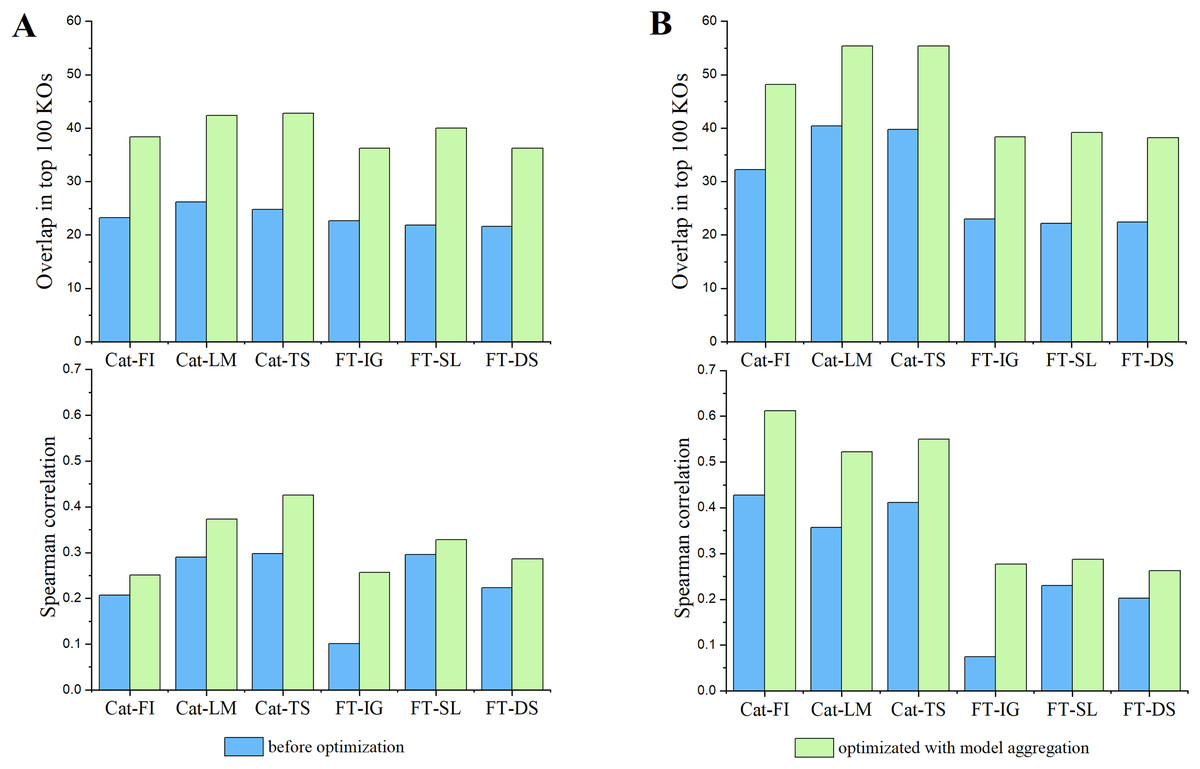
Figure 3: The impact of model aggregations on model reproducibility.
Classifiers: Cat-* represents CatBoost; FT-* represents FT-Transformer. Explanation methods: FI represents Feature importance; LM represents LIME; TS represents TreeSHAP; IG represents Integrated Gradients; SL represents Saliency; DS represents DeepSHAP. (A) Overlaps among the top 100 significant KOs across various classifiers and explanation methods (upper panel) and spearman’s correlation of KO contribution scores (lower panel) in EW-T2D dataset. (B) Same as (A) but on C-T2D dataset.
Subsequently, we examined the detailed consistency across different classifiers and their corresponding explainers. Inter Classifiers: the overall consistency of explainers on Catboost classifier outperforms that on FT-Transformer. This may be attributed to the fact that the FT-Transformer has a significantly more intricate architecture compared to Catboost, resulting in a more complex explanation. A slight variation in model parameters could lead to notable fluctuations in the explanation results. Intra Classifier: Integrated Gradients, Saliency, and DeepShap explainers show relatively similar consistency in terms of Spearman’s correlation and overlapping score on C-T2D set. However, Saliency demonstrates better consistency in terms of Spearman’s correlation and overlapping score on EW-T2D set. In terms of Spearman’s correlation, TreeShap shows best consistency on EW-T2D set, while CatBoost exhibits highest consistency on C-T2D set. However, in terms of overlapping score, both Lime and TreeShap show higher consistency over CatBoost. The results indicate that there is no universal explainer that consistently performs best across different classifiers and consistency evaluation metrics. Consequently, for the remainder of the article, we use the aggregated explanation over five trials to represent the explanation reported by an explainer.
Optimized explanation framework
As analyzed in the previous section, despite significant successes in interpretable AI (IAI) and explainable AI (XAI), a common foundational and consistent approach is still lacking (Agarwal et al., 2022; Han, Srinivas & Lakkaraju, 2022). The main reason behind is that individual explainers struggle to capture all characteristics and underlying reasons of a model’s decisions (Roy et al., 2022; Krishna et al., 2022). In this context, finding a reliable approach to effectively integrate various explainers into a unified framework becomes an important topic. To achieve that, we propose a consistency and informativeness aware explanation (CIAE) framework, which effectively ensembles multiple explanations to reduce the bias caused by individual explainers. In Fig. 4, we show the overlap of the top 100 significant KOs obtained from each explainer on two T2D dataset. The results indicate that the degree of overlap is significantly higher in the intra-classifer explanations compared with inter-classifer explanations. This disparity may be due to the different architectures of CatBoost and the FT-Transformer, which result in distinct predictive patterns and preferences (Dargan et al., 2020). Within a single classifier, there is still some variation across different datasets. However, the average overlap is above 70%, indicating that these explainers agree on the majority of top significant KOs while disagreeing on some of them. This result is more clearly displayed in the Venn diagram in Fig. 5. Afterward, we assessed the informativeness of KOs chosen by each explainer. Table 3 shows the evaluation results on EW-T2D and C-T2D datasets using top 100 KOs chosen by individual explainers and the CIAE framework. We started with comparing the effectiveness among individual explainers. On the EW-T2D dataset, using FT-Transformer as the classifier, the highest AUC of 0.858 is achieved with the top 100 KOs identified by Saliency. In contrast, using CatBoost as the classifier, the highest AUC of 0.868 is achieved with the top 100 KOs identified by TreeShap. On the C-T2D dataset, using FT-Transformer as the classifier, the highest AUC of 0.802 is achieved with the top 100 KOs identified by Integrated Gradients. In contrast, using CatBoost as the classifier, the highest AUC of 0.805 is achieved with the top 100 KOs identified by Feature Importance. On average, the AUC improved by 3% to 4% when using 100 KOs identified by the explainers. This might be due the existence of numerous irrelevant or redundant features within high-dimensional inputs. IAI and XAI-based explainers can effectively identify the most informative features and efficiently reduce data dimensionality, thus improving the classifier’s performance. This finding is consistent with the results reported in the work (Liu et al., 2022). Consequently, we propose the CIAE framework, which takes into consideration both the consistency of explanations and the informativeness of the identified important features to optimize the overall explanations of classifier’s behavior. The details of CIAE framework is described in Explanation framework. As shown in Table 3, our CIAE framework outperforms all other explainers across all T2D datasets and classifiers.
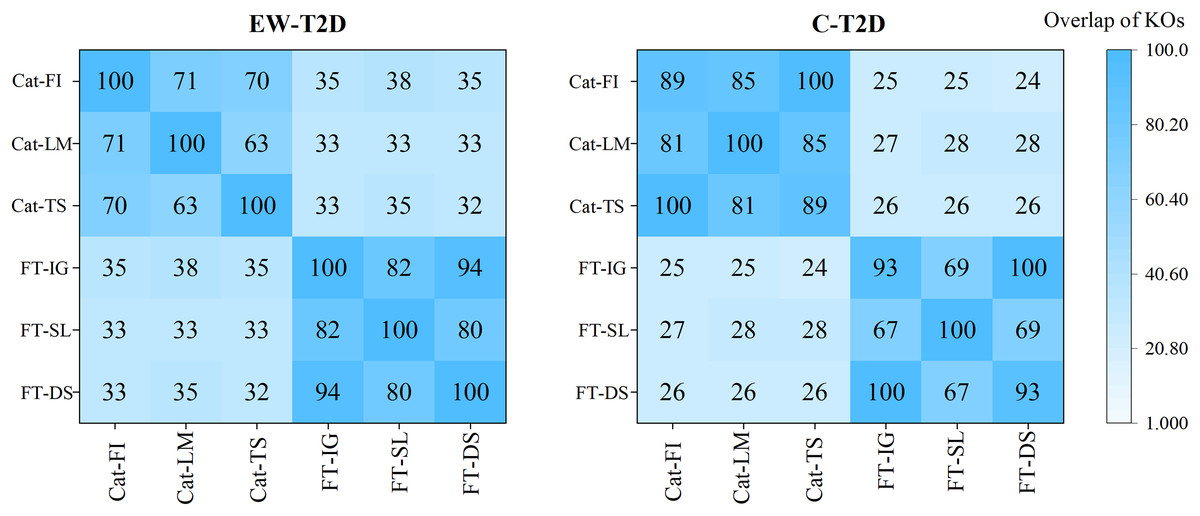
Figure 4: Overlaps among the top 100 significant KOs across various classifiers and explanation methods.
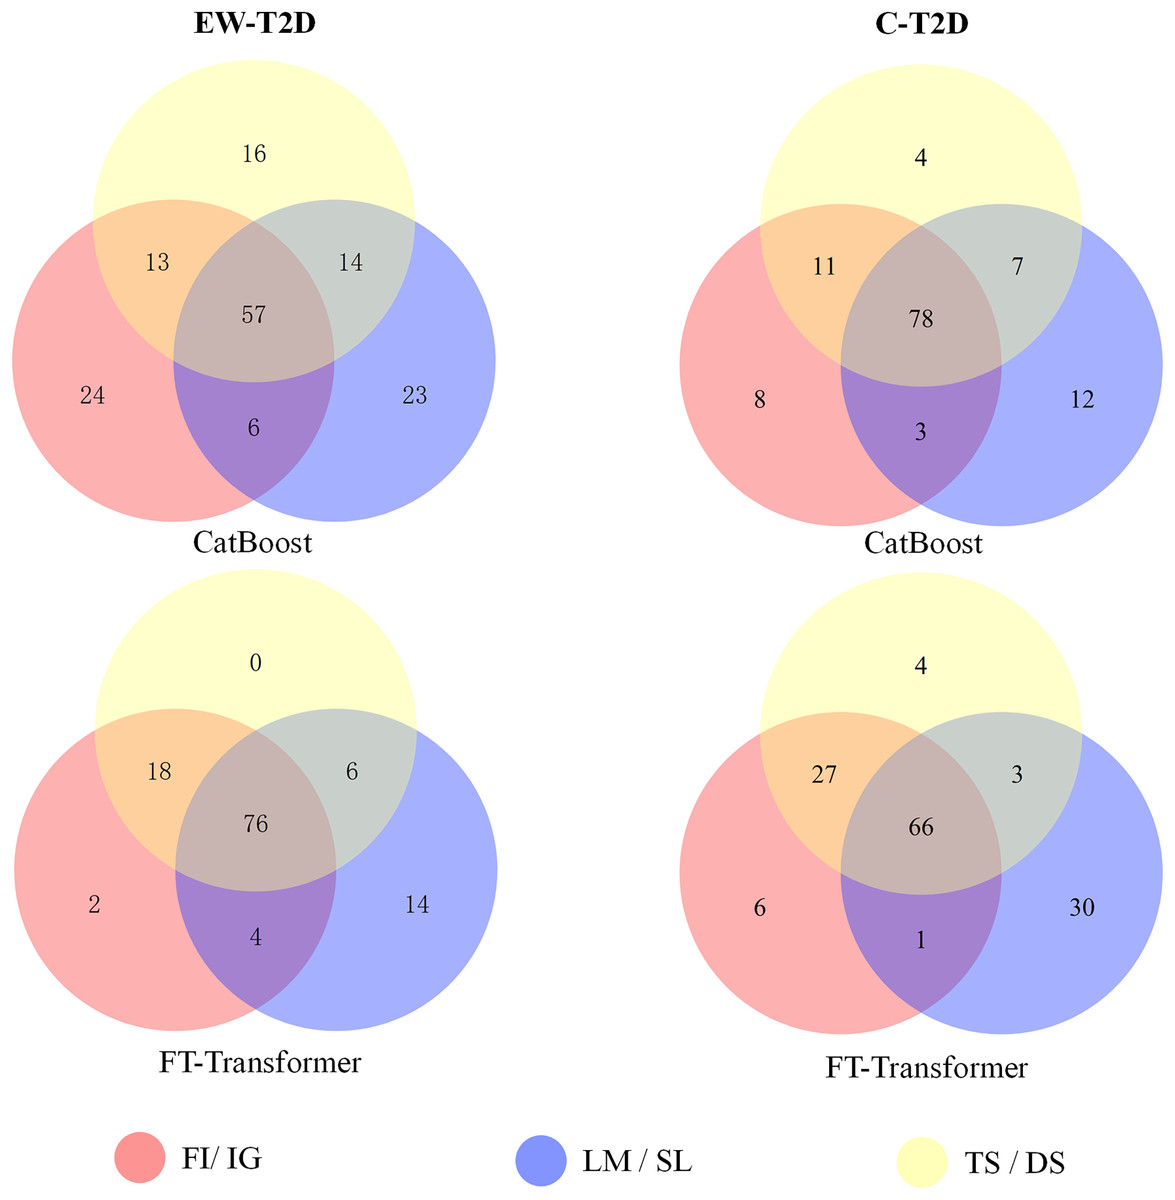
Figure 5: The Venn diagram illustrates the overlaps of the top 100 significant KOs identified by various explainers using CatBoost and FT-Transformer as the classifiers.
| Dataset | Classifier | Explainer | AUC |
|---|---|---|---|
| EW-T2D | FT-Transformer | FT-IG | 0.842 |
| FT-SL | 0.858 | ||
| FT-DS | 0.848 | ||
| FT-CIAE | 0.870 | ||
| CatBoost | Cat-FI | 0.854 | |
| Cat-LM | 0.864 | ||
| Cat-TS | 0.868 | ||
| Cat-CIAE | 0.869 | ||
| C-T2D | FT-Transformer | FT-IG | 0.802 |
| FT-SL | 0.801 | ||
| FT-DS | 0.797 | ||
| FT-CIAE | 0.807 | ||
| CatBoost | Cat-FI | 0.805 | |
| Cat-LM | 0.794 | ||
| Cat-TS | 0.801 | ||
| Cat-CIAE | 0.808 |
Note:
The best performance is in bold and the second best performance is underlined.
Evaluation of significant KOs identified by CIAE across T2D datasets
In gut microbiome research, cross-dataset validation of important features is crucial for identifying disease-associated biomarkers (Dai et al., 2022). Li et al. (2023) conducted a cross-cohort validation study on 20 diseases using machine learning models and analyzed the consistency of disease biomarkers across different cohorts for the same diseases. Gao et al. (2024) developed xMarkerFinder, a four-stage computational framework for identifying and validating microbial biomarkers across cohorts. By integrating meta-analysis, machine learning, and biomarker interpretation methods, the framework efficiently identifies robust and highly specific biomarkers. In cross-dataset studies of hepatitis C, machine learning and pre-clustering techniques were used to improve detection accuracy, while XAI tools enhanced model interpretability, helping medical professionals better understand and trust the model’s predictions (Sharma, Khade & Satapathy, 2025).
In this section, we evaluate the effectiveness and generalization of the top significant KOs identified by CIAE framework across two T2D datasets. Initially, we identified the top 100 significant KOs within each T2D dataset using individual explainers and our CIAE approaches. Subsequently, we tested the generalization of these top significant KOs across T2D datasets. More specifically, we trained CatBoost and FT-Transformer on the C-T2D dataset using the top 100 significant KOs identified by the explainers from the EW-T2D dataset, and vice versa. The results are shown in Table 4. On the C-T2D dataset, the best AUC score of 0.7789 is achieved with CatBoost as the classifier and Cat-CIAE as the explainer. This represents a performance improvement of approximately 0.2% compared to directly using CatBoost on the C-T2D dataset with all KOs. Additionally, when using FT-Transformer as the classifier, the best AUC score of 0.7508 is achieved with FT-CIAE as the explainer. However, the performance dropped by approximately 1.5% compared to directly FT-Transformer on the C-T2D dataset with all KOs. On EW-T2D dataset, the best AUC score of 0.8222 is achieved with FT-Transformer as the classifier and FT-CIAE as the explainer. This represents a performance improvement of approximately 1.2% compared to directly using FT-Transformer on the EW-T2D dataset with all KOs. Additionally, when using CatBoost as the classifier, the best AUC score of 0.7980 is achieved with Cat-CIAE as the explainer. However, the performance dropped by approximately 3% compared to directly CatBoost on the EW-T2D dataset with all KOs, the results are shown in Table 5. Meanwhile, an analysis of our CIAE approaches and other individual explainers stability concerning the receiver operating characteristic (ROC) curve is shown in Fig. 6. In addition, we further employed MCC as an additional metric. The results are shown in Table 5. On the C-T2D dataset, the best MCC score of 0.4003 was achieved using CatBoost as classifier and Cat-CIAE as the explainer, while using FT-Transformer with FT-CIAE yielded the best MCC score of 0.3883. On the EW-T2D dataset, the best MCC score of 0.5483 was achieved using CatBoost as classifier and Cat-CIAE as the explainer, while using FT-Transformer with FT-CIAE yielded the best MCC score of 0.5347.
| Dataset | C-T2D | EW-T2D | |||
|---|---|---|---|---|---|
| Classifier | FT-Transformer | CatBoost | FT-Transformer | CatBoost | |
| Single explanation | Cat-FI | 0.7063 | 0.7389 | 0.7858 | 0.7697 |
| Cat-lM | 0.7226 | 0.7670 | 0.7374 | 0.7697 | |
| Cat-TS | 0.7005 | 0.7512 | 0.7656 | 0.7778 | |
| FT-IG | 0.7279 | 0.7319 | 0.8000 | 0.7899 | |
| FT-SL | 0.7279 | 0.7522 | 0.7515 | 0.6909 | |
| FT-DS | 0.7361 | 0.7474 | 0.7818 | 0.7818 | |
| CIAE explanation | Cat-CIAE | 0.7418 | 0.7789 | 0.8121 | 0.7980 |
| FT-CIAE | 0.7508 | 0.7559 | 0.8222 | 0.7858 | |
Note:
The best performance is in bold.
| Dataset | C-T2D | EW-T2D | |||
|---|---|---|---|---|---|
| Classifier | FT-Transformer | Catboost | FT-Transformer | CatBoost | |
| Single explanation | Cat-FI | 0.3567 | 0.3753 | 0.2244 | 0.4817 |
| Cat-lM | 0.3420 | 0.3852 | 0.3117 | 0.5065 | |
| Cat-TS | 0.2513 | 0.3501 | 0.2921 | 0.4923 | |
| FT-IG | 0.3573 | 0.3226 | 0.4897 | 0.3968 | |
| FT-SL | 0.3070 | 0.3720 | 0.2539 | 0.3440 | |
| FT-DS | 0.3281 | 0.3651 | 0.4100 | 0.4191 | |
| CIAE explanation | Cat-CIAE | 0.3741 | 0.4003 | 0.3708 | 0.5483 |
| FT-CIAE | 0.3883 | 0.3758 | 0.5347 | 0.4265 | |
Note:
The best performance is in bold.
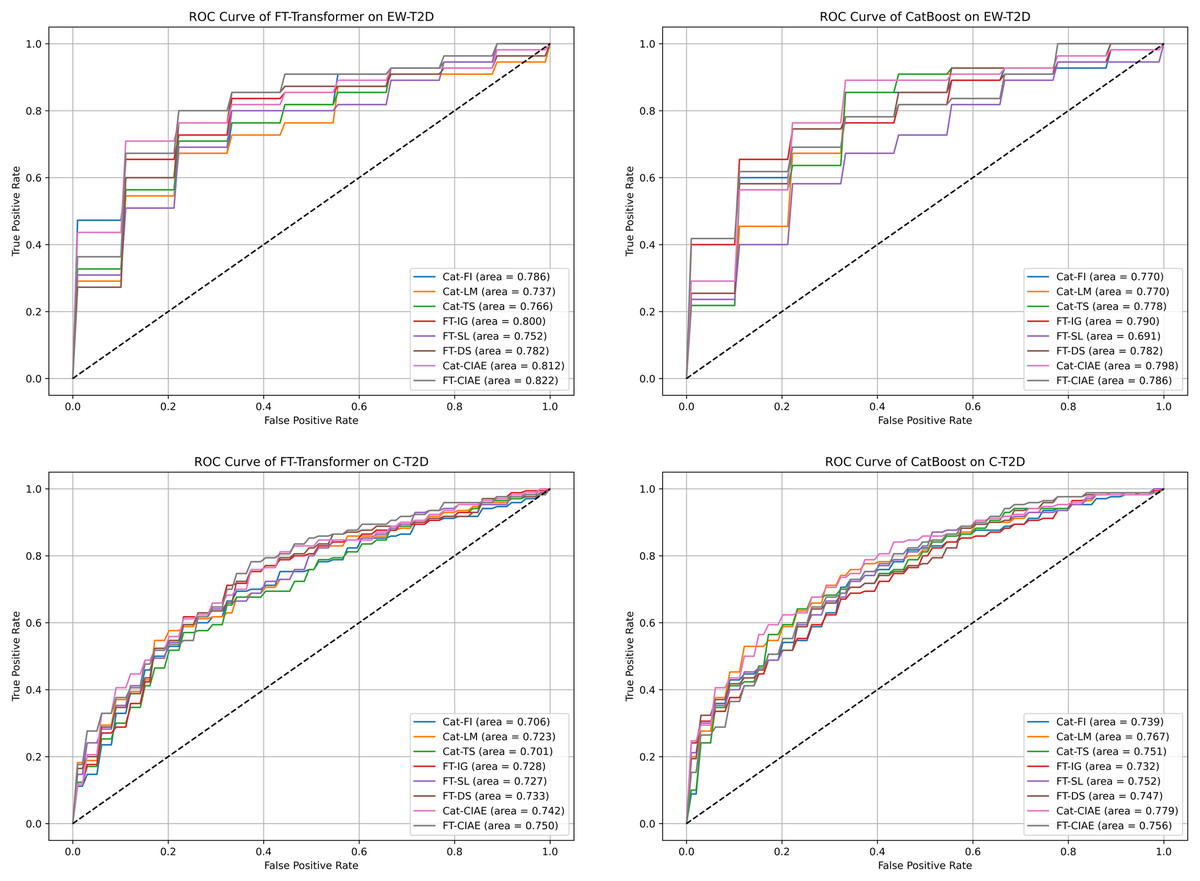
Figure 6: ROC curves and AUCs for CIAE and baseline explainers we experimented with.
We conclude our findings as follows:
The top 100 significant KOs show a higher ability to generalize when the source and target classifiers are identical. As previously discussed, this phenomenon may be due to the different architectures of CatBoost and FT-Transformer, which lead to distinct predictive patterns and preferences (Dargan et al., 2020).
Compared to other explainers, Cat-CIAE and FT-CIAE consistently outperform them, regardless of whether the source and target classifiers are identical or not. This indicates that our proposed CIAE framework is more robust and generalizable compared to existing single -explainer approaches.
Given the promising performance of our proposed CIAE framework in T2D prediction tasks, both within a single T2D dataset and across multiple T2D datasets, it has the potential to serve as a efficient and reliable feature selection tool to mitigate overfitting issues commonly exist in high-dimensional, low sample-size dataset.
Underlying significance of identified KOs in the development of T2D
In this section, we discuss and validate the most significant KOs identified by our proposed CIAE explainer in the context of T2D. Detailed information of those KOs is provided in Table 6.
| KO | Function | Reference | The role in T2D | Dataset |
|---|---|---|---|---|
| K00688 | Glycogen phosphorylase | Alruhaimi et al. (2023) | Controls blood sugar by hydrolysis of starch to produce glucose-1P. | EW-T2D C-T2D |
| K25026 | Glucokinase | Li & Zhu (2024) | The commander in the glucose homeostasis regulatory system promptly regulates the secretion of the blood-glucose regulating hormones-insulin and glucagon. | EW-T2D C-T2D |
| K07029 | Diacylglycerol kinase (ATP) | Massart & Zierath (2019) | Diacylglycerol accumulation is associated with the development of lipid-induced insulin resistance. | C-T2D |
| K01610 | Phosphoenolpyruvate carboxykinase (ATP) | Gonzalez-Rellan et al. (2023) | Controls glucose metabolism. | C-T2D |
| K21836 | D-lactate dehydrogenase (acceptor) | Lam et al. (2005) | Hypothalamic pyruvate metabolism regulates blood glucose, potentially improving glucose homeostasis in diabetic patients. | C-T2D |
| K01687 | Dihydroxy-acid dehydratase | Jang et al. (2016) | Activation of branched-chain amino acid (BCAA) metabolism improves glucose and lipid homeostasis. | EW-T2D |
| K01658 | Anthranilate synthase component II | Ruiz-Canela et al. (2018) | Aromatic amino acids (AAAs): phenylalanine, tyrosine, and tryptophan were positively associated with T2D risk | EW-T2D |
| K00950 | 2-amino-4-hydroxy-6-hydroxymethyldihydropteridine diphosphokinase | Lind et al. (2019) | Folate supplementation may be beneficial for glucose homeostasis and reducing insulin resistance. | EW-T2D |
| K03465 | Thymidylate synthase (FAD) | Yamada, Mendoza & Koutmos (2023) | 5-Formyltetrahydrofolate promotes the conformational reshaping of the active site of methylenetetrahydrofolate reductase and inhibits its activity. | EW-T2D |
The prominent functions obtained from EW-T2D
Among the top 10 significant KOs obtained in the EW-T2D dataset, K01687 and K01658 are involved in the biosynthesis of amino acids and are associated with the synthesis of valine, isoleucine and tryptophan. These three amino acids, or their intermediates are associated with the occurrence and development of diabetes (Jang et al., 2016; Menni et al., 2013; Gao et al., 2023). In addition, The involvement of K03465 and K00950 in the synthesis of folic acid is also noteworthy. Folic acid can improve insulin resistance in diabetic patients, and can play a role in alleviating diabetes (Yang et al., 2023).
The prominent functions obtained from C-T2D
Similarly, among the top 10 significant KOs obtained from C-T2D dataset, K01610 and K21836 are involved in the Pyruvate metabolism pathway and play important roles in energy metabolism. K07029 is involved in the Glycerolipid metabolism pathway, disorders of which can cause insulin resistance in the body, which in turn can lead to obesity and diabetes.
The prominent functions obtained from both EW-T2D and C-T2D
Among the top 10 of important KOs, K00688 and K25026, identified from both datasets, have been shown to have a strong association with T2D in previous studies. K00688 and K25026 are involved in the Starch and sucrose metabolism pathway, as shown in Fig. 7. The K00688 encodes the synthesized glycogen phosphorylase that catalyzes the formation of starch to D-Glucose 1-phosphate, which further generates D-Glucose. The K25026 encodes the synthesized glucokinase that catalyzes the formation of D-Glucose 6-phosphate, which can be interconverted with D-Glucose 1-phosphate, and they are involved in the glycolytic pathway. These two KOs not only affect the progress of subsequent glycolysis, but their intermediate metabolite D-Glucose will also directly cause an increase in blood glucose, so they are closely related to the occurrence and development of diabetes.
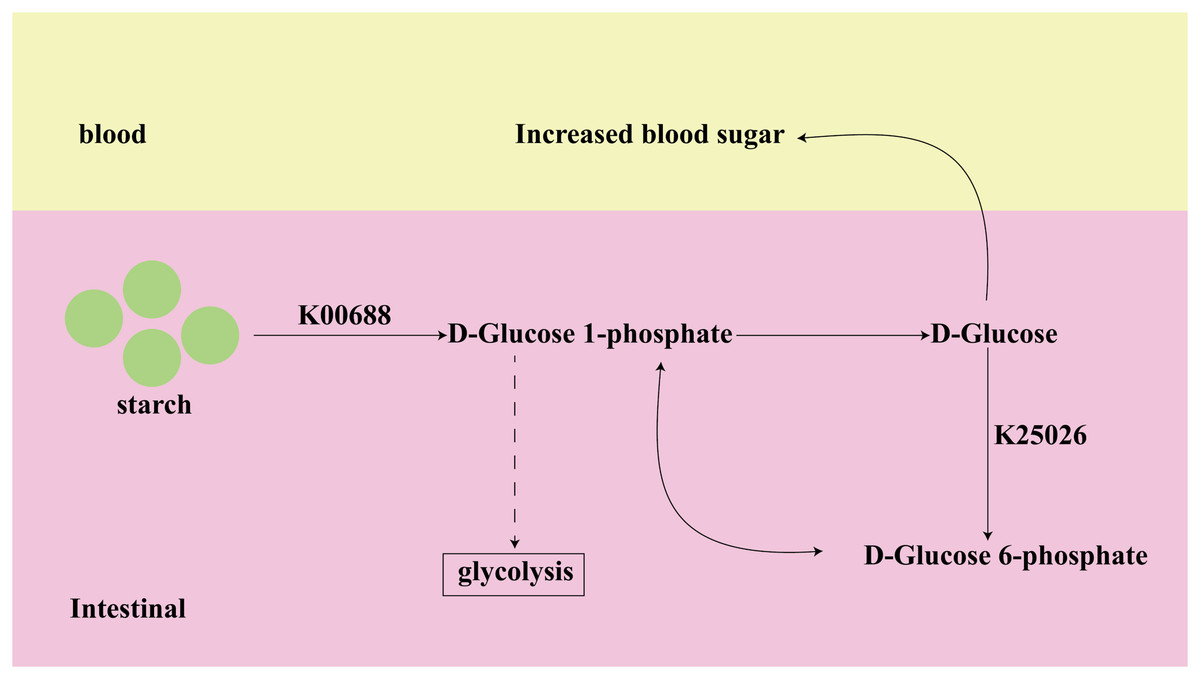
Figure 7: The function of key biomarkers.
Discussion
Numerous earlier studies have evaluated and delineated potential biomarkers concerning T2D using gut microbiota data. However, most of these studies primarily analyze at taxonomic levels and overlook the functional and systematic exploration (Chen et al., 2022; Shen et al., 2022). Through extensive experiments in this study, we observed that functional features, such as KO relative abundances, outperformed taxonomic features, such as species-level relative abundances, in T2D prediction, achieving the highest AUC scores of 0.830 and 0.777 for EW-T2D and C-T2D, respectively. In addition, compared to studying the association between species and the T2D, directly analyzing the function of gut microbiota provides valuable insights into the role of these microorganisms in the onset and progression of T2D. With the help of machine learning and XAI techniques, researchers can gain deeper insights into the pathogenesis of T2D (Chari et al., 2023; Tuppad & Patil, 2024; Sharma, Saini & Hasija, 2024). However, due to inconsistency in the explanation results, there may be deviations or even misinterpretations in understanding the mechanisms underlying T2D. Furthermore, to identify the most significant KO biomarkers in T2D prediction, we introduced a novel explanation framework, CIAE, which can effectively ensembles various explainers by considering both the consistency and informativeness provided by each explainer. CIAE demonstrates promising performance on both single T2D datasets and across multiple T2D datasets. Extensive experiments indicated that using the top 100 identified KOs for T2D prediction received AUC scores of 0.870 on the EW-T2D dataset and 0.808 on the C-T2D dataset. These KOs continued to demonstrate competitiveness, achieving AUC scores of 0.822 and 0.789 in predicting T2D across two distinct T2D datasets.
Finally, in our biomarker discussion, we have predicted the KOs that are related to diabetes through artificial intelligence, which provides a new research direction for us to understand and treat diabetes. The results showed that K00688 and K25026 were selected as key KOs in both datasets, they were involved in the metabolism of starch and the regulation of blood glucose homeostasis in the body, and were closely related to the occurrence of diabetes. K01610, K21836, and K07029 were screened from the C-T2D dataset for the metabolism of carbohydrates and lipids. K01687, K01658, K03465 and K00950 were mainly related to amino acid metabolism in the EW-T2D dataset. This may be related to differences in eating habits, which suggests that the causes of diabetes in different regions are different, and the means to prevent diabetes should also be adapted to local conditions.
Conclusions
This study analyzed the relationship between functional features (KO features) of the gut microbiota and T2D to improve prediction and interpretation. Compared to traditional taxonomic features (species features), functional features demonstrated superior predictive ability for T2D, achieving the highest AUC scores of 0.830 and 0.777 on the EW-T2D and C-T2D datasets, respectively. These findings suggest that directly analyzing the functional characteristics of the gut microbiota provides more insight into their roles in the onset and progression of T2D. Furthermore, the proposed consistency- and informativeness-aware explanation framework (CIAE) effectively integrates multiple explainers, significantly improving the consistency and informativeness of model explanations. The CIAE framework demonstrated promising performance in both single-dataset and cross-dataset experiments. Using the top 100 significant KO features identified by CIAE, the models achieved competitive results on individual datasets (EW-T2D: AUC = 0.870, C-T2D: AUC = 0.808) and exhibited strong generalization capabilities in cross-dataset T2D prediction (EW-T2D: AUC = 0.822, C-T2D: AUC = 0.778). These results highlight the potential of the CIAE framework as an efficient and reliable feature selection tool for high-dimensional, low-sample-size datasets.
Through biological analysis of the most significant KO features, we identified K00688 and K25026 as key KOs in both T2D datasets, which are closely associated with starch metabolism and blood glucose homeostasis. Subsequently, K01610, K21836, and K07029, identified in the C-T2D dataset, were primarily involved in carbohydrate and lipid metabolism, while K01687, K01658, K03465, and K00950, identified in the EW-T2D dataset, were associated with amino acid metabolism. These differences may be related to regional eating habits, suggesting that the mechanisms underlying T2D can vary between populations, and prevention strategies should be tailored to local conditions. In conclusion, this study not only validated the importance of functional features in the prediction of T2D, but also introduced the CIAE framework as a novel approach to feature selection and model interpretation in high-dimensional data. The identified key KOs provide valuable references for further research into the mechanisms of T2D and potential therapeutic targets.
Due to limited access to metagenomic samples of T2D, the conclusions drawn in this study might be insufficient and may contain biases. On the one hand, due to differences in sequencing methods, metagenomic data may exhibit systematic biases across datasets. Additionally, limited coverage of the KEGG database often leads to incomplete annotation of KO functions. These factors may collectively undermine the stability and generalizability of the model in cross-dataset validation. On the other hand, the high-dimensional nature of KO features poses a significant challenge for algorithms in making accurate predictions. In our future work, we will explore larger and more diverse T2D sample sets while integrating various data augmentation approaches to expand microbial datasets. Additionally, exploring dimension reduction approaches such as autoencoders and PCA could be a promising direction to improve prediction performance for T2D.
Moreover, the essential future direction explores deep learning models specifically designed for biomedical tabular data, which are not only suitable for high-dimensional, small-sample datasets, but also possess interpretability, thereby facilitating the end-to-end identification of key KOs related to T2D. This would enable the rapid and efficient discovery of important functional biomarkers across multiple T2D datasets.