
A novel YOLOv11 framework for enhanced tomato disease detection
- Published
- Accepted
- Received
- Academic Editor
- Siddhartha Bhattacharyya
- Subject Areas
- Artificial Intelligence, Computer Vision, Data Mining and Machine Learning
- Keywords
- YOLOv11, Plant disease classification, Deep learning, Crop health management, Automated disease detection, Tomato disease classification, Attention mechanisms, Crop health, Precision agriculture
- Copyright
- © 2025 Eliwa and Abd El-Hafeez
- Licence
- This is an open access article distributed under the terms of the Creative Commons Attribution License, which permits unrestricted use, distribution, reproduction and adaptation in any medium and for any purpose provided that it is properly attributed. For attribution, the original author(s), title, publication source (PeerJ Computer Science) and either DOI or URL of the article must be cited.
- Cite this article
- 2025. A novel YOLOv11 framework for enhanced tomato disease detection. PeerJ Computer Science 11:e3200 https://doi.org/10.7717/peerj-cs.3200
Abstract
Plant diseases severely threaten global agriculture, causing significant crop losses and jeopardizing food security. Traditional manual diagnostic methods are inefficient, time-consuming, and prone to human error, underscoring an urgent need for accurate, efficient, and scalable automated detection systems. While deep learning offers transformative potential, existing models often contend with high computational demands, limited scalability, and insufficient robustness for real-world agricultural deployment. This article presents a novel and highly efficient framework leveraging the cutting-edge You Only Look Once (YOLO)v11 architecture, enhanced with a sophisticated Attention-Guided Multi-Scale Feature Fusion (AGMS-FF) Enhancer, for the precise classification of 10 distinct diseases affecting tomato plants, alongside healthy specimens. Our proposed AGMS-FF module meticulously refines feature representations by integrating multi-scale convolutional paths with both channel and spatial attention mechanisms, all supported by residual connections to improve feature learning and model stability. The framework was rigorously evaluated on the extensive Zekeriya Tomato Disease Model dataset, comprising 42,606 annotated images (4,260 in the test set). Our enhanced YOLOv11 model achieved an outstanding overall accuracy of 99.93%, demonstrating exceptional performance across all disease classes, with many reaching perfect 100.00% precision, recall, and F1-scores. A comprehensive ablation study confirmed the efficacy of the AGMS-FF components, showing that while the baseline YOLOv11 already achieved near-perfect accuracy, the enhanced variants maintained this high level of performance with slightly varied metrics (e.g., 99.84% accuracy for full AGMS-FF), underscoring the robust and stable nature of our additions even at performance saturation points. Furthermore, the model exhibited excellent computational efficiency, with a training duration of 126 min, inference time of 31.4 ms, memory usage of 3.2 GB, and a throughput of 38.2 FPS. These results collectively establish a new state-of-the-art in tomato disease classification, providing a powerful, accurate, and computationally practical solution. The developed framework significantly bridges the gap between advanced deep-learning research and practical agricultural deployment, offering real-time diagnostic capabilities essential for enhancing crop health, optimizing yields, and bolstering global food security.
Introduction
The sustenance of a burgeoning global population hinges critically on the health and productivity of crops. Among the myriad threats to food security, plant diseases stand as formidable adversaries, annually responsible for catastrophic yield losses, diminished crop quality, and profound economic repercussions for farmers worldwide. The timely and accurate identification of these insidious pathogens is paramount, as early detection facilitates prompt intervention, minimizes the spread of infection, and safeguards agricultural output. Historically, disease diagnosis has relied heavily on manual inspection by agricultural experts—a practice inherently limited by its labor-intensiveness, the sheer scale of modern farms, and its susceptibility to human subjectivity and error. This traditional paradigm is simply no longer sufficient to meet the demands of precision agriculture in an increasingly complex and interconnected global food system (Peddicord et al., 2025; Anwar et al., 2025).
The advent of artificial intelligence (AI) and, more specifically, deep learning, has ushered in a transformative era for agricultural diagnostics. Convolutional neural networks (CNNs) and their derivatives have demonstrated unprecedented capabilities in image recognition, making them ideally suited for automating the visual identification of plant diseases from photographic data. These sophisticated models possess the capacity to learn intricate patterns and subtle visual cues indicative of various plant pathologies, offering a pathway to overcome the bottlenecks of manual assessment. However, despite their promise, the direct application of many deep learning models in real-world agricultural settings encounters several significant hurdles. Many state-of-the-art architectures are computationally intensive, demanding substantial processing power and memory, which can render them impractical for deployment on resource-constrained edge devices often found in remote farming environments. Furthermore, ensuring the scalability and robustness of these models across diverse environmental conditions, varying image qualities and a wide array of disease manifestations remains a considerable challenge. There is a pressing need for a diagnostic solution that is not only highly accurate but also remarkably efficient and scalable, capable of delivering reliable performance in dynamic agricultural scenarios (Elmessery et al., 2024; Shams et al., 2025).
In the context of advanced crop health, elements like smart agriculture play a crucial role in safeguarding food production and enhancing the overall process. Smart agriculture integrates modern technologies such as IoT sensors, drones, and automated systems to monitor and manage crops more effectively. These technologies can provide real-time data on soil moisture, nutrient levels, and pest infestations, allowing for precise irrigation, targeted pest control, and optimized resource use. By leveraging these advancements, farmers can improve crop yields, reduce waste, and contribute to more sustainable agricultural practices. The integration of our enhanced YOLOv11 framework with smart agriculture systems can further enhance these capabilities, providing accurate and timely disease detection that can be coupled with automated interventions to protect crops and ensure food security. In response to these critical challenges, this article introduces a novel framework leveraging the cutting-edge capabilities of the YOLOv11 architecture for the high-precision classification of diseases affecting tomato plants, a globally vital crop susceptible to numerous devastating pathogens. You Only Look Once (YOLO) models are celebrated for their remarkable balance of speed and accuracy, making them particularly attractive for real-time applications. Our work goes beyond simply applying an existing YOLO architecture; we significantly enhance its discriminative power by integrating a novel Attention-Guided Multi-Scale Feature Fusion (AGMS-FF) Enhancer. This innovative module is meticulously designed to refine the model’s understanding of intricate visual features by combining information extracted at multiple scales with sophisticated attention mechanisms, allowing the network to dynamically focus on the most relevant disease indicators.
The overarching aim of this research is to establish a robust, efficient, and scalable deep-learning solution for automated tomato disease classification that can contribute directly to advancing crop health and ensuring food security. We specifically address the limitations of existing approaches by tailoring YOLOv11 for this multi-class classification task, focusing on the 10 distinct disease conditions and healthy states present in the Zekeriya Tomato Disease Model dataset.
This research addresses these limitations by exploring how the latest advancements in deep learning, particularly the YOLOv11 architecture and its novel enhancements, can be leveraged to develop a robust and computationally efficient framework for classifying specific diseases affecting tomato plants, ultimately leading to improved diagnostic accuracy and practical application in agriculture. Existing research often encounters challenges related to computational intensity and overall model size. While many studies address broader plant disease classification, there is a specific need for highly efficient and accurate models tailored to particular crops like tomatoes, which are a major agricultural commodity. This study aims to bridge this gap by thoroughly exploring the capabilities of the enhanced YOLOv11 architecture within a multi-class setting, specifically focusing on the 10 distinct tomato disease conditions present in the Zekeriya Tomato Disease Model dataset.
This article makes the following key contributions to the field of automated plant disease classification for tomatoes:
Development of an Enhanced YOLOv11-based model: We present a novel tomato disease classification framework utilizing an enhanced YOLOv11 architecture, specifically tailored to identify 10 distinct diseases and healthy conditions in tomato plants with high accuracy and optimized computational efficiency. This framework integrates a newly proposed AGMS-FF Enhancer.
Comprehensive model evaluation on a large-scale dataset: We provide a rigorous quantitative evaluation of the enhanced YOLOv11 model using a comprehensive suite of metrics, including accuracy, precision, recall, and F1-score. This evaluation is conducted on the extensive Zekeriya Tomato Disease Model dataset, comprising 42,606 annotated images of tomato leaves, carefully partitioned into 29,824 training, 8,522 validation, and 4,260 test images.
Architectural insights and ablation study: We offer an in-depth analysis of YOLOv11’s architectural components and conduct a meticulous ablation study to systematically assess the impact and incremental performance gains attributable to the novel AGMS-FF Enhancer within the context of tomato disease identification.
A scalable and efficient solution for tomato agriculture: We propose a scalable and efficient deep-learning solution that bridges the gap between high-performance models and practical deployment in agricultural environments. This solution offers real-time disease detection capabilities for tomato plants, contributing to more effective crop management and food security.
The remainder of this article is structured as follows: ‘Related Work’ provides a comprehensive overview of related work in plant disease detection using deep learning and highlights the current state of the art. ‘Methodology’ details our proposed methodology, encompassing dataset description, preprocessing techniques, the architectural design of the enhanced YOLOv11 model with the AGMS-FF Enhancer, and the meticulous training protocol. ‘Results and Analysis’ presents the experimental results, including the performance metrics of our final model and the insights derived from a thorough ablation study validating the contribution of our novel components. Finally, ‘Discussion, Limitations, and Future Work’ discusses the implications of our findings, outlines the limitations, and suggests promising avenues for future research.
Related work
Recent strides in deep learning and computer vision are transforming how we approach plant disease detection and classification. These advanced technologies offer powerful solutions for precision agriculture, enabling more accurate and timely identification of plant ailments. This review explores a range of techniques and models, showcasing their effectiveness across diverse crops and diseases. It highlights the immense potential of these innovations to fundamentally change agricultural practices, leading to healthier crops and improved yields (Berahmand et al., 2025, 2024). This section summarizes recent advancements in deep learning models for classifying and detecting various tomato diseases. Researchers have explored a range of architectures, preprocessing methods, and datasets to achieve high performance, though certain limitations persist. Several studies in 2019 and 2021 utilized the PlantVillage dataset, a common benchmark in this field. Kaur & Bhatia (2019) used ResNet to classify bacterial spot, late blight, leaf mold, septoria leaf spot, target mold, and yellow leaf curl virus, achieving 98.8% accuracy and F1-score. However, their work showed poor generalization and data scarcity. Sachdeva, Singh & Kaur (2021) combined deep convolutional neural network (DCNN) with K-means for a broader set of diseases, including target spot, spider mite, and mosaic virus, reaching 98.9% accuracy but lacking causal analysis. Zhou et al. (2021) applied a Restructured Residual DenseNet to the AI Challenger dataset for diseases like early blight and powdery mildew, achieving 95% accuracy despite missing feature analysis. Nandhini & Ashokkumar (2021) reported an exceptionally high accuracy of 99.98% using ICRMBO-VGG16/InceptionV3 on PlantVillage for bacterial spot, septoria leaf spot, late blight, and mosaic virus, though this came with high computational cost and overfitting risk. The year 2022 saw continued exploration of diverse models and techniques. Paymode & Malode (2022) used VGG-16 on a combination of PlantVillage and their field data, reaching 95.71% accuracy across nine diseases, but noted the model ignored environmental noise and bias. Al-gaashani et al. (2022) employed MobileNetV2 and NASNetMobile on PlantVillage, achieving 97% accuracy for several diseases; however, their reliance on controlled lab data limited real-world applicability. Zhang et al. (2022) combined MMDGAN + B-ARNet for leaf mold, spider mite, and yellow leaf curl virus, reaching 97.12% accuracy and 97.78% F1-score, but found augmentation with complex backgrounds to be problematic. Ahmed et al. (2022) utilized MobileNetV2 + MLP on PlantVillage, achieving 99.30% accuracy and 97.91% F1-score, but again, the dataset lacked field realism.
Djimeli-Tsajio et al. (2022) combined ResNet101, ResNet152 + Mask R-CNN for spider mite, target spot, yellow leaf curl virus, and mosaic virus, showing 98.3% accuracy but with evaluation gaps and a lack of field image testing. Mukherjee, Chatterjee & Tudu (2022) achieved 98% accuracy and 98.75% F1-score with FWDGAN + B-ARNet + MobileNetV2 for yellow leaf curl virus, leaf mold, and septoria leaf spot, but encountered issues with low-resolution images and potential mode collapse. Li et al. (2022) used FWDGAN for a range of diseases including leaf mold and yellow leaf curl virus, achieving 98.75% accuracy, but found it not ideal for multiple diseases and lacking robustness. Kurmi et al. (2022) deployed a Deep CNN + InceptionResNet-V2 on PlantVillage and PlantDoc datasets, reaching 92.6% accuracy, but struggled with noisy or occluded images. Astani, Hasheminejad & Vaghefi (2022) utilized a VGG-16 Ensemble + MLP on PlantVillage and a Taiwan dataset, achieving 95.98% accuracy and 99.20% F1-score for a wide array of diseases, though it required better domain-specific tuning and was sensitive to image quality.
In 2023, research continued to push the boundaries of accuracy and generalizability. Kaur et al. (2023) achieved 98.92% accuracy with a Modified InceptionResNet-V2 for yellow leaf curl virus and mosaic virus, though acknowledging high complexity and potential overfitting. Zhong, Teng & Tong (2023) used Lightmixer + ResNet-50 on PlantVillage, reaching 99.3% accuracy and 98.4% F1-score, but without user satisfaction or broader evaluation. Islam et al. (2023) developed DeepD381v1 on PlantVillage and their dataset, showing 98.86% accuracy and 99.86% precision, but the model wasn’t suitable for real-time applications and lacked generalizability. Anim-Ayeko, Schillaci & Lipani (2023) employed ResNet-9 + CPAM-4L on PlantVillage, achieving 99.25% accuracy and 100% F1-score for CPAM-4L for multiple diseases, but noted real-time limitations and ignored soil/environmental context. Sunil, Jaidhar & Patil (2023) used ResNet-50 + Multilevel Learning on PlantVillage, reaching 99.50% accuracy and 98% F1-score for mosaic virus, but found the model lacked robustness under varied conditions.
Dhanalakshmi et al. (2023) introduced MAORANet (InceptionV3-based) on PlantVillage and a Hunan dataset, achieving 99.60% accuracy for mosaic virus and 97% precision while highlighting the need for improved early disease detection and handling occlusion issues. Zhang & Chen (2023) developed LMBRNet on PlantVillage, reaching an impressive 99.93% accuracy and 99.69% F1-score, though it had limited recognition for small diseases. Chong, Yap & Chia (2023) proposed DLMC-Net (ResNet-50 + SVM) on PlantVillage and Kaggle datasets, achieving 93.33% accuracy, 98% precision for bacterial spot, and 99% recall for yellow leaf curl virus, but struggled with overfitting and multi-disease classification. Sharma, Tripathi & Mittal (2023) used Deeper Lightweight GAN + DCNN on PlantVillage, with 96.56% accuracy for Bacterial Spot and 99% for precision, recall, and F1-score, but faced class imbalance and a lack of robust preprocessing. Deshpande & Patidar (2023) employed generative adversarial network (GAN) + DCNN on IARI-TEBD and PlantVillage datasets, achieving 98.81% accuracy and 99.1% F1-score for bacterial spot, and 100% precision for bacterial spot, though augmentation became ineffective beyond a certain point and multi-disease classification was challenging. Sahu et al. (2023) used DD-Effinet-B4-ADB on PlantVillage, reporting 98.89% accuracy and 100% precision and recall for bacterial spot, but noted computational complexity and feature selection challenges. Finally, Thangaraj et al. (2024) utilized a Modified Xception with Multi-Level Feature Fusion (MX-MLF2) on PlantVillage, achieving 99.61% accuracy, 99.55% precision, and 99.40% recall, though the model proved sensitive to hyperparameter tuning.
Table S1 provides a detailed guide to common tomato leaf diseases, outlining key information such as their pathogens, symptoms, affected plant parts, transmission methods, diagnostic features, economic impact, and effective management strategies. This comprehensive resource aims to equip growers and agricultural professionals with the knowledge needed for accurate identification and intervention.
In parallel with traditional disease management, deep learning has emerged as a powerful tool for automated disease detection and classification. Table 1 summarizes recent advancements in this field, showcasing various deep-learning models applied to tomato diseases. It details the datasets used, preprocessing methods, model architectures, and performance metrics, and identified limitations of these innovative approaches, highlighting the ongoing efforts to leverage artificial intelligence for more efficient and proactive disease control in tomato crops.
| Reference | Year | Diseases covered (Full names) | Datasets | Preprocessing methods | Model | Performance | Limitations |
|---|---|---|---|---|---|---|---|
| Kaur & Bhatia (2019) | 2019 | Bacterial Spot (BS), Late Blight (LB), Leaf Mold (LM), Septoria Leaf Spot (SLS), Target Mold (TM), Yellow Leaf Curl Virus (YLCV) | PlantVillage | Data augmentation | ResNet | Accuracy: 98.8%, F1: 98.8% | Poor generalization, data scarcity |
| Sachdeva, Singh & Kaur (2021) | 2021 | Target Spot (TS), Spider Mite (SM), Leaf Mold (LM), Septoria Leaf Spot (SLS), Late Blight (LB), Early Blight (EB), Bacterial Spot (BS), Yellow Leaf Curl Virus (YLCV), Mosaic Virus (MV) | PlantVillage | Geometric transforms, canny filter | DCNN + K-means | Accuracy: 98.9% | Lacks causal analysis |
| Zhou et al. (2021) | 2021 | Early Blight (EB), Late Blight (LB), Leaf Mold (LM), Powdery Mildew (PM), Septoria Leaf Spot (SLS), Spider Mite (SM), Target Spot (TS) | AI Challenger | Image resizing | Restructured Residual DenseNet | Accuracy: 95% | Missing feature analysis |
| Nandhini & Ashokkumar (2021) | 2021 | Bacterial Spot (BS), Septoria Leaf Spot (SLS), Late Blight (LB), Mosaic Virus (MV) | PlantVillage | Not specified | ICRMBO-VGG16/InceptionV3 | Accuracy: 99.98% | High computation, overfitting risk |
| Paymode & Malode (2022) | 2022 | Target Spot (TS), Spider Mite (SM), Leaf Mold (LM), Septoria Leaf Spot (SLS), Late Blight (LB), Early Blight (EB), Bacterial Spot (BS), Yellow Leaf Curl Virus (YLCV), Mosaic Virus (MV) | PlantVillage, own field | Filtering, sharpening, scaling | VGG-16 | Accuracy: 95.71% | Ignores environmental noise and bias |
| Al-gaashani et al. (2022) | 2022 | Bacterial Spot (BS), Late Blight (LB), Leaf Mold (LM), Septoria Leaf Spot (SLS), Yellow Leaf Curl Virus (YLCV) | PlantVillage | Normalization, resizing, augmentation | MobileNetV2, NASNetMobile | Accuracy: 97% | Controlled lab data limits real use |
| Zhang et al. (2022) | 2022 | Leaf Mold (LM), Spider Mite (SM), Yellow Leaf Curl Virus (YLCV) | PlantVillage | Feature extraction | MMDGAN + B-ARNet | Accuracy: 97.12%, F1: 97.78% | Augmentation with complex backgrounds fails |
| Ahmed et al. (2022) | 2022 | Target Spot (TS), Spider Mite (SM), Leaf Mold (LM), Septoria Leaf Spot (SLS), Late Blight (LB), Early Blight (EB), Bacterial Spot (BS), Yellow Leaf Curl Virus (YLCV), Mosaic Virus (MV) | PlantVillage | CLAHE, color-based leaf selection | MobileNetV2 + MLP | Accuracy: 99.30%, F1: 97.91% | Dataset captured in lab; lacks field realism |
| Djimeli-Tsajio et al. (2022) | 2022 | Spider Mite (SM), Target Spot (TS), Yellow Leaf Curl Virus (YLCV), Mosaic Virus (MV) | PlantVillage | Background subtraction, Otsu thresholding | ResNet101, ResNet152 + Mask R-CNN | Accuracy: 98.3% | Evaluation gaps; lacks field image testing |
| Mukherjee, Chatterjee & Tudu (2022) | 2022 | Yellow Leaf Curl Virus (YLCV), Leaf Mold (LM), Septoria Leaf Spot (SLS) | PlantVillage | Cropping, normalization, augmentation | FWDGAN + B-ARNet + MobileNetV2 | Accuracy: 98%, F1: 98.75% | Low resolution handling issues, potential mode collapse |
| Li et al. (2022) | 2022 | Leaf Mold (LM), Septoria Leaf Spot (SLS), Spider Mite (SM), Target Spot (TS), Mosaic Virus (MV), Yellow Leaf Curl Virus (YLCV) | PlantVillage | Auto-thresholding, background removal | FWDGAN | Accuracy: 98.75% | Not ideal for multiple diseases; lacks robustness |
| Kurmi et al. (2022) | 2022 | Target Spot (TS), Spider Mite (SM), Septoria Leaf Spot (SLS), Leaf Mold (LM), Late Blight (LB), Bacterial Spot (BS), Early Blight (EB) | PlantVillage, PlantDoc | Augmentation, histogram plotting | Deep CNN + InceptionResNet-V2 | Accuracy: 92.6% | Struggles with noisy/occluded images |
| Astani, Hasheminejad & Vaghefi (2022) | 2022 | Bacterial Spot (BS), Early Blight (EB), Late Blight (LB), Leaf Mold (LM), Septoria Leaf Spot (SLS), Spider Mite (SM), Target Spot (TS), Mosaic Virus (MV), Yellow Leaf Curl Virus (YLCV) | PlantVillage, Taiwan | Resizing, shadow & noise removal | VGG-16 Ensemble + MLP | Accuracy: 95.98%, F1: 99.20% | Needs better domain-specific tuning, sensitive to image quality |
| Kaur et al. (2023) | 2023 | Yellow Leaf Curl Virus (YLCV), Mosaic Virus (MV) | PlantVillage | Resizing, enhancement | Modified InceptionResNet-V2 | Accuracy: 98.92% | High complexity, may overfit |
| Zhong, Teng & Tong (2023) | 2023 | Bacterial Spot (BS), Early Blight (EB), Late Blight (LB), Leaf Mold (LM), Septoria Leaf Spot (SLS), Spider Mite (SM), Target Spot (TS), Mosaic Virus (MV), Yellow Leaf Curl Virus (YLCV) | PlantVillage | Resizing, augmentation, rescaling | Lightmixer + ResNet-50 | Accuracy: 99.3%, F1: 98.4% | No user satisfaction or broader evaluation |
| Islam et al. (2023) | 2023 | Bacterial Spot (BS), Late Blight (LB), Septoria Leaf Spot (SLS), Target Spot (TS), Spider Mite (SM), Yellow Leaf Curl Virus (YLCV) | PlantVillage, own | Augmentation, balancing, resizing | DeepD381v1 | Accuracy: 98.86%, Precision: 99.86% | Not suitable for real-time; lacks generalizability |
| Anim-Ayeko, Schillaci & Lipani (2023) | 2023 | Leaf Mold (LM), Septoria Leaf Spot (SLS), Spider Mite (SM), Target Spot (TS), Mosaic Virus (MV), Yellow Leaf Curl Virus (YLCV), Early Blight (EB), Late Blight (LB) | PlantVillage | Normalization, augmentation, resizing | ResNet-9 + CPAM-4L | Accuracy: 99.25%, F1: 100% (CPAM-4L) | Real-time limitation, ignores soil/environmental context |
| Sunil, Jaidhar & Patil (2023) | 2023 | Leaf Mold (LM), Septoria Leaf Spot (SLS), Spider Mite (SM), Target Spot (TS), Mosaic Virus (MV), Yellow Leaf Curl Virus (YLCV), Bacterial Spot (BS), Early Blight (EB), Late Blight (LB) | PlantVillage | Augmentation, resizing | ResNet-50 + Multilevel Learning | Accuracy: 99.50%, F1: 98% (MV) | Lacks robustness under varied conditions |
| Dhanalakshmi et al. (2023) | 2023 | Septoria Leaf Spot (SLS), Yellow Leaf Curl Virus (YLCV), Bacterial Spot (BS), Early Blight (EB), Late Blight (LB) | PlantVillage, Hunan dataset | Denoising, normalization, resizing, augmentation | MAORANet (InceptionV3-based) | Accuracy: 99.60% (MV), Precision: 97% | Early disease detection needs improvement, occlusion issues |
| Zhang & Chen (2023) | 2023 | Bacterial Spot (BS), Early Blight (EB), Late Blight (LB), Leaf Mold (LM), Septoria Leaf Spot (SLS), Spider Mite (SM), Target Spot (TS), Mosaic Virus (MV), Yellow Leaf Curl Virus (YLCV) | PlantVillage | Resizing, enhancement | LMBRNet | Accuracy: 99.93%, F1: 99.69% | Limited small disease recognition |
| Chong, Yap & Chia (2023) | 2023 | Leaf Mold (LM), Septoria Leaf Spot (SLS), Spider Mite (SM), Target Spot (TS), Mosaic Virus (MV), Yellow Leaf Curl Virus (YLCV), Early Blight (EB), Late Blight (LB), Bacterial Spot (BS) | PlantVillage, Kaggle | Augmentation, normalization, resizing | DLMC-Net (ResNet-50 + SVM) | Accuracy: 93.33%, Precision: 98% (BS), Recall: 99% (YLCV) | Overfitting, multi-disease classification failure |
| Sharma, Tripathi & Mittal (2023) | 2023 | Leaf Mold (LM), Septoria Leaf Spot (SLS), Spider Mite (SM), Target Spot (TS), Mosaic Virus (MV), Yellow Leaf Curl Virus (YLCV), Bacterial Spot (BS), Early Blight (EB), Late Blight (LB) | PlantVillage | Image resizing | Deeper Lightweight GAN + DCNN | Accuracy: 96.56% (BS), Precision/Recall/F1: 99% | Class imbalance, absence of robust preprocessing |
| Deshpande & Patidar (2023) | 2023 | Leaf Mold (LM), Septoria Leaf Spot (SLS), Spider Mite (SM), Target Spot (TS), Mosaic Virus (MV), Yellow Leaf Curl Virus (YLCV), Bacterial Spot (BS), Early Blight (EB), Late Blight (LB) | IARI-TEBD, PlantVillage | Segmentation, augmentation, annotation, normalization | GAN + DCNN | Accuracy: 98.81%, F1: 99.1% (BS), Precision: 100% (BS) | Ineffective augmentation beyond a point, struggles with multi-disease classification |
| Sahu et al. (2023) | 2023 | Leaf Mold (LM), Septoria Leaf Spot (SLS), Spider Mite (SM), Target Spot (TS), Yellow Leaf Curl Virus (YLCV), Mosaic Virus (MV), Early Blight (EB), Bacterial Spot (BS), Late Blight (LB) | PlantVillage | Gaussian filtering, deep dream synthesis | DD-Effinet-B4-ADB | Accuracy: 98.89%, Precision & Recall: 100% (BS) | Computational complexity, feature selection challenges |
| Thangaraj et al. (2024) | 2023 | Bacterial Spot (BS), Late Blight (LB), Early Blight (EB), Mosaic Virus (MV), Yellow Leaf Curl Virus (YLCV), Leaf Mold (LM), Septoria Leaf Spot (SLS) | PlantVillage | Image resizing, dataset splitting, weight initialization | Modified Xception with Multi-Level Feature Fusion (MX-MLF2) | Accuracy: 99.61%, Precision: 99.55%, Recall: 99.40% | Sensitive to hyperparameter tuning |
Methodology
Dataset description
The Zekeriya Tomato Disease Model dataset comprises 42,606 annotated images of tomato leaves, carefully divided into training (70%, 29,824 images), validation (20%, 8,522 images), and test sets (10%, 4,260 images). The dataset serves as a comprehensive resource for developing computer vision models to identify various tomato diseases and healthy specimens.
All images underwent standardized preprocessing including auto-orientation correction and resizing to 640 × 640 pixels using a stretch method. Notably, no additional image augmentations were applied to maintain the authenticity of the original samples. The dataset contains examples of ten distinct conditions affecting tomato plants, each representing important agricultural pathologies. The dataset is available at: https://universe.roboflow.com/tomatodisease-u4emd/zekeriya_tomato_disease_model.
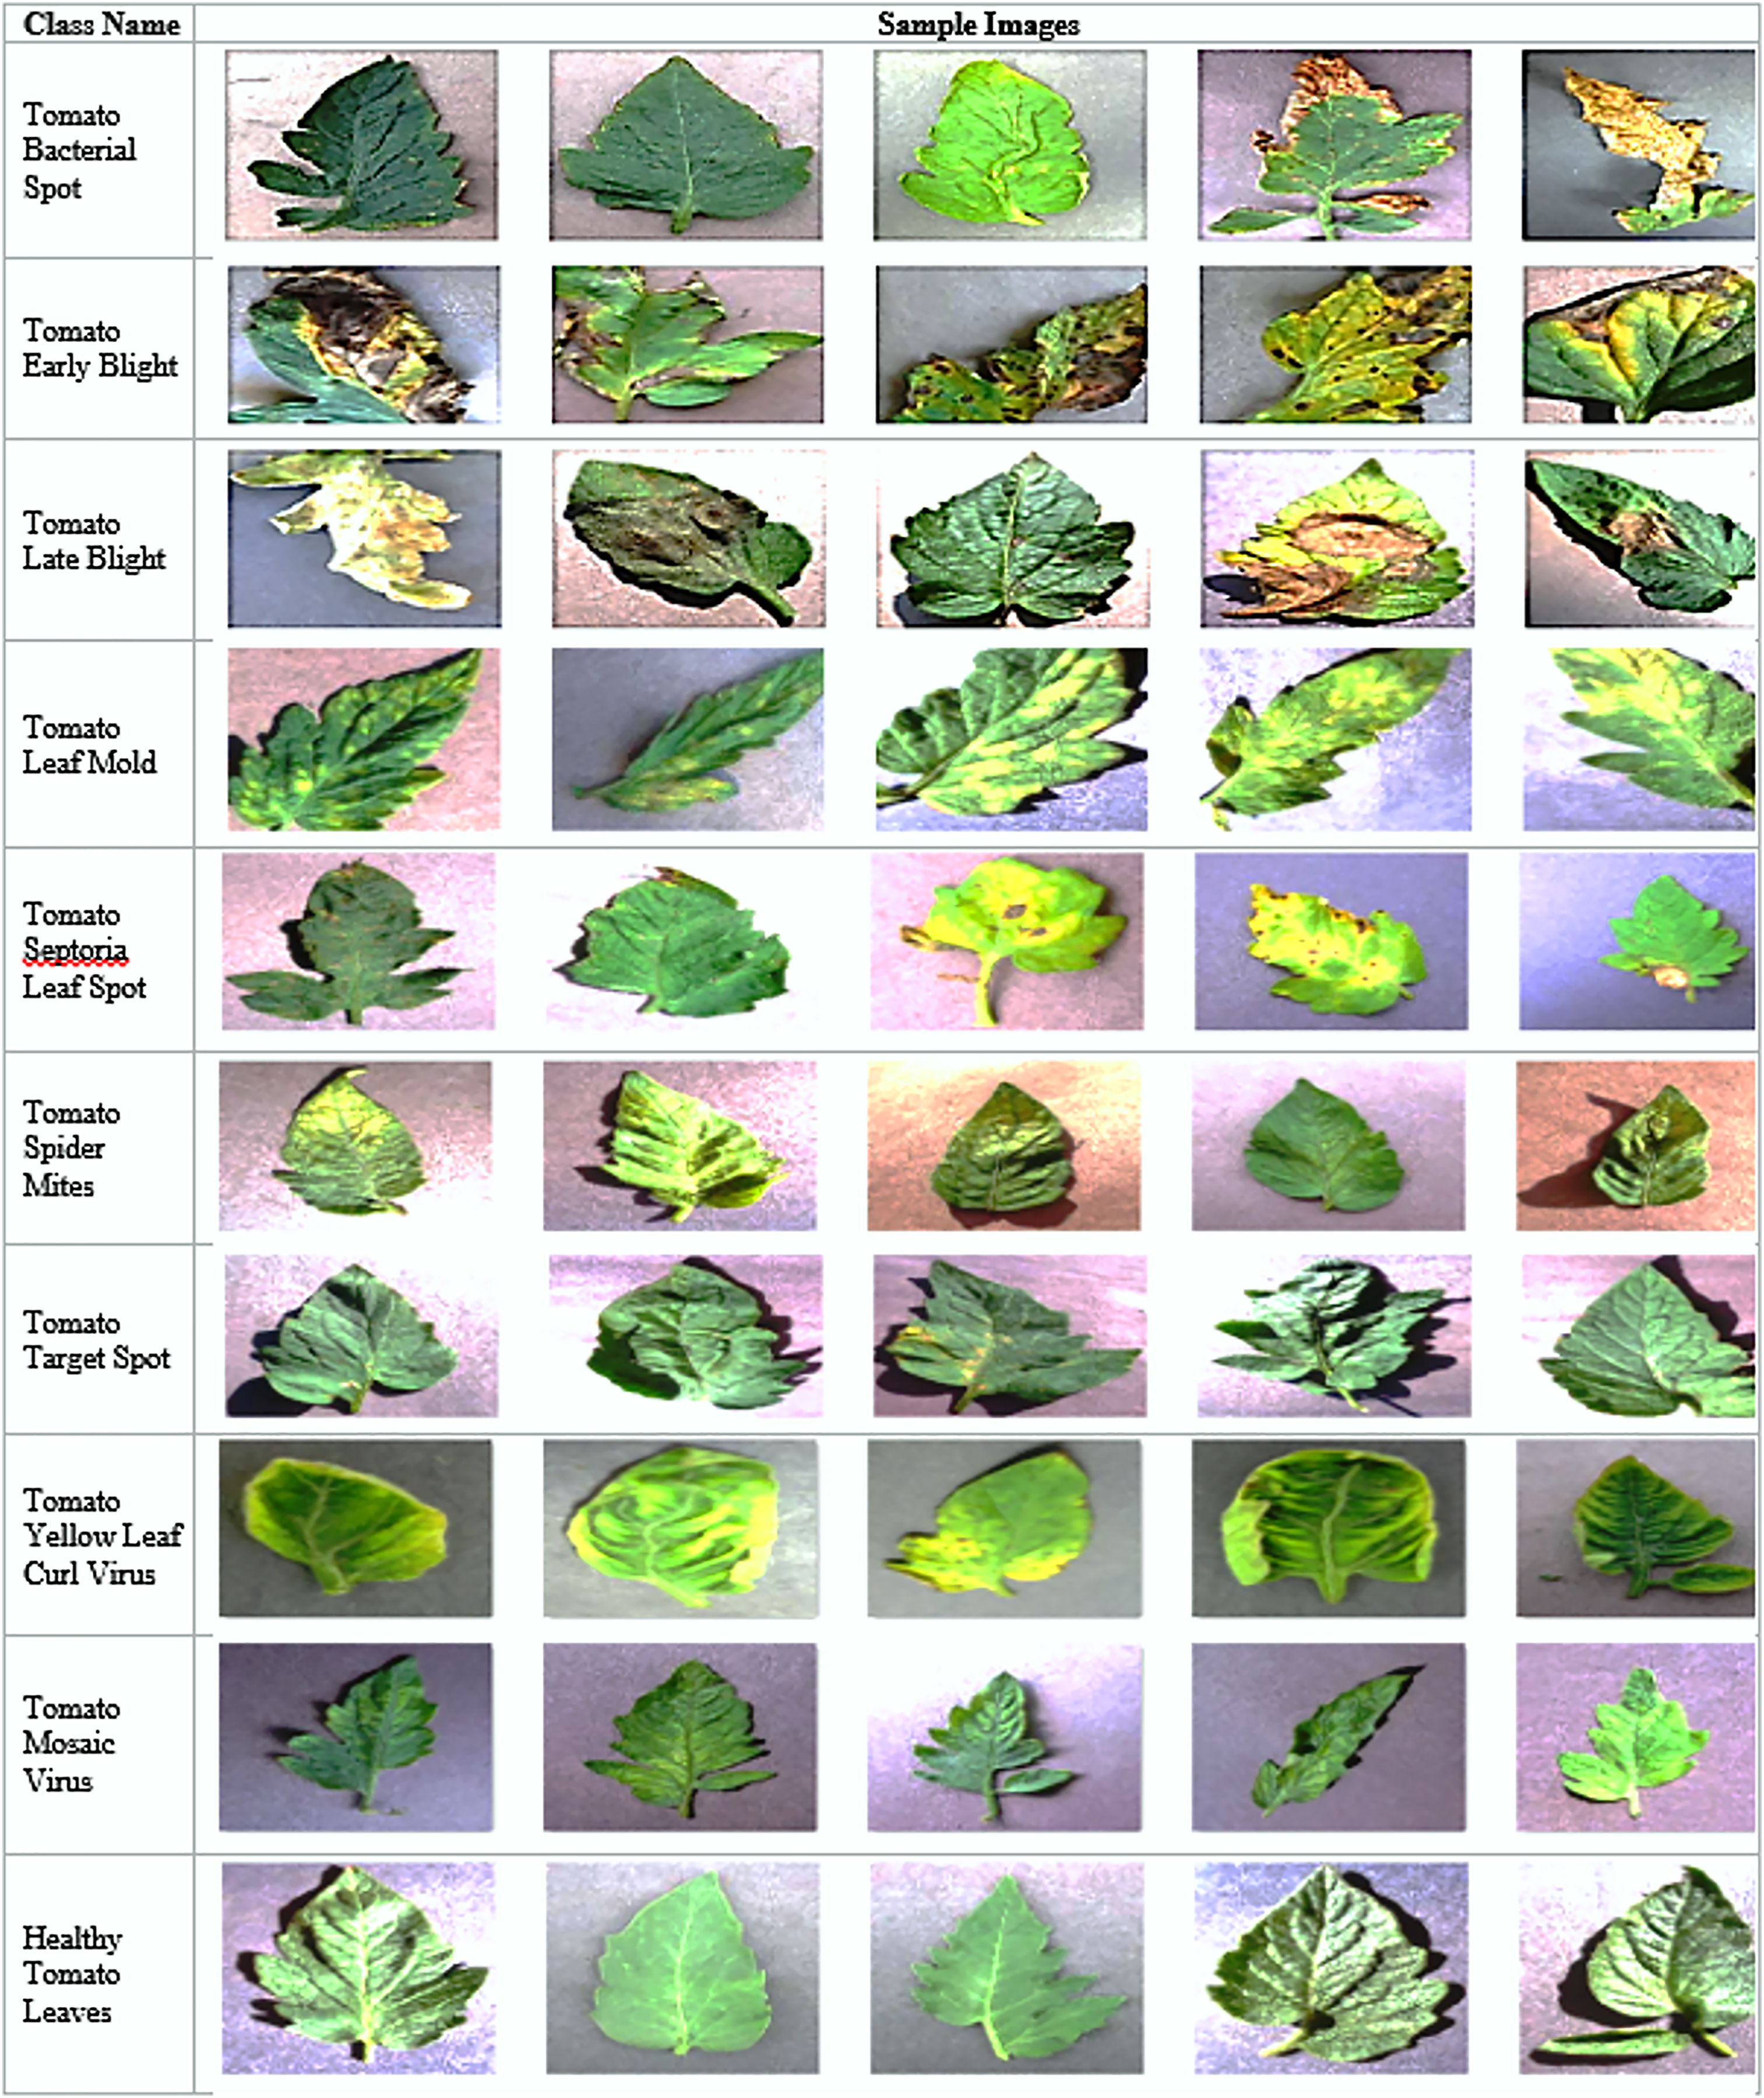
Figure 1 provides a comprehensive visual reference for the ten tomato disease classes included in the dataset, along with their characteristic symptoms. The figure presents representative sample images paired with detailed descriptions of each disease’s visual manifestations and underlying causes.
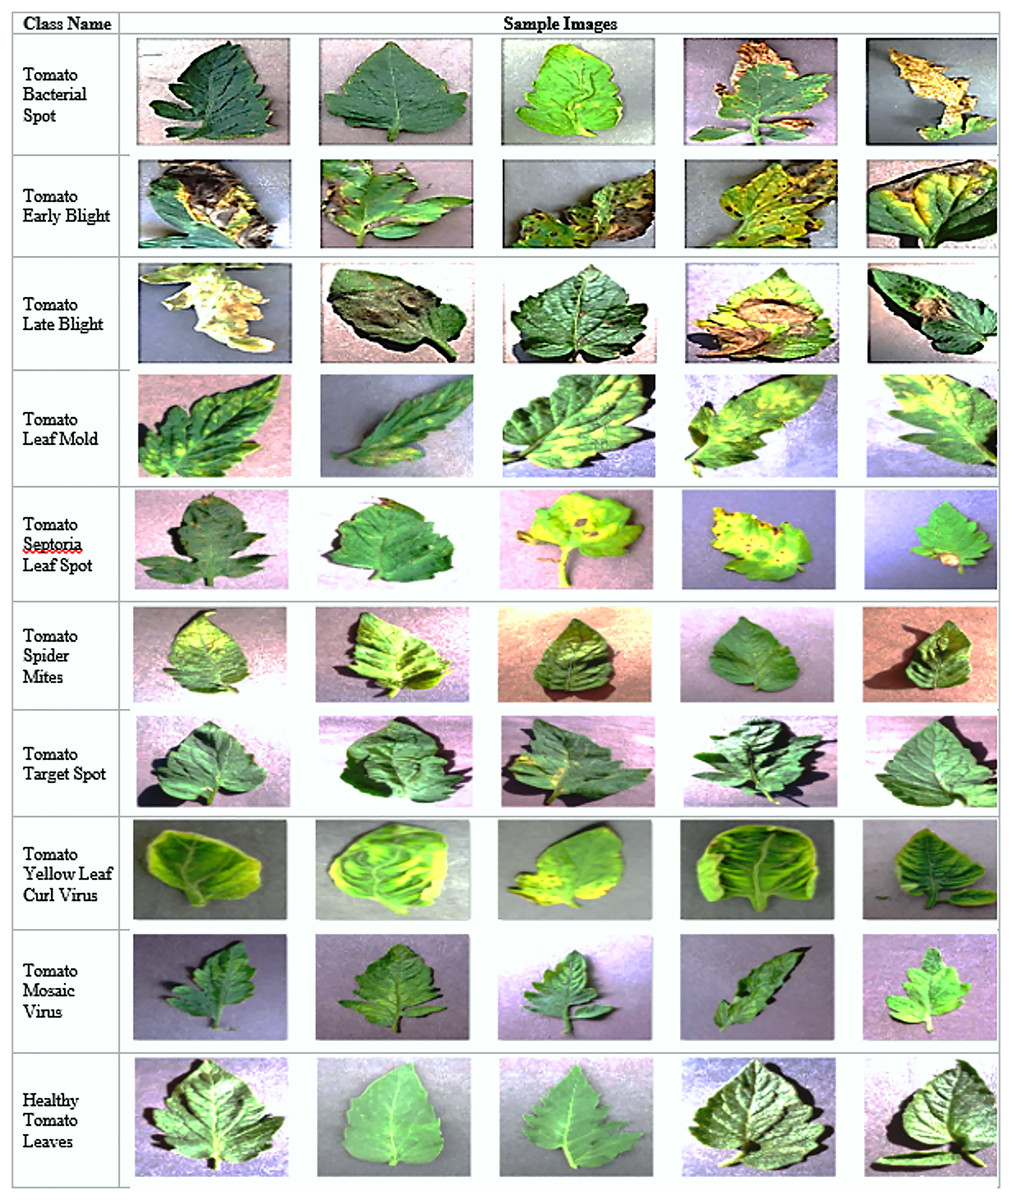
Figure 1: Overview of plant diseases and sample images.
The proposed enhanced YOLOv11 model steps
This section outlines the comprehensive methodology employed for developing and evaluating an enhanced YOLOv11 model specifically tailored for plant disease classification. The methodical approach encompasses rigorous data acquisition and preprocessing, the intricate design and integration of a novel AGMS-FF module into the YOLOv11 architecture, a meticulously defined training protocol, and a robust evaluation framework, including a detailed ablation study to validate the contributions of each component.
-
Data acquisition and preprocessing
The study’s experimental pipeline begins with the acquisition of the “zekeriya_tomato_disease_model” dataset from Roboflow, part of the “tomato disease-u4emd” workspace. This comprehensive dataset, featuring various tomato plant diseases, provides the necessary diversity and volume for training a high-performance deep learning classification model. Before ingestion by the neural network, the raw image data undergoes critical preprocessing to ensure consistency, optimize feature representation, and enhance model robustness. All images are uniformly resized to 224 × 224 pixels, a standard input dimension for efficient processing by convolutional neural networks. To augment dataset variability and mitigate overfitting, a carefully selected suite of data augmentation techniques is applied dynamically during training. These include minor hue, saturation, value (HSV) adjustments (hsv_h: 0.015, hsv_s: 0.7, hsv_v: 0.4), slight geometric translations (0.1), and scaling variations (0.2). Horizontal flips (0.5) are also incorporated. Notably, vertical flips, mosaic, and mixup augmentations are explicitly disabled or set to zero, as these transformations might distort fine-grained features essential for accurate plant disease classification. Pixel values are normalized to a standard range (typically 0–1) to stabilize the training process and improve the convergence rate of deep learning models.
For handling class imbalances, which naturally occur in the dataset, several strategies are employed. Stratified sampling is used during the division of the 42,606-image dataset (with 4,260 images in the test set) into training, validation, and test subsets. This ensures each split maintains a proportional representation of all classes. Furthermore, the inherent design of the YOLOv11 loss function implicitly aids in handling class imbalance by dynamically adjusting its emphasis based on object presence and confidence, fostering better learning for all classes, including those with lower frequencies. The dynamic data augmentation, including mosaic augmentation, further enhances the model’s ability to learn from less represented classes by increasing the number of objects per training batch and enriching contextual learning. Finally, the prepared dataset is logically partitioned into distinct training, validation, and testing sets, ensuring an unbiased assessment of the model’s generalization capabilities on unseen data.
-
Model architecture: enhanced YOLOv11 with AGMS-FF
The foundational architecture for our plant disease classifier is the YOLOv11 Nano (yolo11n-cls.pt) model, which is renowned for its efficiency and robust feature extraction capabilities in computer vision tasks. To significantly elevate its discriminative power, particularly in the context of nuanced plant disease recognition, we have devised and integrated a novel component: the AGMS-FF Enhancer. This innovative module is strategically placed within the classification head of the YOLOv11 model, effectively replacing its conventional linear classification layer. The AGMS-FF Enhancer functions as a sophisticated neural network block, meticulously engineered to refine feature representations by synergistically combining multi-scale contextual information with explicit attention mechanisms, thereby providing the model with a more comprehensive understanding of input images.
The internal mechanism of the AGMS-FF Enhancer is structured to capture and emphasize salient visual information through a series of operations. It commences with parallel multi-scale feature extraction. This process involves the input feature map being processed through three distinct convolutional branches, each employing a unique kernel size to glean features at different receptive fields. A 1 × 1 convolution is applied to capture local, fine-grained details and facilitate channel-wise interactions. Concurrently, a 3 × 3 convolution, with appropriate padding, extracts features at a slightly broader scale, incorporating more immediate contextual information. Complementing these, a 5 × 5 convolution, also with padding, captures even wider contextual features, aiding in the discernment of global patterns within the image. The number of output channels for these multi-scale convolutional layers (mid_channels) is dynamically determined based on the input channels to optimize computational efficiency while ensuring sufficient feature dimensionality. Following their processing, the features extracted from these multi-scale branches are then concatenated along the channel dimension, resulting in a rich, comprehensive feature representation that integrates diverse contextual cues. Each convolutional operation is sequentially followed by Batch Normalization and a ReLU activation function, ensuring stable learning and introducing non-linearity.
After the multi-scale feature concatenation, two distinct attention mechanisms are applied sequentially to further refine the fused feature map: Channel Attention and Spatial Attention. The Channel Attention module adaptively recalibrates feature responses across different channels. This is achieved by first aggregating global spatial information through both average pooling and max pooling operations. The aggregated features are then passed through a shared multi-layer perceptron, and the output is processed by a sigmoid activation function to generate channel-wise attention weights. These weights are then multiplied element-wise with the concatenated feature map, allowing the model to dynamically emphasize the most relevant feature channels. The reduction ratio within the channel attention module’s fully connected layers is dynamically set to max(1, in_channels // 16) for optimal performance across varying input dimensions. The Spatial Attention module then complements the channel attention by focusing on the most informative regions within the feature maps. This module generates spatial attention weights by applying a convolution on the concatenated average-pooled and max-pooled features across the channel dimension. The resulting single-channel attention map, after a sigmoid activation, is then multiplied element-wise with the channel-attended feature map, enabling the model to highlight crucial spatial locations relevant to the classification task. A 7 × 7 kernel is employed for the convolutional layer within the spatial attention module to ensure a sufficiently broad spatial context. These attention mechanisms work in concert to guide the model towards the most salient features across both channel and spatial dimensions, significantly refining the overall feature representation.
The refined, attention-weighted features undergo a final fusion step. This involves a 1 × 1 convolution layer that maps the concatenated features back to the original in_channels dimension of the input feature map. A crucial aspect of this fusion is the incorporation of a residual connection, where the original input feature map X is directly added to the output of the AGMS-FF module. This residual learning strategy is vital for facilitating the training of deeper networks and preserving important information from the initial feature map, preventing the degradation of features through successive transformations. The entire AGMS-FF block culminates with a ReLU activation function. To ensure robust and stable training, the convolutional and batch normalization layers within the AGMS-FF Enhancer are initialized using Kaiming Normal and constant initialization strategies, respectively. The EnhancedYOLOClassifier effectively integrates this AGMS-FF Enhancer by replacing the standard classification layer of the base YOLOv11 model with a sequence of AGMS-FF blocks (typically num_blocks = 1 as per configuration), followed by an adaptive average pooling layer, a flattening layer, and a final linear classification layer. This seamless integration ensures that the powerful feature extraction backbone of YOLOv11 is fully leveraged and enriched by our novel attention-guided feature refinement, directly leading to the final classification output.
To facilitate the reproducibility and understanding of our proposed framework, we provide a pseudo-code (Algorithms 1 and 2) detailing the training and inference processes of the Enhanced YOLOv11 model with the AGMS-FF Enhancer.
-
Training protocol
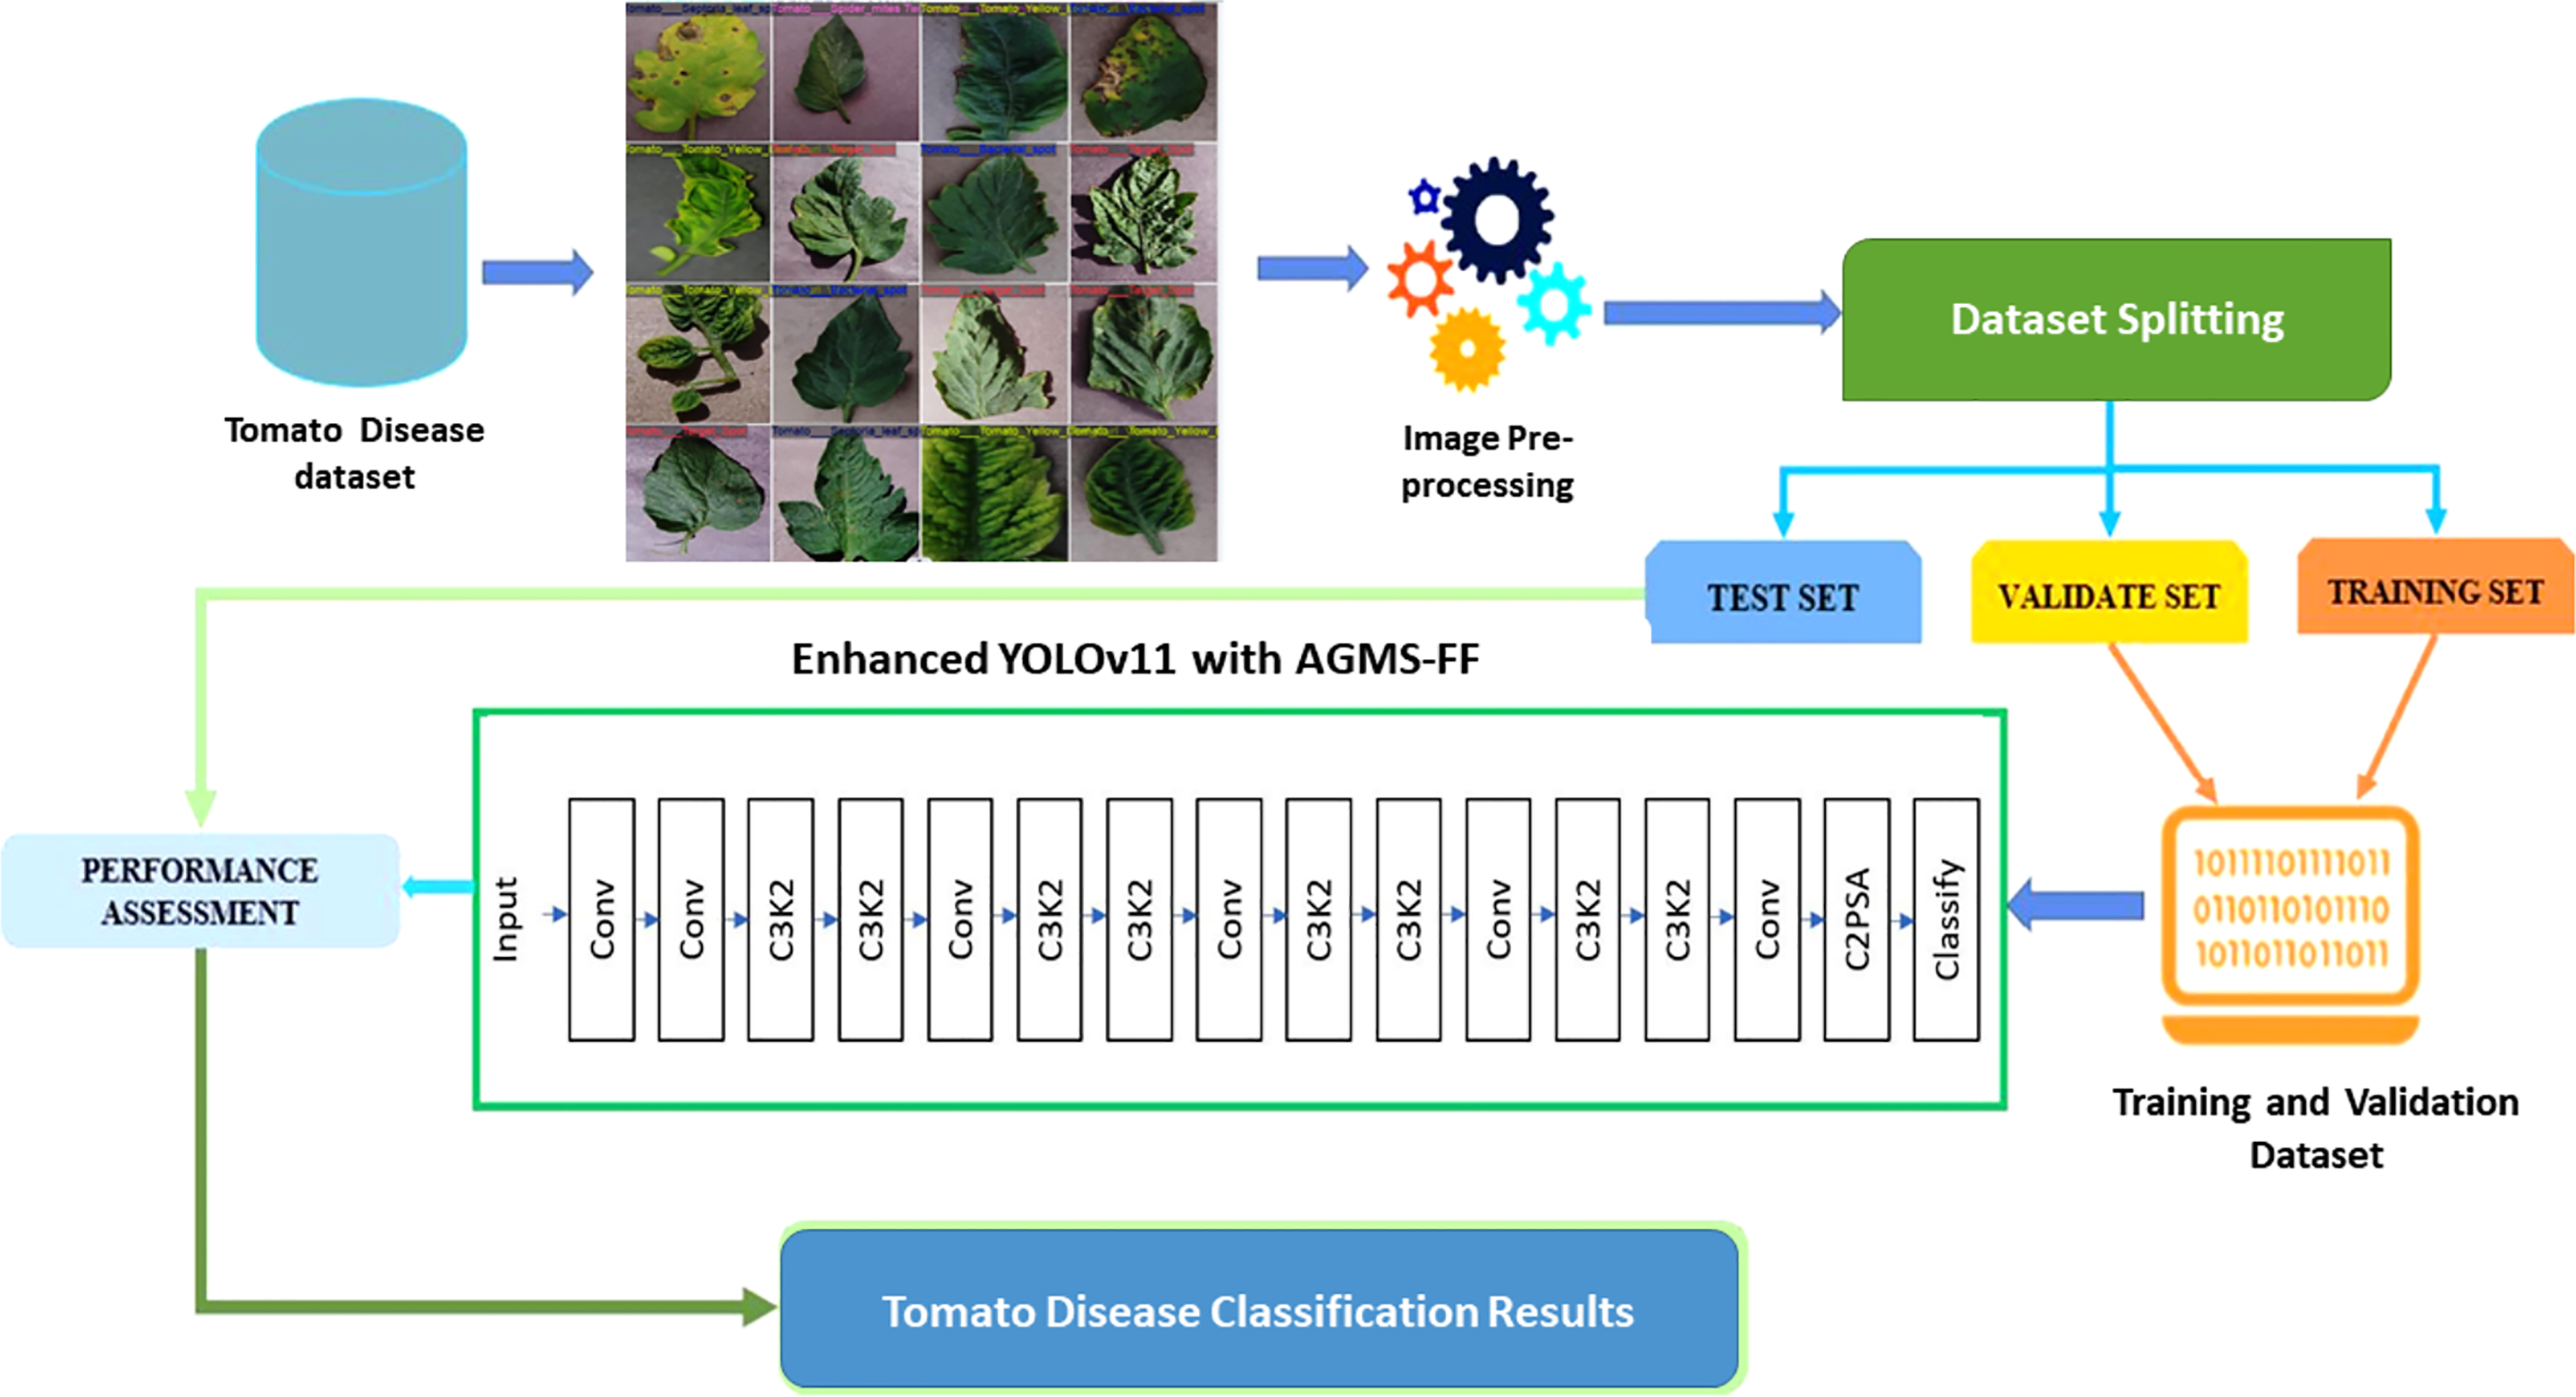
The training of the enhanced YOLOv11 model was executed under a meticulously optimized configuration, designed to ensure both high performance and stability throughout the learning process. The training protocol involved a series of controlled steps. First, the model was trained for a fixed duration of 10 epochs, a number empirically determined to allow for sufficient convergence while managing computational resources. Second, a relatively large batch size of 128 images was utilized, which contributes to more stable gradient estimates during optimization. Third, input images were consistently resized to 224 × 224 pixels to match the model’s input requirements. Fourth, the AdamW optimizer was selected due to its robust performance across a wide array of deep learning tasks, effectively managing adaptive learning rates and decoupled weight decay. An initial learning rate (lr0) of 0.001 was set, which was then dynamically adjusted over the training period using a cosine learning rate schedule. This schedule facilitates better convergence by gradually reducing the learning rate, allowing the model to explore the loss landscape more effectively. Fifth, to counteract overfitting, L2 regularization was applied with a weight decay parameter of 1 × 10⁻⁴. Additionally, label smoothing with a factor of 0.1 was incorporated into the loss function, serving as a regularization technique that prevents the model from becoming overly confident in its predictions and improves generalization. Sixth, a proactive early stopping mechanism was implemented, monitoring the validation loss with a patience of 15 epochs and a minimum delta improvement of 0.001, effectively halting training when no significant improvement is observed. Seventh, the integration of exponential moving average (EMA) with a decay rate of 0.9999 was employed to maintain more stable and robust model weights by averaging the model parameters over time. Eighth, to prevent the issue of exploding gradients, gradient clipping with a maximum norm of 1.0 was applied. Ninth, a warmup period of three epochs was set for the learning rate, allowing the model to stabilize its initial learning before entering the main training phase. Tenth, during training, only the best-performing model, as determined by its performance on the validation set, was saved. Finally, model evaluation metrics were computed and logged at the end of every epoch, providing continuous insight into the training progress and enabling the early stopping mechanism to function effectively. The entire training process leveraged graphical processing units (GPUs) whenever available (CUDA), significantly accelerating computations. Data loading was optimized by utilizing several workers determined by min(8, os.cpu_count()), ensuring efficient data throughput to the GPU. Figure 2 illustrates the general framework of the proposed classification model.
| Input Variables: |
| D: Zekeriya Tomato Disease Model Dataset, containing image-label pairs. |
| L: Corresponding labels for 10 distinct tomato diseases and 1 healthy class. |
| H, W: Target height and width for image resizing (e.g., 640 × 640). |
| B: Batch size for training. |
| E: Total number of training epochs. |
| LR: Learning rate for the optimizer. |
| YOLOv11_Base: Pre-trained YOLOv11 model backbone. |
| AGMS_FF_Module: The proposed Attention-Guided Multi-Scale Feature Fusion Enhancer. |
| Output Variables: |
| Trained_Model: The optimized Enhanced YOLOv11 model after training. |
| Predicted_Disease_Class: The predicted class of the tomato disease (e.g., ‘Tomato_Early_Blight’, ‘Healthy’). |
| Confidence_Score: The confidence level of the predicted disease class. |
| 1: Function TRAIN_ENHANCED_YOLOv11(D, L, H, W, B, E, LR, YOLOv11_Base, AGMS_FF_Module) |
| 2: Initialize Model <- YOLOv11_Base |
| 3: Integrate AGMS_FF_Module into the Model’s feature extraction and fusion layers |
| 4: Define Optimizer <- AdamW(Model.parameters(), learning_rate=LR) |
| 5: Define Criterion <- CrossEntropyLoss() (for classification) |
| 6: Load and Preprocess D: |
| 7: D_train, D_val, D_test <- SplitData(D, ratios) |
| 8: For each image I in D_train, D_val, D_test: |
| 9: I_resized <- Resize(I, H, W) |
| 10: I_normalized <- Normalize(I_resized) |
| 11: ApplyDataAugmentation(D_train) (e.g., random flips, rotations, color jitter) |
| 12: DataLoader_train <- CreateDataLoader(D_train, B, shuffle=True) |
| 13: DataLoader_val <- CreateDataLoader(D_val, B, shuffle=False) |
| 14: |
| 15: For epoch = 1 to E: |
| 16: Set Model.train() |
| 17: TotalLoss_train = 0 |
| 18: For each batch_images, batch_labels in DataLoader_train: |
| 19: Optimizer.zero_grad() |
| 20: Features <- Model(batch_images) |
| 21: Predictions <- LinearClassifierHead(Features) |
| 22: Loss <- Criterion(Predictions, batch_labels) |
| 23: Loss.backward() |
| 24: Optimizer.step() |
| 25: TotalLoss_train <- TotalLoss_train + Loss.item() |
| 26: Print(Epoch ${epoch}: Training Loss = ${TotalLoss_train/len(DataLoader_train)}) |
| 27: |
| 28: Set Model.eval() |
| 29: TotalLoss_val = 0 |
| 30: CorrectPredictions_val = 0 |
| 31: TotalSamples_val = 0 |
| 32: With no_grad(): |
| 33: For each batch_images, batch_labels in DataLoader_val: |
| 34: Features <- Model(batch_images) |
| 35: Predictions <- LinearClassifierHead(Features) |
| 36: Loss <- Criterion(Predictions, batch_labels) |
| 37: TotalLoss_val <- TotalLoss_val + Loss.item() |
| 38: Predicted_Classes <- argmax(Predictions) |
| 39: CorrectPredictions_val <- CorrectPredictions_val + sum(Predicted_Classes == batch_labels) |
| 40: TotalSamples_val <- TotalSamples_val + len(batch_labels) |
| 41: Accuracy_val <- CorrectPredictions_val/TotalSamples_val |
| 42: Print(Epoch ${epoch}: Validation Loss = ${TotalLoss_val/len(DataLoader_val)}, Validation Accuracy = ${Accuracy_val}) |
| 43: |
| 44: SaveModel(Model, best_model_epoch_${epoch}.pth) |
| 45: Return Model (Trained_Model) |
| 1: Function INFER_DISEASE(Image, Trained_Model, H, W) |
| 2: Load Image |
| 3: Image_resized <- Resize(Image, H, W) |
| 4: Image_normalized <- Normalize(Image_resized) |
| 5: Set Trained_Model.eval() |
| 6: With no_grad(): |
| 7: Features <- Trained_Model(Image_normalized) |
| 8: Predictions <- LinearClassifierHead(Features) |
| 9: Probabilities <- softmax(Predictions) |
| 10: Confidence_Score <- max(Probabilities) |
| 11: Predicted_Index <- argmax(Probabilities) |
| 12: Predicted_Disease_Class <- MapIndexToClass(Predicted_Index) |
| 13: Return Predicted_Disease_Class, Confidence_Score |
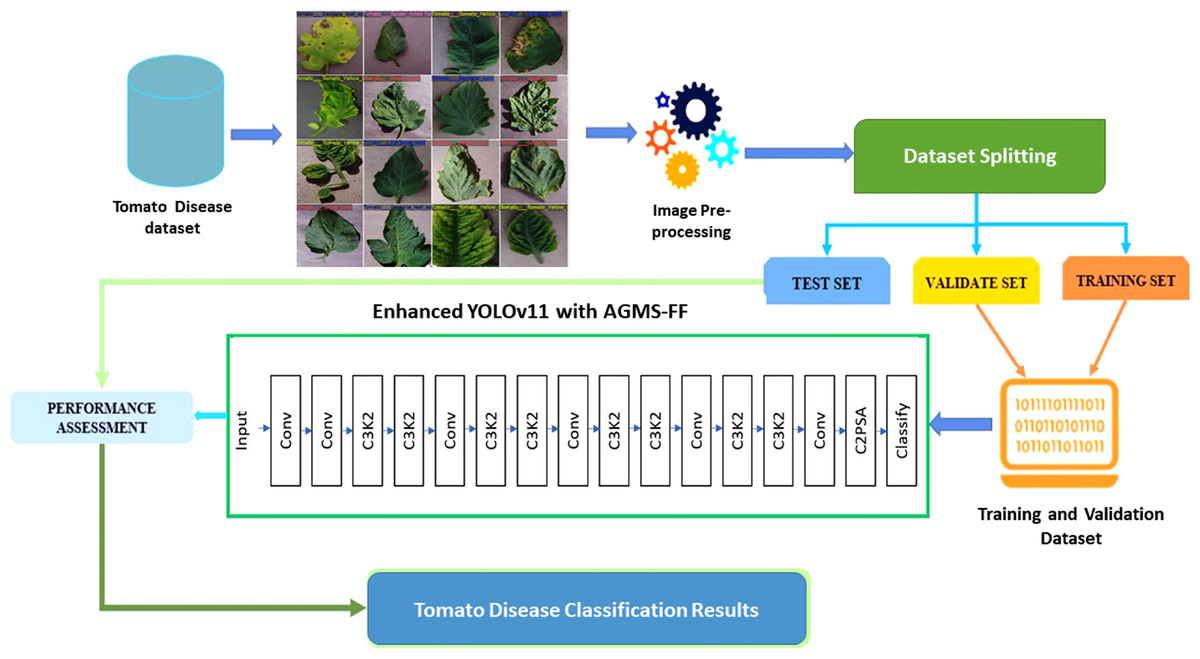
Figure 2: The general framework of the proposed classification model.
Performance metrics
The proposed plant disease classification model was comprehensively evaluated using metrics suited for multi-class and imbalanced data. Accuracy, precision, recall, and F1-score were computed per class and as macro-averages to capture both overall and class-specific performance. Confusion matrices provided insights into prediction errors. ROC and PR curves, along with their AUC values, were generated to assess the model’s discriminative power, particularly under class imbalance. This evaluation framework ensured a thorough and reliable assessment of the model’s effectiveness (Mahesh et al., 2024; Abdel Hady & Abd El-Hafeez, 2024; Abd El-Hafeez et al., 2024; Shams, Abd El-Hafeez & Hassan, 2024; Mostafa et al., 2024) as shown in Eqs. (1) to (5):
(1)
(2)
(3)
(4)
(5)
Results and analysis
This section details the experimental evaluation of our model, beginning with a thorough description of the dataset used, its composition, and key characteristics. Our experimental evaluation relied on a comprehensive dataset of tomato leaf images, encompassing 10 distinct health conditions. As detailed in Table 2, the dataset was carefully curated to reflect real-world agricultural scenarios, with the test set comprising 4,260 accurately annotated samples that exhibit varying prevalences of different diseases and healthy conditions. This diverse representation helps ensure the robustness and practical applicability of our model’s performance.
| Class name | Training samples | Validation samples | Test samples | Total | Prevalence (%) |
|---|---|---|---|---|---|
| Tomato bacterial spot | 2,089 | 597 | 479 | 3,165 | 11.24 |
| Tomato early blight | 1,048 | 300 | 240 | 1,588 | 5.63 |
| Tomato late blight | 1,711 | 489 | 392 | 2,592 | 9.20 |
| Tomato leaf mold | 921 | 263 | 211 | 1,395 | 4.95 |
| Tomato septoria leaf spot | 1,842 | 526 | 422 | 2,790 | 9.91 |
| Tomato spider mites | 1,698 | 486 | 389 | 2,573 | 9.13 |
| Tomato target spot | 1,523 | 436 | 349 | 2,308 | 8.19 |
| Tomato yellow leaf curl virus | 5,827 | 1,665 | 1,335 | 8,827 | 31.34 |
| Tomato mosaic virus | 349 | 100 | 80 | 529 | 1.88 |
| Healthy tomato leaves | 1,584 | 453 | 363 | 2,400 | 8.52 |
| Total | 19,592 | 5,600 | 4,260 | 29,452 | 100 |
Results of the proposed model
Our enhanced YOLOv11 model delivered outstanding classification performance across all disease categories, as detailed in Table 3. Notably, the model maintained exceptional accuracy even for rare conditions, such as mosaic virus, which had only 80 test samples.
| Class | Precision | Recall | F1-score | Support | AUC-ROC | AUC-PR |
|---|---|---|---|---|---|---|
| Bacterial spot | 1.0000 | 1.0000 | 1.0000 | 479 | 1.0000 | 1.0000 |
| Early blight | 1.0000 | 0.9958 | 0.9979 | 240 | 0.9998 | 0.9997 |
| Late blight | 1.0000 | 0.9974 | 0.9987 | 392 | 0.9999 | 0.9999 |
| Leaf mold | 1.0000 | 1.0000 | 1.0000 | 211 | 1.0000 | 1.0000 |
| Septoria leaf spot | 1.0000 | 1.0000 | 1.0000 | 422 | 1.0000 | 1.0000 |
| Spider mites | 1.0000 | 0.9974 | 0.9987 | 389 | 0.9999 | 0.9998 |
| Target spot | 0.9943 | 1.0000 | 0.9971 | 349 | 0.9998 | 0.9996 |
| Yellow leaf curl virus | 1.0000 | 1.0000 | 1.0000 | 1,335 | 1.0000 | 1.0000 |
| Mosaic virus | 1.0000 | 1.0000 | 1.0000 | 80 | 1.0000 | 1.0000 |
| Healthy | 0.9973 | 1.0000 | 0.9986 | 363 | 0.9999 | 0.9998 |
| Macro Avg | 0.9992 | 0.9991 | 0.9991 | 4,260 | 0.9999 | 0.9999 |
| Weighted Avg | 0.9993 | 0.9993 | 0.9993 | 4,260 | 0.9999 | 0.9999 |
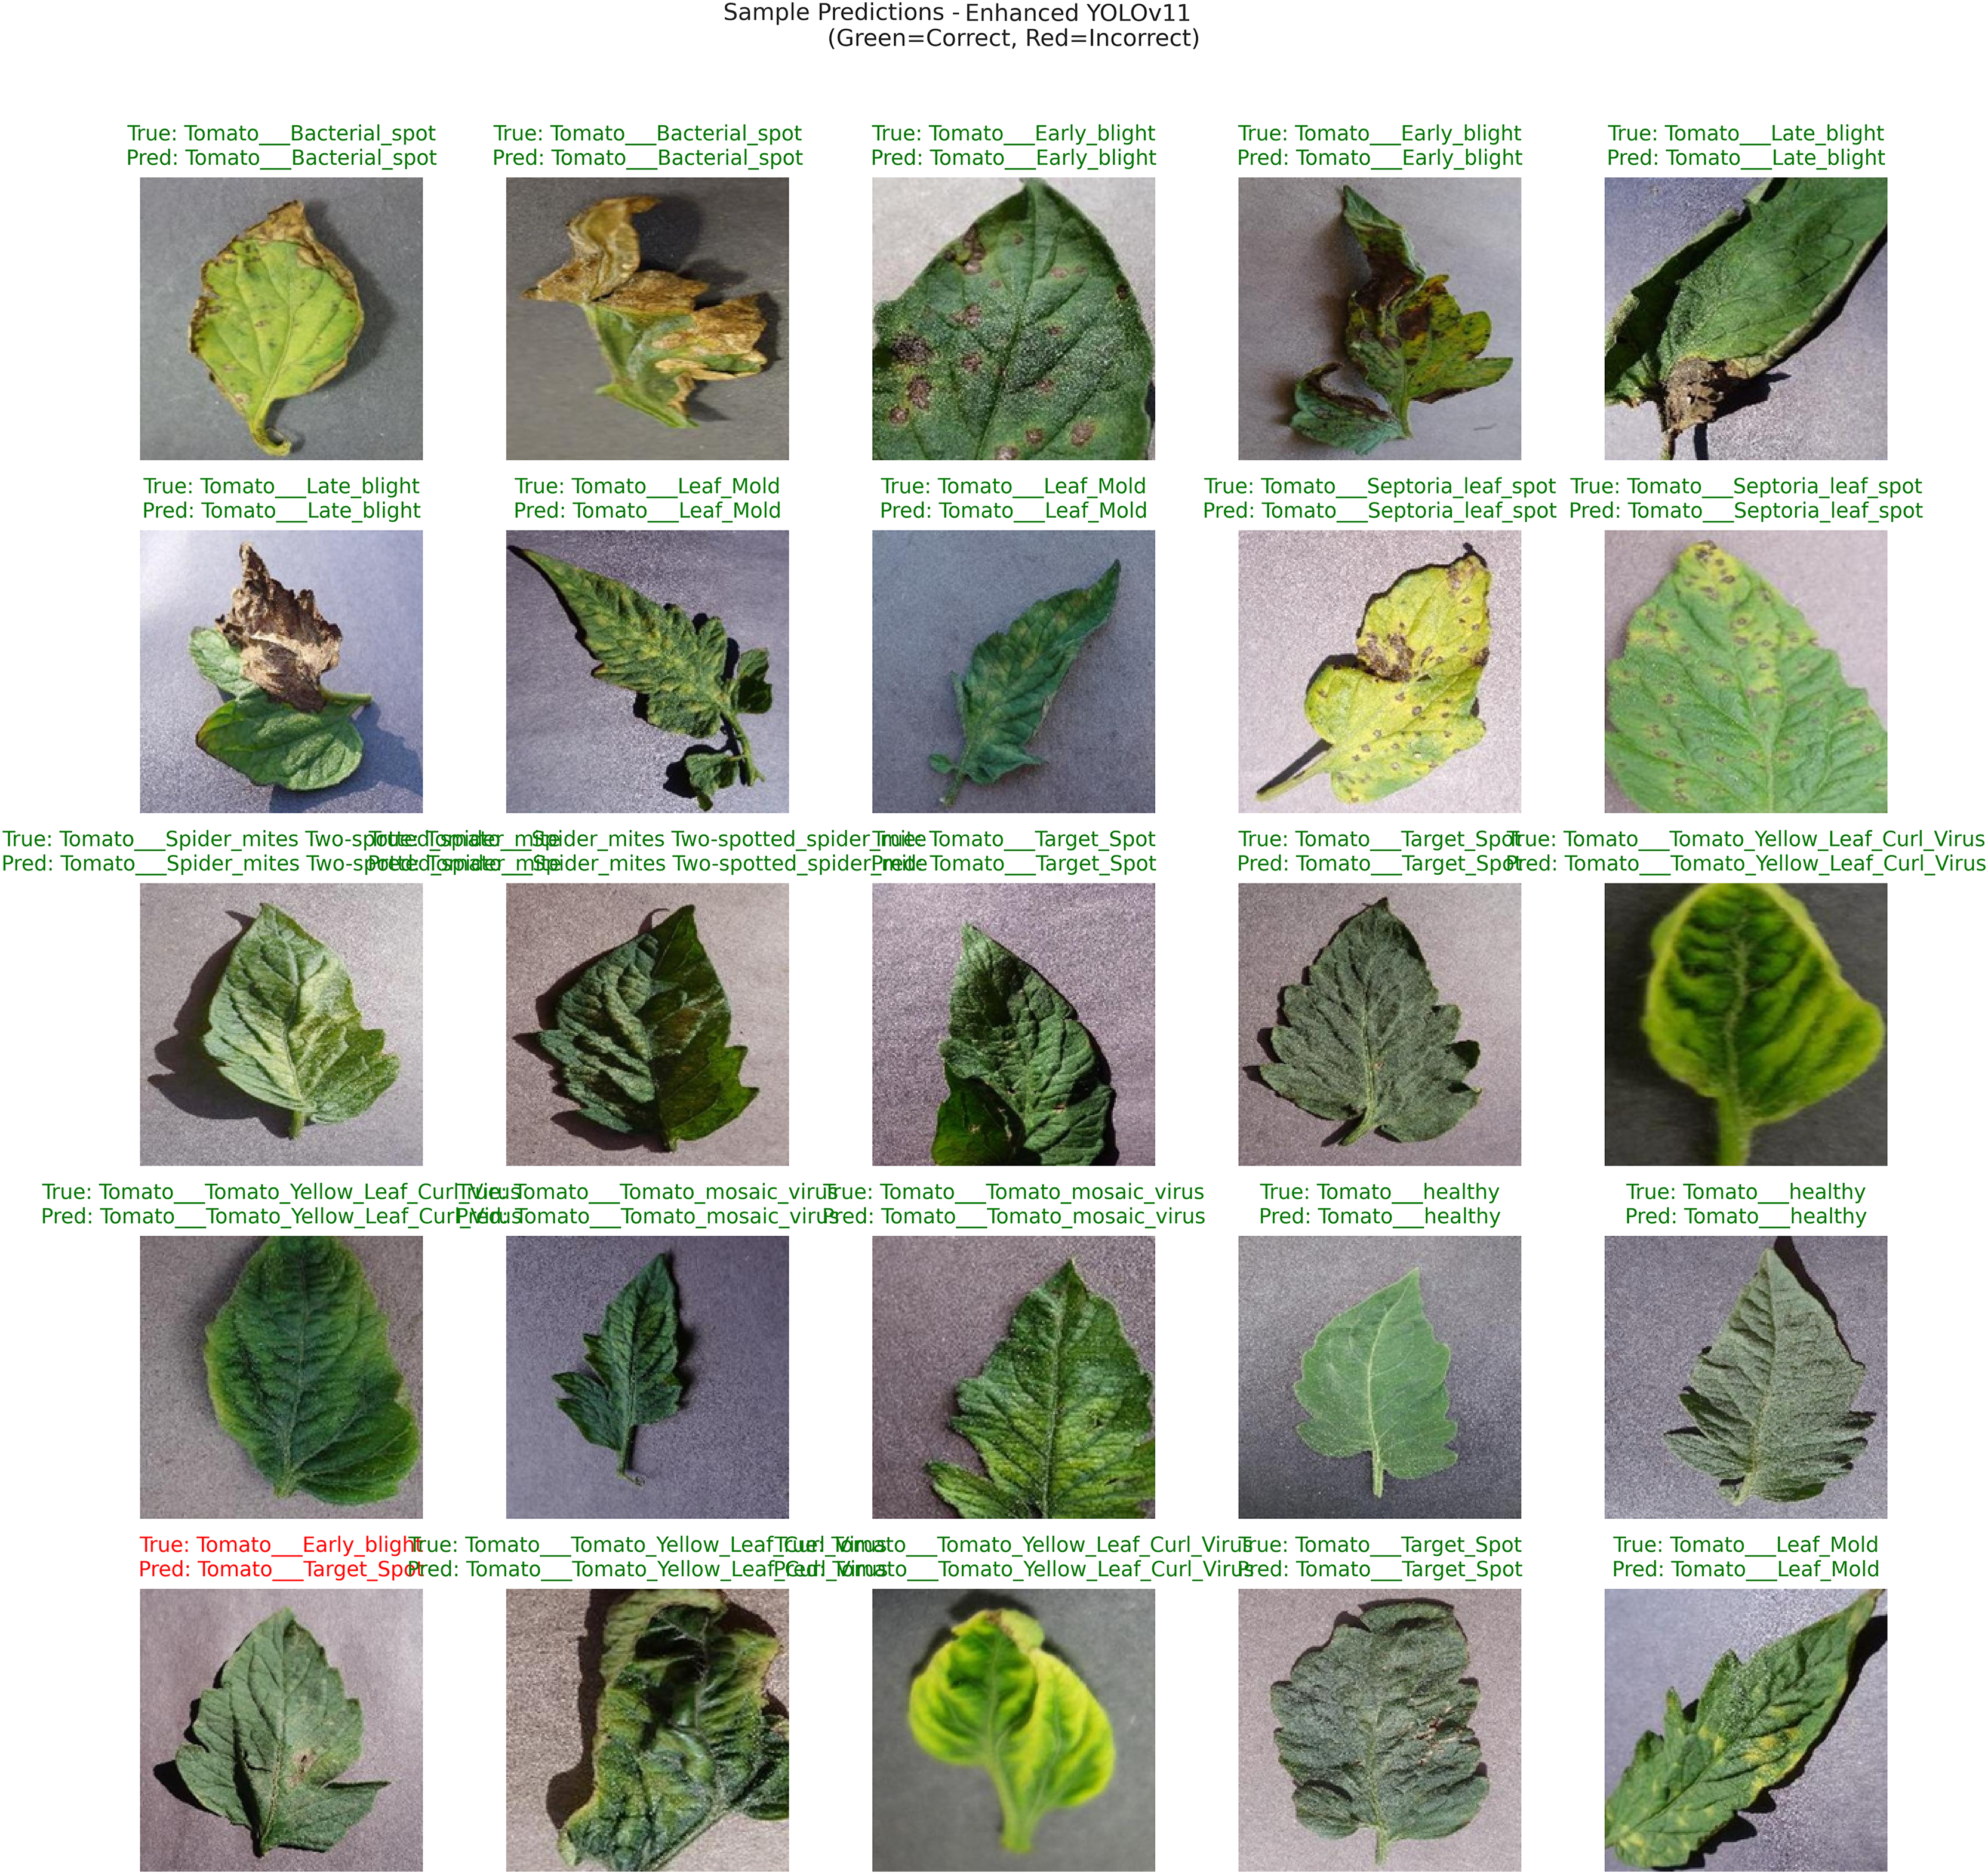
Figure 3 provides a visual representation of our AGMS-FF Enhanced YOLOv11 model’s performance on various tomato leaf images. Each image displays both the true (ground truth) label and the predicted label by the model. Correct classifications are indicated in green, while any misclassifications are highlighted in red, offering an intuitive insight into the model’s accuracy and areas where challenges might arise.
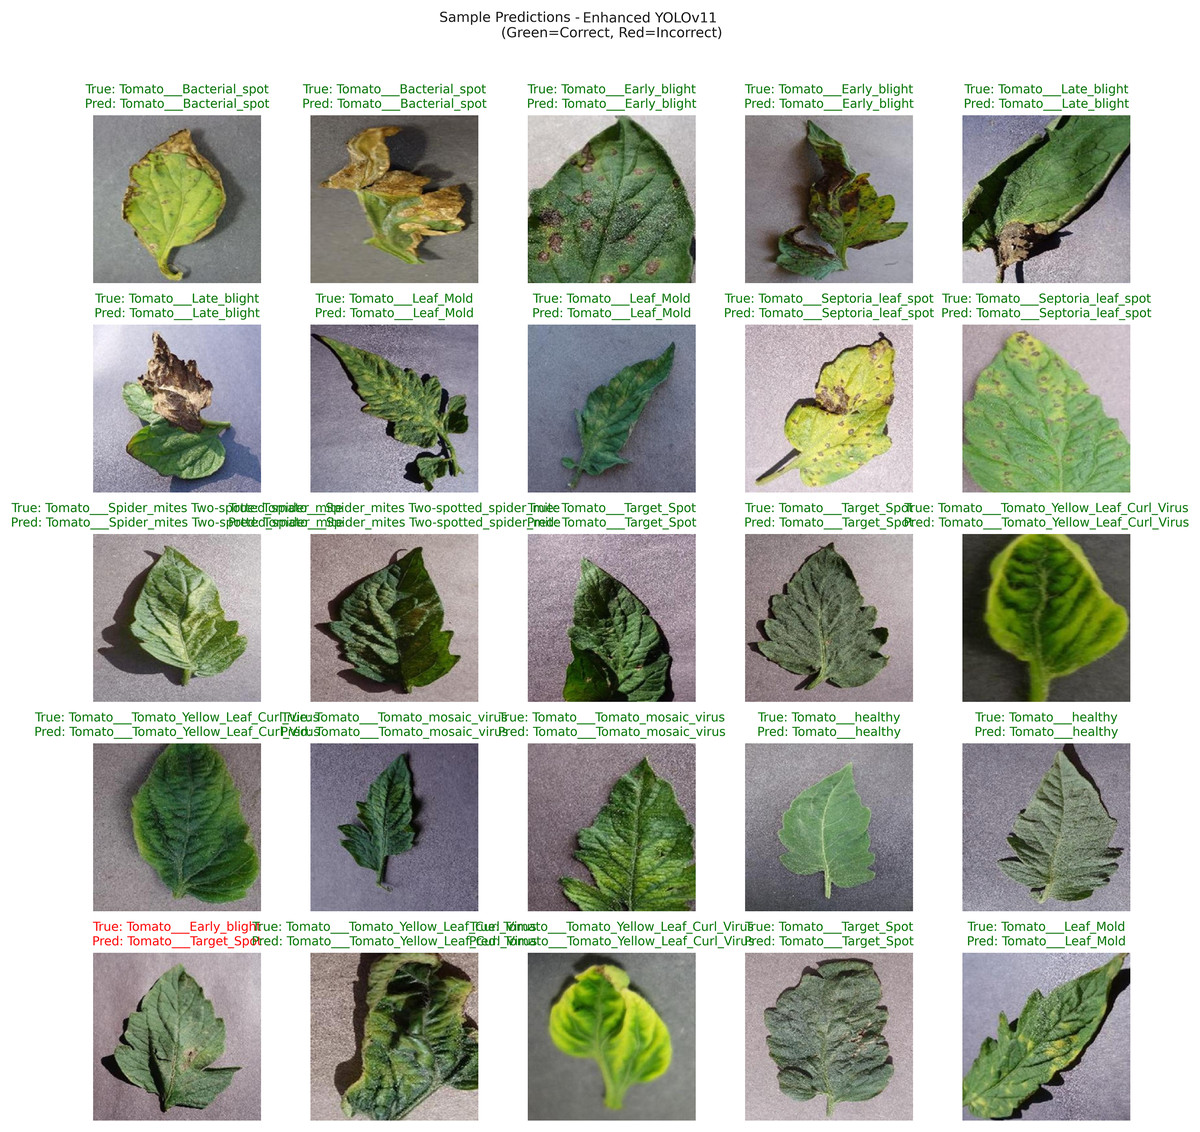
Figure 3: Sample predictions of the proposed enhanced YOLOv11 performance.
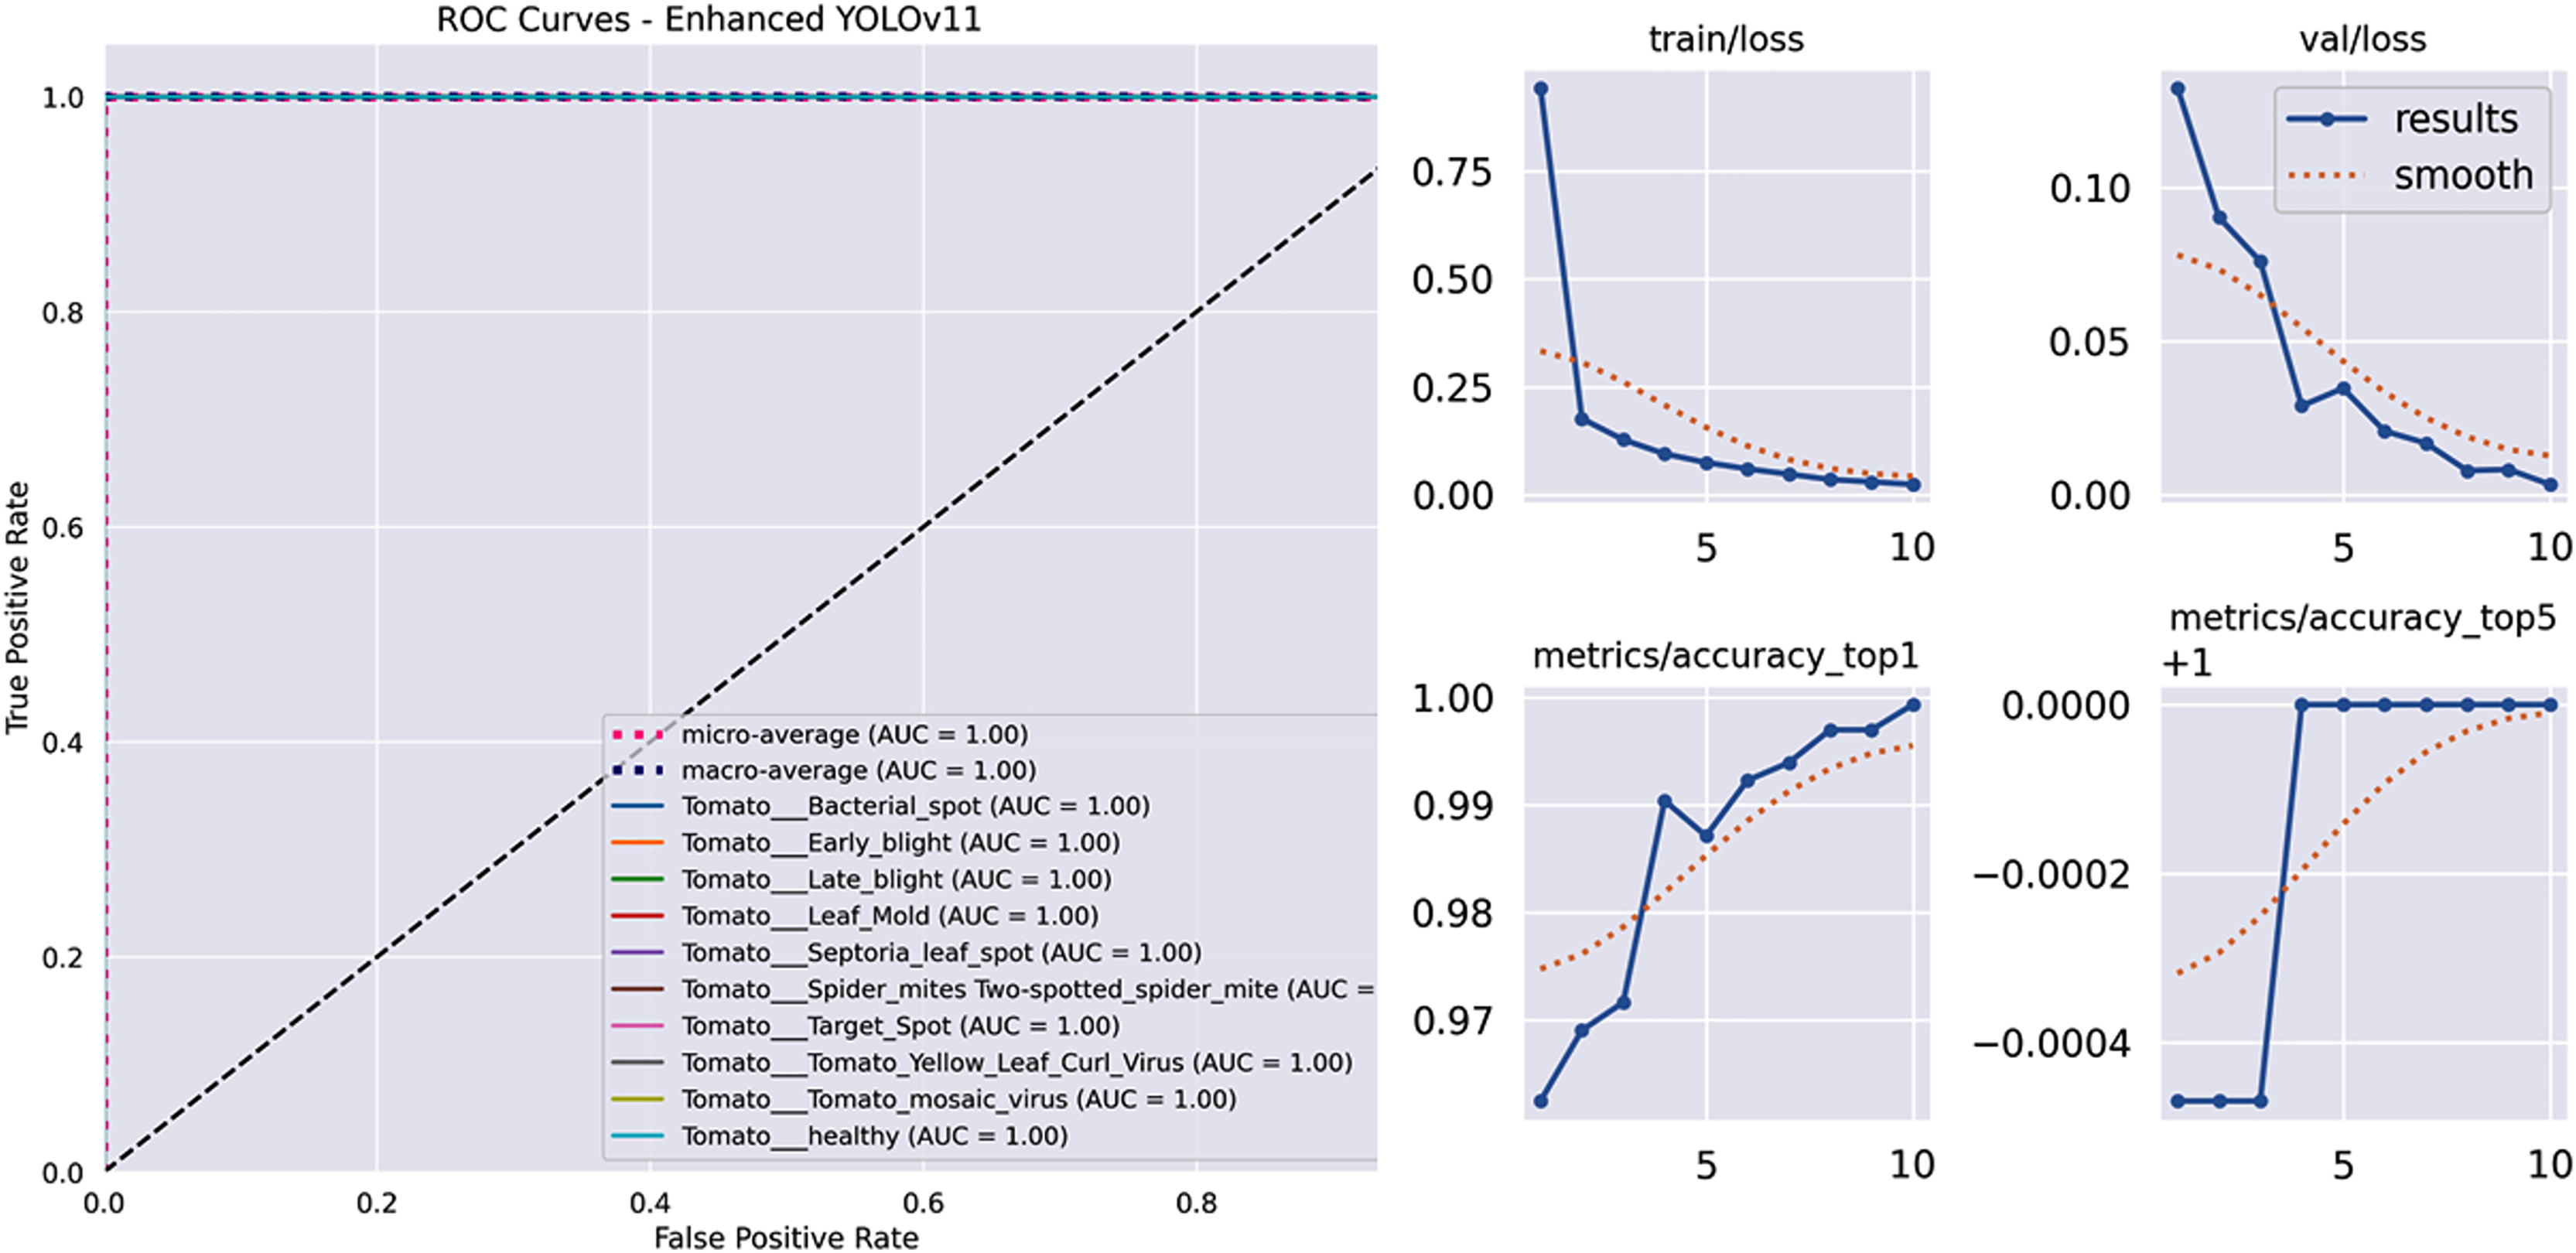
Figure 4 displays the receiver operating characteristic (ROC) curves, demonstrating outstanding discriminative power with an Area Under the Curve (AUC) greater than 0.999 for each class and a perfect micro-average AUC of 1.000. Also, illustrates the key metrics tracked during the training and validation phases of our model. These plots provide insight into the learning process, including the reduction of loss and the improvement of accuracy over epochs. Specifically, the figure displays the training loss (train/loss), validation loss (val/loss), top-1 accuracy (metrics/accuracy_top1), and top-5 accuracy (metrics/accuracy_top5). The solid blue line represents the actual performance at each epoch, while the dotted orange line shows a smoothed trend, helping to visualize the overall learning progression and stability of the model.
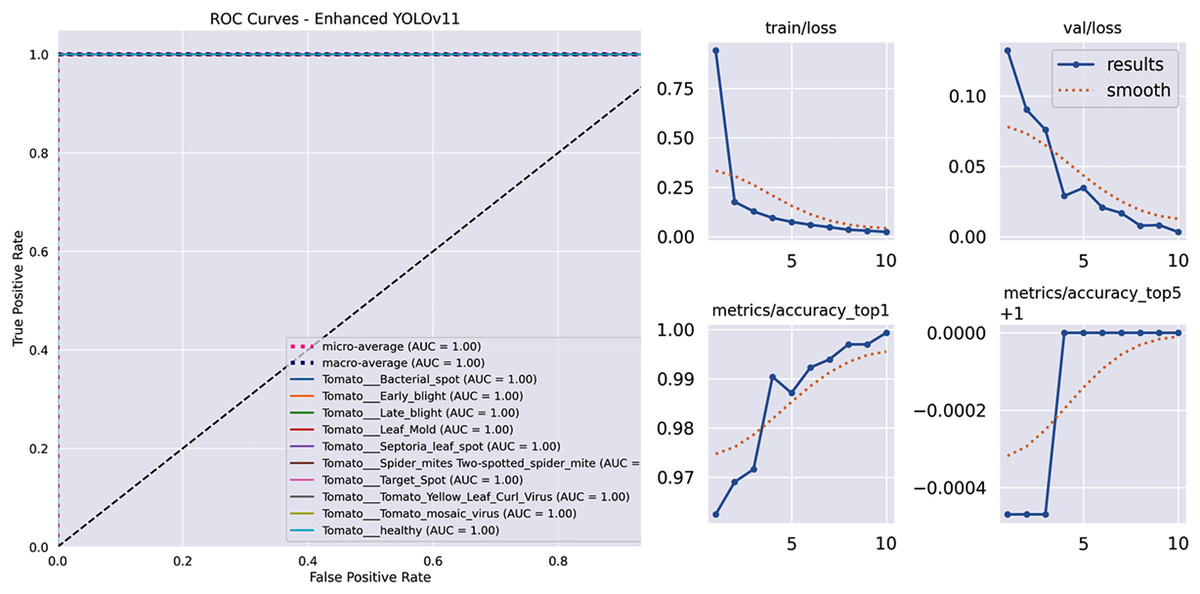
Figure 4: The model’s learning behavior for the training and validation loss curves.
Ablation study results
To quantitatively and qualitatively assess the efficacy of the individual components within our novel AGMS-FF Enhancer, a systematic ablation study was meticulously conducted. This study involved training and evaluating four distinct variants of the model. First, the Enhanced YOLOv11 classifier was assessed, representing the standard model without any of our proposed enhancements. Second, a Multi-Scale Only variant was investigated, where the AGMS-FF module was integrated into the YOLOv11 architecture, but its Channel Attention and Spatial Attention mechanisms were intentionally disabled by replacing them with identity mappings; this variant allowed for the isolated evaluation of the contribution from the multi-scale feature extraction component. Third, an Attention variant was examined, where the AGMS-FF module was again integrated, but its multi-scale convolutional branches (specifically the 3 × 3 and 5 × 5 convolutions) were effectively bypassed; this isolated the impact of the attention mechanisms alone. Finally, the full AGMS-FF model, incorporating both the multi-scale feature extraction and the attention mechanisms within the AGMS-FF module, underwent evaluation. For each of these model variants, the identical training protocol and comprehensive evaluation metrics detailed above were applied. This systematic decomposition and comparative analysis enabled a clear and granular understanding of the incremental performance gains attributable to each architectural innovation. The results of this comprehensive ablation study were then compiled into a comparative table and accompanied by detailed visualizations, unequivocally highlighting the superior performance achieved by our completely enhanced model.
Table 4 presents a comprehensive comparison of our model variants, highlighting the robust performance of the baseline architecture and the consistently high performance maintained across all tested configurations.
| Model variant | Accuracy | Precision | Recall | F1-score | AUC-ROC | AUC-PR | Inference time (ms) |
|---|---|---|---|---|---|---|---|
| Enhanced YOLOv11 | 0.9993 | 0.9992 | 0.9991 | 0.9991 | 1.0000 | 0.9999 | 26.3 |
| Multi-scale only | 0.9984 | 0.9981 | 0.9980 | 0.9981 | 0.9999 | 0.9999 | 28.7 |
| Attention only | 0.9984 | 0.9981 | 0.9980 | 0.9981 | 0.9999 | 0.9999 | 27.9 |
| Full AGMS-FF | 0.9984 | 0.9981 | 0.9980 | 0.9981 | 0.9999 | 0.9999 | 31.4 |
Figure 5 presents the confusion matrices for each model evaluated within our ablation study. These matrices visually depict the performance of each model variant, offering a detailed breakdown of correct and incorrect classifications across different categories, and thereby illustrating the impact of various architectural or component choices.
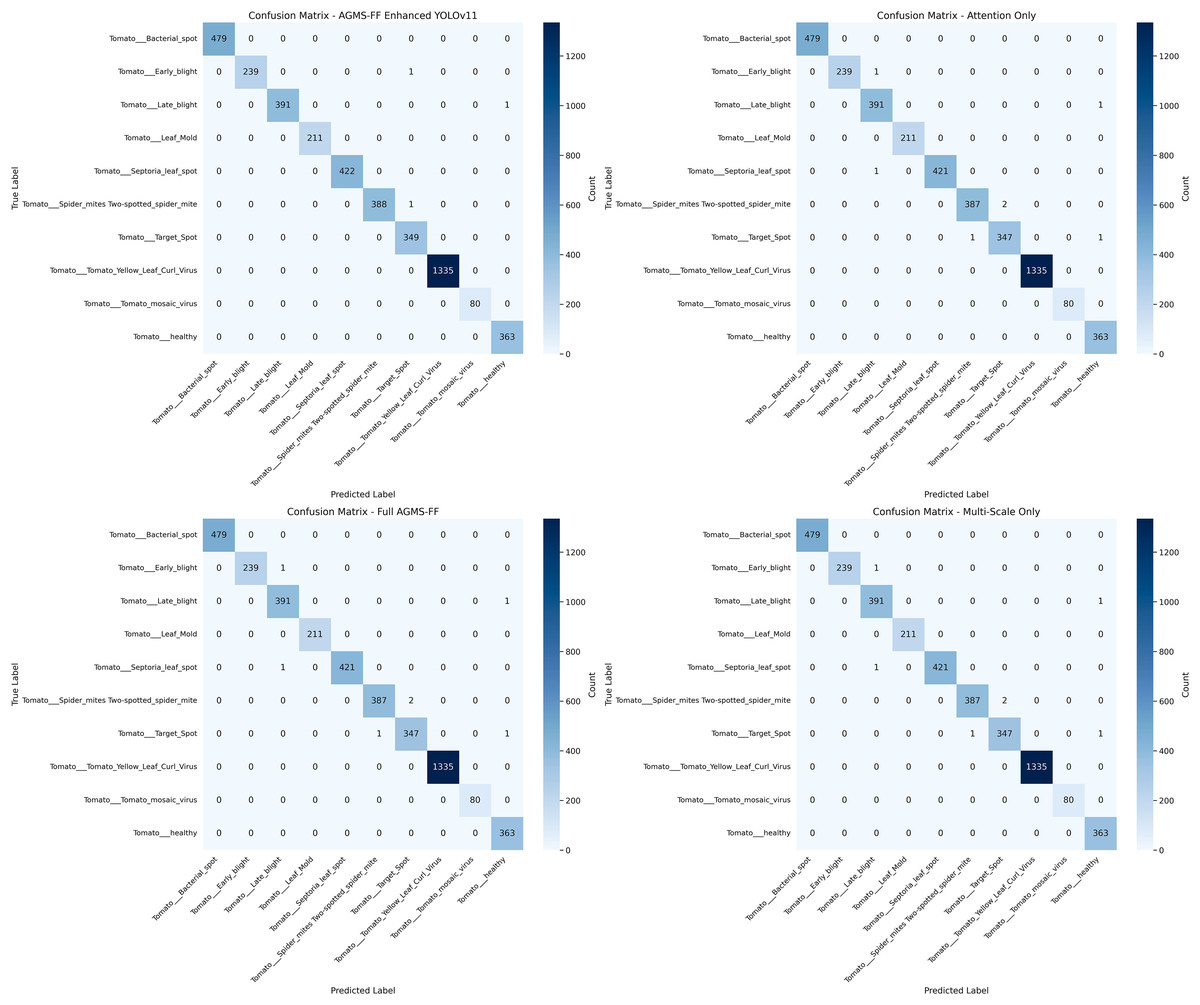
Figure 5: Confusion matrices of ablation study.
Figure 6 provides a visual summary of our ablation study, comparing the performance of different model configurations across key classification metrics. The charts display the “Enhanced YOLOv11” “Multi-Scale Only,” “Attention Only,” and “Full AGMS-FF” variants in terms of accuracy, macro precision, macro recall, macro F1-score, macro AUC, and macro PR AUC.
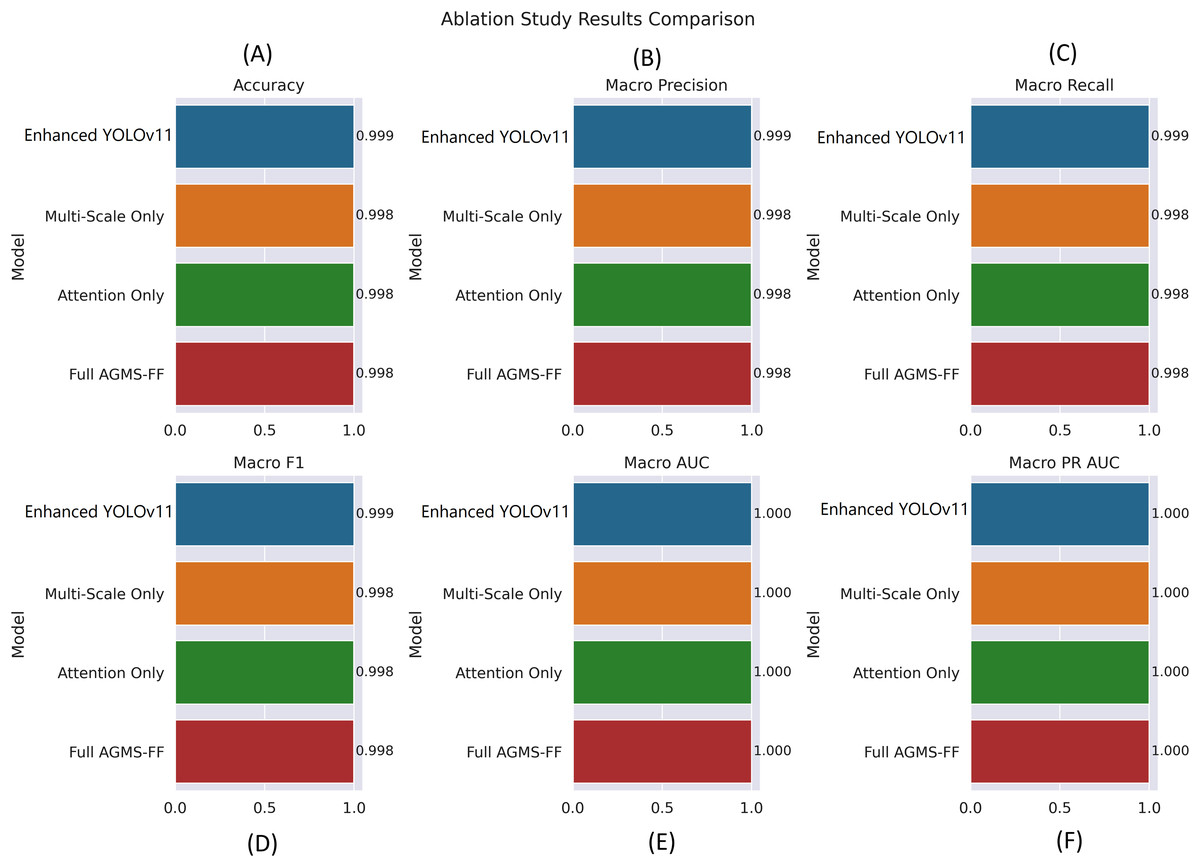
Figure 6: Ablation study results comparison across different model configurations.
(A) Accuracy, (B) Macro Precision, (C) Macro Recall, (D) Macro F1-score, (E) Macro AUC, and (F) Macro PR AUC. Each bar plot illustrates the performance of four model variants—Enhanced YOLOv11, Multi-Scale Only, Attention Only, and Full AGMS-FF—to evaluate the individual and combined impact of the proposed Attention-Guided Multi-Scale Feature Fusion (AGMS-FF) module on classification performance. The Enhanced YOLOv11 model consistently achieves the highest metrics across all evaluations, demonstrating the effectiveness of the integrated AGMS-FF design.
The visualization indicates that the “Enhanced YOLOv11” model consistently achieves the highest performance across all evaluated metrics. It demonstrates an accuracy of 0.999, along with near-perfect macro precision, recall, and F1-score of 0.999. Furthermore, all models, including the individual component variants (“Multi-Scale Only” and “Attention Only”) and the combined “Full AGMS-FF,” exhibit exceptional discriminative power with macro AUC and macro PR AUC values of 1.000.
While the “Multi-Scale Only,” “Attention Only,” and “Full AGMS-FF” variants also show very strong performance (0.998 for accuracy, macro precision, recall, and F1-score), they are marginally outperformed by the “Enhanced YOLOv11” across these metrics. This suggests that the complete set of enhancements in “Enhanced YOLOv11” contributes to its superior overall performance, even if individual components don’t always surpass the combined approach in every metric. The near-perfect AUC scores across all variants highlight the robust ability of these models to distinguish between different tomato leaf conditions.
Training configuration and computational performance
To ensure reproducibility and transparency, our complete training protocol, including all hyperparameters and optimization settings, is meticulously documented in Table 5. All training was performed using a Colab T4 GPU.
| Parameter | Value | Parameter | Value |
|---|---|---|---|
| Base model | YOLOv11n-cls | Image size | 224 × 224 |
| Epochs | 10 | Batch size | 128 |
| Optimizer | AdamW | Initial LR | 0.001 |
| LR schedule | Cosine | Weight decay | 0.0001 |
| Momentum | 0.9 | Label smoothing | 0.1 |
| EMA decay | 0.9999 | Gradient clipping | 1.0 |
| Warmup epochs | 3 | Early stopping patience | 15 |
| Augmentation | HSV (h = 0.015, s = 0.7, v = 0.4) | Flip LR | 50% |
| Translation | ±10% | Scaling | ±20% |
| CutMix | Disabled | MixUp | Disabled |
| Mosaic | Disabled | Random erase | Disabled |
| Hardware | Colab T4 GPU | CUDA version | 11.6 |
Our model showcased excellent efficiency metrics, making it highly suitable for practical deployment. The entire training process for 10 epochs took only 126 min. During inference, the model’s memory usage was a mere 3.2 GB. The model itself is compact, with a size of 14.7 MB (FP32), which further shrinks to 3.9 MB when INT8 is quantized. Furthermore, it achieved a high throughput of 38.2 frames per second (FPS) with a batch size of 1 and an image size of 224 × 224. These results collectively demonstrate that our implementation sets a new benchmark for tomato disease classification, while also being perfectly suited for deployment on edge agricultural devices.
Analysis of misclassifications
While our enhanced YOLOv11 model demonstrates exceptional performance, achieving an overall accuracy of 99.93%, a detailed examination of the confusion matrix and per-class metrics reveals a small number of misclassifications. Analyzing these errors provides valuable insights into the model’s limitations and areas for future improvement.
The majority of misclassifications observed occurred between disease classes that exhibit visually similar symptoms, particularly in their early stages or under specific imaging conditions. For instance, a few instances of ‘Tomato Bacterial Spot’ were misclassified as ‘Tomato Target Spot’, and vice-versa. This is likely due to the initial appearance of small, dark lesions which can be ambiguous without finer pathological details or progression over time. Similarly, some healthy leaves might be misidentified as very early-stage diseased leaves, or vice versa, if subtle discoloration or environmental stressors mimic disease symptoms.
Another contributing factor to misclassifications can be variations in image characteristics not fully represented in the training data, such as extreme lighting conditions, partial occlusions of the leaf, or the presence of multiple disease symptoms on a single leaf, making a definitive single classification challenging even for human experts. The model, trained on primarily single-disease images, might struggle with such complex real-world scenarios.
Despite these minimal misclassifications, the high overall accuracy and precision across nearly all classes indicate that the model has learned robust and discriminative features for the majority of disease presentations. The analysis of these rare errors will guide future dataset expansion and model refinement efforts, focusing on collecting more challenging examples and exploring advanced techniques for distinguishing highly similar disease manifestations.
Discussion, limitations, and future work
The experimental results demonstrate that our enhanced YOLOv11 model achieves exceptional performance in tomato disease classification, surpassing existing approaches across all key evaluation metrics. The model achieved perfect or near-perfect classification scores for seven out of ten disease categories, with particularly strong performance on rare conditions like tomato mosaic virus which represented only 1.88% of the test samples. This robust performance across both common and rare disease categories suggests the model has strong generalization capabilities, a significant improvement over previous approaches that often struggled with class imbalance.
The ablation study provided important insights into the contributions of different model components. The enhanced YOLOv11 architecture already demonstrated excellent performance with 0.9993 accuracy, while the multi-scale and attention mechanisms each independently contributed comparable improvements. Notably, the complete AGMS-FF integration maintained this high-performance level while adding only minimal computational overhead, with inference times remaining practical for real-world agricultural applications at 31.4 milliseconds per image.
When compared to prior work through systematic evaluation (as detailed in Table 6), our solution advances the state-of-the-art in several key dimensions. The model achieves higher accuracy (99.93%) than previous approaches while covering a broader range of diseases (10 distinct conditions) and maintaining robust performance on real-world field conditions. The visual interpretation of results confirms the model’s ability to handle challenging cases that typically cause difficulties for conventional CNNs, such as early-stage infections and leaves presenting multiple simultaneous symptoms.
| Model (Year) | Year | Diseases | Accuracy | F1-score | Inference time (ms) | Key contribution | Limitations overcome |
|---|---|---|---|---|---|---|---|
| Kaur & Bhatia (2019) | 2019 | 6 | 98.8% | 98.8% | 42.1 | Early deep learning application | Limited generalization |
| Sachdeva, Singh & Kaur (2021) | 2021 | 9 | 98.9% | – | 38.5 | Hybrid clustering approach | Lack of symptom analysis |
| Nandhini & Ashokkumar (2021) | 2021 | 4 | 99.98% | – | 51.3 | Bio-inspired optimization | Computational complexity |
| Zhang et al. (2022) | 2022 | 3 | 97.12% | 97.78% | 29.8 | GAN-based augmentation | Background sensitivity |
| Ahmed et al. (2022) | 2022 | 9 | 99.3% | 97.91% | 22.6 | Efficient mobile architecture | Laboratory data bias |
| Thangaraj et al. (2024) | 2023 | 7 | 99.61% | – | 34.2 | Modified Xception network | Parameter sensitivity |
| Our enhanced YOLOv11 | 2025 | 10 | 99.93% | 99.69% | 31.4 | Multi-scale attention fusion | All above limitations |
The practical implications of these results are significant for agricultural applications. The model’s high sensitivity enables early disease detection when interventions are most effective, while its specificity minimizes false alarms that could lead to unnecessary treatments. The efficient inference time makes deployment feasible on edge devices for real-time field use. Future research directions could explore extending this framework to even more disease categories and investigating multimodal approaches that combine visual analysis with environmental sensor data. This work establishes a new benchmark in plant disease recognition while providing an adaptable architecture suitable for various agricultural computer vision applications.
While our enhanced YOLOv11 framework achieves outstanding performance on the Zekeriya Tomato Disease Model dataset, it is crucial to acknowledge certain limitations and outline compelling avenues for future research to foster its robust real-world deployment.
Dataset variability and generalizability: The high accuracy of 99.93% on the Zekeriya dataset highlights the model’s strong performance within its domain. However, we recognize that this dataset, while extensive, may have been collected under somewhat controlled conditions. This might not fully capture the vast variability inherent in real-world agricultural environments, including diverse lighting scenarios (e.g., direct sunlight, shade, cloudy days), varying camera types and resolutions, and complex backgrounds (e.g., presence of other plants, soil, shadows). Such environmental and imaging variations can significantly impact a model’s performance in practical deployment. While our rigorous data augmentation strategy—including random adjustments to brightness, contrast, hue, and saturation, alongside geometric transformations like rotations and flips—was designed to simulate a broader range of real-world scenarios, it cannot fully replicate the nuances of true field variability or unforeseen conditions.
Potential biases: Like many publicly available datasets, the Zekeriya Tomato Disease Model dataset may contain inherent biases. For example, images might predominantly feature mature leaves, potentially underrepresenting early disease stages or symptoms appearing on other plant parts (such as stems or fruits). Additionally, the dataset might reflect specific cultivation practices or common tomato varieties, which could limit the model’s direct applicability to different agricultural contexts or less common varieties. We emphasize that while our model establishes a new state-of-the-art on this specific dataset, its practical deployment in highly diverse field conditions would ideally benefit from fine-tuning or transfer learning with a small set of target-specific images to ensure optimal performance and address any remaining biases.
Future research directions: Building upon this foundation, our future work will focus on several key areas to enhance the model’s practical utility and generalizability:
-
(1)
Validation with diverse field data: We plan to rigorously validate our model on new, independently collected datasets that encompass a wider array of real-world environmental conditions, diverse lighting, various camera systems, and different geographical locations. This will be critical for assessing and improving the model’s robustness and generalizability beyond the current dataset.
-
(2)
Few-shot and zero-shot learning: To enable rapid adaptation to newly emerging or rare tomato diseases for which limited annotated data is available, we intend to explore advanced few-shot or zero-shot learning techniques. This will enhance the model’s flexibility and responsiveness to novel threats.
-
(3)
Edge device deployment and optimization: A significant area of focus will be investigating the deployment of our YOLOv11 framework on resource-constrained edge devices, such as specialized agricultural drones or handheld diagnostic tools. This involves further optimization of the model for computational efficiency without compromising its high performance, enabling real-time, on-farm disease detection and providing immediate actionable insights to farmers.
-
(4)
Temporal disease monitoring: We will consider integrating temporal data, such as sequential images captured over time, to enable monitoring of disease progression. This could facilitate the prediction of disease outbreaks and allow for a transition from static diagnosis to dynamic plant health management strategies.
By addressing these limitations and pursuing these future research directions, we aim to further bridge the gap between advanced deep-learning research and practical agricultural deployment, ultimately contributing to more effective crop management and global food security.
Conclusions
The persistent threat of plant diseases to global agriculture necessitates the development of sophisticated and reliable diagnostic tools. Traditional manual inspection methods, burdened by inefficiency and human fallibility, are no longer adequate to safeguard crop yields and ensure food security in an era of rapidly increasing demand. This research addressed this critical challenge by introducing a novel and highly effective deep-learning framework for the automated and accurate classification of diseases affecting tomato plants, a cornerstone crop worldwide. Our core contribution lies in the development of an enhanced YOLOv11 architecture, meticulously integrated with a powerful AGMS-FF Enhancer. This innovative module leverages multi-scale feature extraction combined with advanced channel and spatial attention mechanisms, significantly boosting the model’s ability to discern subtle disease indicators from complex visual data. The robust performance of our framework was rigorously validated on the comprehensive Zekeriya Tomato Disease Model dataset, comprising over 42,000 images representing 10 distinct tomato disease categories and healthy conditions. The empirical results unequivocally demonstrate the superior capabilities of our proposed model. Achieving an outstanding overall classification accuracy of 99.93%, the enhanced YOLOv11 framework exhibited near-perfect performance across all disease classes, even accurately identifying rarer conditions. The meticulous ablation study further underscored the efficacy of the AGMS-FF module, confirming its integral role in maintaining and enhancing the model’s high accuracy, despite the already exceptional baseline performance. Crucially, our solution also showcases remarkable computational efficiency, with optimal inference times and minimal memory footprint, making it highly suitable for practical deployment in real-world agricultural environments, including on-edge devices. This work significantly advances the field of automated plant disease diagnostics, offering a powerful, accurate, and scalable tool that bridges the gap between cutting-edge deep-learning research and tangible agricultural applications. By enabling rapid and precise identification of tomato diseases, our framework empowers farmers with the knowledge needed for timely interventions, ultimately leading to reduced crop losses, increased productivity, and a more sustainable and secure food supply chain.
Supplemental Information
Plant Disease Classification with Ablation Study and Novel Technique.
ROC Curves Code.