
A hybrid GA-ANN machine learning with novel DBSTLink data balancing approach for driving action detection: solution to road crash prediction
- Published
- Accepted
- Received
- Academic Editor
- Stefano Cirillo
- Subject Areas
- Algorithms and Analysis of Algorithms, Data Mining and Machine Learning, Data Science, Optimization Theory and Computation, Neural Networks
- Keywords
- Driving action, DBSCAN, SMOTE-Tomek link, Balancing technique, Road crash, Hybrid machine learning
- Copyright
- © 2025 Jahan et al.
- Licence
- This is an open access article distributed under the terms of the Creative Commons Attribution License, which permits unrestricted use, distribution, reproduction and adaptation in any medium and for any purpose provided that it is properly attributed. For attribution, the original author(s), title, publication source (PeerJ Computer Science) and either DOI or URL of the article must be cited.
- Cite this article
- 2025. A hybrid GA-ANN machine learning with novel DBSTLink data balancing approach for driving action detection: solution to road crash prediction. PeerJ Computer Science 11:e3131 https://doi.org/10.7717/peerj-cs.3131
Abstract
Road crashes have been viewed as one of the major issues leading to numerous economic losses, health problems, and fatalities, which are often due to driver actions (DA). Predicting effective DA for road crashes is crucial for developing effective intelligent transportation systems. The research community focused on transportation safety has made significant advancements in utilizing machine learning models to examine crash incidents in recent years. The application of various machine learning (ML) models has been widespread, but the specific focus on assessing DA has received relatively little attention. The article aims to propose a hybrid genetic algorithm combined with artficial neural network (GN-ANN) ML model to predict risky DA related to road accidents considering effective sampling strategies. This article also proposes a novel sampling strategy that combines Density-Based Spatial Clustering of Applications with Noise (DBSCAN) with Synthetic Minority Oversampling Technique (SMOTE)-Tomek Link named DBSTLink, where DBSCAN and SMOTE-Tomek Links are integrated to purify datasets from noise and outliers using DBSCAN and to balance class distribution by oversampling minority classes and deleting overlaps with SMOTE-Tomek Links to enhance classifier accuracy. This method is then compared with other sampling strategies like SMOTE, SMOTE Tomek Link, and DBSM (DBSCAN with SMOTE). The objective of this study is to strengthen the existing knowledge of crash probability by examining the influence of various data balancing with the proposed balancing approach on forecast F1-score, Matthew’s correlation coefficient (MCC), and G-mean. The results demonstrate that DBSTLink gives higher performance than other measures. The proposed hybrid GA-ANN machine learning model achieved an accuracy of 99%, an F1-score of 98%, and a recall of 99%. Additionally, it achieved a G-mean of 98% and an MCC of 96%. The research found the important attributes of DA that are responsible for road crashes.
Introduction
Road accidents pose a crucial dilemma for public health and safety and are continually increasing. Accidents are recognized as one of the major concerns, as every year road traffic accidents cause the deaths of around 1.19 million people, according to the World Health Organization reports (WHO, 2023). Accidents cause non-fatal injuries to an extra 20 to 50 million individuals, resulting in long-term disability. Research has proven that the influence of driver actions on vehicle kinematics significantly affects road crashes. According to Lu et al. (2020), well over 1 million people worldwide lose their lives in traffic accidents every year, and well over 50 million suffer injuries. Most crashes are caused by human factors, according to an analysis of the factors that cause them, which includes variables affecting the vehicle itself, the roadway, or a combination of these variables (Rahman et al., 2022).
Many researchers have conducted investigations to determine state-of-the-art road safety analysis and have developed systems to enhance road safety. For road safety research, analysis of driver behavior (DB) (Albert et al., 2018; Gupta, Choudhary & Parida, 2021) should be a major concern as traffic accidents are often caused by human factors (Luk et al., 2017; Wang et al., 2022). Researchers have utilized driving performance measures to explore the impact of drivers’ behavioral traits on driving quality, presuming that deviations from standard driver actions signify hazardous circumstances (Yadav & Velaga, 2019; Choudhary & Velaga, 2019). According to Osman et al. (2019), they used machine learning techniques such as K-nearest neighbor (KNN), random forest (RF), support vector machine (SVM), decision trees (DT), Gaussian naïve Bayes (Gaussian NB), and adaptive boost (AdaBoost) to predict close crashes based on data from inside the vehicle. Artificial neural networks (ANN) and decision trees (DT) were utilized by Zouhair, Mousannif & Al Moatassime (2020) to analyze crash events and assess the effects of weather on traffic safety. Researchers (Lee & Li, 2015) use the boosted regression tree to predict the severity of driver injuries. However, they noted a drawback when using ensemble approaches to leverage the advantages of decision trees. In parallel, Parsa et al. (2020) applied extreme gradient boosting (XGBoost) for real-time accident detection and feature analysis, with the aim of improving highway safety. Their study demonstrated the potential of these methods for identifying key factors contributing to accidents.
Applications of machine learning (ML) models in finding DA are still limited, but more research should be done by the researcher to find out the major DA that causes traffic accidents. The literature, which includes the aforementioned studies and others, clarifies it that the effectiveness of produced models depends on the datasets and data mining algorithms used, with these factors varying between investigations. The RF method was utilized by Mafi, Abdelrazig & Doczy (2018) to analyze gap acceptance behavior in a driving simulation approach. Road accidents are the result of a complex interaction of variables involving the driver, the vehicle, and the environment. Road accidents involve a complicated human-machine system, as shown by Aljanahi, Rhodes & Metcalfe (1999). According to Treat et al. (1979), who ascribed around 90% of accidents to driver errors, driver actions play a significant role. Although research has mostly focused on vehicle data, it is essential to include driver response elements in prediction models. We want to find out how well supervised learning models, more specifically hybrid machine learning approaches, can predict crashes by using variables from a driving simulator database that show what the driver did.
The study by Martinez et al. (2017) investigates how a driver’s actions might actively influence and alter the context and dynamics of the driving environment. Simultaneously, Xu et al. (2024) conducted comprehensive studies on the impact of drivers’ psychological and physical characteristics. Their research focused on gaining a thorough grasp of how these specific driver characteristics influence other driving-related factors. These characteristics encompass reaction times, decision-making processes, and overall driving performance, making a substantial contribution to the field of driver behavior analysis and road safety research. This field is new for the researcher, and they try to analyze driver behavior using ML. A promising area of research is to achieve a better solution for predicting the risk of road accidents based on DB and other factors associated with traffic crashes.
Recent research by Xu et al. (2024) assessed the interaction between DA and autonomous driving systems (ADS) in a virtual reality environment, simulating over 10,000 road scenarios. Wan et al. (2023) assess drivers’ physiological and psychological responses in expressway tunnels using machine learning methods to identify dangerous behaviors. Ahmad et al. (2024) analyze driver behavior in the context of wildfire evacuations, based on braking and acceleration patterns from connected car data. Mazengia et al. (2024) investigated public transport operators in Ethiopia and found that increasing awareness of road safety can decrease risky behavior. Kontaxi et al. (2023) explored the effects of mobile phone use and trip characteristics on speeding, and the authors argue that interventions are necessary to address mobile-driven driving violations. These studies collectively highlight the impact of various environmental factors on driving behavior and the effectiveness of DA systems.
Human driving parameters are an important concern in road accident research. Driver actions are a significant concern because drivers play a leading role in operating vehicles in the environment and driving scene (Li et al., 2022). When road crashes occur, the primary focus of investigation is on the database factors that directly contribute to them. Some studies focus on the relationship between driving behavior and the surrounding environment (Elamrani Abou Elassad, Mousannif & Al Moatassime, 2020a). ML is a prominent topic today; the researcher proposes many ML-based models to predict the risky driving parameter for traffic crashes and discover some driving factors that may contribute to road safety (Gálvez-Pérez, Guirao & Ortuño, 2023). However, identifying appropriate machine learning algorithms that can accurately identify driver actions with minimal error and high accuracy is not a simple task. Moreover, based on the weather conditions, driver actions, such as vehicle kinematics and driver input, play an important role in road crashes. These factors have led to the integration of various intelligent systems into mass transport systems, enabling automatic actions or directions that could potentially reduce traffic crashes.
The National Highway Traffic Safety Administration (NHTSA) provides data indicating that driver error accounts for a significant majority of road accidents, specifically 94%. They use historical data for examination, which reveals a consistent association between motor vehicle accidents and human errors. Comprehensive research has investigated the primary factors contributing to vehicular crashes, leading to this conclusion. Therefore, it is imperative to continue conducting research on driver actions (Sarsangi et al., 2023) to address these faults and enhance safety protocols, according to reports by Ayers, Whitlow & Dressler (2018). According to Cai & Lin (2011), the primary determinant of traffic safety is the driver’s behavior.
The road accident datasets usually have a lower frequency of accident occurrence compared to non-accidents. A prevailing recommendation among researchers is to maintain a ratio of four non-accident cases for every accident case (Yusoff et al., 2024; Xu & Prozzi, 2023; Gálvez-Pérez, Guirao & Ortuño, 2023). Nevertheless, this ratio sometimes gives rise to data imbalances, since models may exhibit a bias towards the more common non-accident class, producing an over prediction of that class (Elamrani Abou Elassad, Mousannif & Al Moatassime, 2020b). In real-time crash analysis, ML approaches have proven to be helpful in identifying the relationship between accident occurrences and their factors. Among the frequently used ML models are support vector machines(Govinda, Raju & Shankar, 2022; You, Wang & Guo, 2017), neural networks (Liu, Boyle & Banerjee, 2018), and Bayesian networks (Park et al., 2018). Artificial neural networks (ANNs) prove their usefulness (Abou Elassad, Mousannif & Al Moatassime, 2020) to handle noisy data and carry out quick real-time computations with resilient efficiency. According to Hussain et al. (2022), the hybrid models that use isolation forest and minimum covariance determinant for sampling worked better than other methods and traditional models. Another significant discovery from this study is that most of the hybrid models performed better than conventional models.
Traditional statistical learning-based methods, such as linear regression, Gaussian regression, and discriminant analysis, have played a fundamental role in crash prediction and road safety analysis (León & Aoyama, 2022; Ahmadi et al., 2014; Sam, Velanganni & Evangelin, 2016). Nevertheless, these methodologies frequently encounter challenges pertaining to the quality of data, necessitate a significant amount of historical data, and pose difficulties when dealing with attributes that encompass a diverse array of categories. The utilization of statistical techniques alone for crash event analysis sometimes leads to equivocal conclusions due to the presence of these obstacles. On the other hand, Tang et al. (2018) studies have shown that machine learning-based methods exhibit enhanced capacities in forecasting future occurrences, specifically within the domain of transportation systems. ML models have many advantages: they can solve complex problems on their own using data from different sources, they can update themselves with new data to perform better, and they can provide predictions and explanations by finding patterns. Significantly, crash event prediction has been effectively addressed by the utilization of notable strategies such as Adaptive Boosting (AdaBoost) (Freund & Schapire, 1997), eXtreme Gradient Boosting (XGBoost) (Ke et al., 2019), and RF (Ragab et al., 2014), which have demonstrated noteworthy outcomes.
An essential factor in the examination of road accident occurrences is effectively handling the disparity in datasets, which often consist of a smaller number of crash instances in comparison to non-crash data. To address this disparity, researchers employ resampling methods like the Synthetic Minority Oversampling Technique (SMOTE), as proposed by Chawla et al. (2002). The SMOTE method minimizes information loss and also helps in overfitting by generating artificial samples from the minority class (Fernández et al., 2008). The study by Arafa et al. (2022) addresses the notable difficulty of unbalancing datasets in machine learning. This is a common problem in which uneven class distributions result in inadequate categorization of minority classes. The suggested RN-SMOTE method merges the Synthetic Minority Over-sampling Technique (SMOTE) with Density-Based Spatial Clustering of Applications with Noise (DBSCAN) to enhance data preparation. Schlögl et al. (2019) used random under sampling (RUS), which removes examples from the majority class at random, is one of the techniques employed in random under-sampling where, until the number of examples in the majority class and the minority class are roughly equal, the process is repeated. While the RUS approach can distribute the class fairly, it may result in the loss of important information from the majority class. Random oversampling (ROS), used by Rocha et al. (2023), aims to increase the number of instances within the minority class. To achieve this, we randomly duplicate the samples from the minority class until their numbers approximate those of the dominant class. However, because the replicated samples are repetitious, this strategy may result in overfitting. There are different versions of SMOTE, such as SMOTE-Tomek Link (SMOTE-TL) (Batista, Prati & Monard, 2004), which creates synthetic samples and gets rid of overlapping data, and SMOTE-ENN (Edited Nearest Neighbor) (Xu et al., 2020), which uses both too many samples of the minority class and too few samples of the majority class. Another method, Adaptive Synthetic Sampling (ADASYN) (He et al., 2008), produces samples by considering the density distribution of the minority class. The complexity of the modeling requirements adjusts the number of synthetic samples.
Although machine learning approaches show promise in improving road safety, there are still certain limits that need to be addressed. The evaluated research frequently has limited scope, and there is a clear difference in the emphasis on analyzing and detecting driver action (DA) versus actually predicting driver action, as reviewed by Ameksa et al. (2024). Moreover, hybrid models (Ameksa et al., 2024), which have exhibited effectiveness in tackling intricate problems such as crash prediction, have garnered relatively less focus. Sangare et al. (2021) explores a method for predicting traffic accidents by fusing the advantages of the Gaussian mixture model (GMM) with the support vector classifier (SVC). He et al. (2008) suggests a transparent Deep Hybrid Network (DHN) modeling approach for extemporization crash prediction. It captures both geographical heterogeneity and temporal variability at the same time by combining the powers of convolutional neural network (CNN), deep neural network (DNN), and long short-term memory (LSTM). Future studies should consider more data sources that reflect human movement. Kashifi et al. (2022) applied a hybrid GA and ANN model to investigate the severity of fixed object crashes among older drivers in California in 2012. Their results indicated that the ANN model was more capable of predicting low-severity crashes, while the hybrid GA and ANN model was more accurate in predicting high-severity crashes. The existence of these gaps indicates important areas for future research, such as integrating a wider range of studies and concentrating on creating hybrid models to forecast driving errors. The ultimate goal is to improve the accuracy of predictions, anticipate driving errors in advance, and decrease road traffic accidents and fatalities.
To the best of our knowledge, little to no research has used a hybrid machine learning model that examined the impact of several combinations of four adopted features, namely driver actions, vehicular telemetry, tire conditions, and multiple weather conditions, for the prediction of road crashes. Furthermore, this work introduces a more balanced approach, combining DBSCAN and SMOTE TL (DBSTLink) with hybrid ML models GA and ANN. In this study, we develop and verify a system for anticipating road accidents for drivers by analyzing multiple parameters. To improve the study report’s comprehensiveness, we have included supplementary content.
The use of the hybrid machine learning method GA-ANN with a DBSTLink Balancing approach in examining driver action (DA) is a relatively new field with a small but expanding body of research. Hybrid machine-learning models amalgamate diverse algorithms or incorporate machine learning with other analytical techniques with the objective of harnessing the advantages of each constituent. Many researchers have proven that these models can provide more precise and detailed insights regarding DA by capturing intricate patterns and interactions that single-method models may overlook. Further experiments are required to determine the potential and constraints of the proposed approach. Using these kinds of models could greatly improve the accuracy and understanding of predicting driver behavior, leading to better road safety measures and interventions that use balancing data methods like under-sampling, over-sampling, and SMOTE to fix the common problem of data imbalance.
The current study employs a fusion decision system that includes several classifiers to examine merged data about driver actions, vehicle information, environmental factors, and personal details. After data pre-processing, we employ Our approach to handling imbalanced data from road crashes entails the use of SMOTE-TL and DBSCAN, named DBSTLink. Repeated cross-validation enables us to determine the optimal configuration for our model. Finally, we build crash detection models using a genetic algorithm combined with an artificial neural network called GA-ANN, considering the differences in data to ensure our predictive models are very accurate. Specifically, this study makes the following significant contributions:
An DBSCAN+SMOTE TL (DBSTlink) data balancing method designed in this work helps to balance data for effective crash prediction.
A hybrid GA-ANN classifier framework determines and analyzes the diverse parameters of a driver’s actions that are most indicative of road accident risks.
The DBSTLink’s performance with a hybrid GA-ANN classifier was compared with the existing data-balancing approach and other models used by other researchers.
The main objective of this study is to determine statistically significant predictive relationships through a sound classification methodology. However, causal interpretations are not within the scope of this current approach. The remainder of this study is organized as follows. Methodology explains the experimental design and data collection, as well as the proposed methodology. The Experimental Results & Discussion section lists the obtained results and discussion. Finally, we summarize this work and offer directions for future research.
Materials and Methods
Data collection and environmental setup
The study involved a total of 62 individuals, including 43 men and 19 women, all of whom had been driving for at least a year and held valid driver’s licenses. Table 1 defines the study we get from the participants. They were all in excellent health and had normal or corrected vision. All participants of the experiments signed an informed permission form regarding the recording of their driving action to ensure they consented to participate without knowing the study’s overall objectives or purpose. The facility at the University of Cadi Ayyad (UCA) provided a fixed-based driving simulator for the investigation. Studies on DA using a simulator have the big advantage of replicating behavior in a secure environment with complete experimental control over driving variables, such as all kinds of weather, terrain, and traffic (Elamrani Abou Elassad & Mousannif, 2019). Conducting tests in a real-world driving scenario would undoubtedly be extremely risky, as we conducted the driving simulation using the Project Cars 2 simulator by Slightly Mad Studios, a Logitech® G27 Racing Wheel set (steering wheel, accelerator pedal, and brake pedal), and a movable Logitech Evolution® Playseat. We did not need a gear shifter because the simulations used automatic gear selection.
| Description | Median (M) | Standard deviation (SD) | Additional information |
|---|---|---|---|
| Age | 1,440.25 | 142.20 | Ages range from 20 to 51 |
| Years of driving experience | 1,410.45 | 146.78 | Range: 1 to 17 years |
| Daily driving hours | 143.20 | 142.39 | Range: 1 to 6 h |
We conducted the driving scenario in daylight under five sequential weather conditions (clear, overcast, fog, rain, and snow) to explore the effects of the factors on driving action and to gather enough raw data before the crash. We intended it to simulate various complexities and aspects of real-world driving, where each participant completed five driving sessions in the simulator, the first of which was a practice run. Following that, drivers experienced the simulation once in the five weather conditions (clear, overcast, foggy, rainy, and snowy). Every participant began the simulation at the same starting place and drove the car to the destination. The driving environment encompasses representative buildings, landmarks, traffic lights, and stop signs, with all subjects instructed to adhere to traffic laws. The traffic conflict created in each of the trial scenarios when ambient road users obstruct the driver’s path and cause a conflict that could result in a collision was an observable situation in which two or more road users approached one another in space and time to the point where there was a risk of collision. This adopted road test style comprises the aspects normally utilized to study crash events (e.g., the capacity to make right turns, change lanes, use signals, etc.). It is worth noting that in crash prediction studies, crash events are generally unexpected and rarely occur. The terrain’s features and the weather affect how difficult it is to maneuver a car along a driving path, where, on a fictitious two-lane urban road measuring 19.25 km in length, each participant conducted experimental session drives, which took approximately 13 min to complete when observing the speed limits. We assigned the drivers to a quiet laboratory, where they virtually operated the vehicle.
Variable description
Data was collected on various aspects of DA and vehicle kinematics. Table 2 defines the variable description. Driver actions refer primarily to the driver’s behavior and choices. The dependent variable is the crash event, coded as binary variable with a value of 1 if a crash was identified and 0 if not. Apart from the categorical features like weather conditions, all variables are with continuous variables. The “Driver Inputs” area contains variables like throttle, brake, steering, and RPM. ere the inputs directly represent the driver’s decisions and actions while operating the car. The movements and actions of a vehicle result from the vehicle kinematics, which are a combination of factors such as driving action, vehicle design, and environmental conditions. The driver influences the variables Speed, Lateral_g, Longitudinal_g, and the physical motion and dynamics of the vehicle, but not exclusively. Tire temperatures and weather conditions influence the driver’s inputs, but the driver does not directly control them.
| Category | Variable | Description |
|---|---|---|
| Vehicle kinematics | Speed | The magnitude of the vehicle’s velocity. |
| Lateral_g | Lateral (sideways) acceleration of the vehicle. | |
| Longitudinal_g | Acceleration of the vehicle along the direction of travel. | |
| Vertical_g | Vertical acceleration of the vehicle (upward or downward). | |
| Yaw_angle | Angle between the vehicle’s longitudinal axis and its line of travel. | |
| Drift_angle | Angle during a turn between the car’s orientation and its velocity direction. | |
| Spin_angle | Angle between the direction in which a wheel is pointing and the direction it is actually traveling. | |
| Driver inputs | Throttle | Accelerator pedal position. |
| Brake | Brake pedal position. | |
| Steering | Steering wheel angle. | |
| RPM | Revolutions per minute; number of rotations of the vehicle’s engine crankshaft. | |
| Tire conditions | Tyre_temp_FL | Temperature of the front left tire. |
| Tyre_temp_FR | Temperature of the front right tire. | |
| Tyre_temp_RL | Temperature of the rear left tire. | |
| Tyre_temp_RR | Temperature of the rear right tire. | |
| Weather conditions | Weather | General weather conditions affecting driving (e.g., clear, fog, rain, snow). |
| Crash state | State | Crash or no crash |
The other variables are either the consequences of driving behavior or external factors that have an influence. The major goal of this study is to design a hybrid machine learning model that can predict crash occurrences by taking into account the most important features of driving action and applying the designed hybrid machine learning methods. A binary classification model called “crash prediction” attempts to predict whether or not a driving behavior will be involved in an accident and compare it with non-ML techniques.
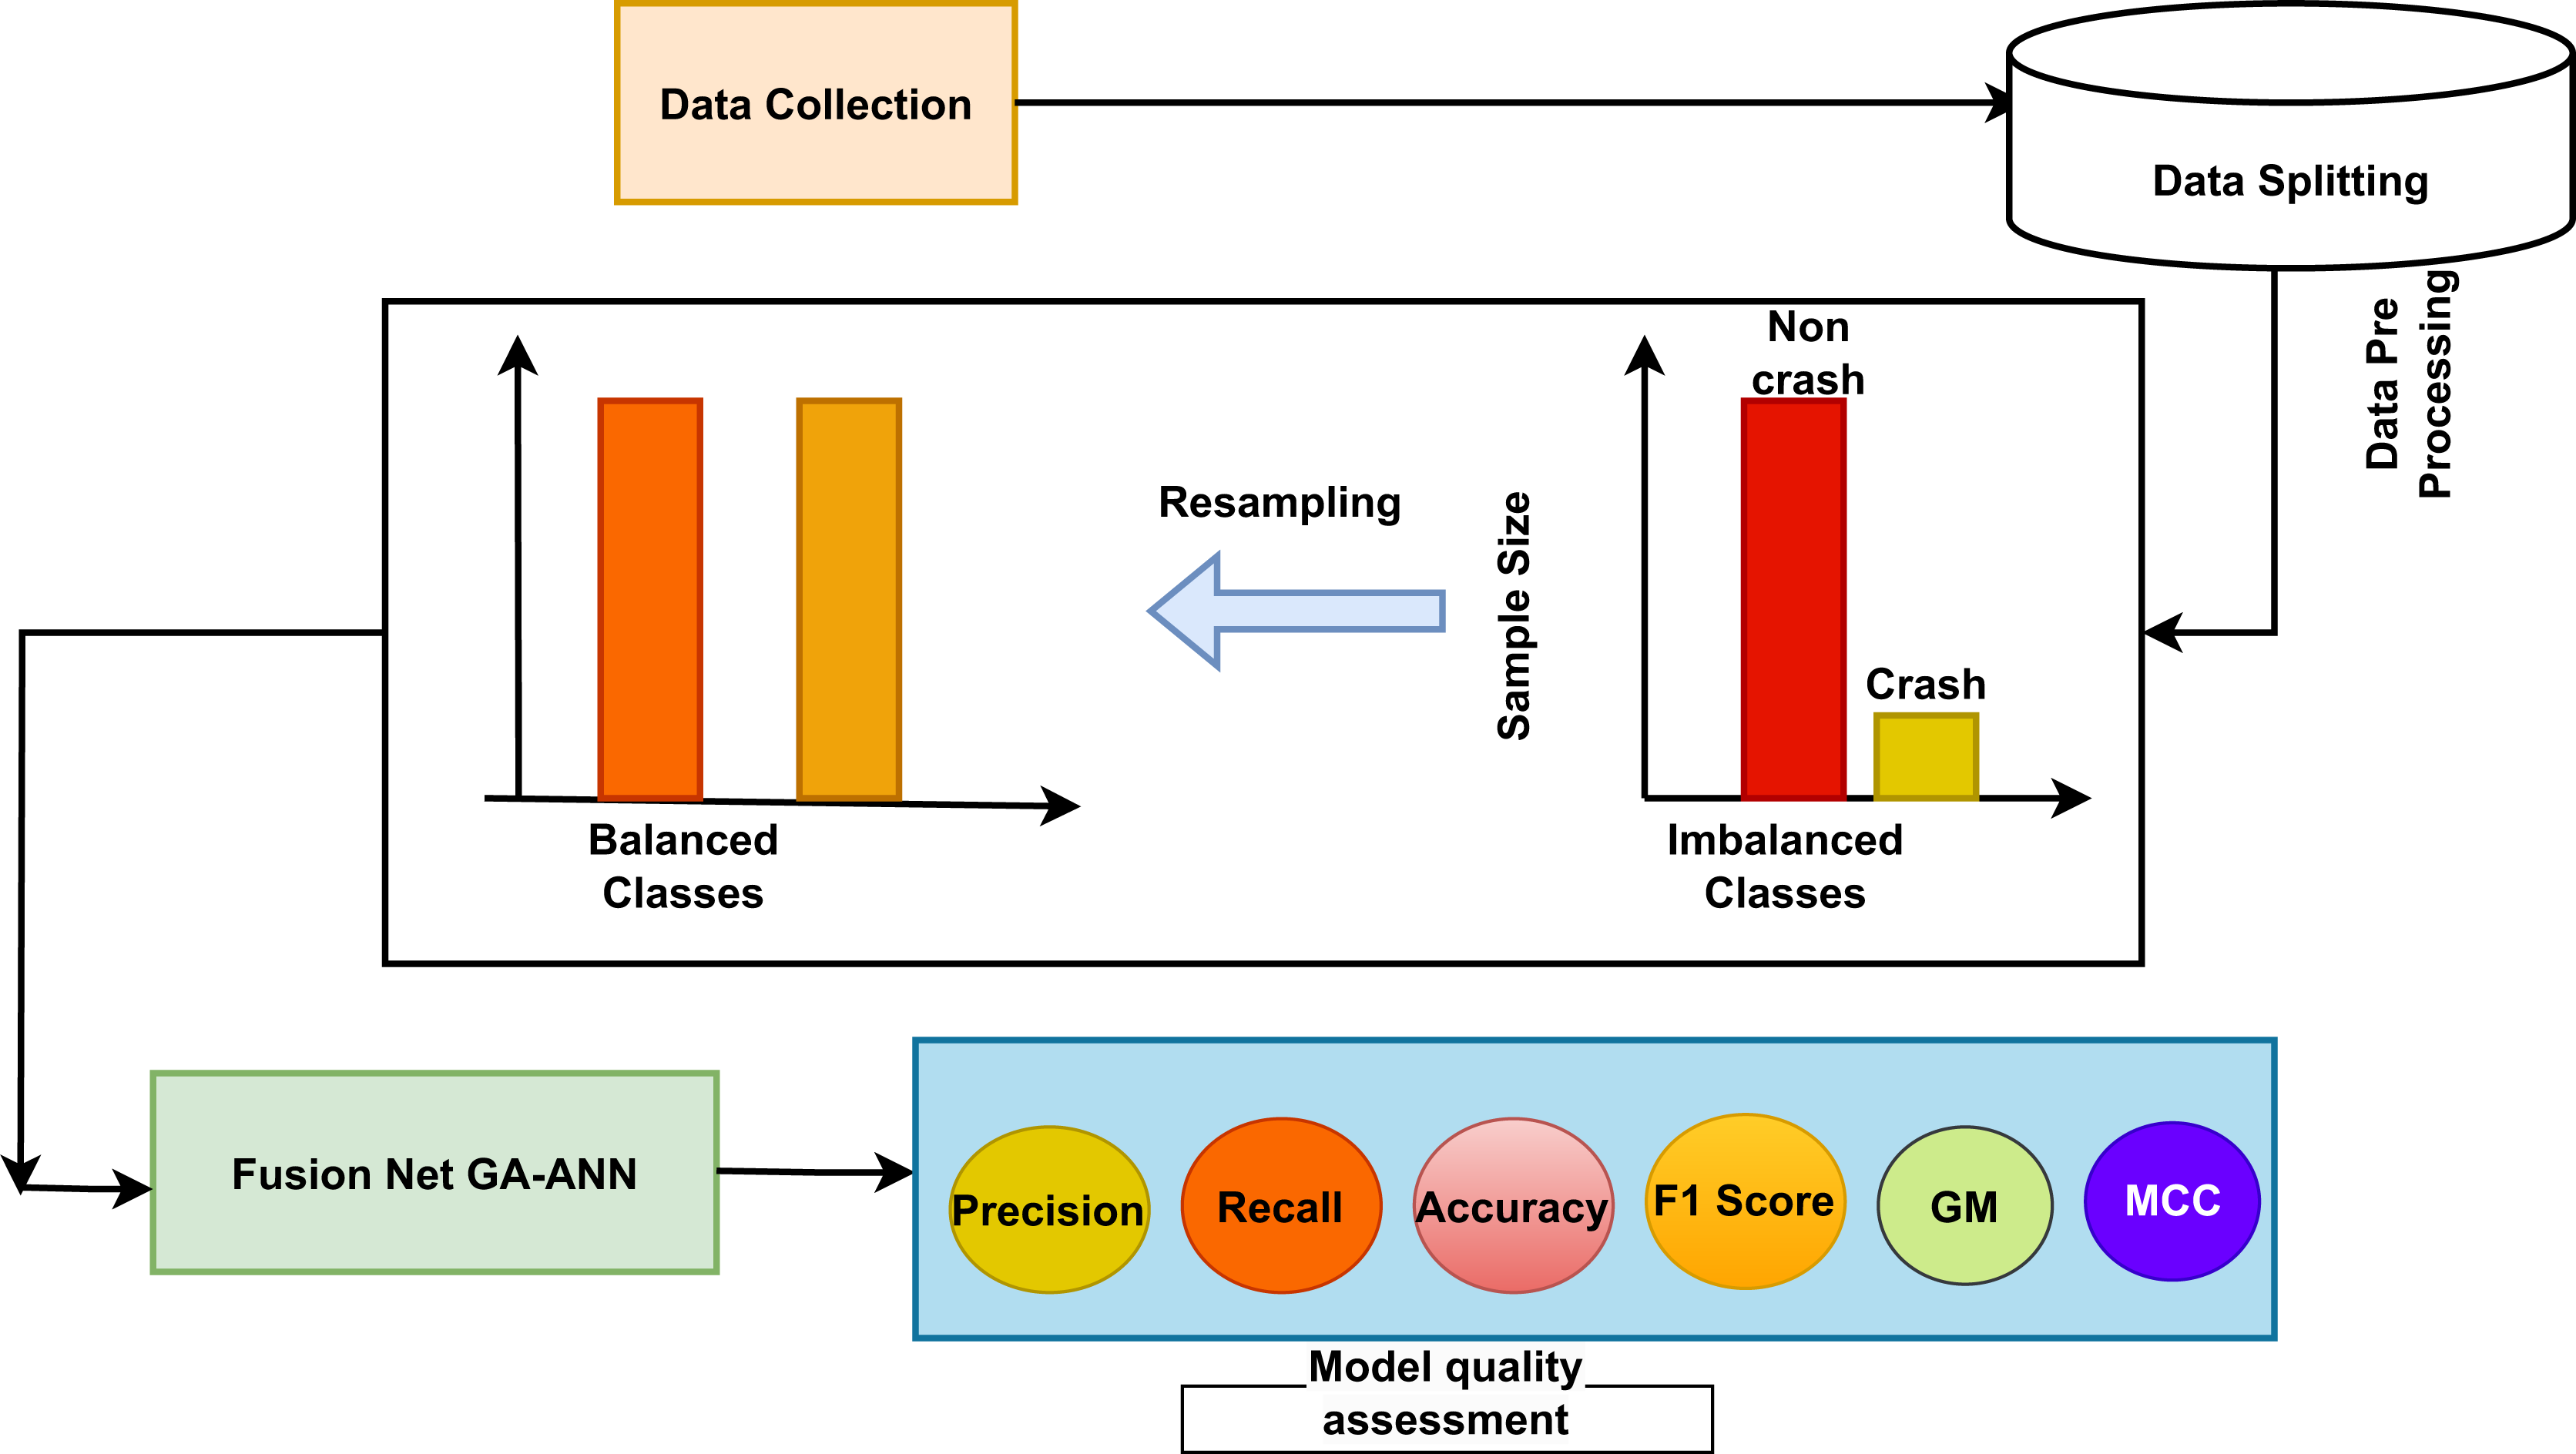
The main objective of this study is to develop a hybrid machine learning model that incorporates several facets of driving action. By evaluating these behaviors, the model seeks to identify specific activities or patterns that have a significant impact on car crashes. Figure 1 describes the proposed work’s overall process. It depicts a thorough machine learning workflow for accident prediction, commencing with data collection and concluding with model quality evaluation. At first, data is gathered, and then the data is splitted, then apply a balancing approach which helps to balance the data, where the number of ‘crash’ cases is considerably lower than that of ‘non-crash’ examples. Resampling techniques are employed to equalize the representation of crash and non-crash samples in the dataset, hence achieving balance in the classes. The balance data is subsequently employed to train a hybrid machine learning model, which exploits the collective advantages of many techniques to forecast collisions. The evaluation of the proposed system is conducted with a comprehensive set of measures such as precision, recall, accuracy, MCC, G-mean, and F1-scores. This procedure describes a methodical strategy that can be used for improving road safety. This approach emphasizes the significance of well-rounded datasets and thorough review in creating successful prediction models.
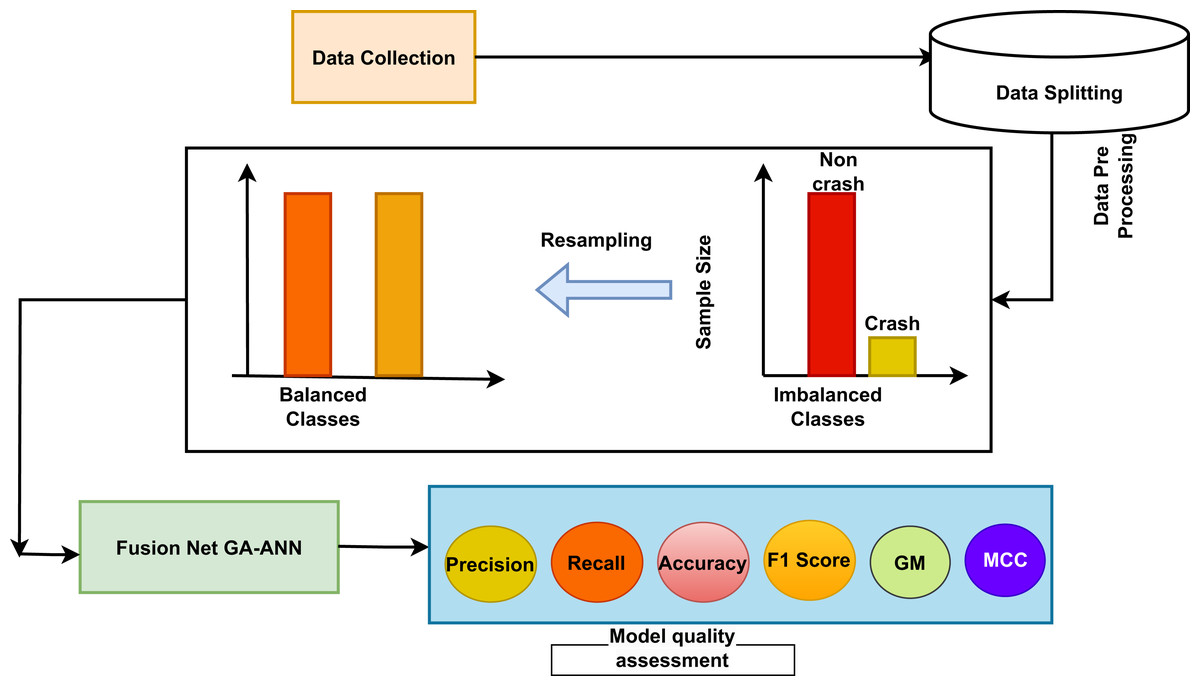
Figure 1: Overview of the proposed model.
Data pre-processing
The study dataset contains weather season categorization. Most machine learning algorithms perform better with numerical features rather than categorical ones. Thus, categorical features should be quantified. The data gets encoded using one-hot encoding for categorical variables. The one-hot encoding process creates new binary features for each member of category variables. The weather categorical feature gets split into four new features through this process, which include weather_clear, weather_fog, weather_rain, and weather_snow.
The essential process of dataset pre-processing requires imputation of missing values. This study uses hot-deck imputation. The most basic yet commonly applied research imputation techniques include mean and hot-deck methods, according to Jerez et al. (2010). The methods replace missing data with plausible estimates before performing complete-data analysis on the filled dataset. The simplest imputation approach, known as mean imputation, replaces missing values with mean values of the variables (Allison, 2003). Mean imputation remains widely used in social sciences because of its straightforward nature. Hot-deck imputation has successfully replaced missing values in various datasets, according to Jerez et al. (2010). Hot-deck imputation replaces missing receptor instance values with data from comparable observation cases that have complete data, but other alternatives exist. This research adopts hot-deck imputation because it makes unbiased predictions for missing values.
Data resampling with balancing approach
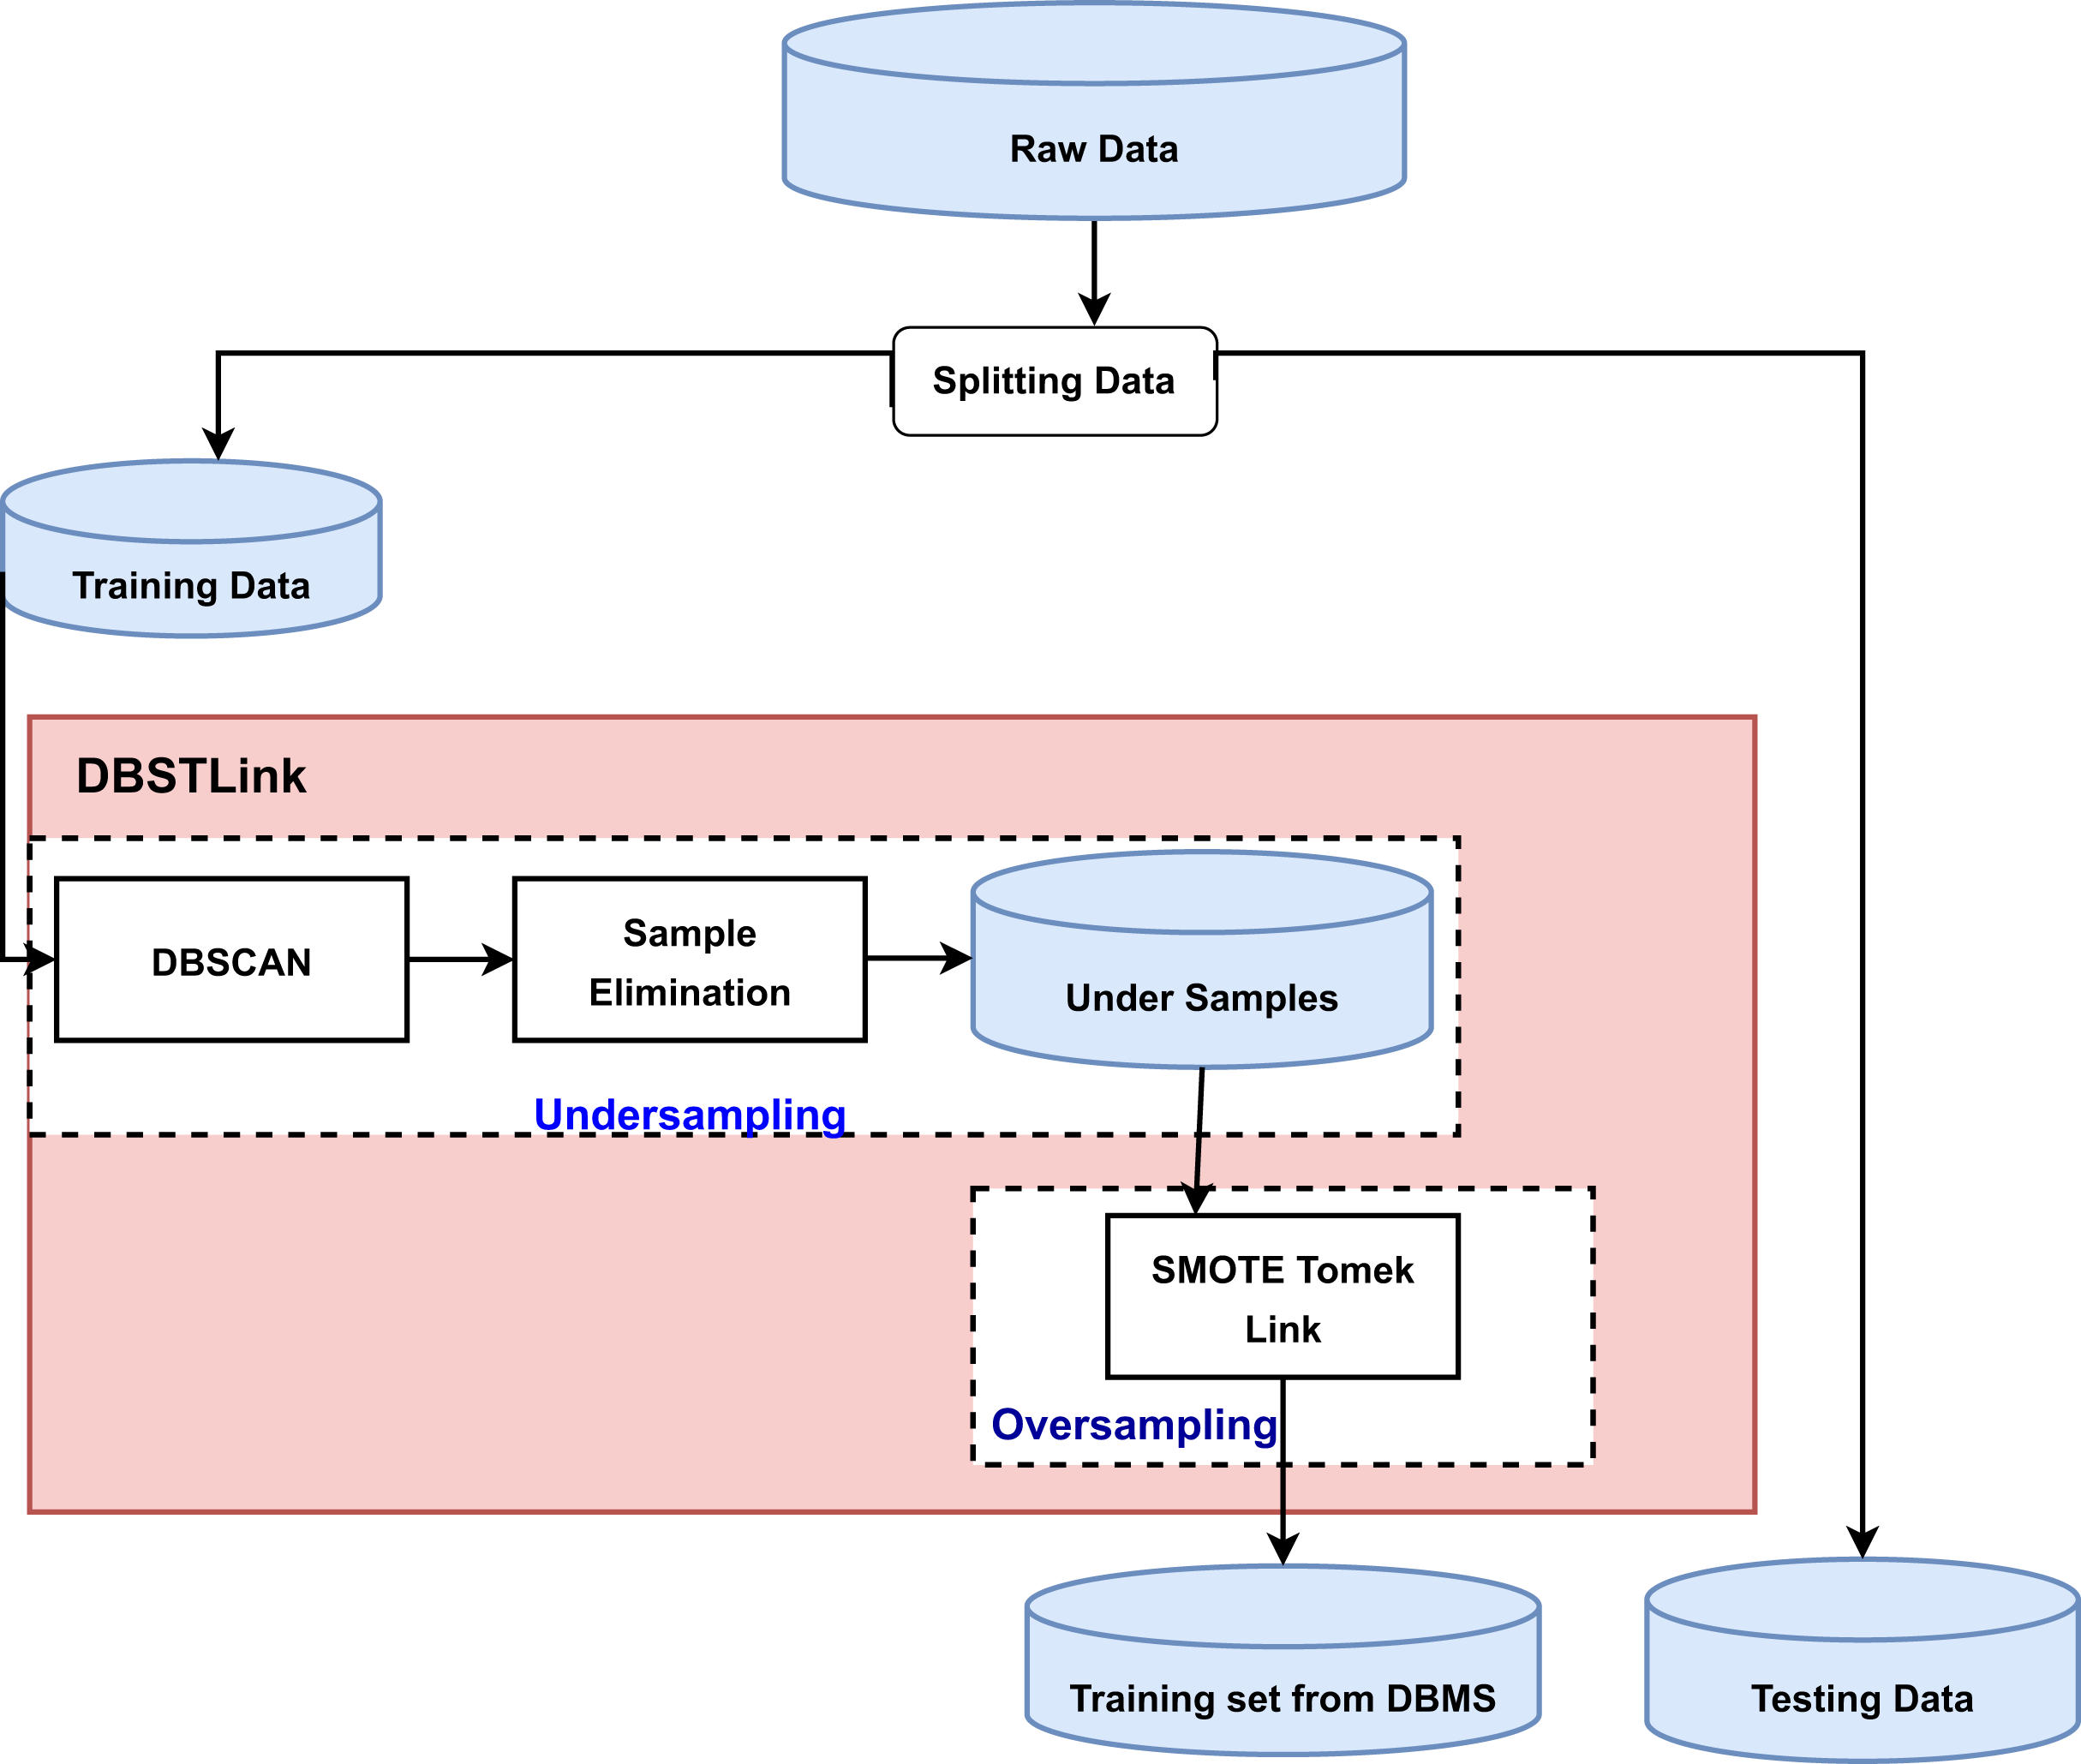
For experiments, the generally accepted 80:20 ratio is that the training dataset receives about 80% of the dataset (Ahmed et al., 2023) and the other 20% is used for testing. Within the context, approximately 75,900 samples were recorded during simulations where the ratio of crash observations is about 3%, indicating that the data are extremely imbalanced, which has been found in similar studies related to crash prediction (Rocha et al., 2023; Jerez et al., 2010) through the adoption of the endorsed data balancing strategies. A novel balancing approach is designed in this work to resolve this issue by balancing class distribution in the data set. In this work, the DBSCAN technique along with SMOTE-Tomek Link, named DBSTLink, is proposed. Figure 2 depicts the DBSTLink algorithm’s flowchart. The two steps of the DBSTlink process are undersampling and oversampling. We used DBSCAN to extract clusters from the entire training set, successfully completing the undersampling portion. Then, each cluster had 50% of its negative instances removed. The undersampling technique reduces the number of negative examples by removing some of them from the dataset. SMOTE TL was used to add artificial instances of the positive class to the training set for the oversampling component. SMOTE-TL integrates the SMOTE capability to produce synthetic data for the minority class and the Tomek algorithm. Linking (two modifications of CNN 1976) enables the removal of data that are accurately classified as Tomek linkages from the dominant class. The Tomek linkages constitute data samples from the majority class that exhibit the closest proximity to the data from the minority class.
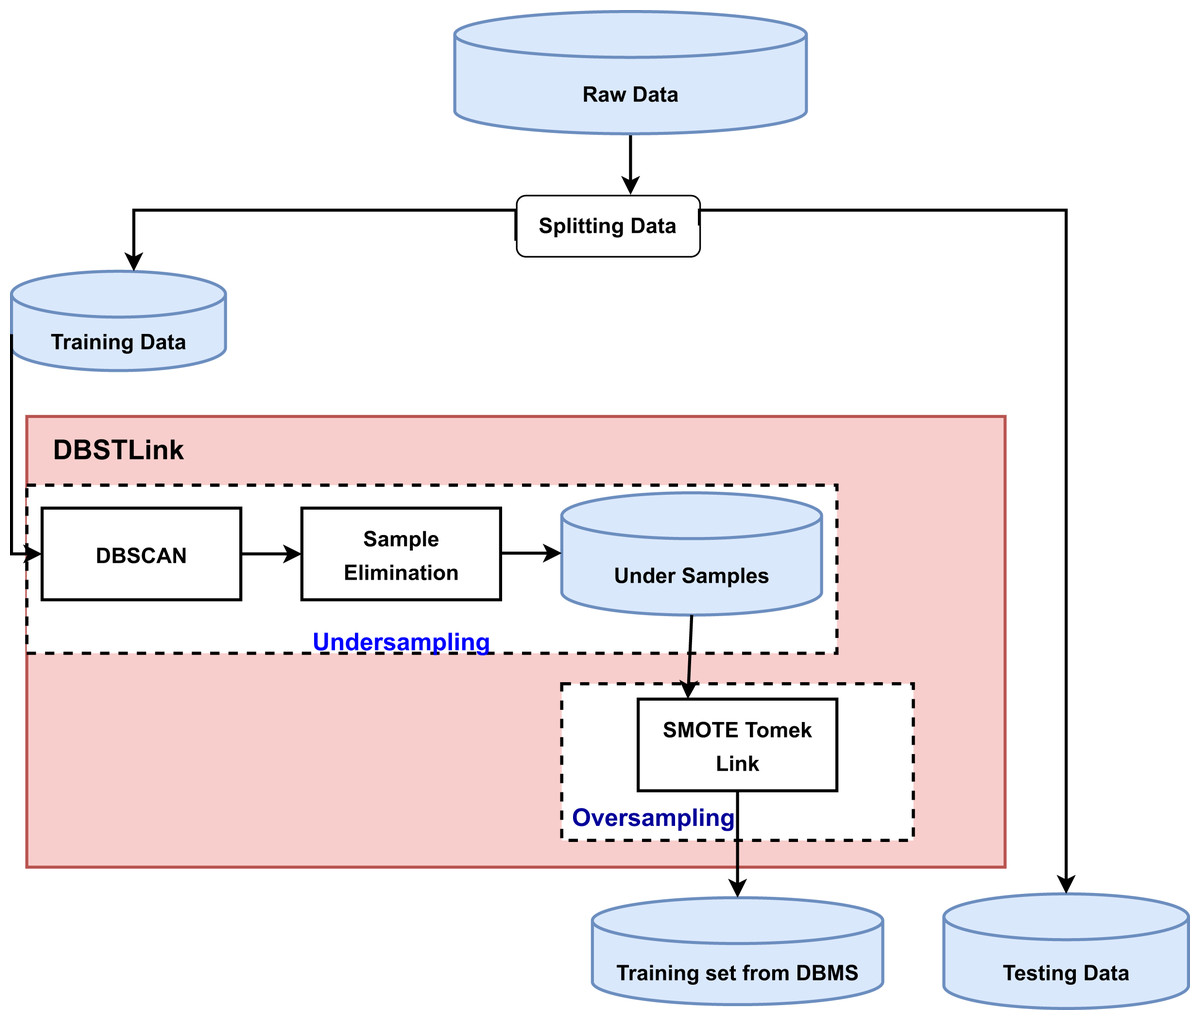
Figure 2: Balancing training data using DBSTLink.
The algorithm employs a combination of of DBSCAN and SMOTE Tomek Links to successfully balance a dataset called D, which includes features X and labels y. Initially, DBSCAN operates by determining core points within D based on a specified radius and a minimum required number of neighbors. Min_samples points that meet these criteria are accumulated into Dclean, a subset of D containing only core points, thereby reducing noise and outliers. Following noise reduction, the algorithm applies the SMOTE to address class imbalance. For each important point Xi in Dclean, SMOTE creates new samples by blending Xi with its K-nearest neighbors that belong to the same class. The number of synthetic samples to generate for each Xi is determined by a predefined sampling strategy. We implement Tomek Links to further refine the class boundaries. This step entails identifying pairs of nearest neighbors (Xi, Xj) who are from opposite classes, one of which is synthetic. Once we identify these pairs, also known as Tomek Pairs, we remove the synthetic sample Xj from Dclean. This process enhances the separation between classes, leading to a more defined decision boundary in the resulting balancing dataset D′. By using DBSCAN to get rid of initial noise, SMOTE to fix class imbalance, and Tomek Links to fine-tune class boundaries, the algorithm makes sure that the data is well-prepared for future predictive modeling tasks. This could make the models trained on this balancing dataset more accurate and useful.
Model development
The proposed FusionNet GA-ANN approach has three steps:
The balancing dataset was incorporated into the genetic algorithm (GA) as the initial population. The process of evolution was repeated until a predetermined termination condition was met. The main goal of this research was to determine the key characteristics that have the greatest impact on the probability of crash incidents in driving action.
After selecting features from GA need to use ANN, where dropout will be used to prevent over-fitting.
The effectiveness of the GA-ANN hybrid classifier will be performed using metrics like accuracy, precision, recall, g-mean, and F1-score compared to other classification models.
The GA-ANN hybrid classifier combines the adaptive learning skills of GA with the computing capacity of ANNs to form a strong classification tool. The GA adjusts the feature selection and network parameters, which then serve as inputs for the ANN.
The training procedure starts by utilizing a deep ANN structure on selected features of GA-ANN. In order to mitigate overfitting, dropout layers are selectively incorporated into the ANN to improve its capacity during the training session. A notable procedural transformation takes place once the ANN becomes proficient in identifying fundamental patterns and subtle intricacies in the data. The GA refines and optimizes the extracted characteristics, which are subsequently processed through the ANN for the final classification.
This intentional integration not only avoids the typical problem of early convergence in ANNs but also takes advantage of the global search power of GAs, thereby improving the overall accuracy and efficiency of the model. Algorithm 1 shows the pseudo code of the proposed DBSTlink approach with the hybrid GA-ANN classifier. It guarantees that the proposed model enhances the accuracy of the classification task and, in diverse datasets, may result in optimal categorization.
| Input: |
| • D: Dataset with features X and labels y |
| • : DBSCAN radius |
| • min_samples: DBSCAN minimum samples |
| • sampling_strategy: SMOTE sampling strategy |
| • K: Number of neighbors for SMOTE |
| • Parameters for GA, ANN architecture |
| Output: |
| • Trained ANN model |
| Step 1: Balanced Dataset Preparation |
| 1.1 Initialize: D_clean ← ∅, D′ ← ∅ |
| 1.2 Apply DBSCAN for noise reduction |
| 1.3 For each point X_i in D do |
| 1. 1.3.1 Neighbors ← DBSCAN_NearestNeighbors(X_i, D, , min_samples) |
| 2. 1.3.2 If X_i is a core point then |
| • Add X_i to D_clean |
| End if |
| End for |
| Step 2: Apply SMOTE for Oversampling |
| 2.1 For i = 1 to len(D_clean) do |
| 3. 2.1.1 n ← KNearestNeighbors(X_i, D_clean, K) |
| 4. 2.1.2 p ← sampling_strategy ÷ 100 |
| 5. 2.1.3 While p ≠ 0 do |
| • a. Neighbor ← randomly select from n |
| • b. X_smote ← X_i + rand(0, 1) × (Neighbor − X_i) |
| • c. Add X_smote to D_clean |
| • d. p ← p − 1 |
| End while |
| End for |
| Step 3: Remove Tomek Links for Class Boundary Refinement |
| 3.1 D′ ← D_clean\TomekLinks(D_clean) |
| Step 4: Feature Selection using Genetic Algorithm |
| 4.1 F_selected ← ApplyGA(D′, GA parameters) |
| Step 5: Train Artificial Neural Network |
| 5.1 ANN ← InitializeANN(ANN architecture) |
| 5.2 Train ANN on D′ using F_selected |
| Return: Trained ANN model |
Figure 3 illustrates the systematic procedure for analyzing crash data using a hybrid machine learning model that integrates the capabilities of ANN and GA.
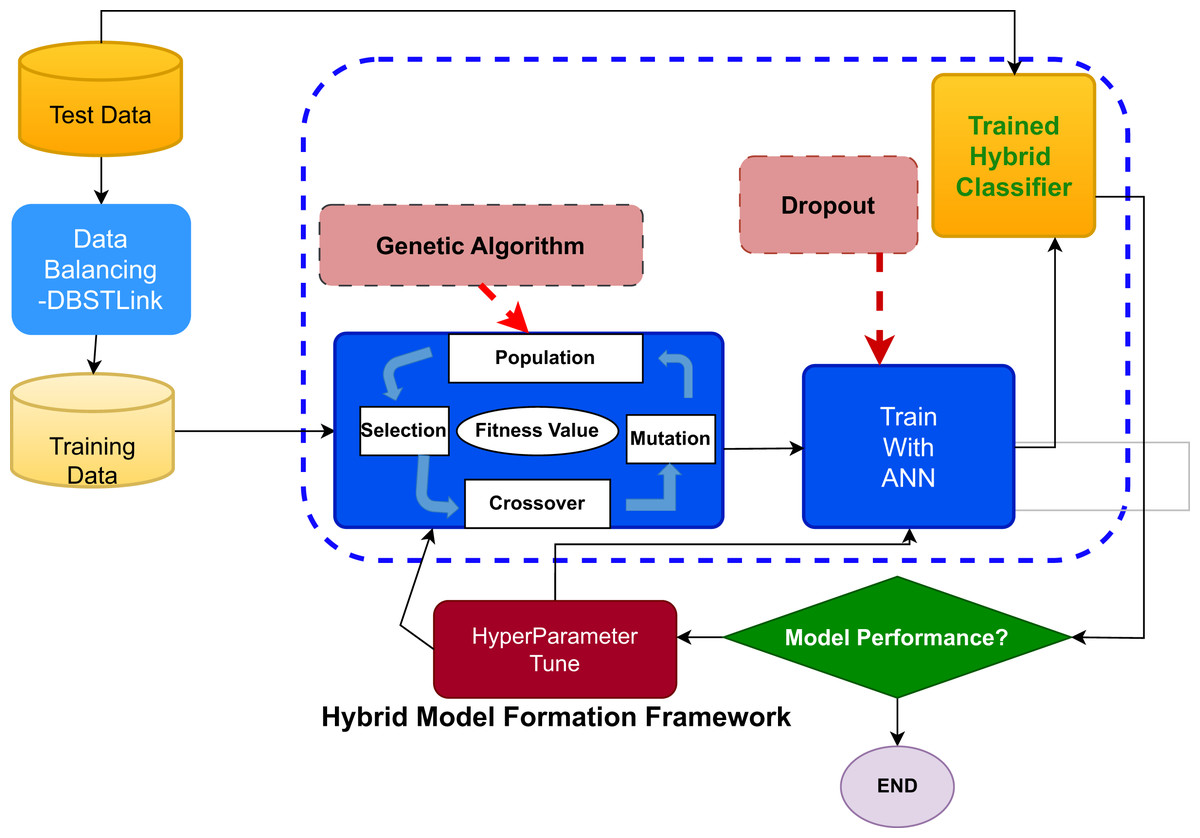
Figure 3: The systematic procedure for analyzing crash data using a hybrid machine learning model that integrates the capabilities of artificial neural networks (ANN) and genetic algorithms (GA).
Genetic algorithm
Goldberg & Holland (1988) introduces the GA, a well-known meta-heuristic technique that mimics biological evolution to explore global optimum solutions in complex optimization challenges. GA evaluates a population of solutions, referred to as chromosomes, through a fitness function. There must be a solution that can fulfill the specified purpose; if not, it produces a new population by genetic processes such as mutation, crossover, and selection. The process continues until it reaches the optimal solution, after which it implements it across diverse machine learning methodologies. Table 3 shows the best GA parameters.
| Genetic algorithm parameter | Value |
|---|---|
| Selection | Roulette wheel |
| Crossover | Uniform |
| Number of generations | 500 |
| Population size | 50 |
| Crossover rate | 0.8 |
| Mutation rate | 0.01 |
| Elite count | 2 |
Artificial neural network
Artificial neural networks, or ANNs (Amiri et al., 2020), are efficient and useful for predicting the relationship between dependent and independent parameters. The neurons in each layer are connected to neurons in the layers above and below them, and these connections act like a gap that sends information from one neuron to the next, multiplying it by a specific “weight” that shows how strong that information is for deciding the output. During training, a neural network routinely calibrates all of its network weights using forward and backward propagation. The forward propagation method initially computes the output using a set of randomly chosen weights. The backward propagation then modifies the weights in accordance with the error between the model’s output and the intended output to reduce the error. It ends when it reaches a predetermined maximum iteration number or meets other ending requirements. An ANN model’s underlying structure, connection weights, activation function, and bias value determine its outputs, which are as follows:
(1) where x is the input vector, b is the bias value, w is the weight value, and f is the activation function. Table 4 shows the best ANN parameters.
| Parameter | Values |
|---|---|
| Number of layers | 3 (1 input, 1 hidden, 1 output) |
| Neurons per layer | Input: 64, Hidden: 32, Output: 1 |
| Activation functions | ReLU (for hidden), Sigmoid (output) |
| Input dimension | X_train_scaled.shape (WHO, 2023) |
| Output activation | Sigmoid (binary classification) |
| ptimizer | Adam |
| Loss function | Binary Crossentropy |
| Batch size | 10 |
| Number of epochs | 50 |
Hybrid GA-ANN classifier
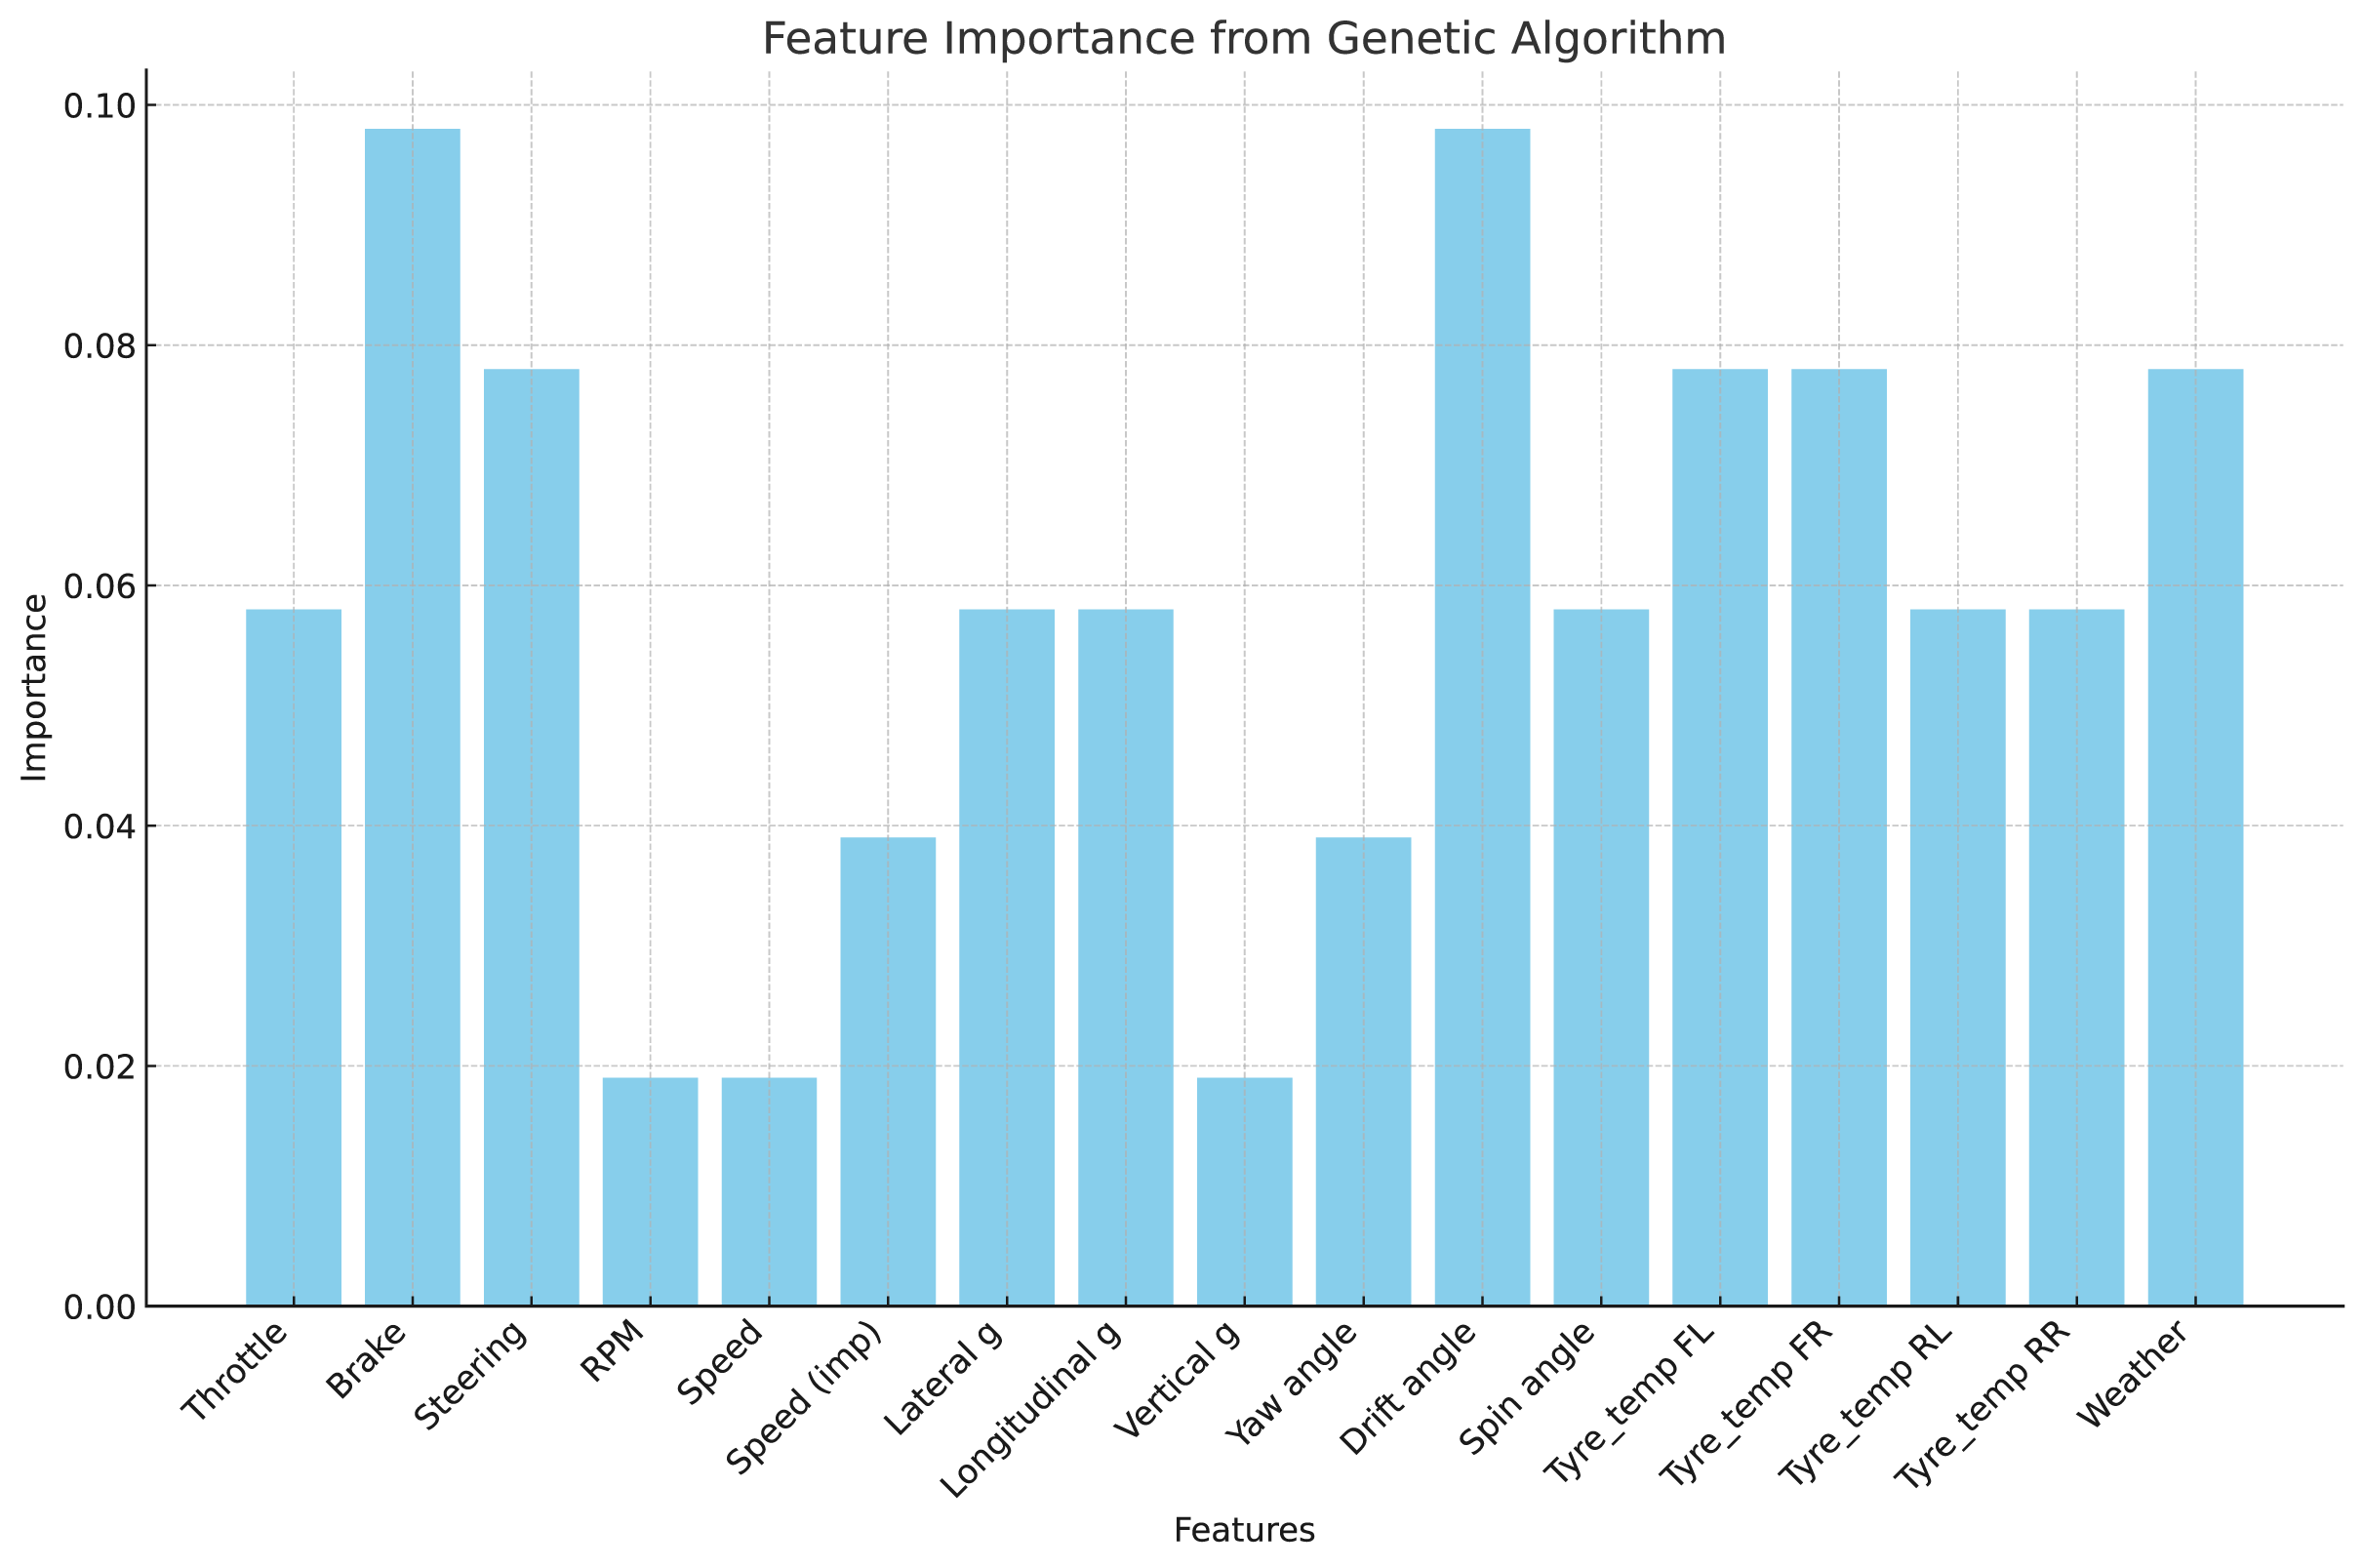
The proposed methodology uses a GA to determine the most important features for crash investigation. The GA represents each feature set as a chromosome and evaluates its usefulness through a fitness function that specifically measures its prediction ability in crash scenarios.
The genetic algorithm selects the features which are displayed in Fig. 4. The most effective traits that the GA identifies are used as input for an ANN to perform additional assessment. The method leverages the benefits of each algorithm to produce more accurate and reliable analysis results.
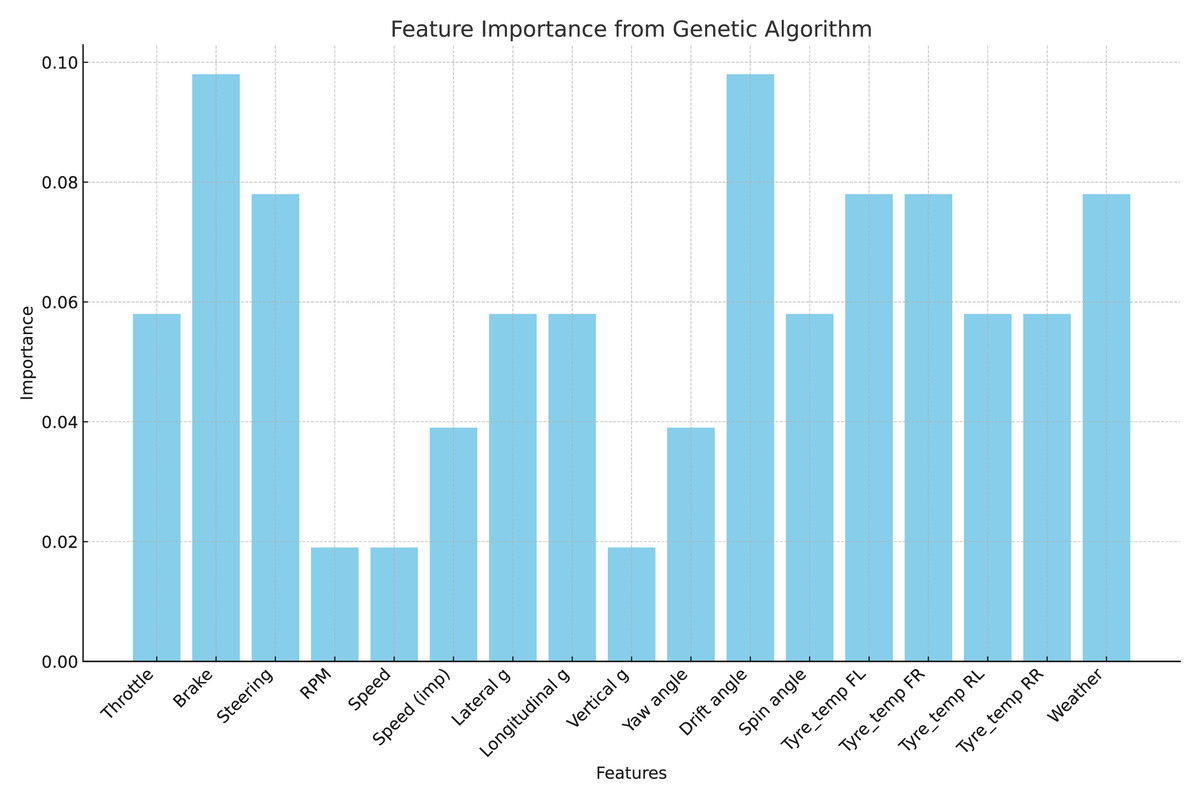
Figure 4: Selected features after GA implementation.
Model quality assessment
The balance of the data is assessed using a metric called the imbalance ratio (IR), which is calculated by dividing the number of instances in the majority class (no-crash instances) by the number of instances in the minority class (crash instances). A dataset is generally considered balanced if the imbalance ratio is less than 1.5, researched by Elamrani Abou Elassad & Mousannif (2019), Kia, Haratizadeh & Shouraki (2020) and Kitali et al. (2019), Xu et al. (2012).
The obtained IR for the adopted dataset is about 11.75; that is, the choice behind the selection of the model evaluation metrics needs to consider the imbalance issue. In this context, we evaluate the quality of the classification models using various frequently used performance measures. The evaluation of model performance in machine learning classification tasks is mostly based on parameters obtained from the confusion matrix, which is presented in Table 5. Whereas the true positive (TP) represents the number of crash samples correctly classified, the false positive (FP) represents the number of no-crash samples incorrectly classified as crash instances. False negative (FN) indicates the number of crash samples incorrectly classified as no-crash instances, and true negative (TN) indicates the number of no-crash samples correctly classified. According to Powers (2010), these factors are essential for calculating other important performance measures such as precision, recall, and the F1-score. Precision measures how many of the predicted positive cases were actually correct, while recall checks how well the model finds all the true positive cases. The F1-score, which is calculated as the harmonic mean of precision and recall, is very valuable when dealing with imbalanced class distributions.
| Actual | Predicted | |
|---|---|---|
| Crash | No-crash | |
| Crash | True Positive (TP) | False Positive (FP) |
| No-crash | False Negative (FN) | True Negative (TN) |
Recall measures the proportion of correctly classified positives. It is a particularly important parameter for classifier performance in this case because the main objective is to correctly forecast the infrequent events of machine learning. The primary goal is to accurately predict the driving action. Precision is a measure of accuracy, representing the ratio of correctly predicted elements to all predicted events.
(2)
(3)
Accuracy describes the proportion of accurate predictions provided by the model overall. The percentage of successfully categorized positives, or correctly classified crash events, is known as recall.
(4)
The F1-score is a highly informative measure as it considers both precision and recall measures, thus taking the class-balance issue into account. The geometric mean (GM) score, described by Helal, Haydar & Mostafa (2016), is an important metric for imbalance classifications. The balancing assessment of a model’s ability to accurately recognize both classes is based on multiplying sensitivity (the true positive rate) and specificity (the true negative rate). The authors of Wang et al. (2021) stress the usefulness of the G-Mean score in assessing a model’s ability to handle both minor and major classes. The Matthews correlation coefficient (MCC) is an effective statistic for assessing the concordance between observed and predicted binary classifications. It is extensively utilize it for imbalance scenarios, where a value range of −1 to 1 indicates an outcome of flawless forecasting.
(5)
(6)
(7)
The research includes the 95% confidence interval (CI) (Elvik, 2013) as a vital statistical measure to assess model reliability and consistency in addition to conventional accuracy metrics. Confidence intervals help determine the possible range of model performance estimates because they are crucial for predictive modeling applications that need to generalize results. The data were split into training and validation sets for model development and assessment. The research applied 10-fold cross-validation to determine the classification efficiency of each classifier and to get a better approximation of crash prediction. It is noted for having a low tendency to be biased and having varying results compared to the other 16 validation methods studied, including the leave-one-out method (Kohavi, 1995). Furthermore, k-fold cross-validation is credited with reducing the overfitting issue in performance estimation (Nafiah et al., 2019; Theofilatos, Chen & Antoniou, 2019). The data was divided into nine subsets of the input space, and one subset was used to test the effectiveness of the predictive models. The training was carried out 10 times, not using one subset that was used in the training data set in an earlier session. The mean performance measurements are computed from the metrics collected during the 10-fold cross-validation. This minimizes the effects of data dependence and increases the reliability of the resulting evaluation.
In addition to the statistical significance test, we use binary logistic regression models (Elamrani Abou Elassad et al., 2024; Yang et al., 2022) to pinpoint the key factors that influence crash frequencies. But they have a flaw: they assume all observations are the same and ignore unobserved factors that may affect the responses. We employ stochastic regression models with random parameters to accomplish this.
This study evaluates five existing machine learning techniques against a proposed hybrid ML approach to improve the accuracy of predicting accidents that could result in fatalities. Here is a list of the techniques used in this study:
“Random Forest” (RF) is an ensemble learning algorithm that uses many decision trees to make its predictions. It uses bagging and random feature selection to improve the model’s accuracy and avoid overfitting (Mafi, Abdelrazig & Doczy, 2018; Ragab et al., 2014; Yan & Shen, 2022). After the RF model’s training is complete, each decision tree casts a vote for a class based on the new observation. The final prediction is based on the class that received the most votes (Rahman et al., 2022). XGBoost is a version of gradient boosting that builds many weak learners one after the other, and each new learner corrects the mistakes of its predecessor. It uses a more regularized model to avoid overfitting, and it has become popular for its higher accuracy in prediction and faster computation time (Parsa et al., 2020; Ke et al., 2019). Logistic regression (LR) (Kitali et al., 2019) is a linear classifier that is used for binary classification problems. It defines the relationship between the independent variables and the probability of the dependent variables. It can predict the presence or absence of an event using specific criteria or thresholds. This study categorizes severity as a binary variable (severe and non-severe). In the logistic model, the log-odds of the probability that an event occurs (i.e., ‘true’) is modeled as a linear combination of the features, allowing the classifier to estimate probabilities for input data. The SVM is a robust supervised machine learning algorithm designed for classification and regression problems. It works by finding an optimal hyperplane that can separate the data into different classes and, at the same time, maximize the margin between them to increase generalization to new data. Kernel functions can also extend SVM to non-linear data (Osman et al., 2019).
Results
Dealing with an imbalanced dataset, accuracy may suffer from the bias of the majority class. To address the imbalanced dataset, G-mean, MCC, and F1-score metrics are used. Table 6 presents the performance metrics of classifiers without any resampling techniques, highlighting the impact of class imbalance on model performance and the results of the proposed DBSTLink. Table 7 compares balancing approaches with other models. A comparison of the results depicted in Tables 6 and 7 demonstrates the major contribution of adopting DBSTLink as a resampling strategy to performance improvements in crash prediction.
| Model | Precision (%) | Recall (%) | F1-score (%) |
|---|---|---|---|
| XGBoost | 84.36 | 56.55 | 67.71 |
| RF | 71.12 | 61.09 | 65.72 |
| SVM | 91.00 | 61.96 | 67.35 |
| LR | 69.43 | 50.27 | 48.54 |
| BL | 58.70 | 57.35 | 57.93 |
| GA-ANN | 86.47 | 64.55 | 69.98 |
| Model | Balanced approach | F1-score | MCC | GM |
|---|---|---|---|---|
| XGBoost | SMOTE | 0.93 | 0.86 | 0.97 |
| SMOTE TL | 0.93 | 0.88 | 0.97 | |
| DBSM | 0.80 | 0.62 | 0.72 | |
| DBSTLink | 0.79 | 0.61 | 0.72 | |
| RF | SMOTE | 0.93 | 0.94 | 0.93 |
| SMOTE TL | 0.91 | 0.90 | 0.91 | |
| DBSM | 0.76 | 0.59 | 0.63 | |
| DBSTLink | 0.94 | 0.94 | 0.94 | |
| SVM | SMOTE | 0.69 | 0.47 | 0.85 |
| SMOTE TL | 0.69 | 0.47 | 0.85 | |
| DBSM | 0.64 | 0.31 | 0.69 | |
| DBSTLink | 0.87 | 0.60 | 0.86 | |
| GA-ANN | SMOTE | 0.96 | 0.92 | 0.96 |
| SMOTE TL | 0.90 | 0.80 | 0.90 | |
| DBSM | 0.96 | 0.92 | 0.96 | |
| DBSTLink | 0.98 | 0.96 | 0.98 |
DBSTLink emerges as the superior balancing technique across the four models—XGBoost, RF, SVM, and GA-ANN—when considering key performance metrics like F1-score, MCC, and G-mean. Starting with XGBoost, DBSTLink performs almost on par with SMOTE and SMOTE TL in terms of F1-score, achieving 0.79 compared to 0.93 for both SMOTE and SMOTE TL. However, the marginal drop in F1-score is compensated by the technique’s stability across the other metrics. Its G-mean of 0.72 is comparable to DBSM’s, which also scored 0.72, demonstrating that DBSTLink handles class imbalances in a way that preserves the harmonic balance between precision and recall, which is vital in imbalancing datasets.
For the RF model, DBSTLink provides excellent scores across all metrics. The F1-score and G-mean for DBSTLink are both 0.94, which is higher than SMOTE (0.93) and SMOTE TL (0.91). MCC, which measures the correlation between the true and predicted classifications, also shows 0.94, tying with SMOTE and surpassing SMOTE TL (0.90) and DBSM (0.59). The result indicates that DBSTLink gives an optimal balance solution between over- and under-sampling. It provides a consistent and reliable model performance. For the SVM model, DBSTLink dramatically improves over the other techniques, achieving a significantly higher F1-score of 0.87, compared to 0.69 for SMOTE and SMOTE TL, and 0.64 for DBSM. Similarly, the MCC result is 0.60, which is considerably better than SMOTE and SMOTE TL (both at 0.47) and DBSM (0.31). G-mean is also higher at 0.86 compared to 0.85 for SMOTE and SMOTE TL. This performance indicates that DBSTLink handles imbalanced classes far more effectively in SVM compared to other balancing methods.
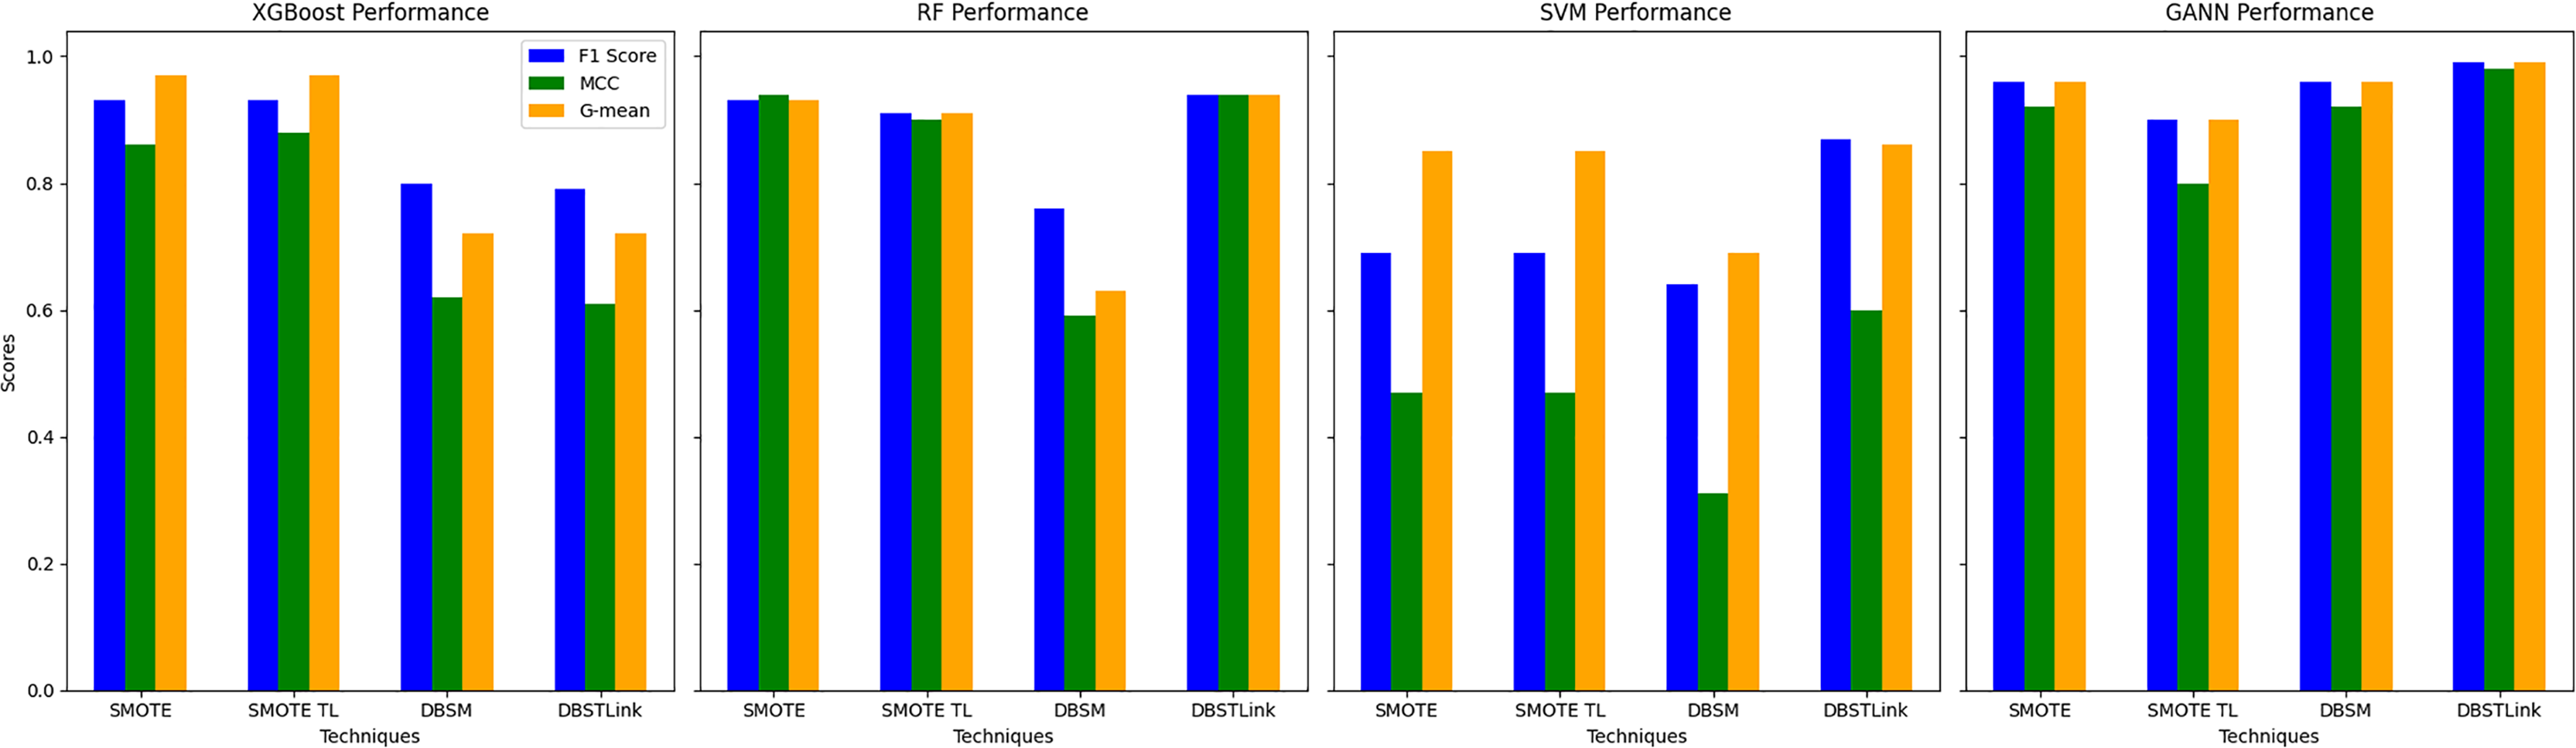
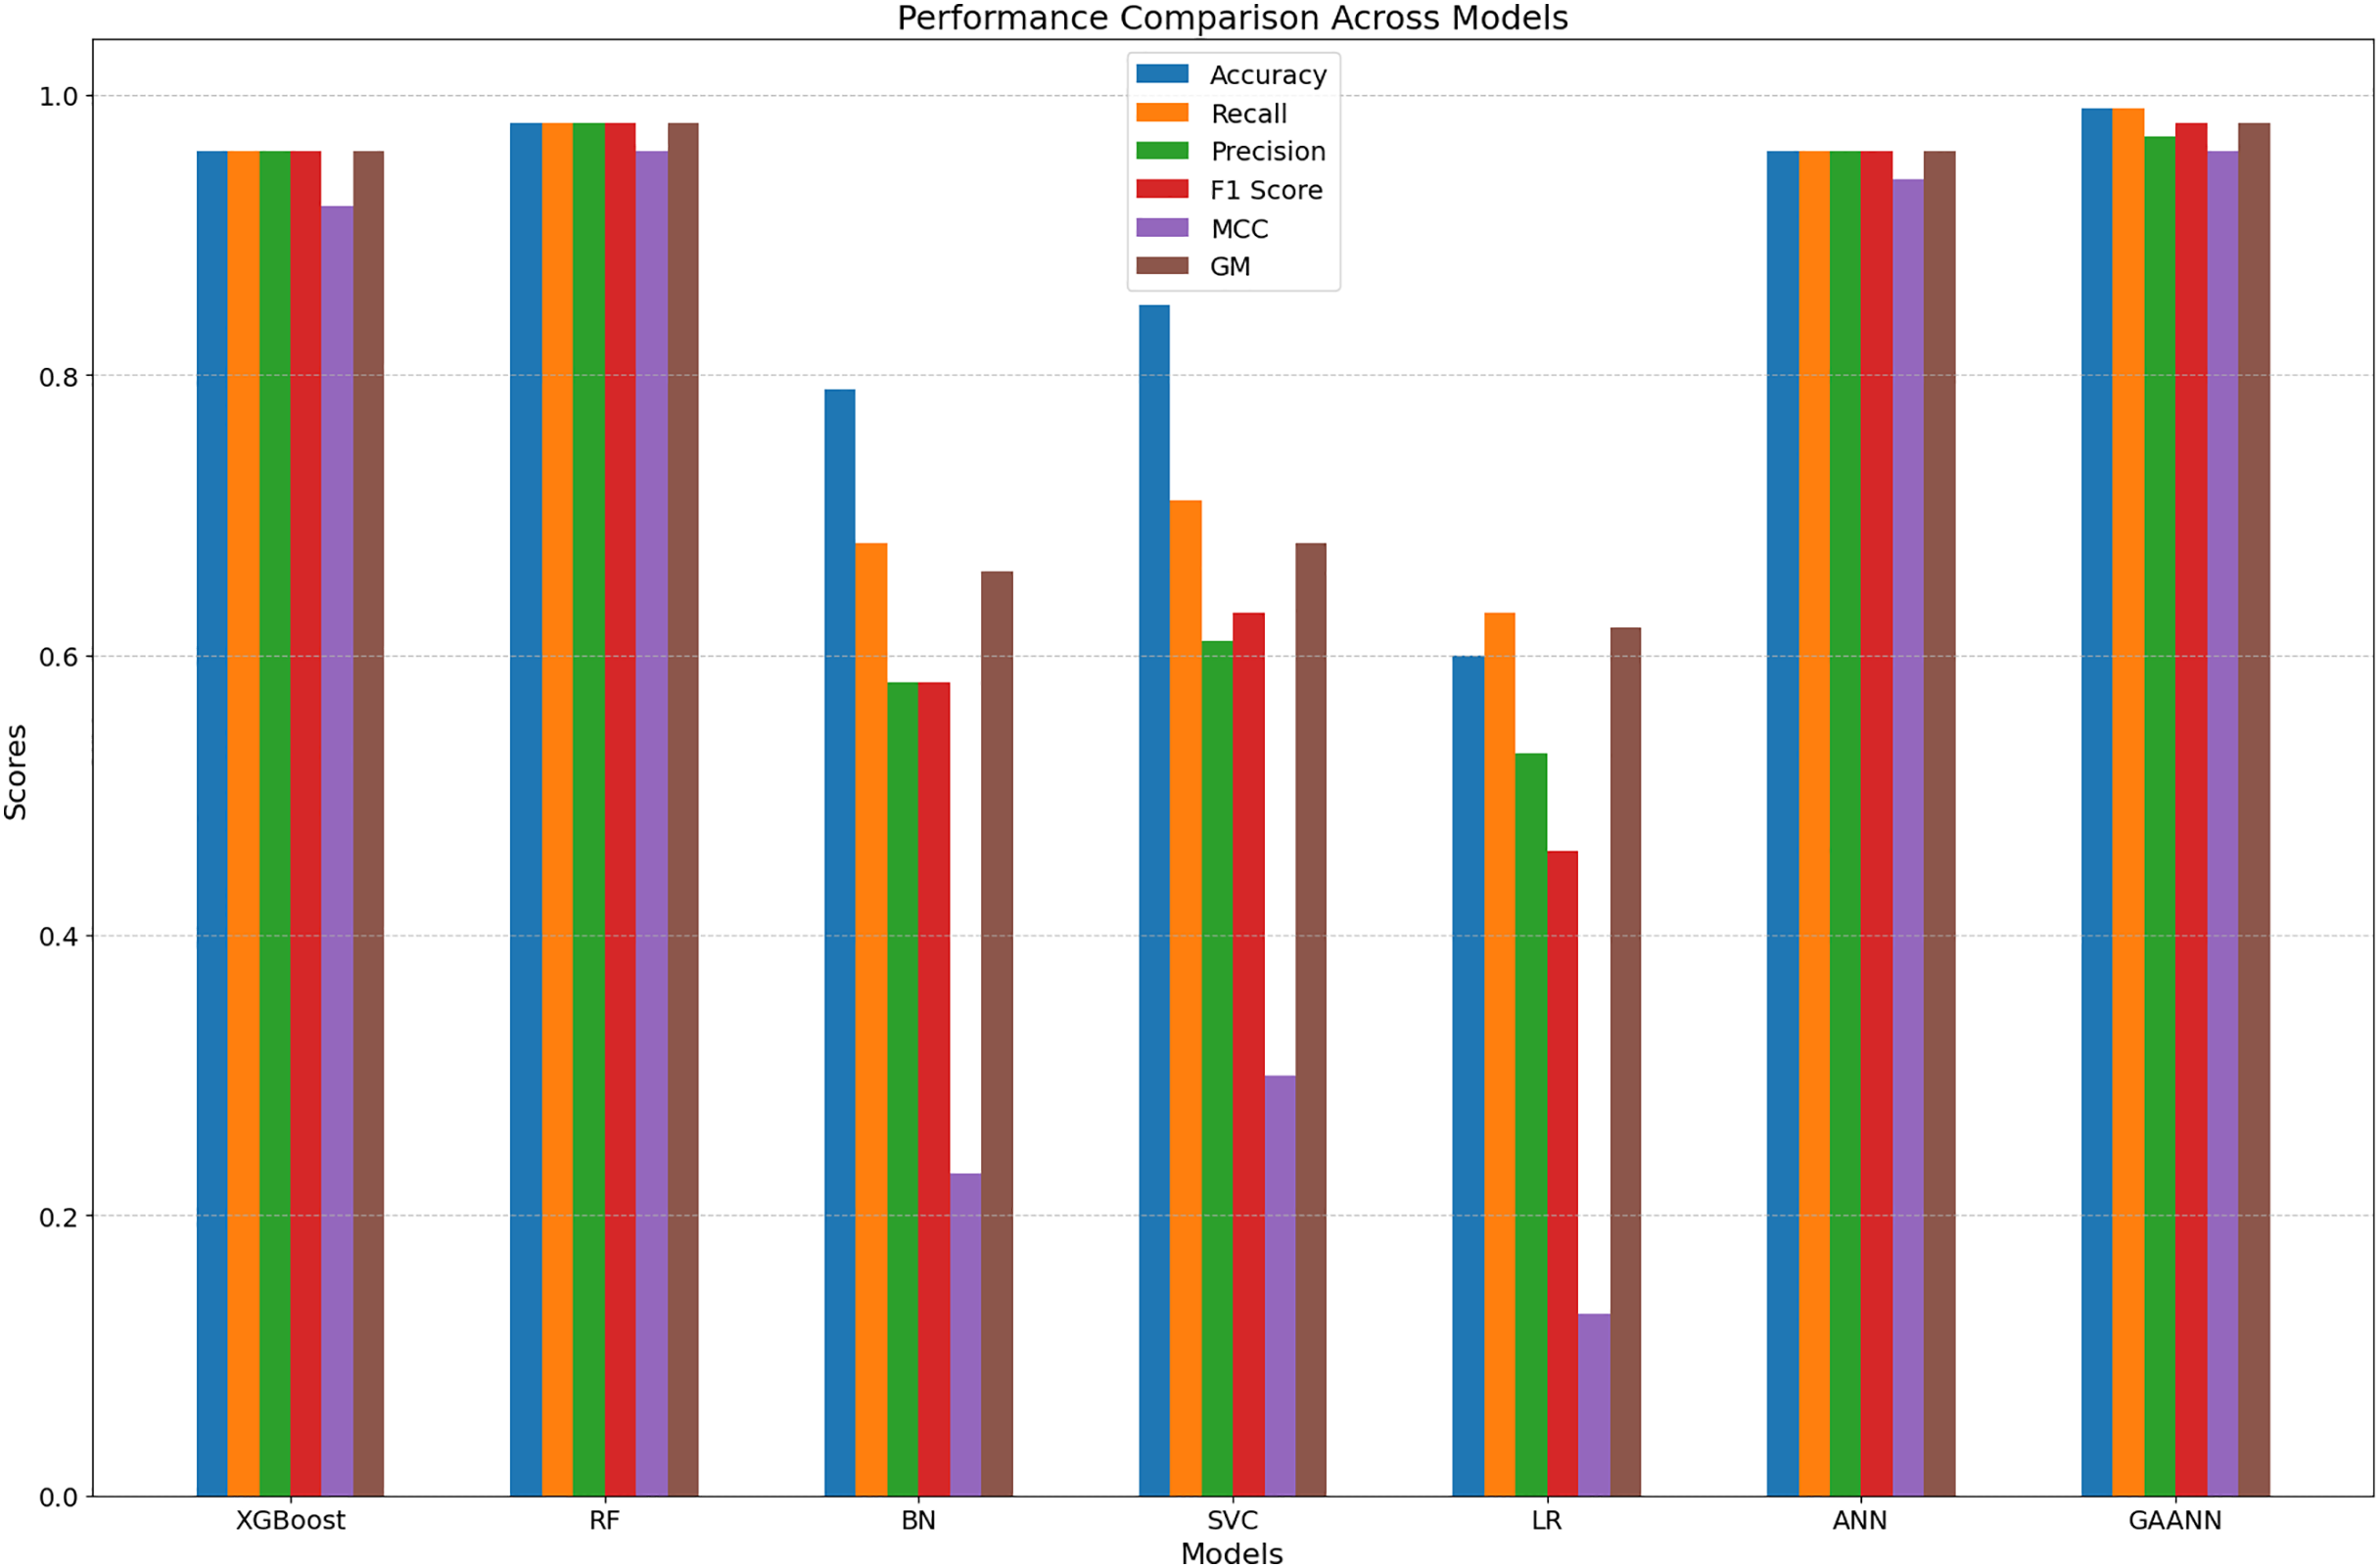
Finally, for the GA-ANN model, DBSTLink dominates with the highest scores across all metrics: F1-score (0.99), MCC (0.96), and G-mean (0.98). These values surpass those of SMOTE, SMOTE TL, and DBSM, which further cements DBSTLink’s position as the best technique. Its ability to provide consistently high values for precision, recall, and class balance, as reflected by G-mean, shows that DBSTLink not only mitigates class imbalance but also enhances the model’s generalization capabilities. Overall, DBSTLink proves to be the most robust balancing technique across models, delivering superior or comparable results in terms of F1-score, MCC, and G-mean. Its balancing handling of precision and recall, coupled with its ability to maintain high class-separation performance (G-mean), makes it a better choice than SMOTE, SMOTE TL, or DBSM in most scenarios. Results are illustrated for each balancing approach given in Fig. 5.
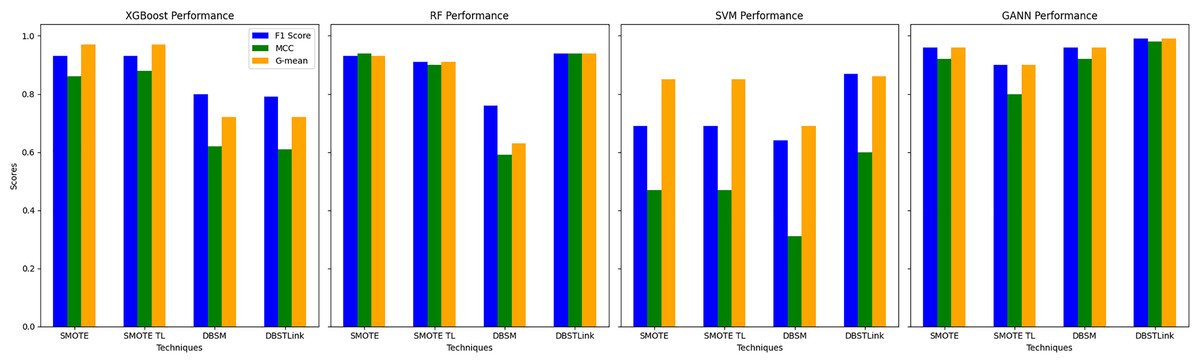
Figure 5: Modeling performance of each balanced approach compared with proposed DBSLink balanced approach.
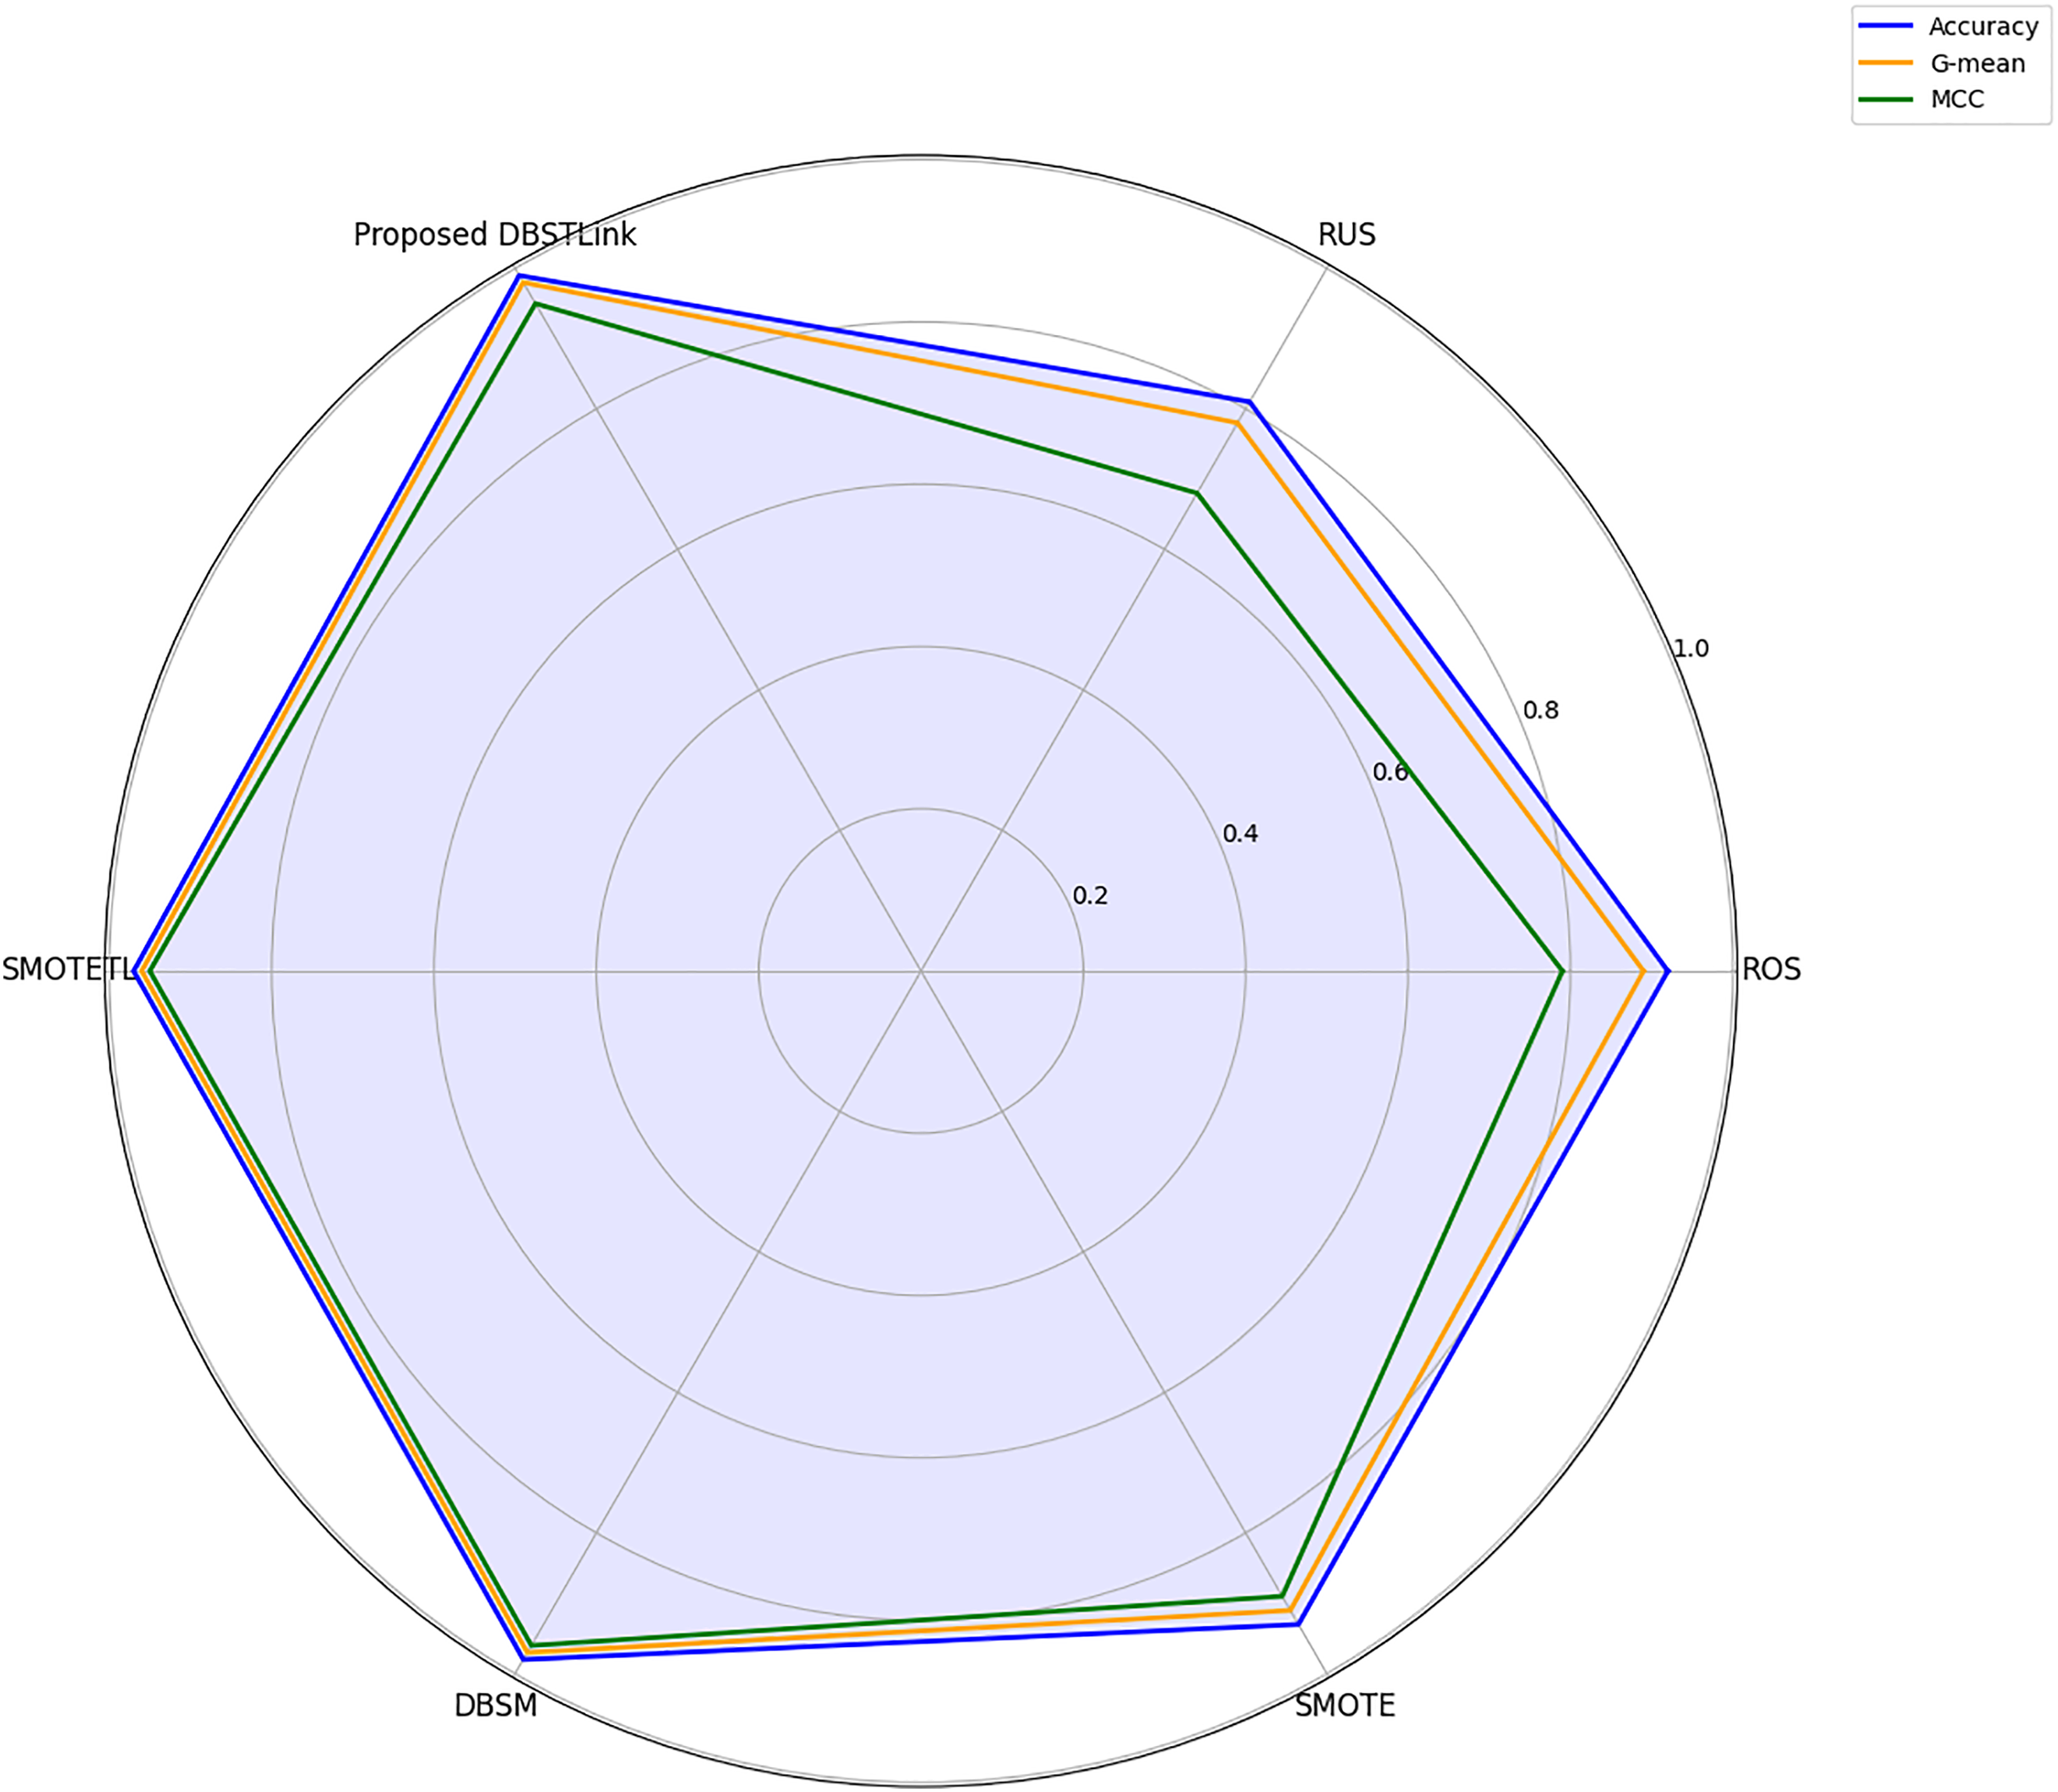
In Table 8, a performance evaluation of the FusionNet GA-ANN classifier was conducted using several balancing approaches, resulting in diverse results where random undersampling (RUS) achieved an accuracy of 0.84, a G-mean of 0.836, and a mean squared curve (MCC) of 0.67, which suggests a reasonable level of efficacy in addressing class imbalance. The implementation of random over sampling (ROS) significantly enhanced the accuracy to 0.98. However, the G-mean and MCC metrics demonstrated no changes, indicating that, although the accuracy is high, the model’s capacity to maintain a balanced class performance stays constant.t. The SMOTE showed notable enhancement to its performance, achieving an accuracy of 0.96, a G-mean of 0.96, and an MCC of 0.921, which define the efficacy of SMOTE in effectively managing imbalance of crash data. Furthermore, DBSM, which is a combination of DBSCAN and SMOTE, shows robust performance with similar metrics. The SMOTE with Tomek Links (SMOTE-TL) model shows a satisfactory performance with an accuracy of 0.95, a G-mean of 0.95, and an MCC of 0.90. But the proposed DBSTLink resampling procedure, which achieved an accuracy of 0.99, a G-mean of 0.98, and an MCC of 0.96, surpassed existing approaches.
| Fusion net GAANN | Balanced technique | Accuracy | GM | MCC |
|---|---|---|---|---|
| RUS | 0.84 | 0.836 | 0.67 | |
| ROS | 0.98 | 0.836 | 0.672 | |
| Smote | 0.96 | 0.96 | 0.921 | |
| DBSM | 0.96 | 0.95 | 0.93 | |
| SMOTE TL | 0.95 | 0.95 | 0.90 | |
| Proposed DBSTLink | 0.99 | 0.98 | 0.96 |
Table 9 presents the parameter estimates of the logit regression model for crash events and the goodness-of-fit statistics. The statistical analysis demonstrates that Throttle (β = 0.0096, p < 0.001), Brake (β = 0.0048, p < 0.001), and Steering (β = 0.0045, p < 0.001) all contribute significantly to the predicted outcome, while Longitudinal_g (β = 0.4875, p < 0.001) and Vertical_g (β = 0.6827, p < 0.001) exhibit strong positive effects. Speed (β = -0.0164, p < 0.001), Tyre_temp_FL (β = −0.0299, p < 0.001), and Yaw_angle (β = −0.0006, p = 0.023) present significant negative effects. The results show that RPM (β = 2.306e−05, p = 0.140) and Lateral_g (β = −0.0066, p = 0.704) have no significant impact on the predicted outcome. The results demonstrate that essential driving actions together with environmental conditions have a major impact on the outcome. The 10-fold cross-validation produced an average accuracy rate of 98.79%. A 95% confidence interval calculation provided a statistical assessment of accuracy measurement reliability through a range from 98.24% to 99.33%, which is also presented in Table 9.
| Feature | Coefficient (β) | Std. Error (SD) | z-value | p-value | 95% confidence interval |
|---|---|---|---|---|---|
| Throttle | 0.0096 | 0.001 | 14.627 | 0.000 | [0.0076–0.0116] |
| Brake | 0.0048 | 0.001 | 3.702 | 0.000 | [0.0028–0.0068] |
| Steering | 0.0045 | 0.001 | 8.724 | 0.000 | [0.0025–0.0065] |
| RPM | 2.306e−05 | 1.56e−05 | 1.475 | 0.140 | [−0.0 to 0.0001] |
| Speed | −0.0164 | 0.001 | −27.001 | 0.000 | [−0.0184 to −0.0144] |
| Lateral_g | −0.0066 | 0.017 | −0.380 | 0.704 | [−0.0399 to 0.0267] |
| Longitudinal_g | 0.4875 | 0.036 | 13.660 | 0.000 | [0.4169–0.5581] |
| Vertical_g | 0.6827 | 0.047 | 14.404 | 0.000 | [0.5906–0.7748] |
| Yaw_angle | −0.0006 | 0.000 | −2.269 | 0.023 | [−0.0012 to −0.0] |
| Tyre_temp_FL | −0.0299 | 0.003 | −9.927 | 0.000 | [−0.0358 to −0.024] |
| Weather | 0.1406 | 0.016 | 8.854 | 0.000 | [0.1092–0.172] |
The findings emphasize the need to select resampling techniques for any model learning and guarantee equitable and efficient categorization across different class distributions. Figure 6 illustrates the results for each category of combined features. To further explore the findings visually, the results are presented in Fig. 7.
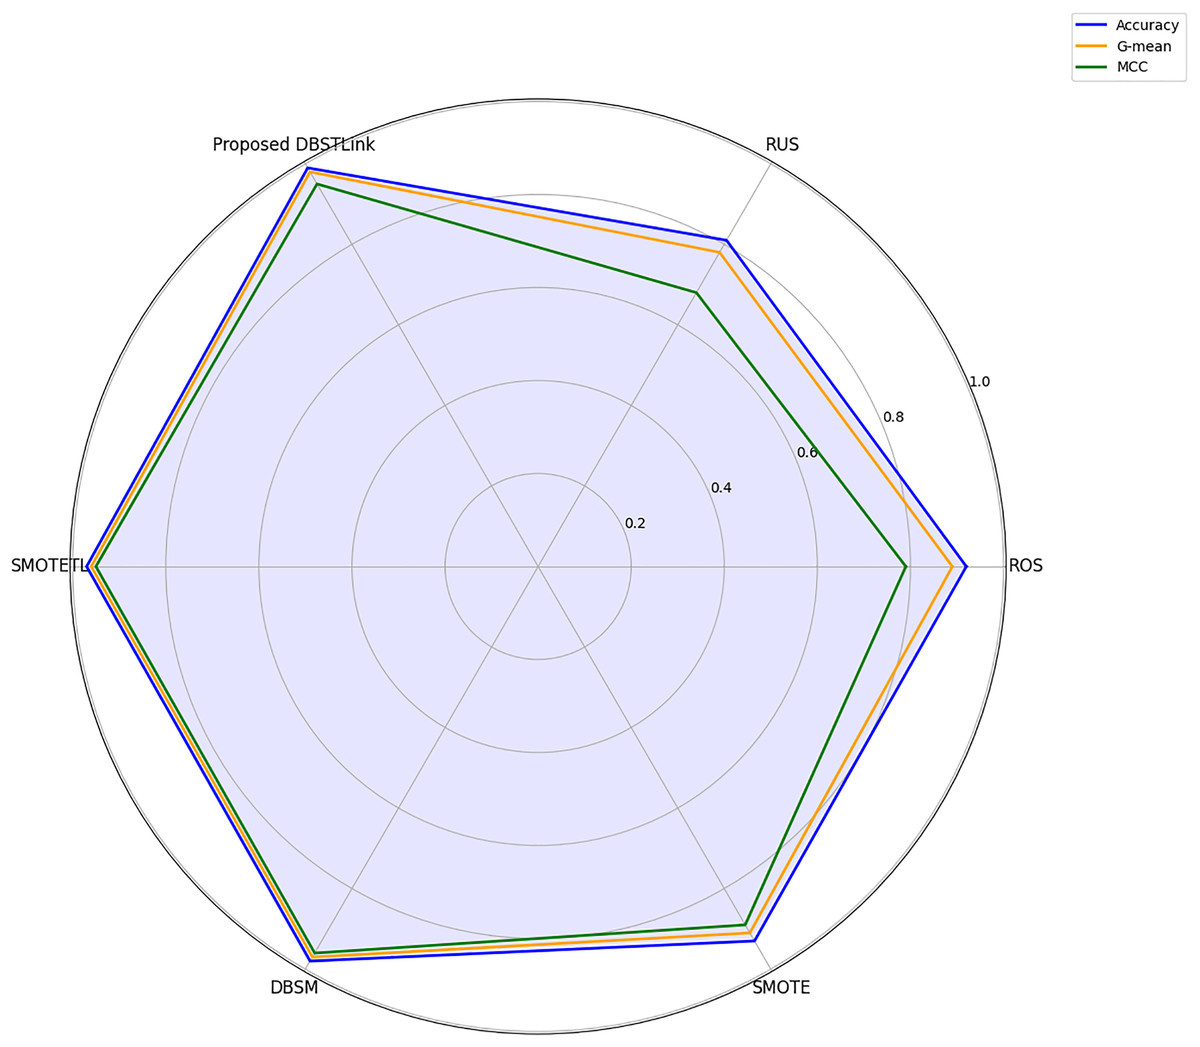
Figure 6: Comparison of different sampling techniques with proposed GA-ANN approach.
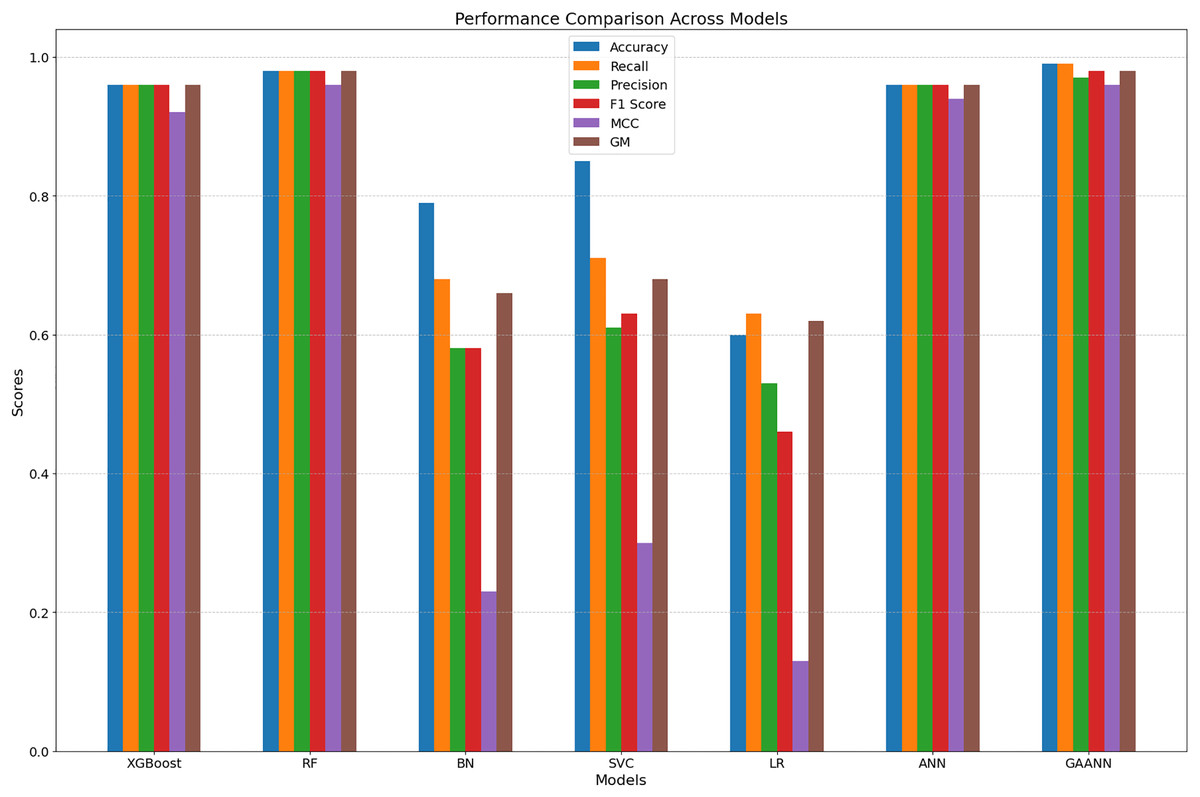
Figure 7: Comparitive performance overview for classification models compared to GA-ANN classifier.
Comparison with public dataset
The proposed method required further evaluation through the use of Traffic Accident Dataset data available from Kaggle to ensure its generalizability and robustness. This dataset accessed from TamSquare (2023) which contains real traffic accident records from 2015 which have the following key features:
The dataset contains various types of features: temporal features such as Year, Month, Day, and Hour; categorical features including Weekend?, Collision Type, Injury Type, and Primary Factor; and geospatial features like Reported_Location, Latitude, and Longitude. The Injury Type attribute was transformed into a binary target variable to distinguish between crash and non-crash incidents. Specifically, entries labeled as Fatal, Incapacitating, and Non-incapacitating were grouped under the class Crash, while No injury/unknown was labeled as Non-crash. During preprocessing, binary categorical variables such as Weekend? were label encoded, while nominal features like Collision Type and Primary Factor underwent one-hot encoding. Continuous variables including Hour, Latitude, and Longitude were normalized using the MinMaxScaler to ensure consistent scaling. We then applied our proposed DBSTLink approach to balance the data. This technique captures nuanced interactions between time, location, and contributing factors by linking similar event profiles using adaptive density thresholds. For classification and validation, we employed a GA-ANN. The genetic algorithm was used to select the most relevant features from the preprocessed data, and the optimized subset was then used by an artificial neural network to classify crash vs. non-crash events. Model training and testing were performed using five-fold cross-validation to ensure robustness. Table 10 demonstrates the comparison table of performance evaluation of the proposed method on simulated and public (kaggle) datasets.
| Dataset | F1-score | MCC | GM |
|---|---|---|---|
| Real life data | 0.88 | 0.76 | 0.88 |
| Simulated data | 0.98 | 0.96 | 0.98 |
Discussion
The goal of this work is to solve the balancing problem by introducing a new method called DBSTLink, which uses a combination of genetic algorithms and artificial neural networks for crash prediction based on various machine learning techniques. To tackle the problem of imbalanced data, which is typical for crash-related observations where target classes are not equally represented, a new balancing strategy, DBSTLink, has been proposed. This approach is designed to equate the number of examples in each class to enhance the accuracy of the subsequent analyses. Furthermore, a comprehensive analysis has been carried out to determine the most significant predictors of crash events. Knowing these key predictors is important in the design of control measures. Lastly, a number of prediction methods have been explored and compared with the developed GA-ANN model. This comparison shows that driving action is a major cause of road accidents and that these behavioral attributes should be incorporated into active traffic safety systems to improve their efficiency. Table 11 presents a comparison between our system and other crash assessment studies. Based on modeling metrics, we compared several fusion models used in crash investigations. The performance of the proposed DBSTLink balancing approach is compared with various sets of other balancing approaches like SMOTE, SMOTE TL, and DBSM in reference to the values of F1-score, G-mean, and MCC, as these metrics are deemed to be highly acceptable for tackling the class imbalance issues. The combination of the proposed balancing approach with SVM, LR, XGBoost, and GA-ANN compares favorably with other balancing approaches. We obtained the highest scores for all prediction models using DBSTLink approaches, which consistently outperformed other models in most established combinations based on the individual learners applied. The proposed hybrid GA-ANN performed with the highest accuracy among other single machine learning models. Our model reached a predictive accuracy of 98.79%, which became more reliable because the 95% confidence interval was narrow, between 98.24% and 99.33%. The small range indicates that the model performs consistently when working with different data subsets. The model’s stability proves that the chosen predictors work well together with our modeling approach. Using 10-fold cross-validation makes our performance estimates trustworthy and realistic because it is a strong statistical method that reduces errors compared to other validation methods. The research results showcase the effectiveness of the proposed model in real-world predictive scenarios, especially in predicting crashes.
| Modeling features | |||||||||
|---|---|---|---|---|---|---|---|---|---|
| Article | Vehicle telemetry |
Driver input | Weather conditions | Tire conditions | Demographic information | Class imbalance | Feature reduction | Base learners | Performance (%) |
| Xu & Prozzi (2023) | √ | √ | – | 94.00 (F1-score) | |||||
| Yusoff et al. (2024) | √ | √ | – | Multiple factor analysis | CART, ANN, SVM | 72.00 (F1-score) | |||
| Kia, Haratizadeh & Shouraki (2020) | √ | √ | SMOTE | Bayesian networks |
Logistic regression | 87.6 (F1-score) | |||
| Osman et al. (2019) | √ | – | 99.00 (F1-score) | ||||||
| Elamrani Abou Elassad, Mousannif & Al Moatassime (2020b) | √ | √ | √ | √ | SMOTE | RF | SVM, MLP | 92.3 (Precision) | |
| 89.30 (Recall) | |||||||||
| 90.00 (F1-score) | |||||||||
| Goldberg & Holland (1988) | √ | √ | – | RF | Bayesian optimization, RF | 66.00 (Precision) | |||
| 53.00 (Recall) | |||||||||
| 57.00 (F1-score) | |||||||||
| Helal, Haydar & Mostafa (2016) | √ | √ | √ | √ | SMOTE-TL, SMOTE ENN, ADASYN |
RF | GBM, XGBoost, AdaBoost and CatBoost | 89.78 (Precision) | |
| 95.69 (Recall) | |||||||||
| 92.64 (F1-score) | |||||||||
| Current study | √ | √ | √ | √ | DBSTLink | GA | GAANN hybrid classifier | 98.8 (Precision) | |
| 97.6 (G Mean) | |||||||||
| 98.0 (F1-score) | |||||||||
This research finds new ways to classify crash occurrences as a function of driving action so as to help in designing effective crash prevention strategies that entail issuing warning signals to drivers and encouraging safe behavior. The study establishes statistical relationships through validation and predictive modeling, but it does not establish cause-and-effect relationships. The methods we employed, such as the DBSTLink balanced approach with GA-ANN, prevent us from establishing cause-effect relationships. Nevertheless, in order to gain admission, there are certain restrictions that require attention. Simulator studies are applied to a controlled and modifiable environment to look at road crash incidents, while real trials are conducted in real road conditions and are risky; however, the driving simulator is unable to replicate the actual driving experience. The validity of the findings from a driving simulator depends on the specific tasks simulated in the environment. The proposed DBSTLink + GAANN method required evaluation through performance testing on simulated data and real-world data sets. The model demonstrated strong generalizability through its consistent results across different datasets which showed its ability to adapt to various data distributions. The method successfully detected meaningful spatio-temporal patterns together with contributing factors in real-world scenarios which supports its practical use for traffic incident analysis.
Conclusions
Global road safety is a critical issue. To mitigate accidents and enhance road safety, it is necessary to develop extremely proficient real-time crash prediction models that can identify the most significant antecedents contributing to collision incidents. A thorough examination is necessary to decrease road accidents and improve traffic safety for drivers through effective tactics. Previous studies concentrating on this domain employed machine learning. Models have demonstrated their effectiveness in enhancing road safety. The research findings propose innovative approaches to enhance our findings of crash occurrences by taking into account driver actions (DA). That is a crucial step in developing effective crash prevention strategies that warn drivers and promote safe driving habits for both experienced and non-experienced drivers. This research helps to propose a balancing approach that will tackle imbalance issues in a more efficient way and also propose a hybrid classifier for merging information and building fusion models. However, it is important to acknowledge certain limitations. This study is simulator-based, which offers a controlled environment, particularly in road crash approaches. Simulators do not fully replicate real driving experiences. The outcome of a simulator can vary, being either different or controlled based on the tasks executed. In this research, DA is based on driver input, vehicle kinematics, tire conditions, and weather conditions, which are simulated environments for the drivers. The simulator cannot replace real-world driving experiences while predicting crashes.
The proposed DBSTLink + GA-ANN framework received validation through testing with simulated data and publicly available real-life traffic data. The model demonstrated reliable performance because it achieved high results in all tested datasets. The research indicates that this method works effectively for theoretical modeling and real-world applications in traffic crash prediction and urban safety management. Future research must also more thoroughly examine potential biases associated with repeated crash scenarios and driver anticipation effects. Further, the capabilities of the simulator should be expanded to include advanced behavioral modeling and complex driving tactics to increase the robustness and practical utility of simulator-based driving research. Future research should use experimental or longitudinal designs to validate causal relationships. Besides, future research could expand the predictive models by using different techniques to address class imbalance and improve crash prediction.