
Vegetation influences soil properties along riparian zones of the Beijiang River in Southern China
- Published
- Accepted
- Received
- Academic Editor
- Kabindra Adhikari
- Subject Areas
- Conservation Biology, Ecology, Soil Science
- Keywords
- Riparian zone, Soil-vegetation relationship, Distance to river, Redundancy analysis, Subtropical river
- Copyright
- © 2020 Zhao et al.
- Licence
- This is an open access article distributed under the terms of the Creative Commons Attribution License, which permits unrestricted use, distribution, reproduction and adaptation in any medium and for any purpose provided that it is properly attributed. For attribution, the original author(s), title, publication source (PeerJ) and either DOI or URL of the article must be cited.
- Cite this article
- 2020. Vegetation influences soil properties along riparian zones of the Beijiang River in Southern China. PeerJ 8:e9699 https://doi.org/10.7717/peerj.9699
Abstract
Riparian soils and vegetation are important factors influencing the biodiversity and biogeochemical processes of river ecosystems. Riparian soils and vegetation form the foundation for multiple ecosystem services provided by river ecosystems. However, it remains poorly understood how riparian soils and vegetation interact with one another to maintain these services. In this study, we sampled four common types of riparian vegetation associated with the Beijiang River in South China. These included forestland, bamboo forest, mixed forest, and grassland ecosystems. Specifically, we analyzed the spatial distribution of riparian soils and their response to environmental factors (i.e., coverage and height of trees, shrubs and grass, distance to river, and altitude). Our results indicate that soil properties in riparian zones were affected significantly by vegetation type. In particular, clay content, soil organic carbon, and nitrate nitrogen content were significantly correlated with vegetation type. In contrast, changes in soil total nitrogen, total phosphorus, and available phosphorus content were not associated with vegetation type. Moreover, soil physical and chemical properties interacted with one an other, as well as with vegetation characteristics. This was indicated by the significant correlation observed between soil organic carbon, total nitrogen, total phosphorus, and soil texture, with structural characteristics of the four vegetation types. We also found that height and cover of trees and shrubs were significantly correlated with soil chemical properties. However, the effects of topographic variables such as altitude and distance to river were not significant. Results from this study can thus provide a basis for the ecological restoration and land management of degraded iparian zones.
Introduction
Riparian zones are widely recognized as critical transition zones between hillslopes and channels, and they play an important role in maintaining river ecosystem health (Hale et al., 2014; Fernandes et al., 2016). Likewise, intensive ecological interactions between terrestrial and aquatic environments occur frequently within riparian zones (Manfrin et al., 2018). But given the critical role of riparian zones in providing important ecosystem services, they remain fragile systems that can be modified easily by land use change and other human influences (i.e., through fertilization and deforestation) (González et al., 2017; Fernandes et al., 2016). Over the past 50 years, exploitation of riparian zones has increased rapidly, which has led to widespread water quality degradation and increased soil erosion, nutrient loss, and salinisation (Tromboni & Dodds, 2017). As a result, the ecosystem services provided by riparian zones remain severely threatened by human activities.
Riparian soils and vegetation form the foundation of numerous ecosystem services, being important for the overall biodiversity and biogeochemistry of river ecosystems (Hale et al., 2018). Specifically, riparian vegetation can promote ecological balance, biodiversity, and agricultural production by stabilizing stream banks and improving water quality. They can also reduce erosion potential, increase the storage of nutrients and water, and provide forage and habitat for a variety of wildlife (Connolly, Pearson & Pearson, 2016; Fierro et al., 2017; Sun et al., 2018). In addition, soil properties in riparian zones, such as soil moisture, carbon, nitrogen and phosphorus, are important for mediating many ecological processes, including carbon sequestration, nitrogen mineralisation, litterfall decomposition, and water purification (Zhao et al., 2014; Smith et al., 2012; Qian et al., 2018). Riparian soil properties are thus key components of these ecosystems, and are highly important for the sustainable development of agricultural efforts. Importantly, both riparian soils and vegetation can be used as ecological indicators to measure the progress of riparian management practices used to restore and maintain soil ecosystem services (Hale et al., 2014; Saint-Laurent, Gervais-Beaulac & Berthelot, 2014).
Vegetation plays an important role in the regulation of soil resource patterns and availability in riparian zones (Hou & Fu, 2014). The occurrence and succession of riparian vegetation are closely related to soils and other environmental factors (Hale et al., 2018; Bruno et al., 2014). For example, riparian vegetation modifies both physical and chemical properties of soils, including nutrient inputs and outputs, soil moisture, particle size, aggregation, sedimentation, and dispersion (Nielsen et al., 2014). However, riparian vegetation is highly variable and it is likely that different vegetation types influence nutrient inputs in unique ways. For example, nitrate attenuation in riparian grasslands is significantly less effective than in riparian woodlands, but their effectiveness was found to be higher than that for removing phosphate and dissolved organic phosphorus (Batlle-Aguilar et al., 2012).
The removal of nitrogen within riparian zones should be related to vegetation type, microbial immobilization, and storage in the soils. Furthermore, N removal can occur via conversion from microbial to gaseous forms. In contrast, the storage of phosphorus in riparian zones is related to soil adsorption, plant uptake, and microbial immobilisation (Mander, Hayakawa & Kuusemets, 2005). The presence of riparian vegetation typically favors infiltration over surface runoff, which may result in high moisture content occurring in riparian zones (Dominika et al., 2019). Moreover, vegetation is an important factor that contributes to the change in riparian ecosystem functions through its effects on soil fertility (Stella, 2012). On the one hand, the loss of riparian vegetation can affect bank stability by increasing soil erosion, resulting in soil degradation or aggradation (Daly, Miller & Fox, 2015; Dominika et al., 2019). Previous studies have indicated that changes in riparian vegetation are the primary cause of soil erosion, which often leads to variable declines in soil quality (Qian et al., 2018; Labrière et al., 2015). On the other hand, soil physical and chemical properties can affect vegetation due to their effects on chemical reactions and biological processes (Li et al., 2013). Meanwhile, these soil properties are typically used as an indicator of the quality and vitality of plant life in riparian environments (Saint-Laurent, Gervais-Beaulac & Berthelot, 2014).
In addition to the relationship between riparian vegetation and soils, changes in environmental conditions affect the spatial heterogeneity of plant communities and can potentially increase the heterogeneity of soil properties (Bruno et al., 2014; Oni et al., 2017; Tsheboeng, Murray-Hudson & Kashe, 2016). Previous studies have indicated that variation in soils within riparian forests is driven by environmental gradients and prior human and natural disturbances (Sarr et al., 2011; Tsheboeng, Murray-Hudson & Kashe, 2016). However, the effects of environmental factors on soil parameters are also likely dependent on site characteristics, such as the specific geology and climate of the region (Batlle-Aguilar et al., 2012). Likewise, spatial heterogeneity in riparian soils is dependent on vegetation, microtopography, and other environmental gradients associated with hydrological regimes. For instance, soil organic carbon and nitrogen have both been shown to increase with distance from river (Xia et al., 2018). Specifically, larger distances from rivers result in lateral heterogeneity in soil texture, due to the similarly sharp gradient in erosion and sedimentation (Xia et al., 2018). One previous study in particular showed that riparian soils in close proximity to rivers are characterized by coarse particles and low levels of organic matter (Dorioz et al., 2006). In contrast, larger distances from the river tend to lead to higher levels of fine particles and organic matter (Nakamura, Yajima & Kikuchi, 1997). Furthermore, the permeable coarse soils associated with sites adjacent to rivers are always related to higher levels of nutrient leaching, which leads to lower nutrient content along rivers (Pän, Pinay & Mander, 2012; Fournier et al., 2013). In addition to distance from rivers, altitude also is a complex factor that influences soil properties, since it is closely related to soil matrix, hydrological regime, and vegetation distribution through significantly vertical geomorphologic zoning (Li et al., 2013). Therefore, investigating changes in vegetation and soils along environmental gradients is crucial for the management of riparian zones
Ultimately, understanding the complex and dynamic nature of nutrient cycling processes in riparian soils, and its effects on environmental variables, is important for forecasting the succession of ecosystems. The present study aims to (1) characterize changes in soil physicochemical properties under different riparian vegetation types; (2) determine the relationships among soil physical and chemical properties; and (3) reveal the influence of environmental factors on riparian soil properties.
Materials and Methods
Study Area
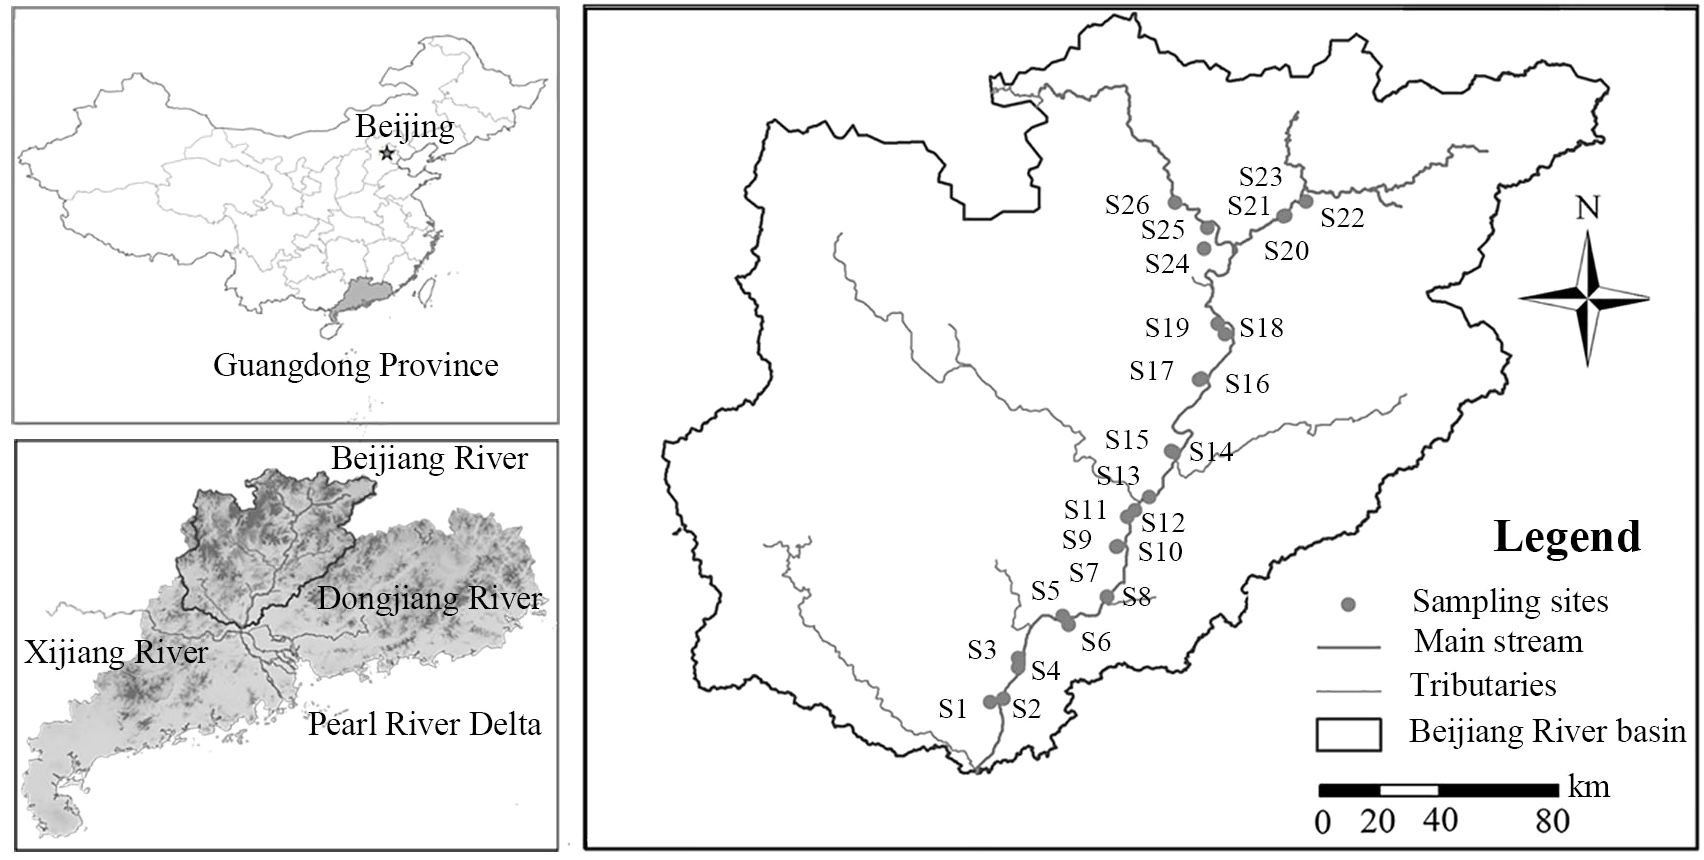
Our study was conducted along the riparian zone of the Beijiang River in South China (N23°27′−24°58′, E112°52′−113°49′). The Beijiang River is one of the four largest rivers in Guangdong Province, and is the second largest tributary of the Pearl River (Fig. 1). The Beigiang river basin area covers approximately 22% of Guangdong Province. The climate in the Beijiang Basin is described as subtropical monsoon, with an average annual temperature ranging from 18 °C to 21 °C, and annual rainfall between 1,300 mm and 2,400 mm. Maximum annual temperatures in the Beijiang Basin usually occur in July or August. Precipitation occurs primarily during the wet season from April to September, accounting for 70% of annual total precipitation.
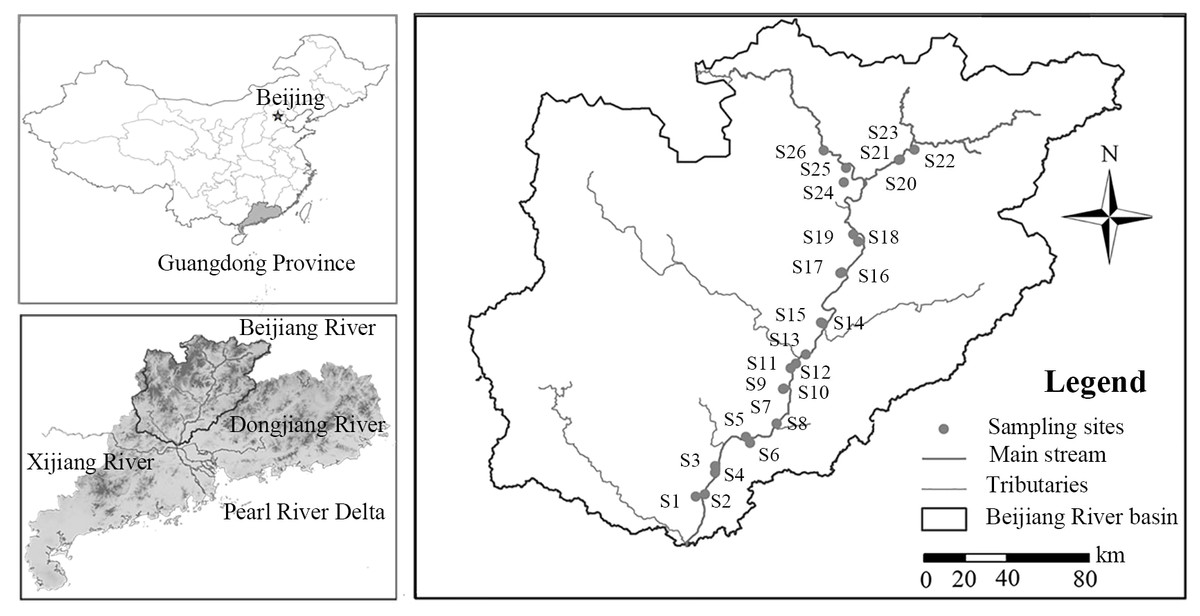
Figure 1: Location of the study area and sampling sites.
By 2014, 12 dams had been built along the Beijiang River to improve water resources needed for agricultural and industrial uses, hydroelectric power development, and flood control. However, rapid economic development in the region, as well as urbanization, have led to rapid deterioration in the quality of water resources in the Beijiang Basin (Li et al., 2019). In agricultural/rural areas, accumulated pesticide usage and sewage are potential pollution sources. In industrial and urban areas, the negative effects of industrial wastewater, urban sewage, chemical industrial pollution, and transportation are more important.
The topography of the Beijiang Basin is comprised of mountains (20%) and hills (70%), with lower elevation occurring in the southern portion of the basin. Soils in the Beijiang Basin, which are broadly described as Ultisols or Ferrisols, are mainly composed of red soils (i.e., red, latosolic red, yellow red and yellow soil). The soil structure of the Beijiang Basin is complex, being influenced by soil parent material, land use, vegetation, soil particle composition, soil organic matter, and iron and aluminum oxide. The soil structure in the basin is typical of red soils, having a stable structure with low porosity and permeability.
The forest type of the study area is composed of South Asian tropical or Central Asian monsoon evergreen broad-leaved forest. The dominant vegetation along the riparian zone of the Beijiang River now consists primarily of planted vegetation, including bamboo and eucalyptus forests, as well as mixed forests, grasslands, and agricultural area.
Field investigation
Field surveys were conducted in June 2014, and were made by following the mouth of the Beijiang River up to the intersection of the Zhenjiang River and Wujiang River (Fig. 1). A total of 26 plots, including 5 eucalyptus forests, 6 grasslands, 7 bamboo forests and 8 mixed forest plots, were established with the size of 20 m × 20 m (Table S1). All plots were located within the riparian zone, defined as between the water’s edge and levees and roads associated with the river.
Within each plot, we recorded vegetation type, species composition (Table S2), total coverage, and mean height and coverage of trees, shrubs and grass. We also recorded important site characteristics, including altitude, and distance to the river (i.e., from the sample plot centre to the river edge). Tree height was measured using a laser tree height meter (Nikon Corporation, Tokyo, Japan). Height of shrubs and grasses was measured with a tape or metal ruler. Soil samples were taken at a depth of 20 cm at the centre of each plot, as well as from four random locations within the plot. The five samples were then combined and mixed to get a composite soil sample of approximately 1,200 g. About 500 g from each bulk soil sample were then sealed in self-locking polythene bags and transported to the laboratory for air-drying. In addition, for measuring soil physical properties, such as soil bulk density (BD) at each plot, additional undisturbed soil samples were taken using a cutting ring.
Laboratory analysis
Based on the quartering method, mixed soil samples were ground and sieved to two mm and all roots and visible plant remains were removed. We measured soil organic carbon (SOC), total nitrogen (TN), nitrate nitrogen (NO3−-N), ammonium nitrogen (NH4+-N), total phosphorus (TP), and available phosphorus (AP). SOC was determined using the potassium dichromate colorimetric method (Lu, 2000). TN was determined using the Kjeldahl acid-digestion method using a H2SO4-mixed catalyst (Lu, 2000). NH4+-N and NO3−-N were extracted using 1 mol L−1 KCl using a soil: KCl ratio of 1:10. These were measured using the alkaline hydrolysis diffusion method and the Nessler’s reagent colorimetry method, respectively (Lu, 2000). TP content was determined using the molybdenum-blue colorimetry method after digesting the samples with perchloric acid (Lu, 2000). AP was extracted using 0.5 mol L−1 NaHCO3 (pH = 8.5) and measured by the molybdenum-blue colorimetry method (Lu, 2000). BD was measured using the oven-drying volumetric ring method after samples were oven-dried at 105 °C for 24 h to a constant mass. BD was calculated as the ratio of oven-dried undisturbed core weight to the cutting ring volume (Lu, 2000). Soil particles size was determined using a Mastersizer 2000 laser diffraction particle size analyser (Malvern Instruments, UK) to determine soil texture (percent clay, silt and sand).
Statistical analysis
We used analysis of variance (ANOVA) with a least-significant-difference test (LSD) to analyze differences in soil physical and chemical properties among the four vegetation types. Pearson correlation coefficients were used to assess the relationships between soil physical and chemical properties. In addition, we used redundancy analysis (RDA) to explore the multivariate correlation between the soil chemical parameters (including SOC, TN, NO3−-N, NH4 +-N, TP, and AP) and the environmental factors along the riparian zone of the Beijiang River. Environmental factors included total coverage and mean height and coverage of trees, shrubs and grasses, as well as distance to river and altitude. Prior to RDA, the detrended correspondence analysis (DCA) was conducted (Zhao et al., 2014). The DCA result of 0.334 indicated that the length of the gradient of the first axis was lower than 3, indicating the RDA was indeed applicable for our study area.
Results
Riparian soil physical properties under different vegetation types
Bamboo forests and mixed forests had the highest and lowest soil BD, respectively (Table 1). However, we found no significant difference in BD across the four vegetation types. Soil particle size was variable across the different vegetation types (Fig. 2). Sand content was highest in bamboo forests and lowest in eucalyptus forests (ANOVA with LSD, P < 0.05). Soil clay and silt content of the eucalyptus forests were significantly higher than those of the bamboo forest (ANOVA with LSD, P < 0.05).
| Vegetation type | Plots | Bulk density (g/cm3) | |
|---|---|---|---|
| Mean ± S.D. | C.V. | ||
| Eucalyptus forest | 5 | 1.26 ± 0.18a | 14.13 |
| Bamboo forest | 7 | 1.34 ± 0.14a | 10.19 |
| Mixed forest | 8 | 1.25 ± 0.15a | 11.76 |
| Grassland | 6 | 1.29 ± 0.16a | 12.64 |
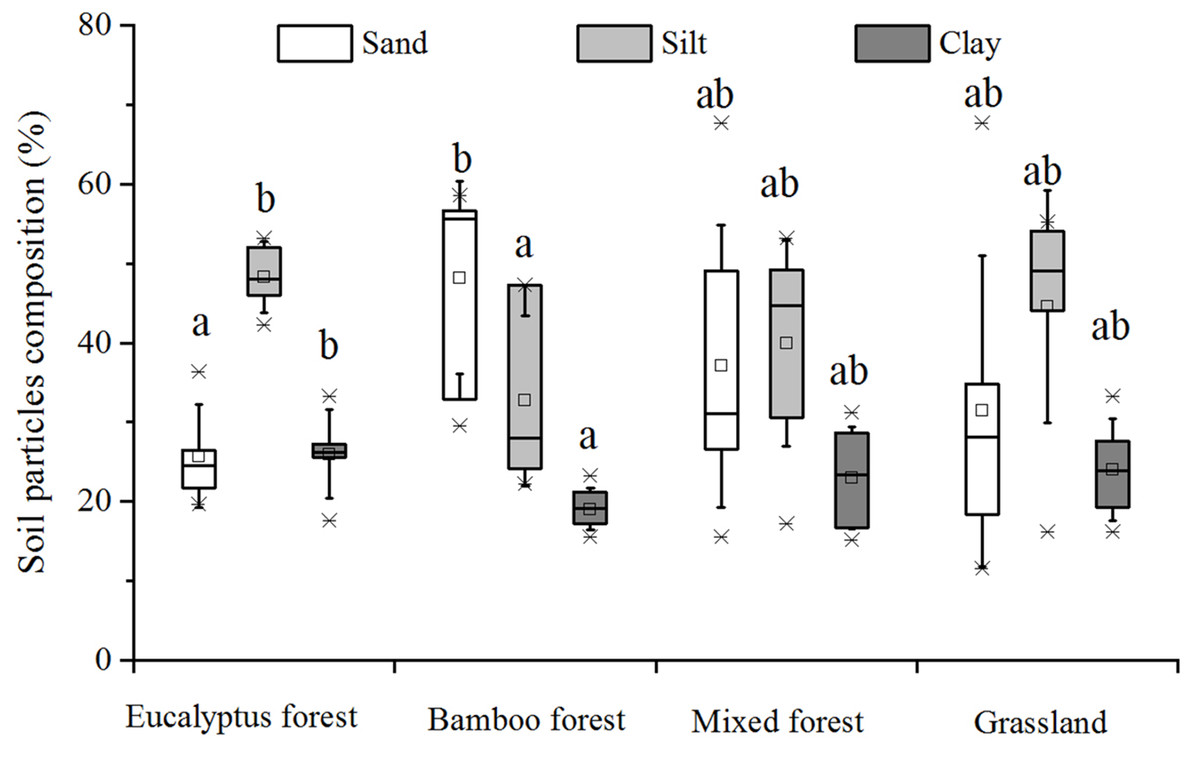
Figure 2: Soil particle composition under different vegetation types.
Different letters of the same soil particle type among different vegetation types indicate significant difference at the 0.05 level.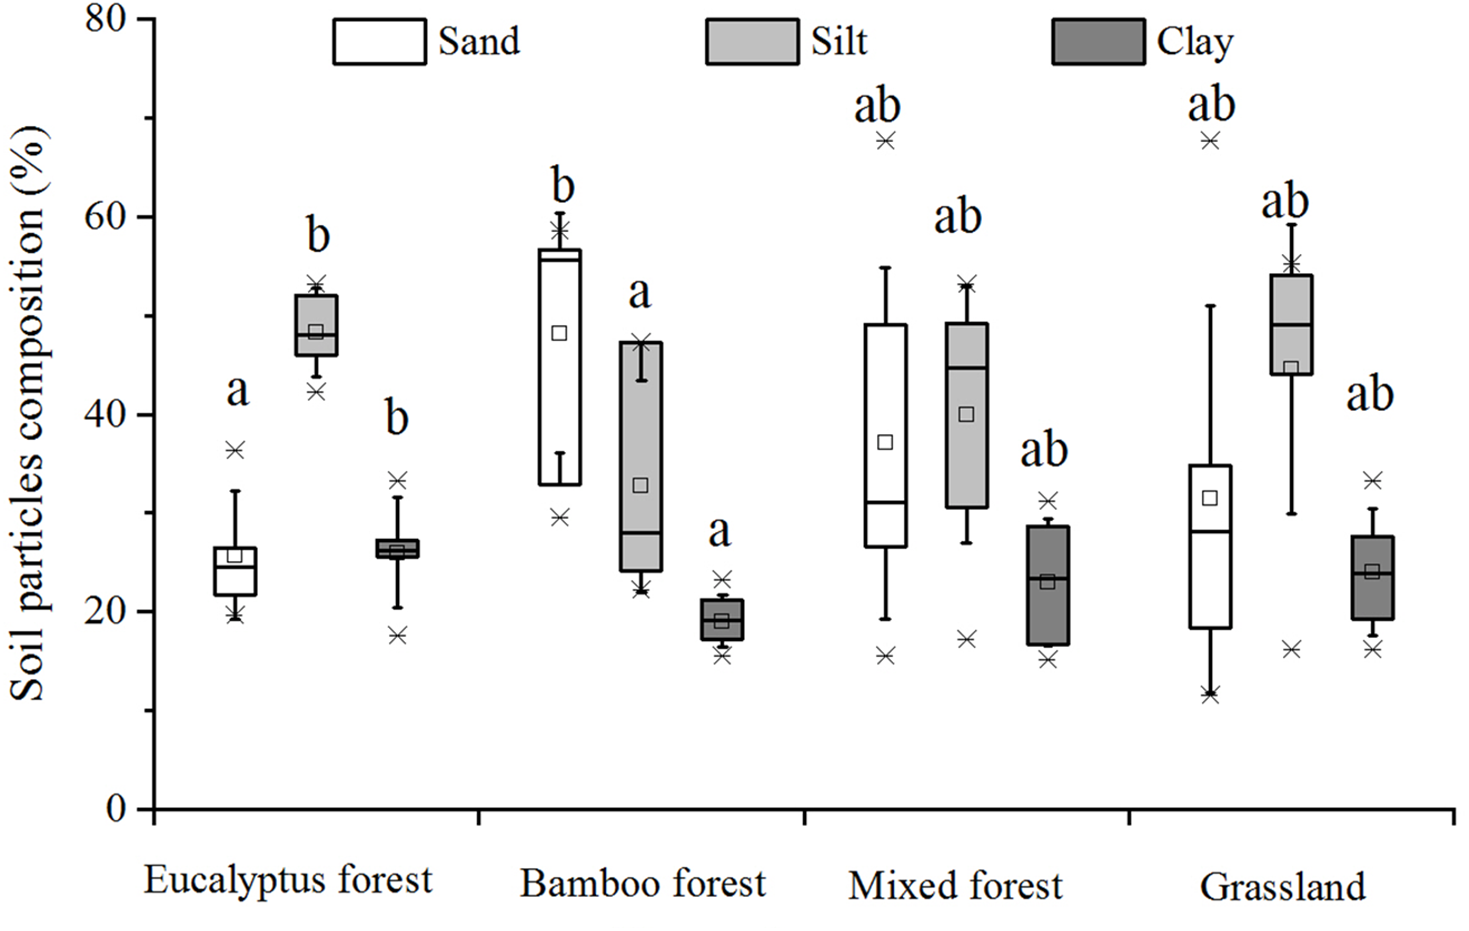
Riparian soil chemical properties under different vegetation types
Mixed forests had the highest levels of SOC, TN, and NO3−-N, followed by the bamboo forests. The eucalyptus forests, in contrast, yielded the lowest values (Fig. 3 ). NH4 +-N content was highest in mixed forests, followed by eucalyptus forests, and was lowest in grasslands. However, difference in SOC, TN, NH4+-N, and NO3−-N content among the different vegetation types was not significant (P > 0.05). TP content in the eucalyptus forests was significantly higher than in the bamboo forests and grasslands. Moreover, TP content in the mixed forests was significantly higher than that in the bamboo forests (P < 0.05). However, no significant differences were observed between mixed and eucalyptus forests and grasslands. Among the four vegetation types, mixed forests showed the highest AP content, followed by eucalyptus forests, grasslands, and bamboo forests. In particular, AP content in the mixed forests was significantly higher than in the bamboo forests (P < 0.05).
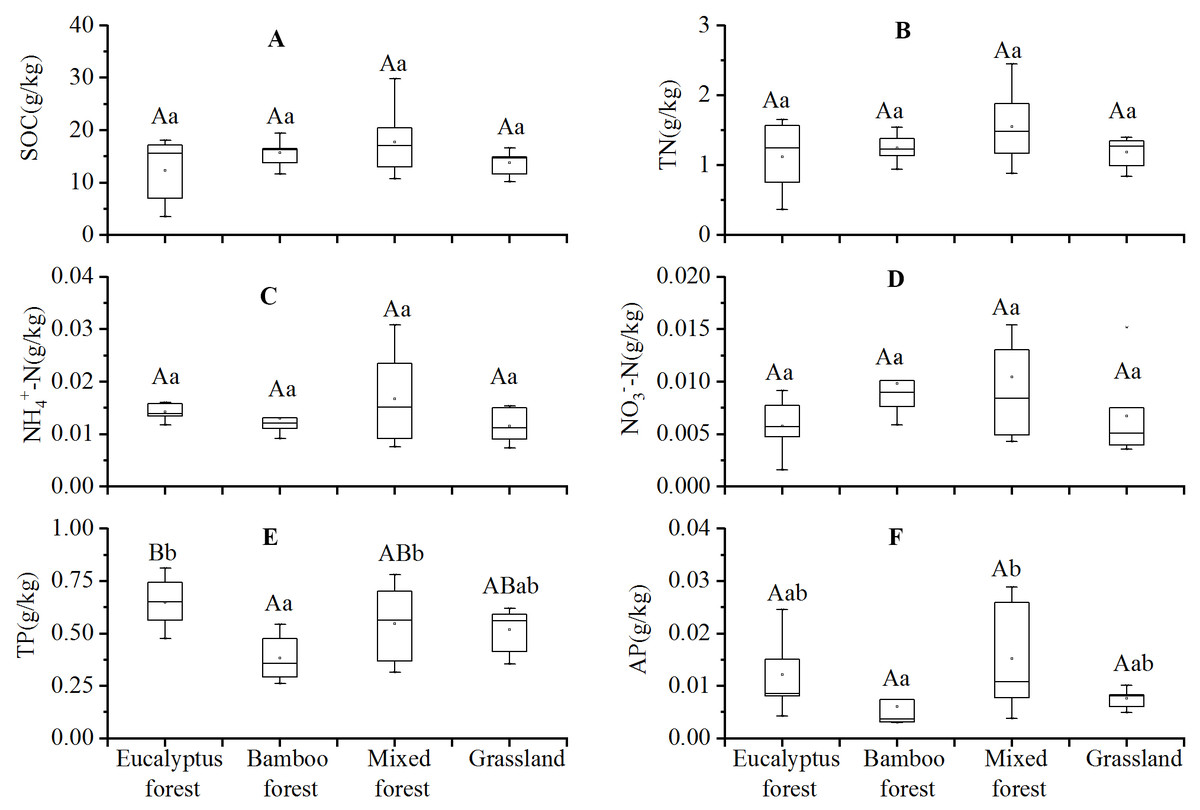
Figure 3: Riparian soil chemical properties under different riparian vegetation types.
(A) Soil organic carbon, (B) total nitrogen, (C) nitrate nitrogen, (D) ammonium nitrogen, (E) total phosphorus, (F) available phosphorus. Different upper and lower case letters among different vegetation types indicate significant difference at the 0.01 and 0.05 levels, respectively.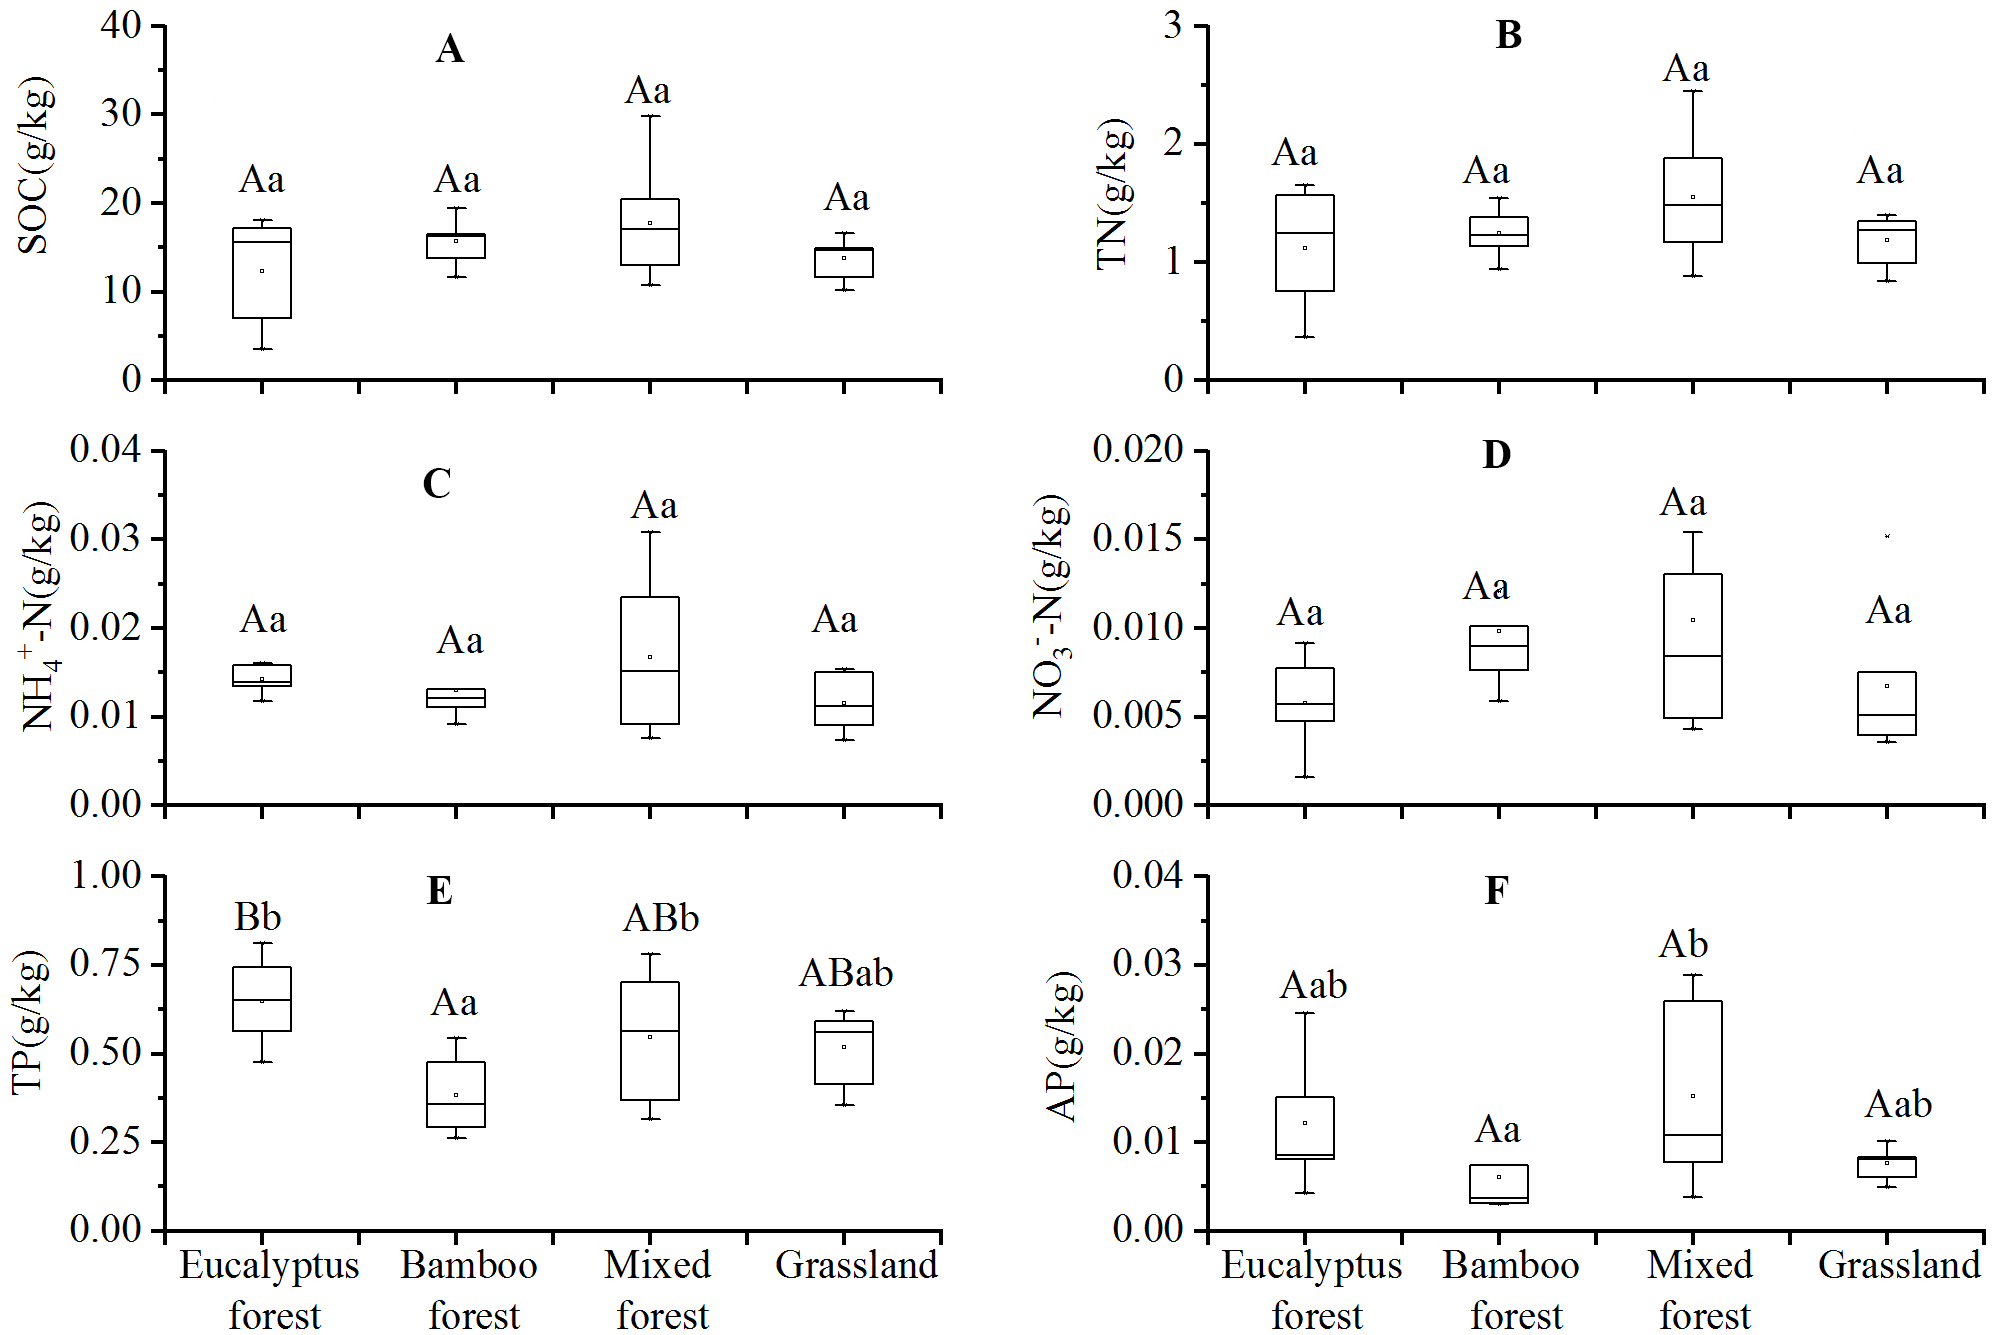
Relationships between riparian soil physical and chemical properties
In the grasslands, we found that SOC, TN, and TP were significantly negatively correlated with percent sand (P < 0.05), and were significantly positively correlated with percent silt and clay (P < 0.05) (Table 2). In eucalyptus forests, we found a significant positive correlation between silt content and SOC (P < 0.05), as well as between silt content and TN (P < 0.01). In the same forest type, we found a significant negative correlation between silt content and NH4+-N (P < 0.05). Finally, in both bamboo forests and grasslands, soil clay content and AP were negatively correlated (P < 0.05), as were soil BD and TP.
Response of riparian soil properties to environmental factors
We found a strong correlation between soil chemical properties and environmental factors (Table 3). Tree cover, tree height, and shrub height were the most important factors influencing soil chemistry (Fig. 4). Specifically, shrub height and cover were highly positively correlated with TP, and tree cover and height were highly positively correlated with NO3−-N and AP. These results indicate that the relationship between soils and vegetation is likely stronger than that for soils and topographic variables.
Discussion
Riparian vegetation is commonly regarded as the sediments and nutrients filter at the final point in the landscape (Hale et al., 2014), and it can increase surface roughness and reduce the amount of particulate matters entering the river (De Souza et al., 2013; Whigham et al., 2017). However, the interception efficiency of riparian vegetation for sediments and nutrients is known to be highly dependent on total vegetation coverage (De Souza et al., 2013; Hale et al., 2014; Whigham et al., 2017). Moreover, soil surfaces with less vegetation suffer continuous degradation and erosion, which can lead to prolonged and relatively accelerated losses of soil particles (Carrick & Krüger, 2007). In this regard, bamboo and eucalyptus forests could show significant difference in maintaining soil structure and intercepting particulates.
Our results did not find significant differences in soils among the four riparian vegetation types. This is in spite of the fact that soil C and N content were influenced by vegetation type. However, the lack of variation in soil properties between vegetation types is relatively complex owing to the higher mobility of soil nutrients that are exported into and out of riparian zones through surface and groundwater flows. In addition to vegetation type, other factors such as slope, soil texture, and hydrological process may vary considerably between sites as well. All of these factors can influence nutrient retention of riparian vegetation. Additionally, nutrient loads from the adjacent landscape can influence the nutrient content of the sampling site (Ye et al., 2017).
| Soil properties | Eucalyptus forest | Bamboo forest | Mixed forest | Grassland | ||||||||||||
|---|---|---|---|---|---|---|---|---|---|---|---|---|---|---|---|---|
| Bulk density (g/cm3) | Sand (%) | Silt (%) | Clay (%) | Bulk density (g/cm3) | Sand (%) | Silt (%) | Clay (%) | Bulk density (g/cm3) | Sand (%) | Silt (%) | Clay (%) | Bulk density (g/cm3) | Sand (%) | Silt (%) | Clay (%) | |
| SOC (g/kg) | −0.78 | −0.58 | 0.94* | −0.09 | −0.06 | 0.04 | −0.09 | 0.17 | −0.2 | 0.35 | −0.32 | −0.33 | −0.72 | −0.87* | 0.83* | 0.74 |
| TN (g/kg) | −0.83 | −0.55 | 0.97** | −0.14 | 0.02 | 0.14 | −0.15 | −0.02 | −0.08 | 0.29 | −0.25 | −0.29 | −0.62 | −0.86* | 0.81 | 0.77 |
| NH4+-N (g/kg) | 0.87 | 0.77 | −0.90* | −0.17 | 0.63 | 0.49 | −0.59 | 0.14 | 0.04 | −0.42 | 0.34 | 0.47 | −0.64 | −0.43 | 0.52 | 0.14 |
| NO3−-N (g/kg) | −0.36 | −0.21 | 0.7 | −0.32 | −0.58 | 0.00 | 0.07 | −0.33 | 0.00 | 0.6 | −0.51 | −0.63 | −0.83* | −0.32 | 0.43 | 0.00 |
| TP (g/kg) | 0.24 | −0.47 | −0.38 | 0.86 | −0.89** | −0.14 | 0.18 | −0.09 | −0.33 | 0.09 | −0.26 | 0.3 | −0.62 | −0.92* | 0.85* | 0.85* |
| AP (g/kg) | 0.42 | 0.87 | −0.09 | −0.94* | −0.06 | −0.06 | 0.07 | −0.04 | 0.44 | 0.29 | −0.09 | −0.62 | 0.18 | 0.01 | −0.12 | 0.24 |
| Axes | 1 | 2 | 3 | 4 | Total variance |
|---|---|---|---|---|---|
| Eigenvalues | 0.550 | 0.001 | 0 | 0 | 1 |
| Species-environment correlations | 0.742 | 0.728 | 0.693 | 0 | |
| Cumulative percentage variance | |||||
| of species data | 55 | 55.1 | 55.1 | 0 | |
| of species-environment relation | 99.9 | 100 | 100 | 0 |
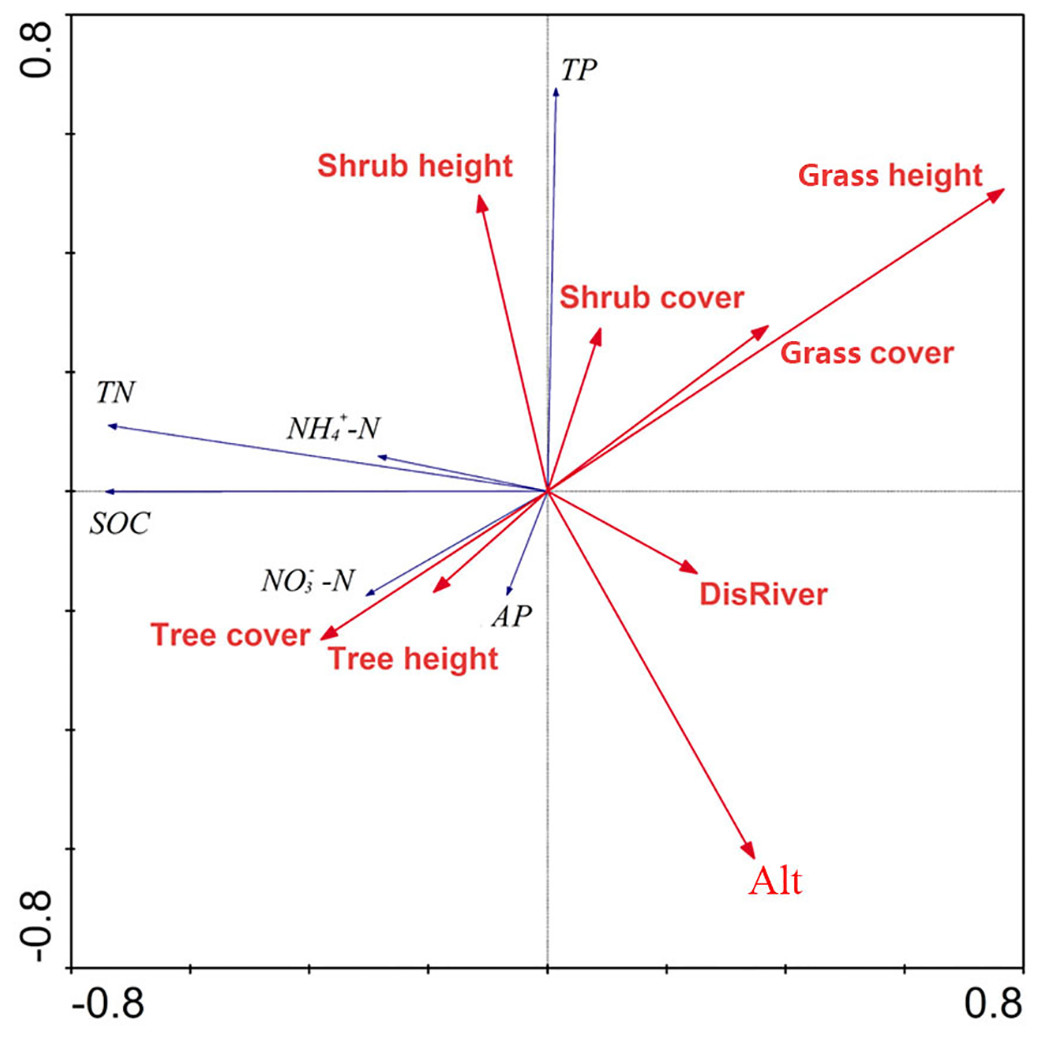
Figure 4: RDA biplot representing the relationship between riparian soil chemical variables and environmental variables.
Abbreviations of soil chemical parameters and environmental variables: SOC, soil organic carbon; TN, total nitrogen; NH-N, ammonium nitrogen; NO-N, nitrate nitrogen; AP, available phosphorus; DisRiver, distance to the centre of the river; Alt, altitude.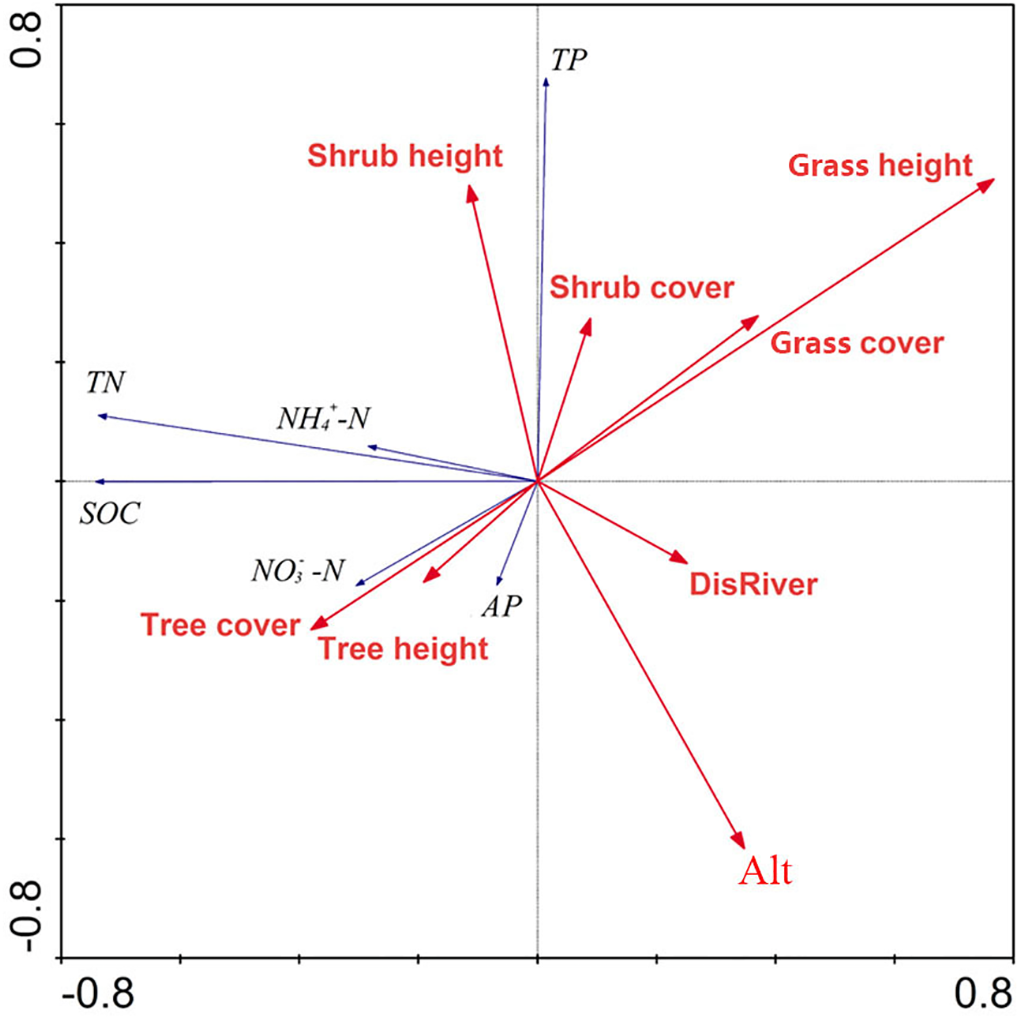
In comparison to soil carbon and nitrogen, soil phosphorus was highly variable among the different vegetation types, suggesting that soil phosphorus retention is higher in riparian zones than soil carbon and nitrogen. The underlying role of riparian vegetation in mediating soil nutrients is critical for restoration of degraded riparian zones. Likewise, it is imperative that we develop a better understanding of the role of riparian vegetation in intercepting and immobilizing soil nutrients prior to their lateral flow into rivers.
Previous studies have shown that soil particle fraction can influence soil nutrient content. Likewise, the distribution and transformation of soil nutrients can also influence soil texture (Jiao et al., 2014). In the current study, we found significant correlations between soil particle size and C, N and P in both grasslands and eucalyptus forests. However, correlations among the four vegetation types were different with other research (Jiao et al., 2014; Ye et al., 2017).
Among the soil chemical properties that were related to environmental variables, NO3−-N, TP and AP were strongly correlated with community structure, especially for the forest community. De Souza et al. (2013) found that forest structural variables can explain variation in phosphorus concentrations. Specifically, dissolved phosphorus increases along streams that have mature forests with an abundance of large trees. In contrast, AP, which was negatively correlated with grass cover and height, is likely controlled by structural characteristics of grasslands. Other studies have indicated that dissolved phosphorus increases rapidly in early succession, reaches a maximum, and then slowly declines to zero as a steady state is approached (Roberts, Stutter & PM, 2012). Thus, dissolved P is more likely to be removed along riparian buffers strips than for particulate phosphorus. This is likely because dissolved reactive phosphorus is highly variable along P-saturated buffer zones (De Souza et al., 2013; Hoffmann et al., 2009). At the same time, remobilisation and release of P from mature forest stands occurs at later stages of succession (Hoffmann et al., 2009). As a result, forest stands with large trees retain less P than dense stands with small trees (De Souza et al., 2013).
We found that variation in N was basically consistent with that of red soils, the typical soil type in the mid-tropical zone of China (Fan et al., 2014). Specifically, soil NO3−-N was more mobile and leachable than NH4+-N (Chen & Mulder, 2007; Wang et al., 2017). Riparian zones are frequently subjected to flooding, which can modify alluvial processes, disrupt pedogenic processes, and contribute to soil depletion (Wang et al., 2017). This may influence the effects of vegetation type on soil nutrients, which is especially true for organic carbon and nitrogen (Wang et al., 2017). Indeed, we found that SOC and TN did not vary amongst different vegetation types, and there was a weak correlation between vegetation and topographical factors. Therefore, more factors should be considered when deciphering the effects of vegetation type on variations in soil properties.
Conclusions
Our study highlights the influence of vegetation type on soil physical and chemical properties, and identifies the key environmental factors affecting the concentration of soil properties. Our results indicate that soil properties along the riparian zones were influenced by vegetation type, and many soil physical and chemical properties were significantly correlated with one another. Likewise, the RDA results showed that structural characteristics of plant communities were the major factors affecting soil nutrients, especially TP, NO3−-N, and AP. Together, our findings provide insight into the relationships among riparian soils, vegetation, and topographical variables. We expect that these findings will help guide riparian restoration practices in the future.