
Effects of low temperature at stem elongation stage on the development, morphology, and physicochemical properties of wheat starch
- Published
- Accepted
- Received
- Academic Editor
- Genlou Sun
- Subject Areas
- Agricultural Science, Biochemistry, Developmental Biology, Food Science and Technology, Plant Science
- Keywords
- Low temperature, Wheat, Starch granule, Development, Physicochemical properties
- Copyright
- © 2020 Yu et al.
- Licence
- This is an open access article distributed under the terms of the Creative Commons Attribution License, which permits unrestricted use, distribution, reproduction and adaptation in any medium and for any purpose provided that it is properly attributed. For attribution, the original author(s), title, publication source (PeerJ) and either DOI or URL of the article must be cited.
- Cite this article
- 2020. Effects of low temperature at stem elongation stage on the development, morphology, and physicochemical properties of wheat starch. PeerJ 8:e9672 https://doi.org/10.7717/peerj.9672
Abstract
The low temperature in spring is a meteorological problem in wheat production because it leads to yield reduction and alteration of wheat quality. In this study, an artificial low-temperature treatment (LTT) at the stem elongation stage was implemented to investigate the starch granule development and physical and chemical properties of wheat starch. Results showed that the agronomic traits of spike, such as spike length, spikelet number per spike, and grain number per spikelet, decreased after LTT. LTT promoted the development of starch granules in developing grains at 15 days post-anthesis, resulting in increased B-type granules and reduced C-type granules with an irregular shape in mature grains. The swelling power of the starch granules was reduced, but their solubility was enhanced by LTT. The proportion of the amorphous structure within the granules increased, but the crystalline component decreased after LTT, leading to a significant reduction in the relative degree of crystallinity and double- and single-helix structures. Three types of hydrolysis showed that starch in LTT was easy to hydrolyze, resulting in a high degree of hydrolysis. The findings suggest that low temperature at the stem elongation stage can not only reduce the yield parameters of spike but also alter starch accumulation, thereby affecting the processability and structure characteristics of starch in wheat grains.
Introduction
Low temperature in spring is a serious meteorological problem in forestry and agriculture. It refers to the weather and climate phenomenon in which crops in a large area are continuously damaged by frost in spring due to frequent attacks of strong, cold air (Li et al., 2015). Research has shown that low temperature in spring reduces wheat yield by 20%–85% (Livingston et al., 2016; Zhong et al., 2008). The freezing damage caused by low temperature frequently occurs in Huang Huai and Yellow River basin of China (Li et al., 2015). In the years with the most severe frost (e.g., 1953 and 1954), the affected area was more than 3.5 M hm−2, with several provinces having only 30%–50% yield production (Feng et al., 1999). This decrease in production was due to the influence of low temperature on the development of young spike, photosynthesis, and carbohydrate metabolism (Kang et al., 2012; Thakur & Nayyar, 2013; Zeng et al., 2011). Wheat yield is determined by the number of spikes per ground unit, number of grains per spike, and 1,000-grain weight (Rasaei et al., 2017). Zheng et al. (2018) reported that low temperature decreases the number of grains per spike but has no obvious effect on the 1,000-grain weight of winter wheat. Starch is the main storage material in wheat endosperm, and it accounts for approximately 70% of the dry weight of grain (Cao et al., 2015). In endosperm cells, the starch matrix accumulates as a semi-crystalline structure in an organelle called the amyloplast or starch granule (Zhang et al., 2013); thus, amyloplast development directly determines the yield and quality of wheat. Many studies have shown that environmental factors, such as drought stress, waterlogging, fertilizer level, and temperature, can affect the amyloplast development, starch accumulation, or physicochemical properties of starch. For example, Yu et al. (2016) found that drought stress induces a high percentage of B-type starch granules at 18 days post-anthesis (DPA) and increases the swell power and hydrolysis degrees of wheat starch. He et al. (2012) indicated that the composition, morphology, and physicochemical properties of triticale starch can be affected by drought stress. Under waterlogging conditions, an increased nitrogen level reduces wheat starch accumulation (Fan et al., 2005). Most of the studies on the effect of temperature on starch accumulation in wheat grain focused on high temperature, and only a few reports concentrated on the relationship between low temperature and starch accumulation. Wang et al. (2012) reported that high temperature at post-anthesis reduces the grain starch content but increases the percentage of the number, surface area, and volume of B-type starch granules. Hurkman et al. (2003) and Zhao et al. (2008) arrived at the similar conclusion that high temperature decreases the starch content and reduces the duration of starch accumulation in wheat grains. At low-temperature conditions, the ratio of starch to sucrose in leaves decreases in winter and spring wheat (Savitch, Gray & Huner, 1997). Ahmed, Maekawa & Tetlow (2008) showed that low temperature during the grain–filling stage increases the amylose content but has no significant influence on the total starch content in rice. Although the effect of low temperature in spring on wheat yield has been confirmed in previous studies, the effect of low temperature in spring on accumulation, development, and physicochemical properties of wheat starch still lacks research. The physicochemical properties of wheat starch are influenced by many factors, such as amylose and amylopectin content, gelatinization, crystal structure, ordered-structure on the granule surface, and hydrolysis properties (Blazek & Copeland, 2008; Wang et al., 2018; Van Hung et al., 2008); such factors are closely related to the application of wheat starch in food and non-food industries. The stem elongation stage is an important stage of wheat seeding from vegetative growth to reproductive growth period. At this time, if it encounters low temperature, the developmental process of wheat spike and grain will be significantly affected. In this study, an artificial low temperature was applied at the stem elongation stage to investigate the response of the accumulation, morphology, and physicochemical properties of wheat starch to low temperature in spring.
Materials & Methods
Plant material and low temperature treatment (LTT)
The high quality wheat cultivar Yangmai15 (crude protein content 10.24%) which was widely cultivated in the middle and lower reaches of the Yangtze River in Jiangsu province was provided by Lixiahe Agricultural Science Institute in Jiangsu Province. A pot experiment was conducted in the experimental field of Yangzhou University (32°39′N, 119°42′E), Key Laboratory of Crop Genetics and Physiology of Jiangsu Province, from November 2018 to May 2019. LTT was implemented at the main stem node production (stem elongation stage) with the sub-stage 3.0 according to the website http://wheatdoctor.org/wheat-growth-stages-and-zadok-s-scale and observation under stereo microscope. A cryogenic room was used to maintain 75% relative humidity and 500 ppm of CO2 concentration. On the basis of the work of Herman et al. (2006) and Ji et al. (2017), the day and night temperatures in the cryogenic room were set to 0 °C (08:30–20:30) and −3 °C (20:30–08:30), respectively. This treatment was maintained for three days. Meanwhile, the plants for the normal temperature treatment (NTT) were grown in another room where the humidity and CO2 concentration were similar to those of LTT and the day and night temperatures were not less than 10 °C and 5 °C, respectively. The water and fertilizer supplies of the two groups were consistent throughout the growth period of wheat. At the anthesis stage, the floret at the base of the spikelet in the middle of the spike was marked with a marking pen and the single spike was marked with a plastic card to record the anthesis time.
Starch extraction
Mature wheat grains were harvested at approximately 48 DPA, and 20 g of the grains were soaked in distilled water at 25 °C for 12 h. The grains were completely ground in a tissue grinder after 0.05 mol L−1 of NaOH solution was added. The milling fluid was filtered through eight gauze layers. Subsequently, the filtrate was centrifuged at 3,000 × g for 5 min to remove the yellow layer that contained the protein gel, and the starch granules were cleaned and centrifuged again. These steps were repeated five to six times until no yellow protein gel remained above the starch granules. Afterward, the starch granules were degreased with ethyl ether twice for 1 h each time, and the samples were dried to a constant weight at 40 °C and stored in a moisture-proof box. These extracted starches were used for amylose content determination, structural observation and analysis of size distribution, crystal structure, ordered structure of the external region in granules and hydrolysis properties.
Determination of soluble sugar and total starch
Mature wheat grains were ground in a mortar and filtered through a 100-mesh screen. The soluble sugar and total starch content were determined using the method of anthrone—H2SO4 and HClO4 hydrolysis adopted by McCready et al. (1950) and Gao et al. (2014), respectively.
Amylose content determination
The amylose content was determined using the modified method of Konik-Rose et al. (2007). In brief, 20 mg of extracted starch was added to 5 mL of urea—dimethyl sulfoxide and heated in a metal bath for 1 h at 95 °C. Afterward, 1 mL of this solution and 1 mL of the I2/KI solution (0.2% I2 + 2% KI) were added to a volumetric flask and diluted to 50 mL with distilled water. After 20 min of the reaction, the absorbance of the solution was determined with a spectrophotometer (UV-1900, Shimadzu, Japan) at 620 nm. The amylose content was calculated with a standard curve calibrated by amylopectin (A8515, Sigma-Aldrich, USA) and amylose (A0512, Sigma-Aldrich, USA).
Structural observation of wheat endosperm
Wheat grains were collected at 5, 10, 15, 20, 25, and 30 DPA. A 2-mm-thick slice was cut transversely at the middle of the grain and immediately soaked in a fixative containing 2.5% glutaraldehyde in 0.01 M phosphate buffer (pH 7.2) at 4 °C for 12 h. In succession, the samples were rinsed with phosphate buffer, dehydrated by gradient ethanol, replaced by propylene oxide, and infiltrated and embedded in low-glutinosity Spurr resin. Then, the samples were polymerized at 70 °C to form a resin-embedded block, cut into a 1 µm slice on an ultramicrotome (Ultracut R, Leica, Germany), and stained with 0.05% methyl violet for 10 min. The central region occupying the largest part of the endosperm was photographed under a microscope (DMLS, Leica, Germany).
Calculation of granule area and size distribution
The relative area of the starch granules in the microscope image was calculated using Photoshop (CS6, Adobe Systems Software Ireland Ltd., USA) and Image-Pro Plus (Version 6.0, Media Cybernetics, USA) software. Each sample had three independent replicate images.
Granule size distribution was analyzed by mixing 20 mg of starch with 50% glycerol and photographed under a microscope at 200× magnification. Granule size, which was defined here as the longest diameter, was measured using Image-Pro Plus software. Granule size distribution was analyzed with Origin software (Origin Pro 8 SR3, OriginLab, USA). Each sample contained 3,000 calculated granules, which were divided into three individual replicates. The maximum, minimum, and average granule sizes were recorded.
For scanning electron microscopy observation, 5 mg of starch was diluted with 500 µL of ethanol. Exactly 20 µL of the mixture was added to the groove in the sample stage and dried for 1 h. After the samples were vacuum sprayed, they were observed and photographed under a scanning electron microscope (S4800, Hitachi, Japan).
Determination of swelling power and solubility
A total of 0.1 g of starch (W1) was suspended in 3 mL of distilled water in a centrifuge tube (W2) that was weighed beforehand, and the suspension was heated in a metal bath for 1 h with temperature gradients of 60 °C, 70 °C, 80 °C, 90 °C, and 100 °C. After centrifugation at 5,000× g for 5 min, the supernatant was discarded, and the retained gel precipitate was weighed with the centrifuge tube (W3). Then, the starch gel in the tube was dried to a constant weight (W4) at 40 °C. Swelling power and solubility were calculated as follows: swelling power (g/g) = (W3 − W2)/(W4 − W2) and solubility (%) = [W1 − (W4 − W2)] × 100%/W1.
Crystal structure analysis
For calculating the relative degree of crystallinity (RDC), starch was analyzed with an X-ray diffractometer (XRD; D8, Bruker, Germany) with 200 mA of working current and 40 kV of voltage. The starch sample was added to the groove of the sample stage and compacted using a slide glass. The diffraction angle (2θ) scanning region of XRD was from 4° to 40° at a step size of 0.6 s. After the diffraction pattern was recorded, the crystal area (CA) and amorphous area (AA) were calculated using Photoshop and Image-Pro Plus software. Afterward, the RDC was obtained as follows: RDC (%) = CA × 100%/(CA + AA).
For analysis of crystalline and amorphous structures, starch granules were analyzed with a solid-state 13C cross-polarization/magic angle spinning nuclear magnetic resonance (13C CP/MAS NMR) spectrometer (Avance III 400 MHz, Bruker BioSpin International AG, Germany). Amorphous starch was prepared using rice (Oryza sativa L.) starch on the basis of a previously reported method (Atichokudomchai, Varavinit & Chinachoti, 2004). The starch granules were added to the 7 mm ZrO2 rotor and spun at an operating frequency of 7.5 kHz. The chemical shift of the spectrum was recorded with reference to tetramethylsilane at 0 ppm. Then, the crystalline spectrum was obtained by subtracting the amorphous spectrum from the native starch spectrum. The peak area of the C1 region was recorded by curve fitting using Peakfit software (version 4.12, SYSTAT, USA). The areas of four peaks at approximately 99.5, 100.4, 101.6, and 102.9 ppm were recorded to calculate the proportion of amorphous, crystalline, and double- and single-helix regions.
Analysis of the ordered structure of the external region in starch granules
The ordered structure of the external region in the starch granules was analyzed using a Fourier transform infrared (FTIR) spectrometer equipped with an attenuated total reflectance (ATR) system. The mixture of starch granules (30 mg) and distilled water (25 µL) was added to the sample stage of the ATR–FTIR system. The original spectra were recorded by subtraction in the baseline region from 1,200 cm−1 to 800 cm−1 and deconvoluted with a half-width of 19 cm−1 and a resolution enhancement factor of 1.9 in accordance with the method of Sevenou et al. (2002). The infrared absorbance of three peak points at approximately 1,045, 1,022, and 995 cm−1 was measured by calculating the vertical distance from the baseline to the peak point. Then, the ratio of 1,045/1,022 cm−1 and 1,022/995 cm−1 was calculated to analyze the external region of starch granules.
Hydrolysis properties
The hydrolysis properties of starch were investigated using hydrochloric acid and two enzymes, namely, porcine pancreatic α-amylase (PPA; ≥10 U/mg; A3176; Sigma-Aldrich, USA) and Aspergillus niger amyloglucosidase (AAG; ≥300 U/mg; A7095; Sigma-Aldrich, USA) following the method of Wang et al. (2018). The hydrolysis reactions for PPA and AAG were performed in a metal bath for 1, 2, 4, 8, 12, 24, 48, and 72 h at 37 °C and for 1, 2, 4, 6, 8, 12, 24, and 48 h at 55 °C, respectively. The reaction conditions for hydrochloric acid hydrolysis were 0.5, 1, 2, 4, 6, 10, 12, and 14 days at 35 °C. As soon as the reaction was completed, the sample was immediately cooled to 0 °C for 1 min and cryogenically centrifuged (4 °C) at 5,000 × g for 10 min. Afterward, the sugar content in the supernatant was determined to calculate the degree of starch hydrolysis. Each group of samples had three biological replicates.
Statistical analysis
Statistical analysis was conducted using SPSS software (version 19.0; IBM; USA) to compare the significant difference of the values between two groups at the p < 0.05 level (least significant difference method).
Results
Grain development and agronomic traits of wheat under low temperature
Figure 1A showed the grain morphology at different developmental stages in NTT and LTT. The grain size in LTT was larger than that in NTT at 5 DPA, and the difference between the two groups at 10 DPA was not evident. The grain in LTT at 15 DPA was greener than that in NTT, indicating that the pericarp of the grain in LTT was thinner, the light transmittance was better, and the color of the chloroplast in the endocarp was more obvious. The grain size in LTT at 20 DPA reached its maximum, which was remarkably larger than that in NTT. For NTT, the grain size reached the maximum value at 25 DPA and decreased afterward. From 20 DPA to 30 DPA, the grain color in LTT was more yellow than that in NTT.
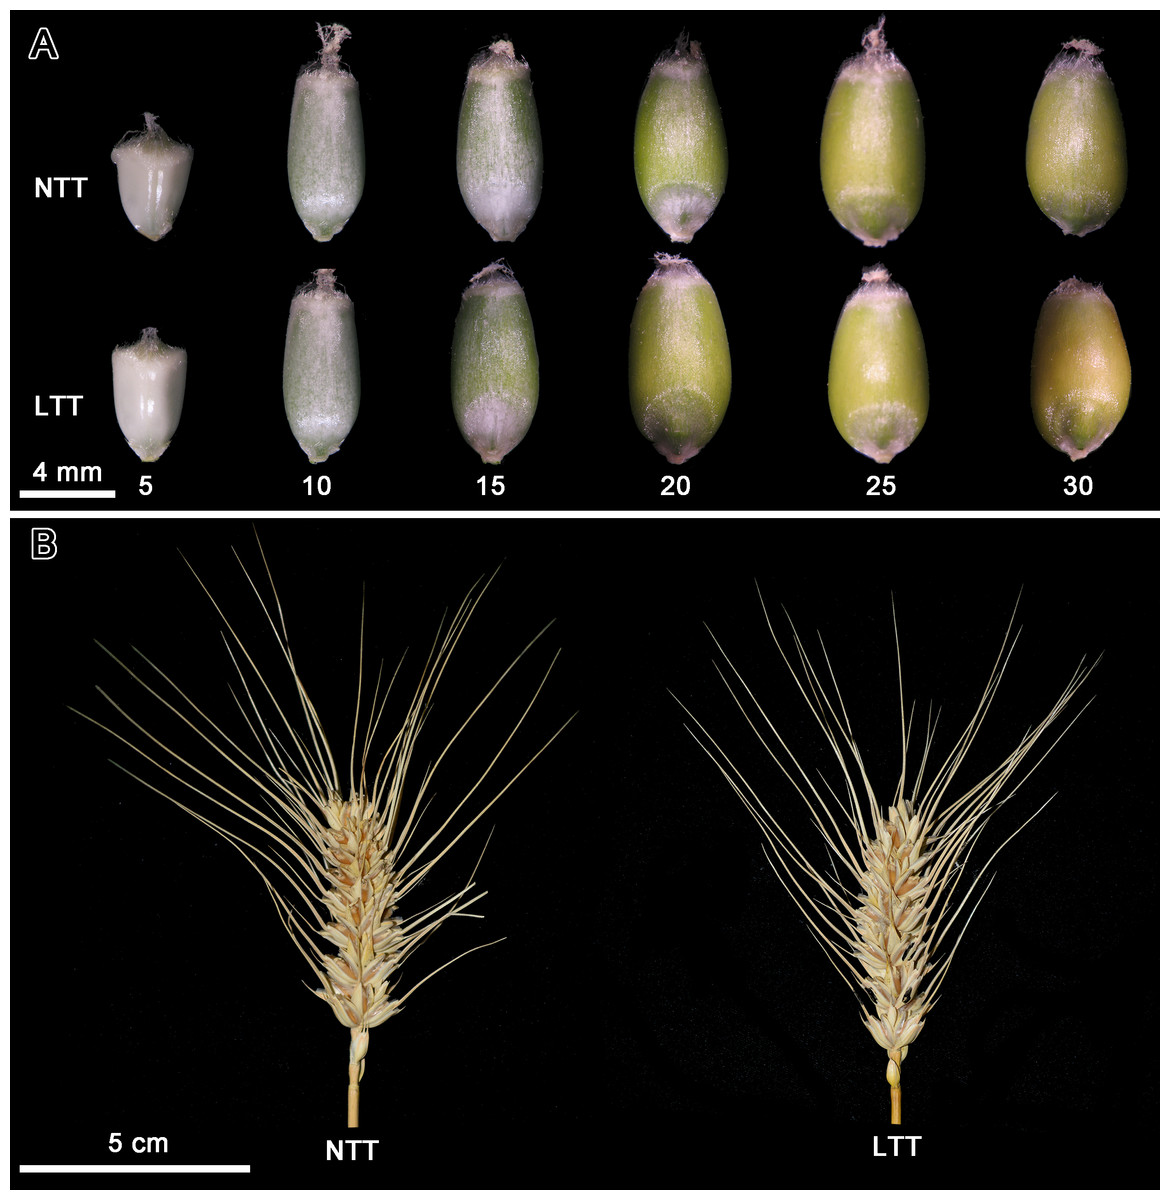
Figure 1: Grain development and spike morphology of wheat under low temperature treatment.
(A) Wheat grain development; different numbers under wheat grain indicated the DPA. (B) Spike morphology. NTT, normal temperature treatment. LTT, low temperature treatment.
At the harvesting period, the starch accumulation and agronomic traits of wheat spike were analyzed, and the results are shown in Table 1. LTT significantly increased the amylose content in wheat grains. For agronomic traits, LTT significantly reduced the spike length, spikelet number per spike, grain number per spike, grain number per spikelet, grain weight per spike and single grain weight (Table 1). Several parameters are shown in Fig. 1B. The spike in LTT was shorter and had a fewer number of spikelets than that in NTT.
Starch granule development under low temperature
The starch granules in wheat endosperm contained three distinct groups, namely, A, B, and C types. The A-type starch granules were lenticular- or disc-shaped and larger in size (≥10 µm) than the B-type granules (5–10 µm), which were polygon-shaped. The C-type starch granules were spherical in shape and very small in size (<5 µm; Cao et al., 2015). At 5 DPA, some small starch granules accumulated around the nucleus of the endosperm cells in LTT, and no starch granules were found in NTT (Figs. 2A and 2B). At 10 DPA, the starch granules increased remarkably in terms of quantity and size and were larger in LTT than in NTT (Figs. 2C and 2D). At 15 DPA, B-type starch granules appeared in the endosperm of LTT, and their number in LTT was larger than that in NTT (Figs. 2E and 2F). At 20 DPA, the amount of B-type small starch granules, which were polygonal in shape in LTT, was less than that in NTT (Figs. 2G and 2H). At 25 and 30 DPA, the small starch granules (B and C types) were polygonal or spherical in shape, and their number in LTT was less than that in NTT (Figs. 2I–2L). These C-type starch granules originated from the division and proliferation of one starch granule because the division gap between them could be clearly seen, as indicated by a red box in Figs. 2I–2L. From 10 DPA to 30 DPA, the endosperm cells in NTT contained more protein bodies than those in LTT (Figs. 2C–2L). The B-type starch granules in LTT appeared rapidly, but the final quantity was less than that in NTT.
| Treatment | Starch accumulation | Agronomic traits** | ||||||
|---|---|---|---|---|---|---|---|---|
| Total starch content (%)* | Amylose content (%)* | Spike length (cm) | Spikelet number per spike | Grain number per spike | Grain number per spikelet | Grain weight per spike (g) | Single grain weight (mg) | |
| NTT | 72.44 ± 1.2 7a | 19.89 ± 0.44a | 6.30 ± 0.66a | 15.20 ± 1.65a | 40.90 ± 5.53a | 2.63 ± 0.22a | 2.13 ± 0.31a | 52.09 ± 3.64a |
| LTT | 73.25 ± 1.93a | 22.19 ± 0.19b | 5.60 ± 0.52b | 13.88 ± 1.96b | 34.32 ± 3.09b | 2.42 ± 0.24b | 1.66 ± 0.22b | 48.25 ± 3.56b |
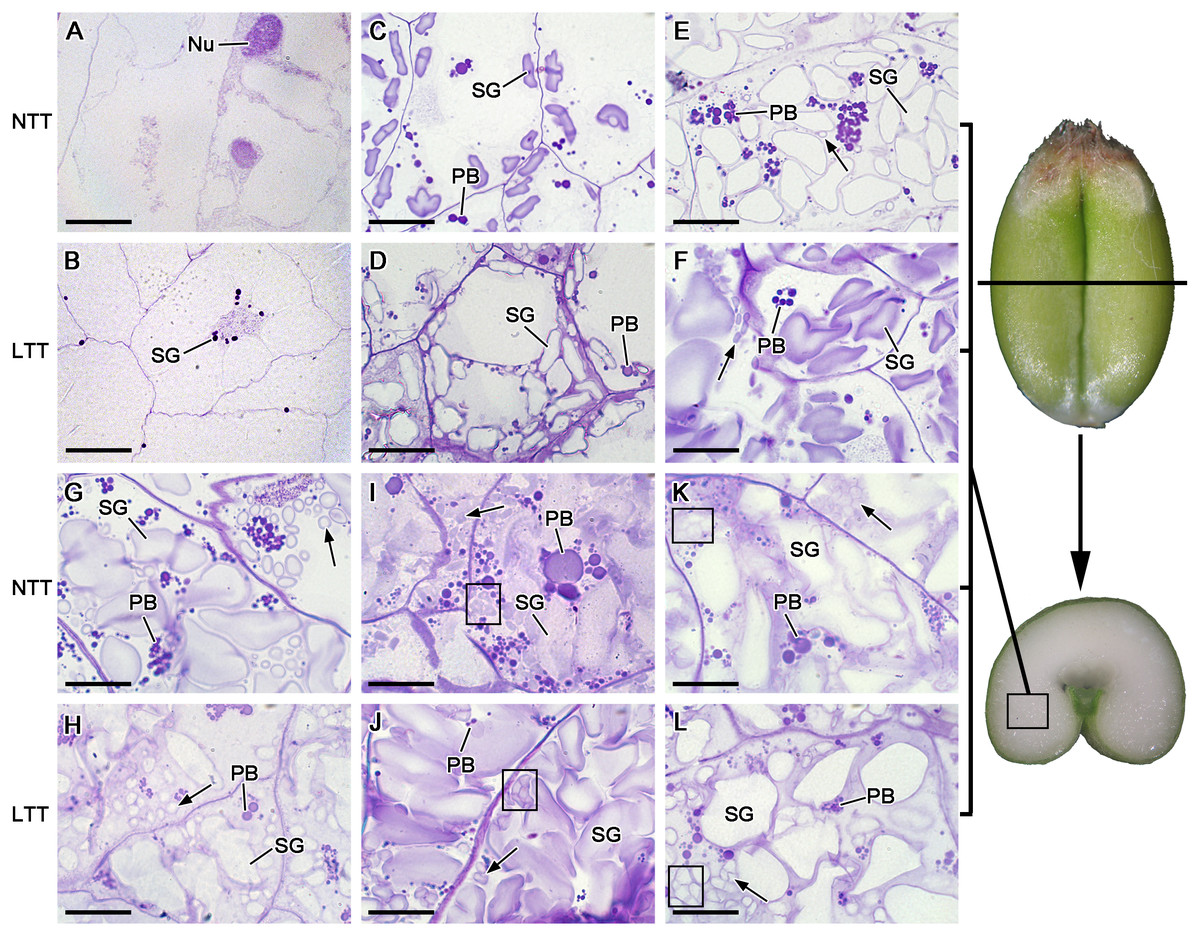
Figure 2: Starch granule development in wheat endosperm under low temperature.
(A, B) Five DPA, (C, D) 10 DPA, (E, F) 15 DPA, (G, H) 20 DPA, (I, J) 25 DPA, (K, L) 30 DPA. Arrows in the figures indicated B-type starch granules. Red box in I, J, K and L showed the C-type starch granules. Bars = 20 µm. NTT, normal temperature treatment. LTT, low temperature treatment. PB, protein body. SG, starch granule.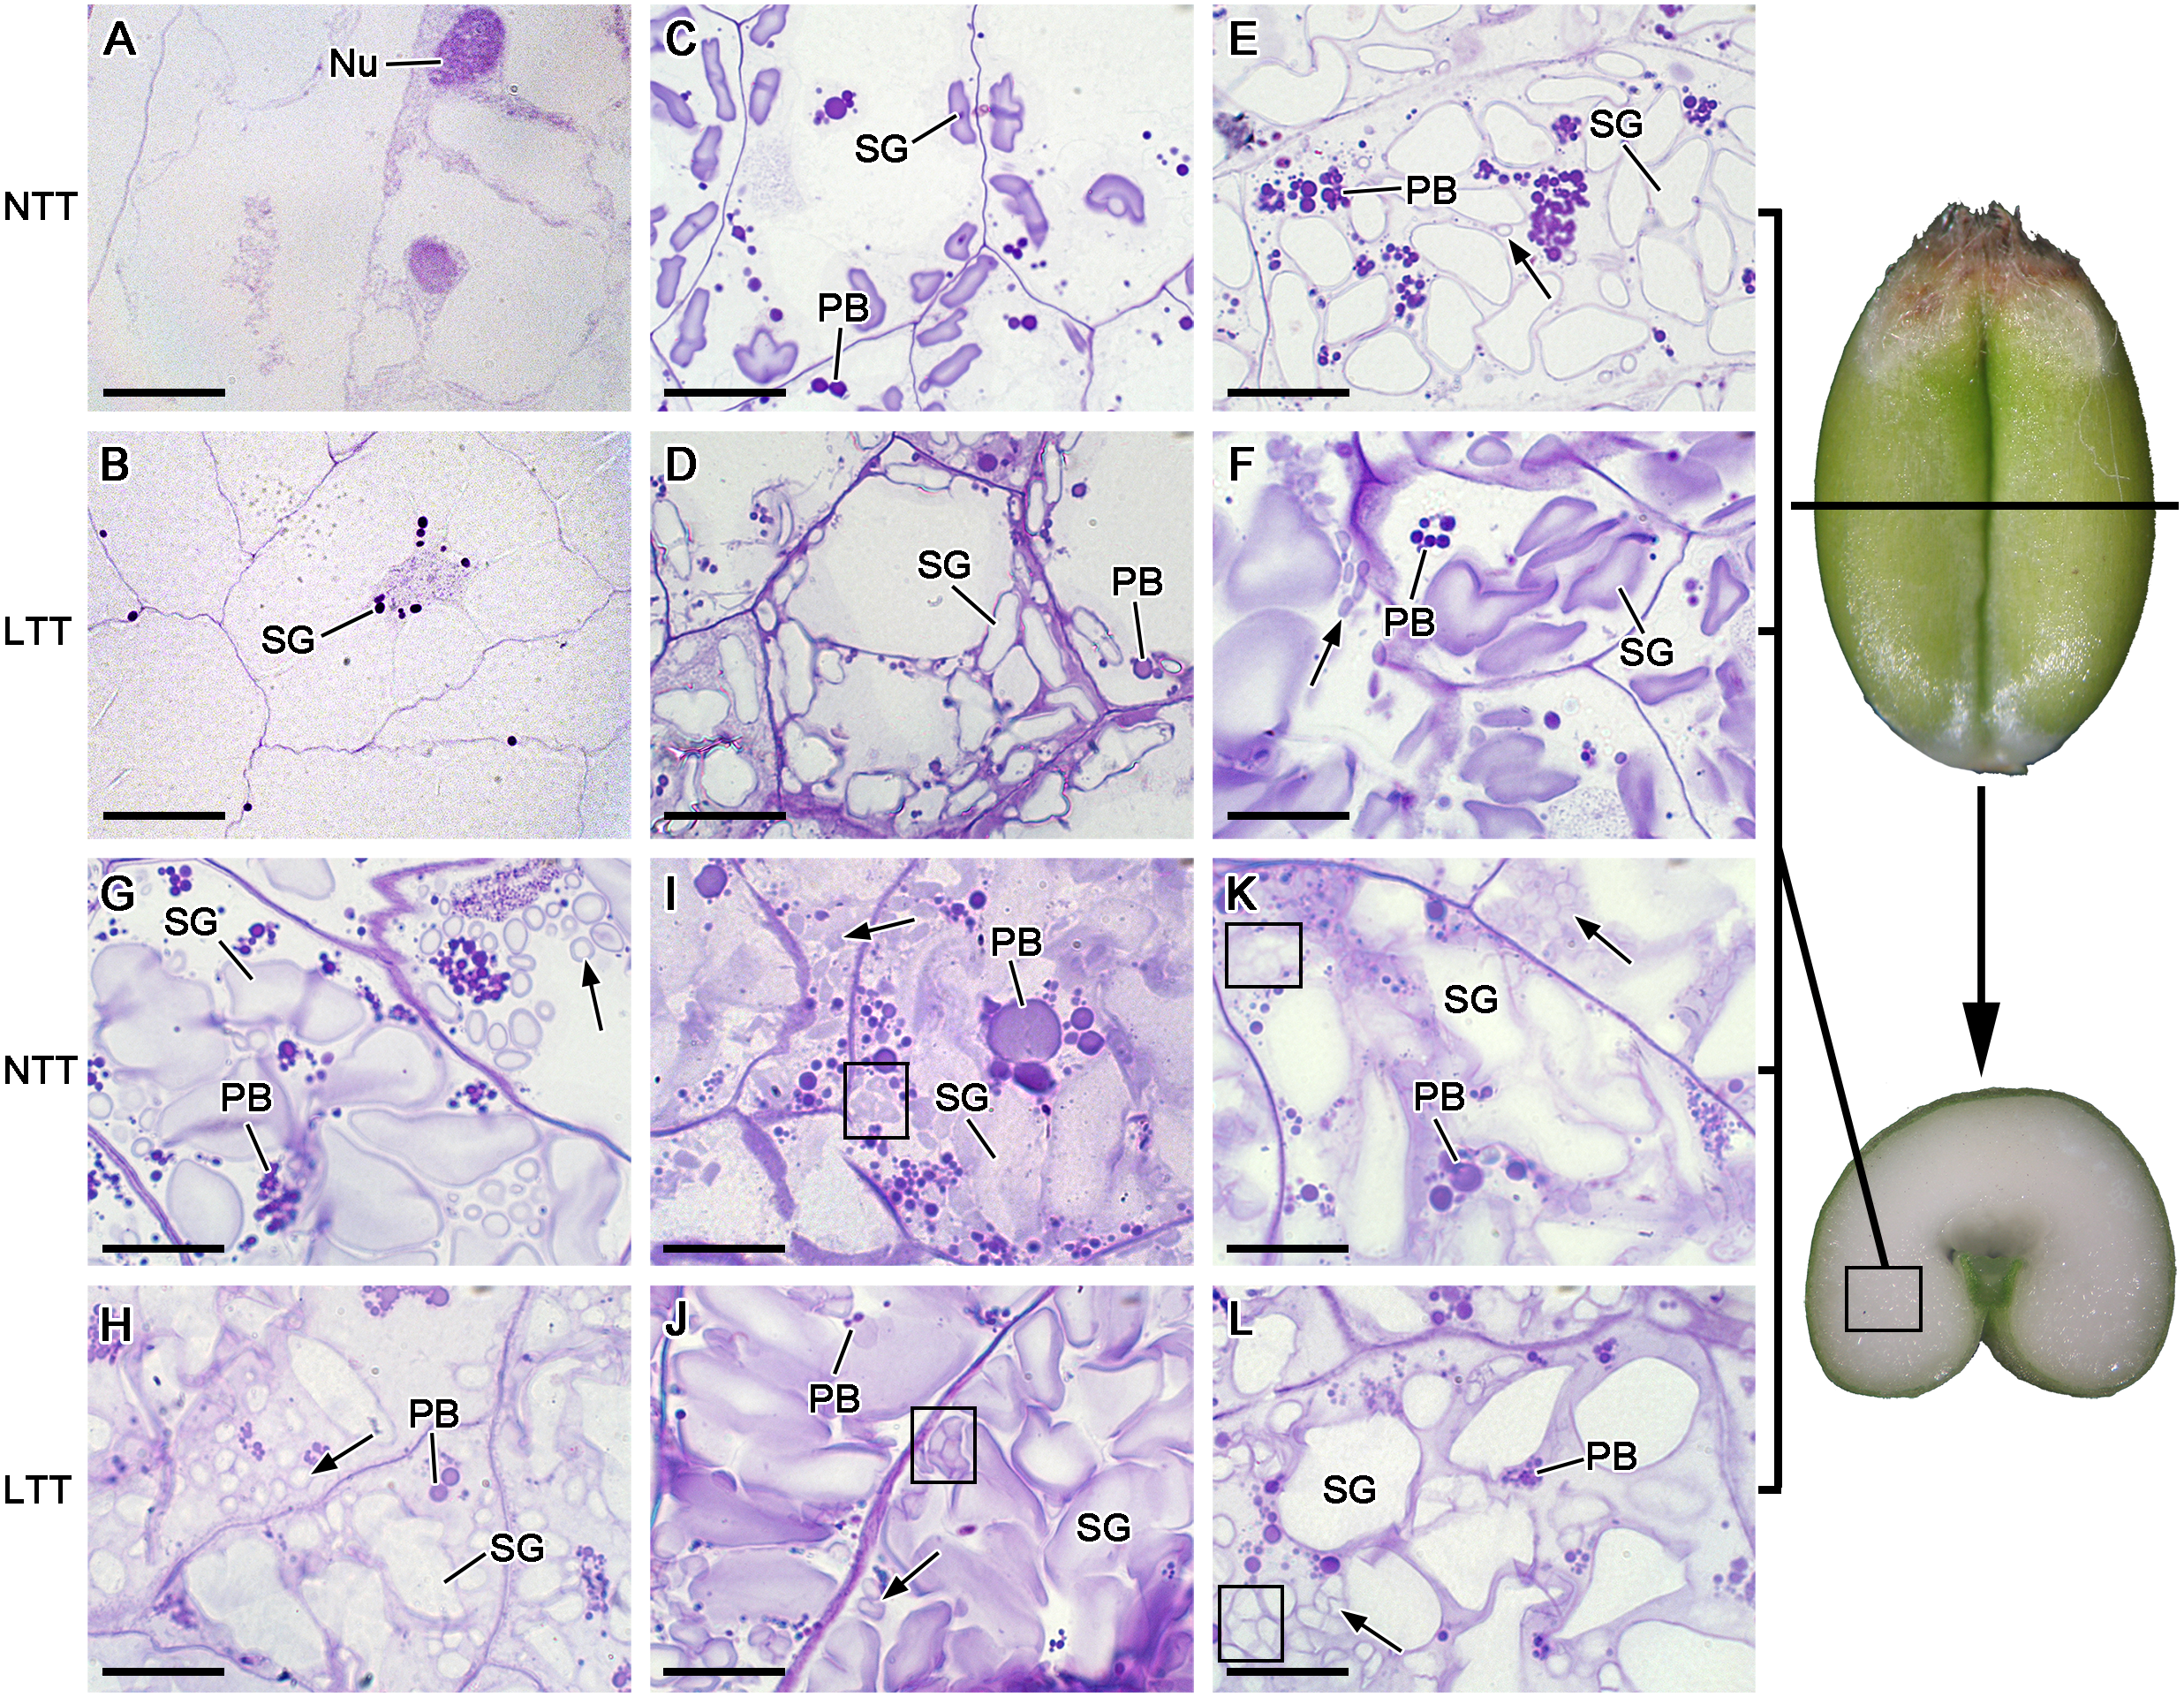
Morphology and size distribution of starch granules
The images obtained from the optical and scanning electron microscope and the size distribution of starch isolated from mature wheat grains are shown in Fig. 3. The starch groups in NTT contained more small starch granules than those in LTT (Figs. 3A and 3B). The results of the size distribution patterns (Figs. 3D and 3E) are consistent with these optical microscope images. Meanwhile, the starch granules in the two groups exhibited typical triple-peak patterns. LTT also affected the peak positions in the distribution pattern because the peaks in NTT were at 3, 21, and 29 µm, and those in LTT were at 3, 17, and 25 µm (Figs. 3E and 3F). The calculated proportion of A-, B-, and C-type starch granules showed that LTT decreased the amount of C-type starch granules but increased the A- and B-type starch granules (Fig. 3C). This conclusion was made on the basis of the scanning electron microscopy images, which revealed that NTT contained more irregular small starch granules (i.e., C-type starch granules) than LTT did (Figs. 3F and 3G). Such a finding is similar to the accumulation characteristic of starch granules in developing wheat grain at 20 and 30 DPA (Figs. 2I–2L).
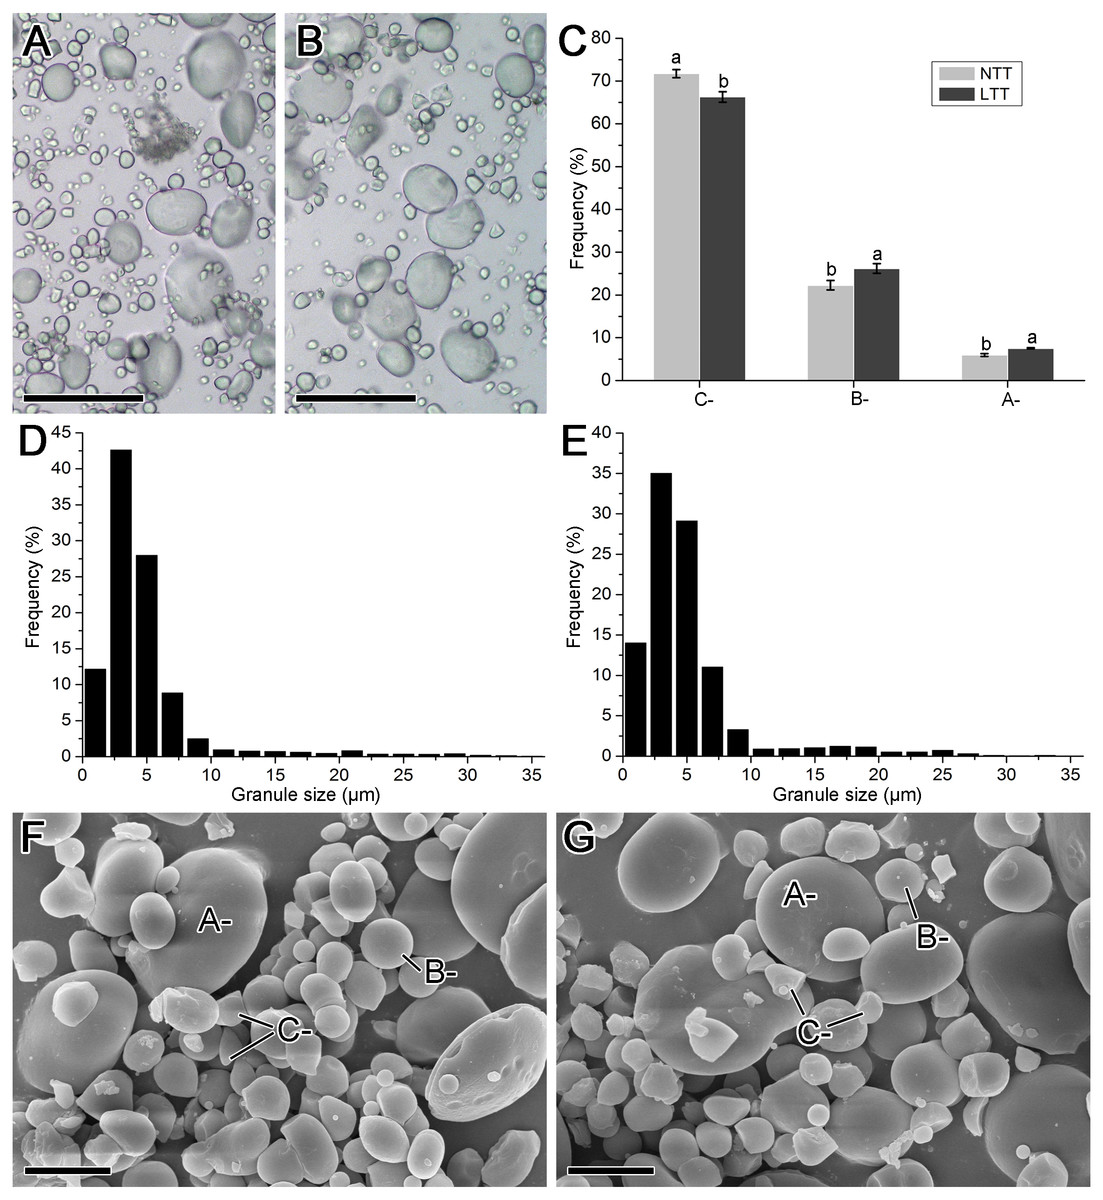
Figure 3: Morphology and size distribution of starch granule.
(A, D, F) Normal temperature treatment. (B, E, G) Low temperature treatment. (A, B) Optical microscope image; bars = 50 µm. (C) The ratio of A-, B- and C-type starch granule. (D, E) Granule size distribution; each size distribution pattern was obtained from the size calculation of 2,000 starch granules. (F, G) Scanning electron microscope image; bars = 10 µm. Different lowercase above diagram in C showed a significant difference between normal temperature treatment and low temperature treatment at p < 0.05 level, as determined by LSD. A-, B- and C- indicated the A-, B- and C-type starch granules, respectively. NTT, normal temperature treatment. LTT, low temperature treatment.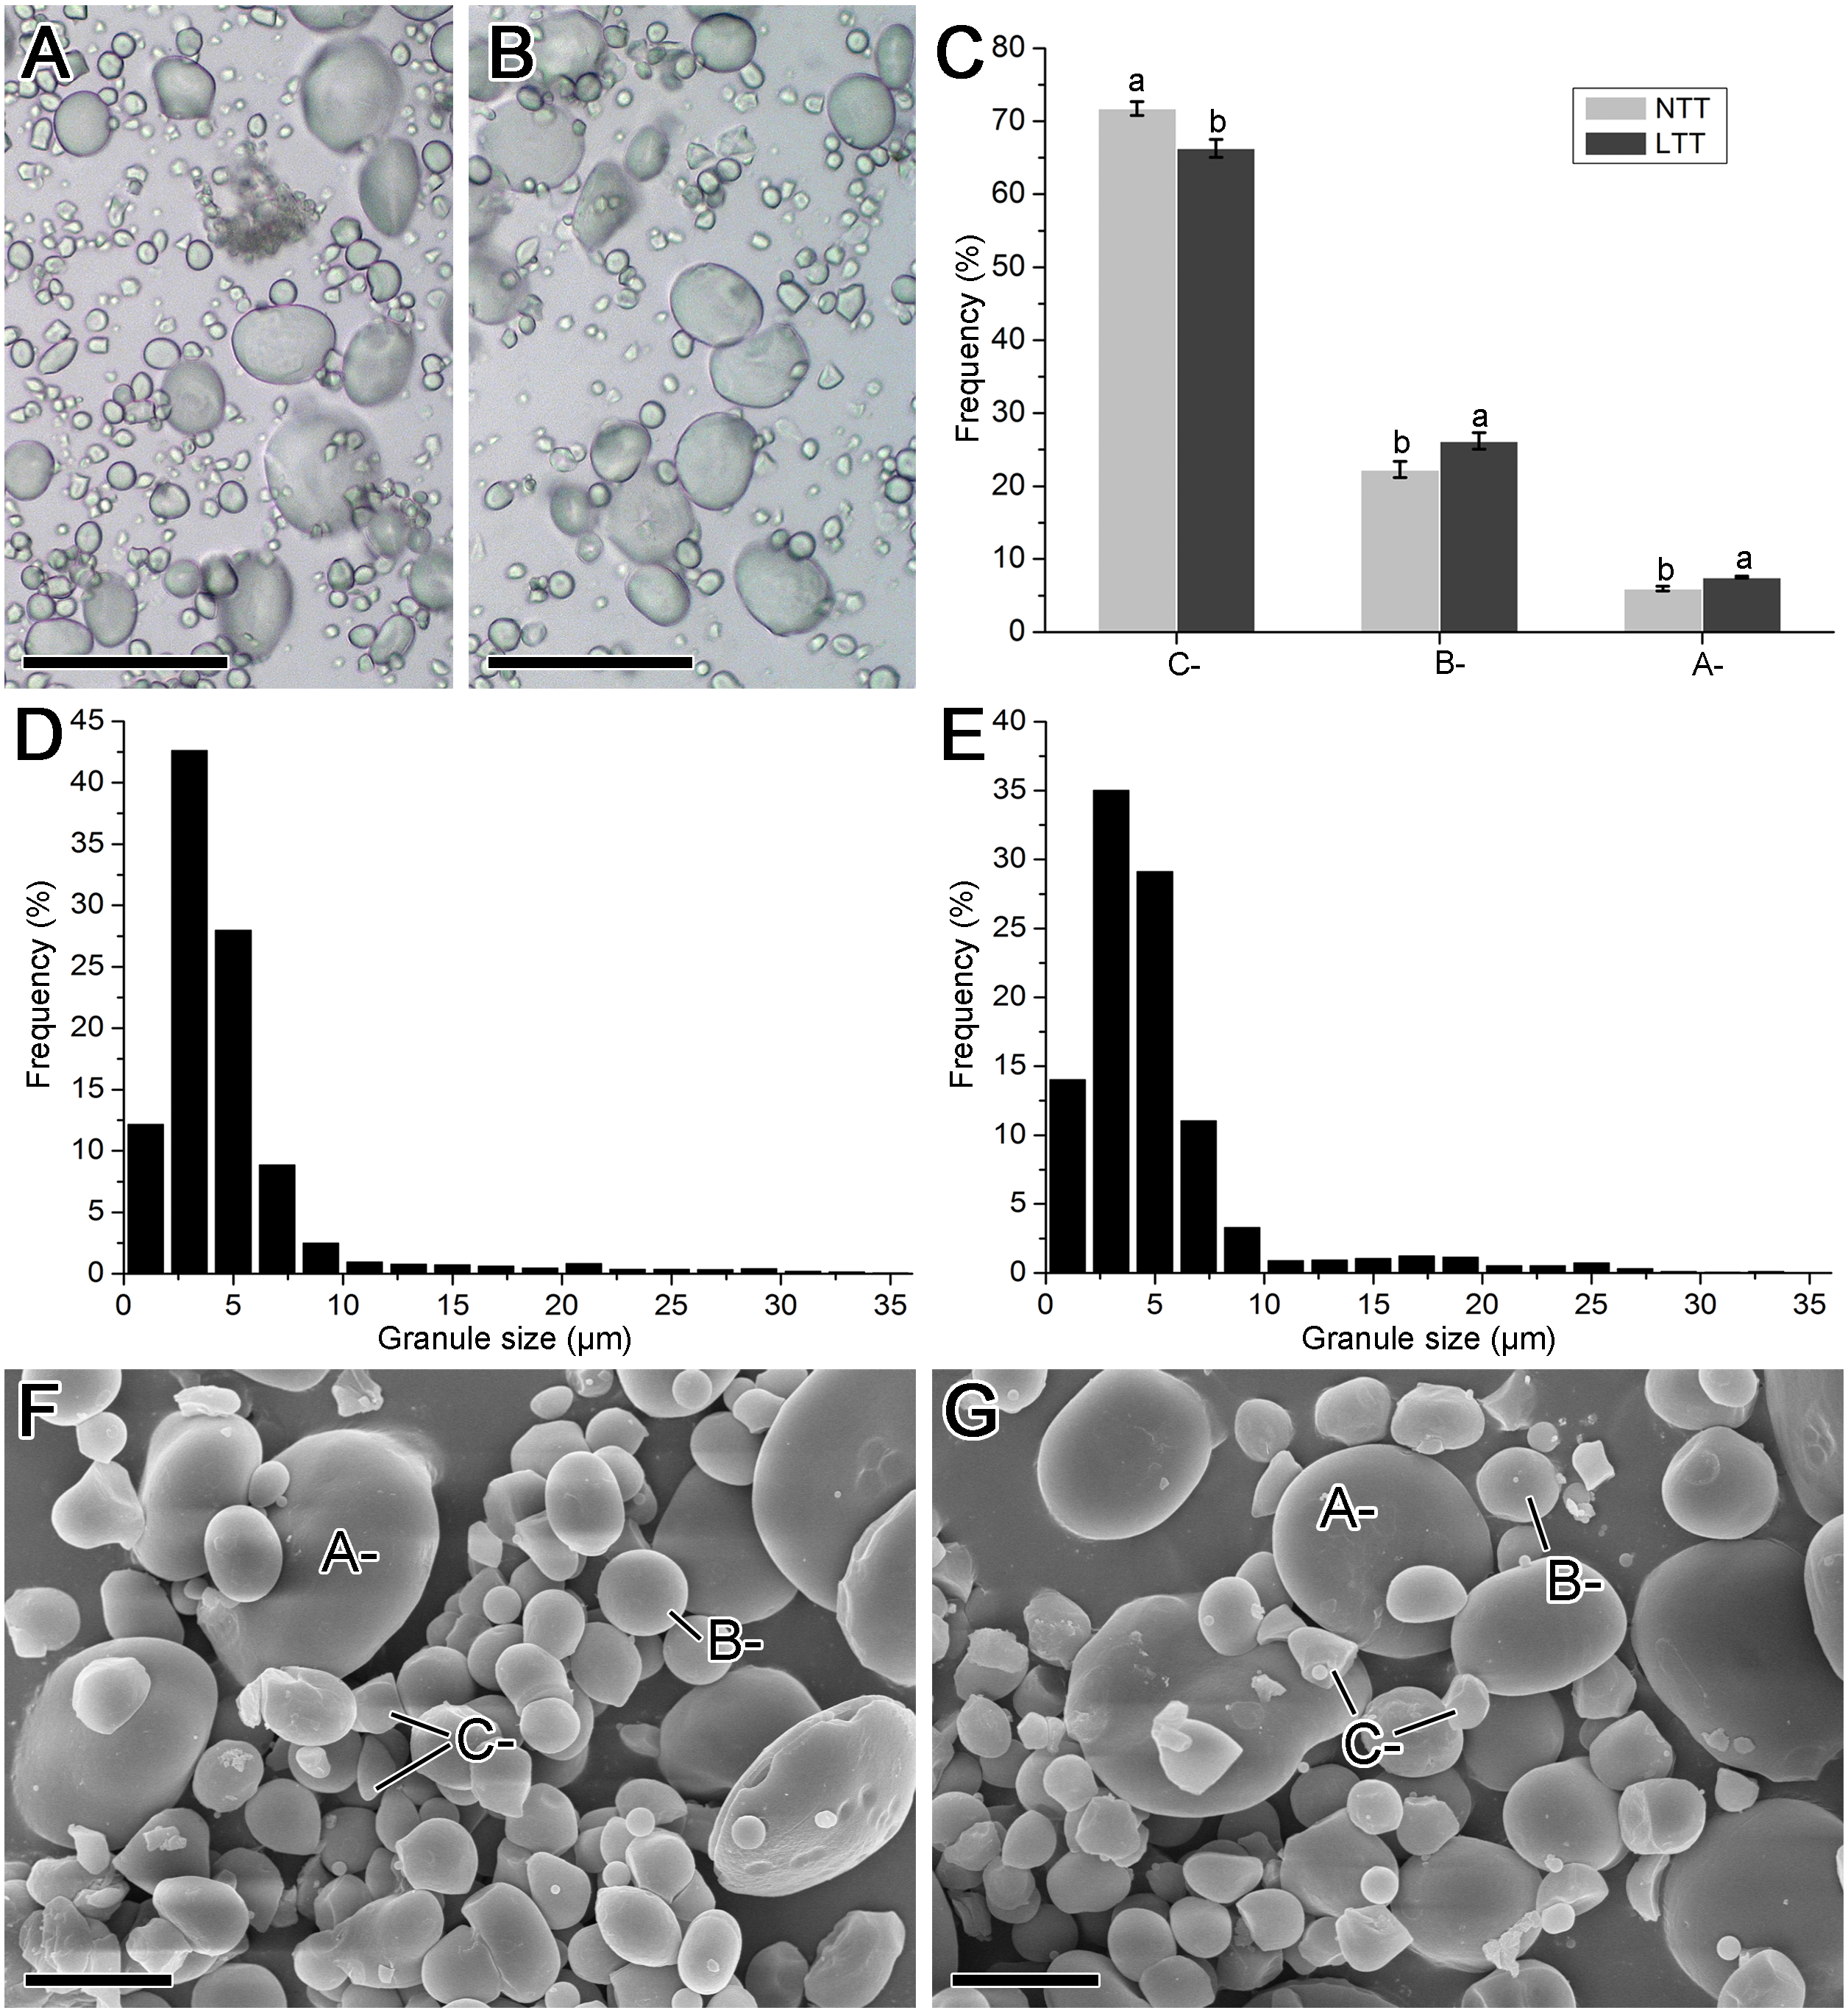
Swelling power and solubility
When a mixture of starch and water is heated, the amylopectin molecules absorb water and continually swell. The amylopectin molecules can maintain the integrity of granules and prevent the expansion process of amylopectin. Swelling power and solubility can be used to measure the molecular interaction between crystalline and amorphous domains within starch granules. Figure 4 shows the trends of swelling power and solubility of starches from 60 °C to 100 °C with a temperature gradient of 10 °C. The swelling power and solubility of the starches in NTT and LTT increased from 60 °C to 100 °C (Figs. 4A and 4B). LTT significantly decreased the swelling power but increased the solubility of starch after 70 °C.
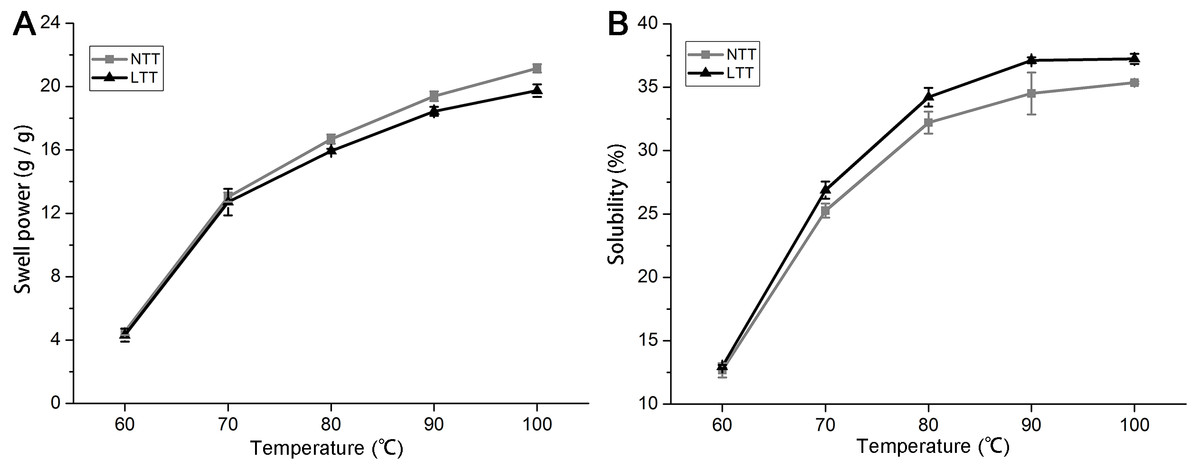
Figure 4: Swelling power and solubility.
(A) Swelling power. (B) Solubility. NTT, normal temperature treatment. LTT, low temperature treatment.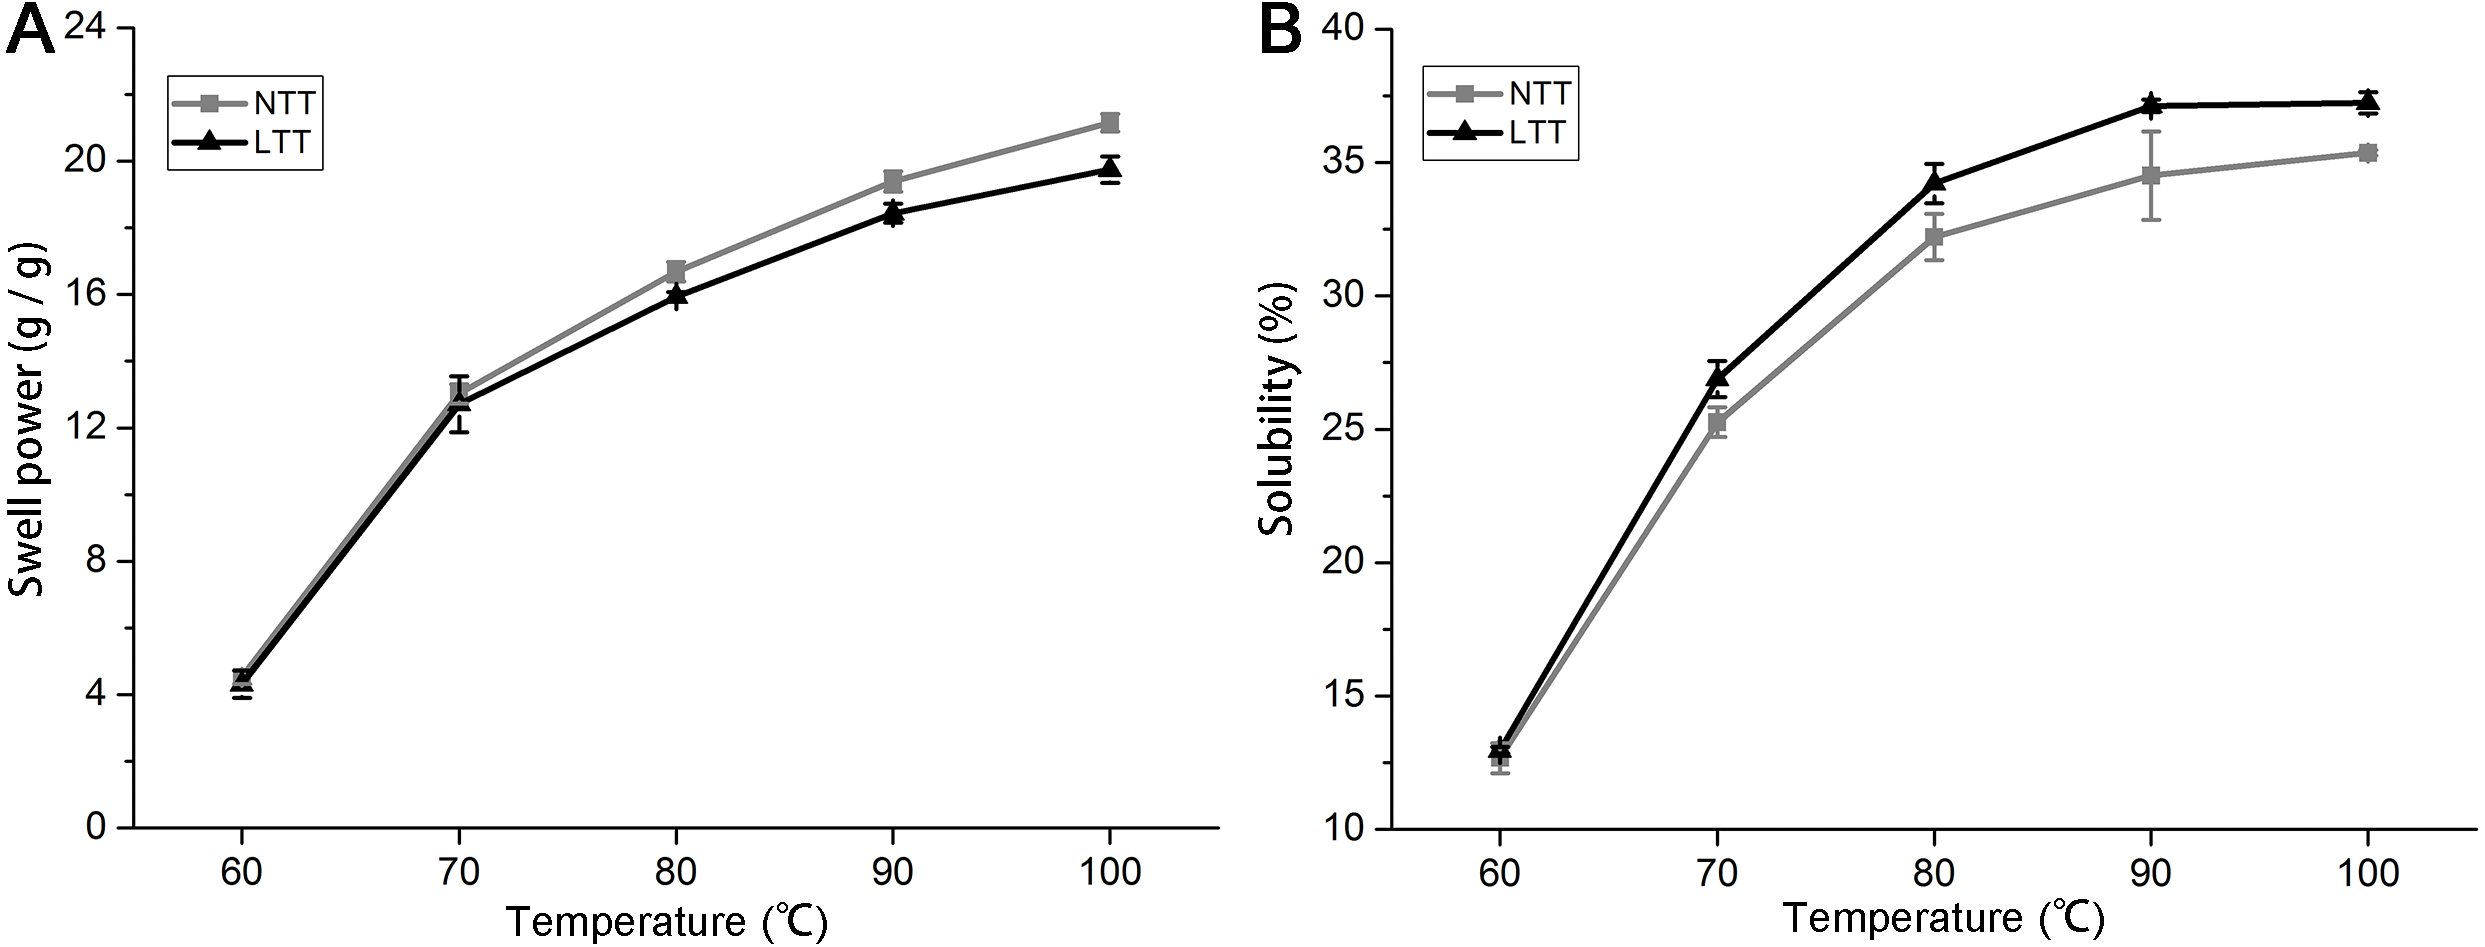
Crystal structure and helix structure analysis
The granular structure of starch consists of crystalline and amorphous components. The crystalline region was mainly composed of a double-helix structure formed by amylopectin molecules, and the amorphous region was mainly composed of amylopectin molecules with a loose structure. The XRD spectra of two starch groups are shown in Fig. 5A. The pattern shows that the two types of starch had strong diffraction peaks at the 2θ diffraction angle of 15°, 17°, 18°, and 23°, which is consistent with typical A-type crystal structures (Maache-Rezzoug et al., 2011). The peak intensities at 15°, 17°, and 18° in NTT were slightly stronger than those in LTT and led to a significantly high value of RDC (Table 2).

Figure 5: XRD, FTIR, and NMR spectrum of starch.
(A) XRD spectrum. (B) FTIR spectrum. (C) NMR spectrum of native starch and amorphous starch. (D) NMR spectrum after subtraction; black box was the higher magnification of C1 region. NTT, normal temperature treatment. LTT, low temperature treatment.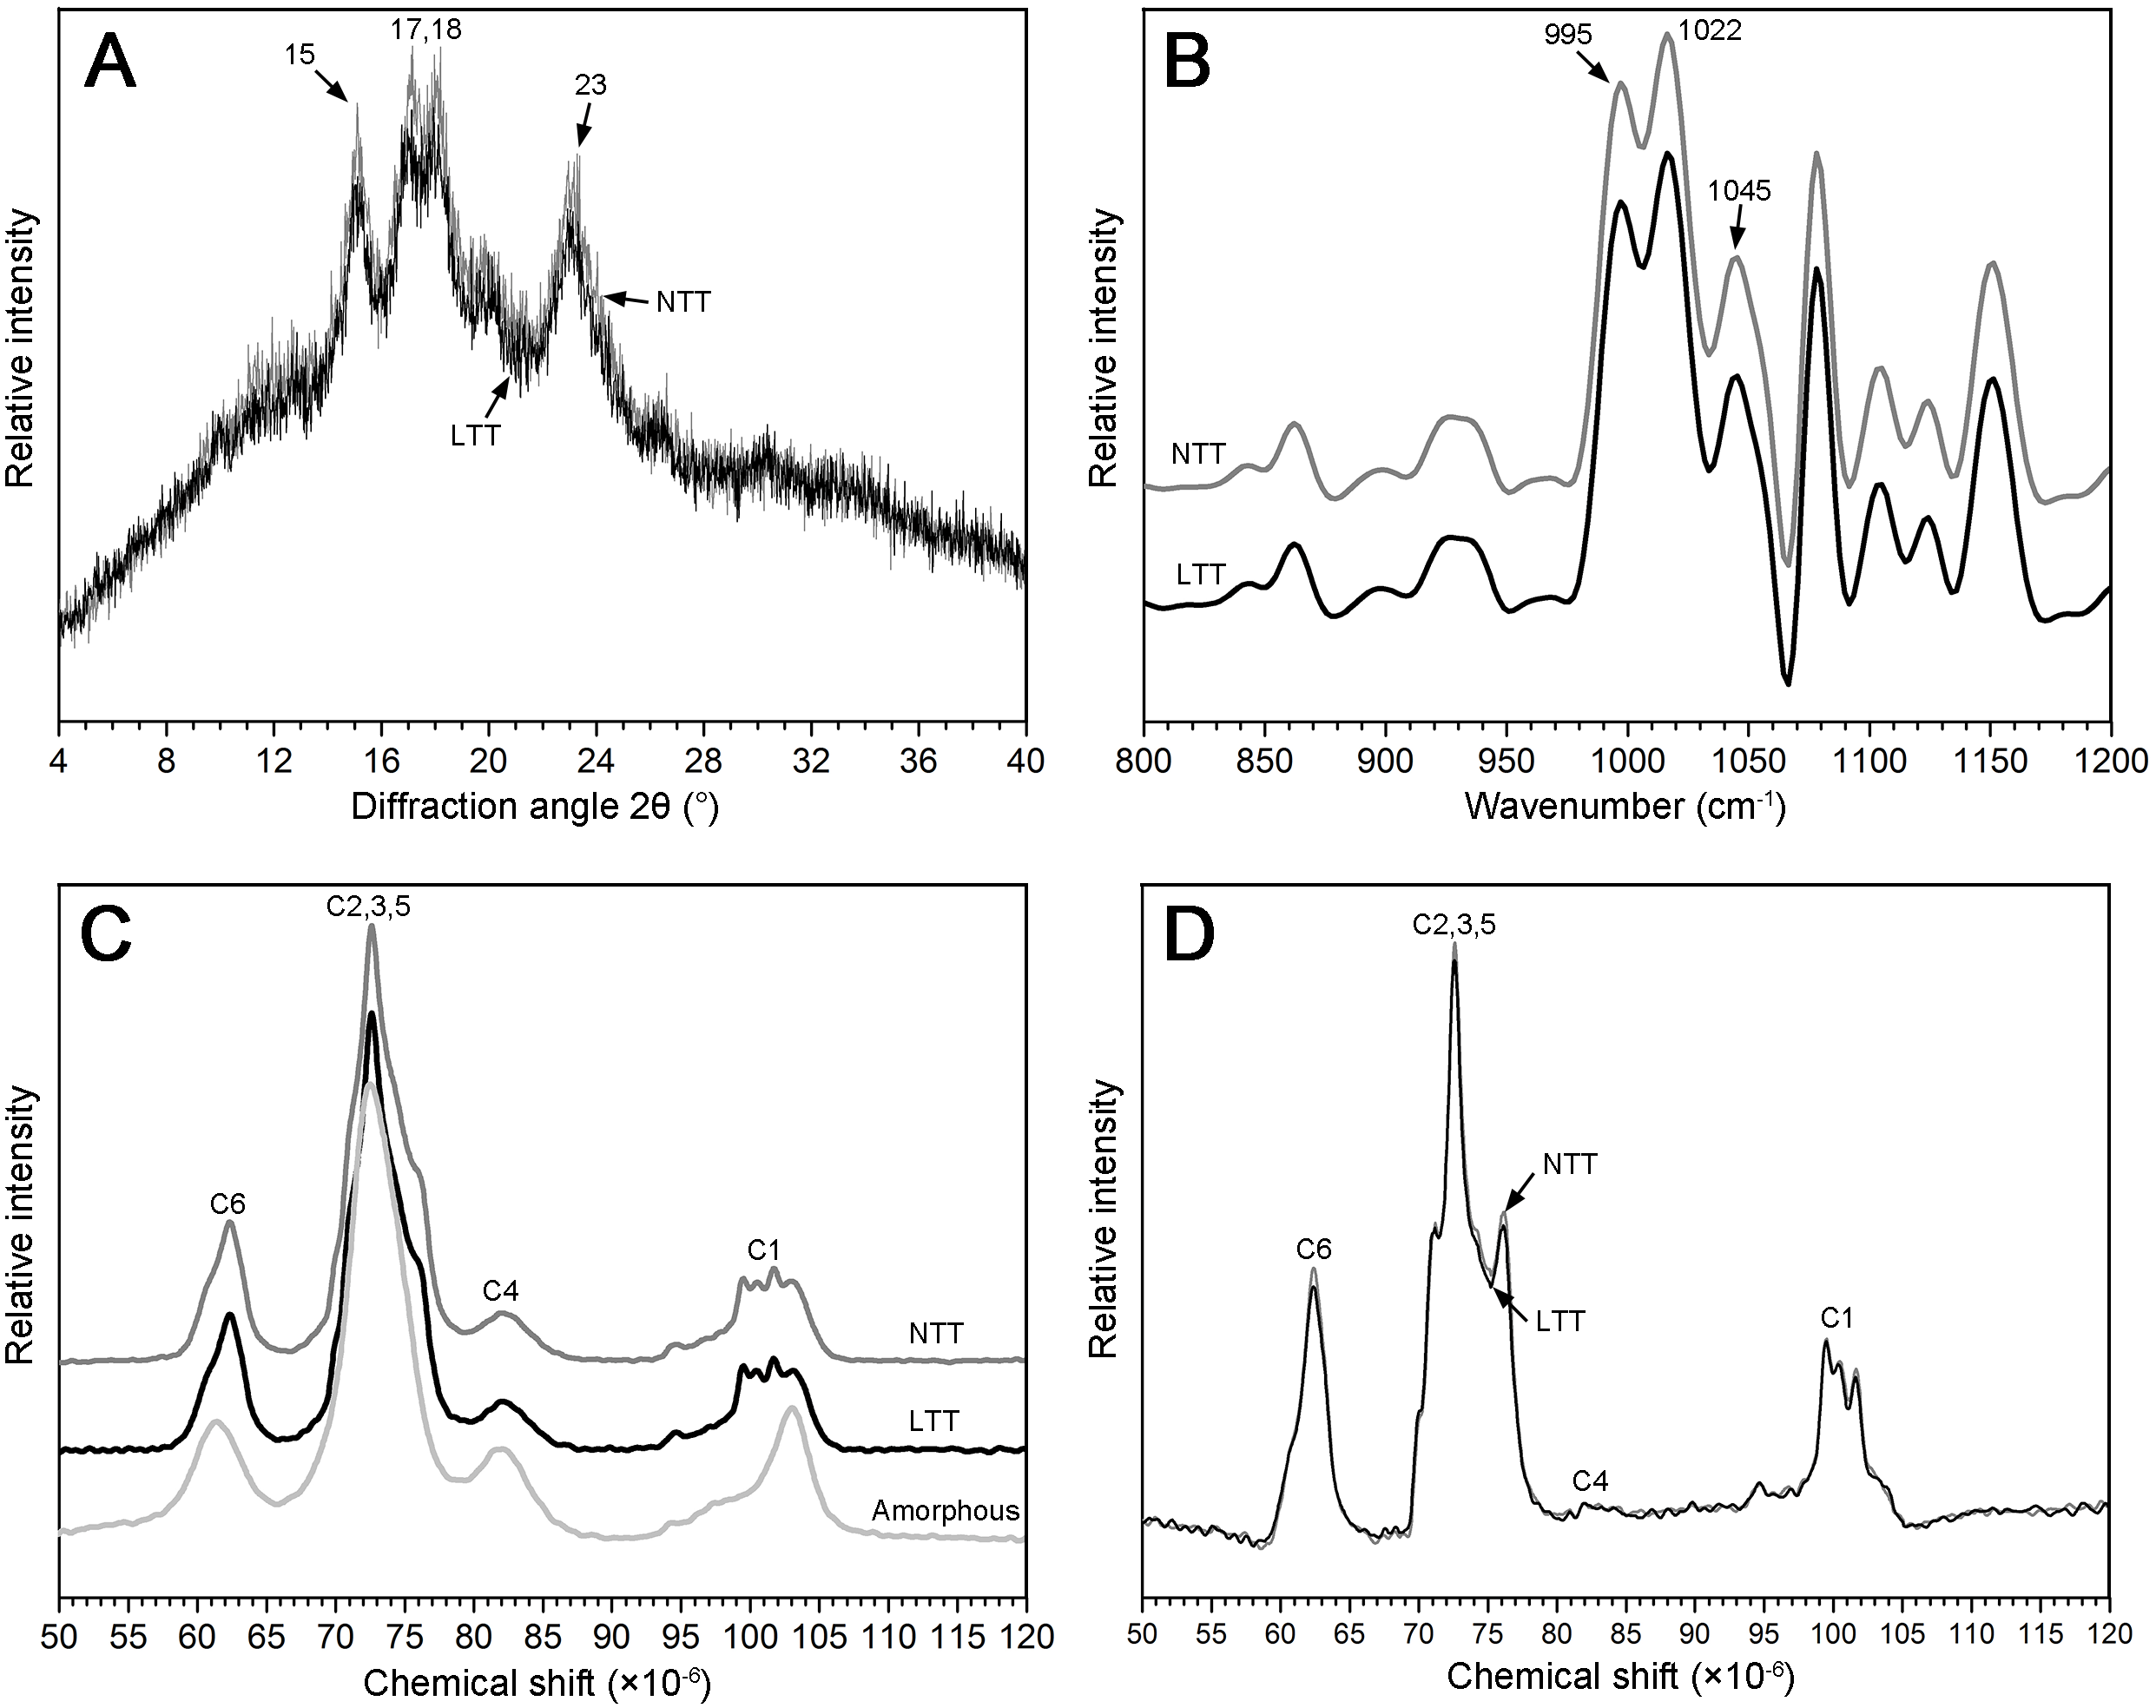
13C CP/MAS NMR can be used to analyze information on the short-range ordered structure in starch granules and obtain the proportion of amorphous zone and helix structure, including double- and single-helix structures. The amorphous starch only showed one peak at approximately 102.9 ppm (Fig. 5C). However, the starch in NTT and LTT exhibited four resonance peaks at approximately 99.6, 100.5, 101.5, and 102.9 ppm (Fig. 5C). Figure 5D shows the crystal pattern of two starch groups after the amorphous starch spectrum was subtracted from the native starch spectrum. The two starch groups showed similar characteristics of resonance peaks in the C1 region, but the peak intensity of the starch in LTT was lower, especially at 101.5 and 102.9 ppm; thus, the proportion of double- and single-helix structures in LTT was lower than that in NTT (Table 2). In addition, the proportion of amorphous components of starch in LTT was higher than that in NTT, which is consistent with the tendency of RDC determined by XRD.
Ordered structure in the external region of starch granules
ATR–FTIR combined with a software for spectrum deconvolution is a good method to analyze the structure information in the external region of starch granules with a thickness of 2 µm. The absorbance ratios of 1,045/1,022 cm−1 and 1,022/995 cm−1 in the ATR–FTIR spectra were used to measure the proportion of ordered-to-amorphous structure and amorphous-to-ordered carbohydrate structure in the external region of starch granules, respectively (Sevenou et al., 2002). Three typical peaks (1,045, 1,022, and 995 cm−1) were found between 800 and 1,200 cm−1 in the deconvoluted spectrum of the starch granules (Fig. 5B). The difference in the absorbance at 1,045, 1,022, and 995 cm−1 in the ATR–FTIR pattern was not remarkable (Fig. 5B). The difference in the calculated ratio of 1,045/1,022 and 1,022/995 cm−1 was not significant between the two groups (Table 2). These results indicate that low temperature in spring did not affect the ordered structure in the external region of starch granules.
| Treatment | Relative degree of crystallinity (%) | Absorbance ratio | Relative proportion (%) | |||
|---|---|---|---|---|---|---|
| 1,045/1,022 cm−1 | 1,022/995 cm−1 | Amorphous | Double helix | Single helix | ||
| NTT | 19.49 ± 0.23a | 0.58 ± 0.00a | 1.10 ± 0.00a | 57.77 ± 0.12b | 37.30 ± 0.11a | 4.93 ± 0.09a |
| LTT | 18.24 ± 0.34b | 0.58 ± 0.00a | 1.10 ± 0.00a | 58.54 ± 0.20a | 36.69 ± 0.15b | 4.77 ± 0.03b |
Notes:
Data are shown as means ± SD, n = 3.
Different lowercase letters after numbers indicate the significant differences at p < 0.05 level determined by LSD.
Hydrolysis degree of starch granules
Acid and enzyme hydrolyses are often used for the chemical treatment of granules in the starch processing industry. The profiles of starches hydrolyzed by PPA, AAG, and HCl are shown in Fig. 6. For PPA and AAG hydrolysis, the starches initially exhibited rapid hydrolysis from 0 h to 8 h and presented a slow hydrolysis phase from 8 h to 48 h (Figs. 6A and 6B). For HCl hydrolysis, the starches were hydrolyzed rapidly from 0 day to 6 days and hydrolyzed slowly after 6 days (Fig. 6C). Compared with the starches in LTT, those in NTT showed a significantly higher degree under the hydrolysis of PPA, AAG, and HCl (Figs. 6A–6C).
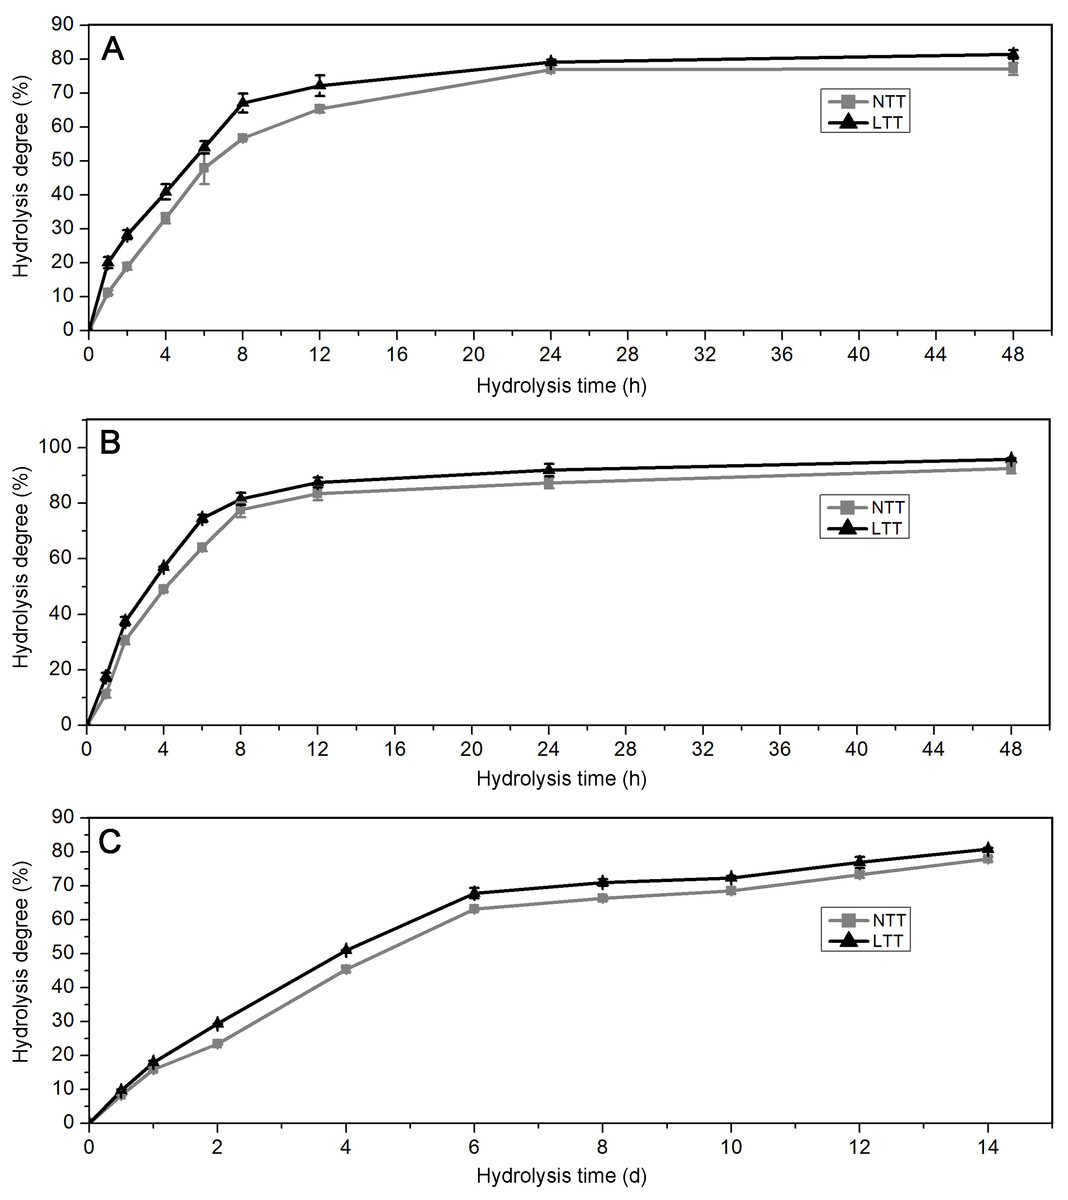
Figure 6: Hydrolysis degree of starch.
(A) Starch hydrolyzed by PPA. (B) Starch hydrolyzed by AAG. (C) Starch hydrolyzed by HCl. NTT, normal temperature treatment. LTT, low temperature treatment.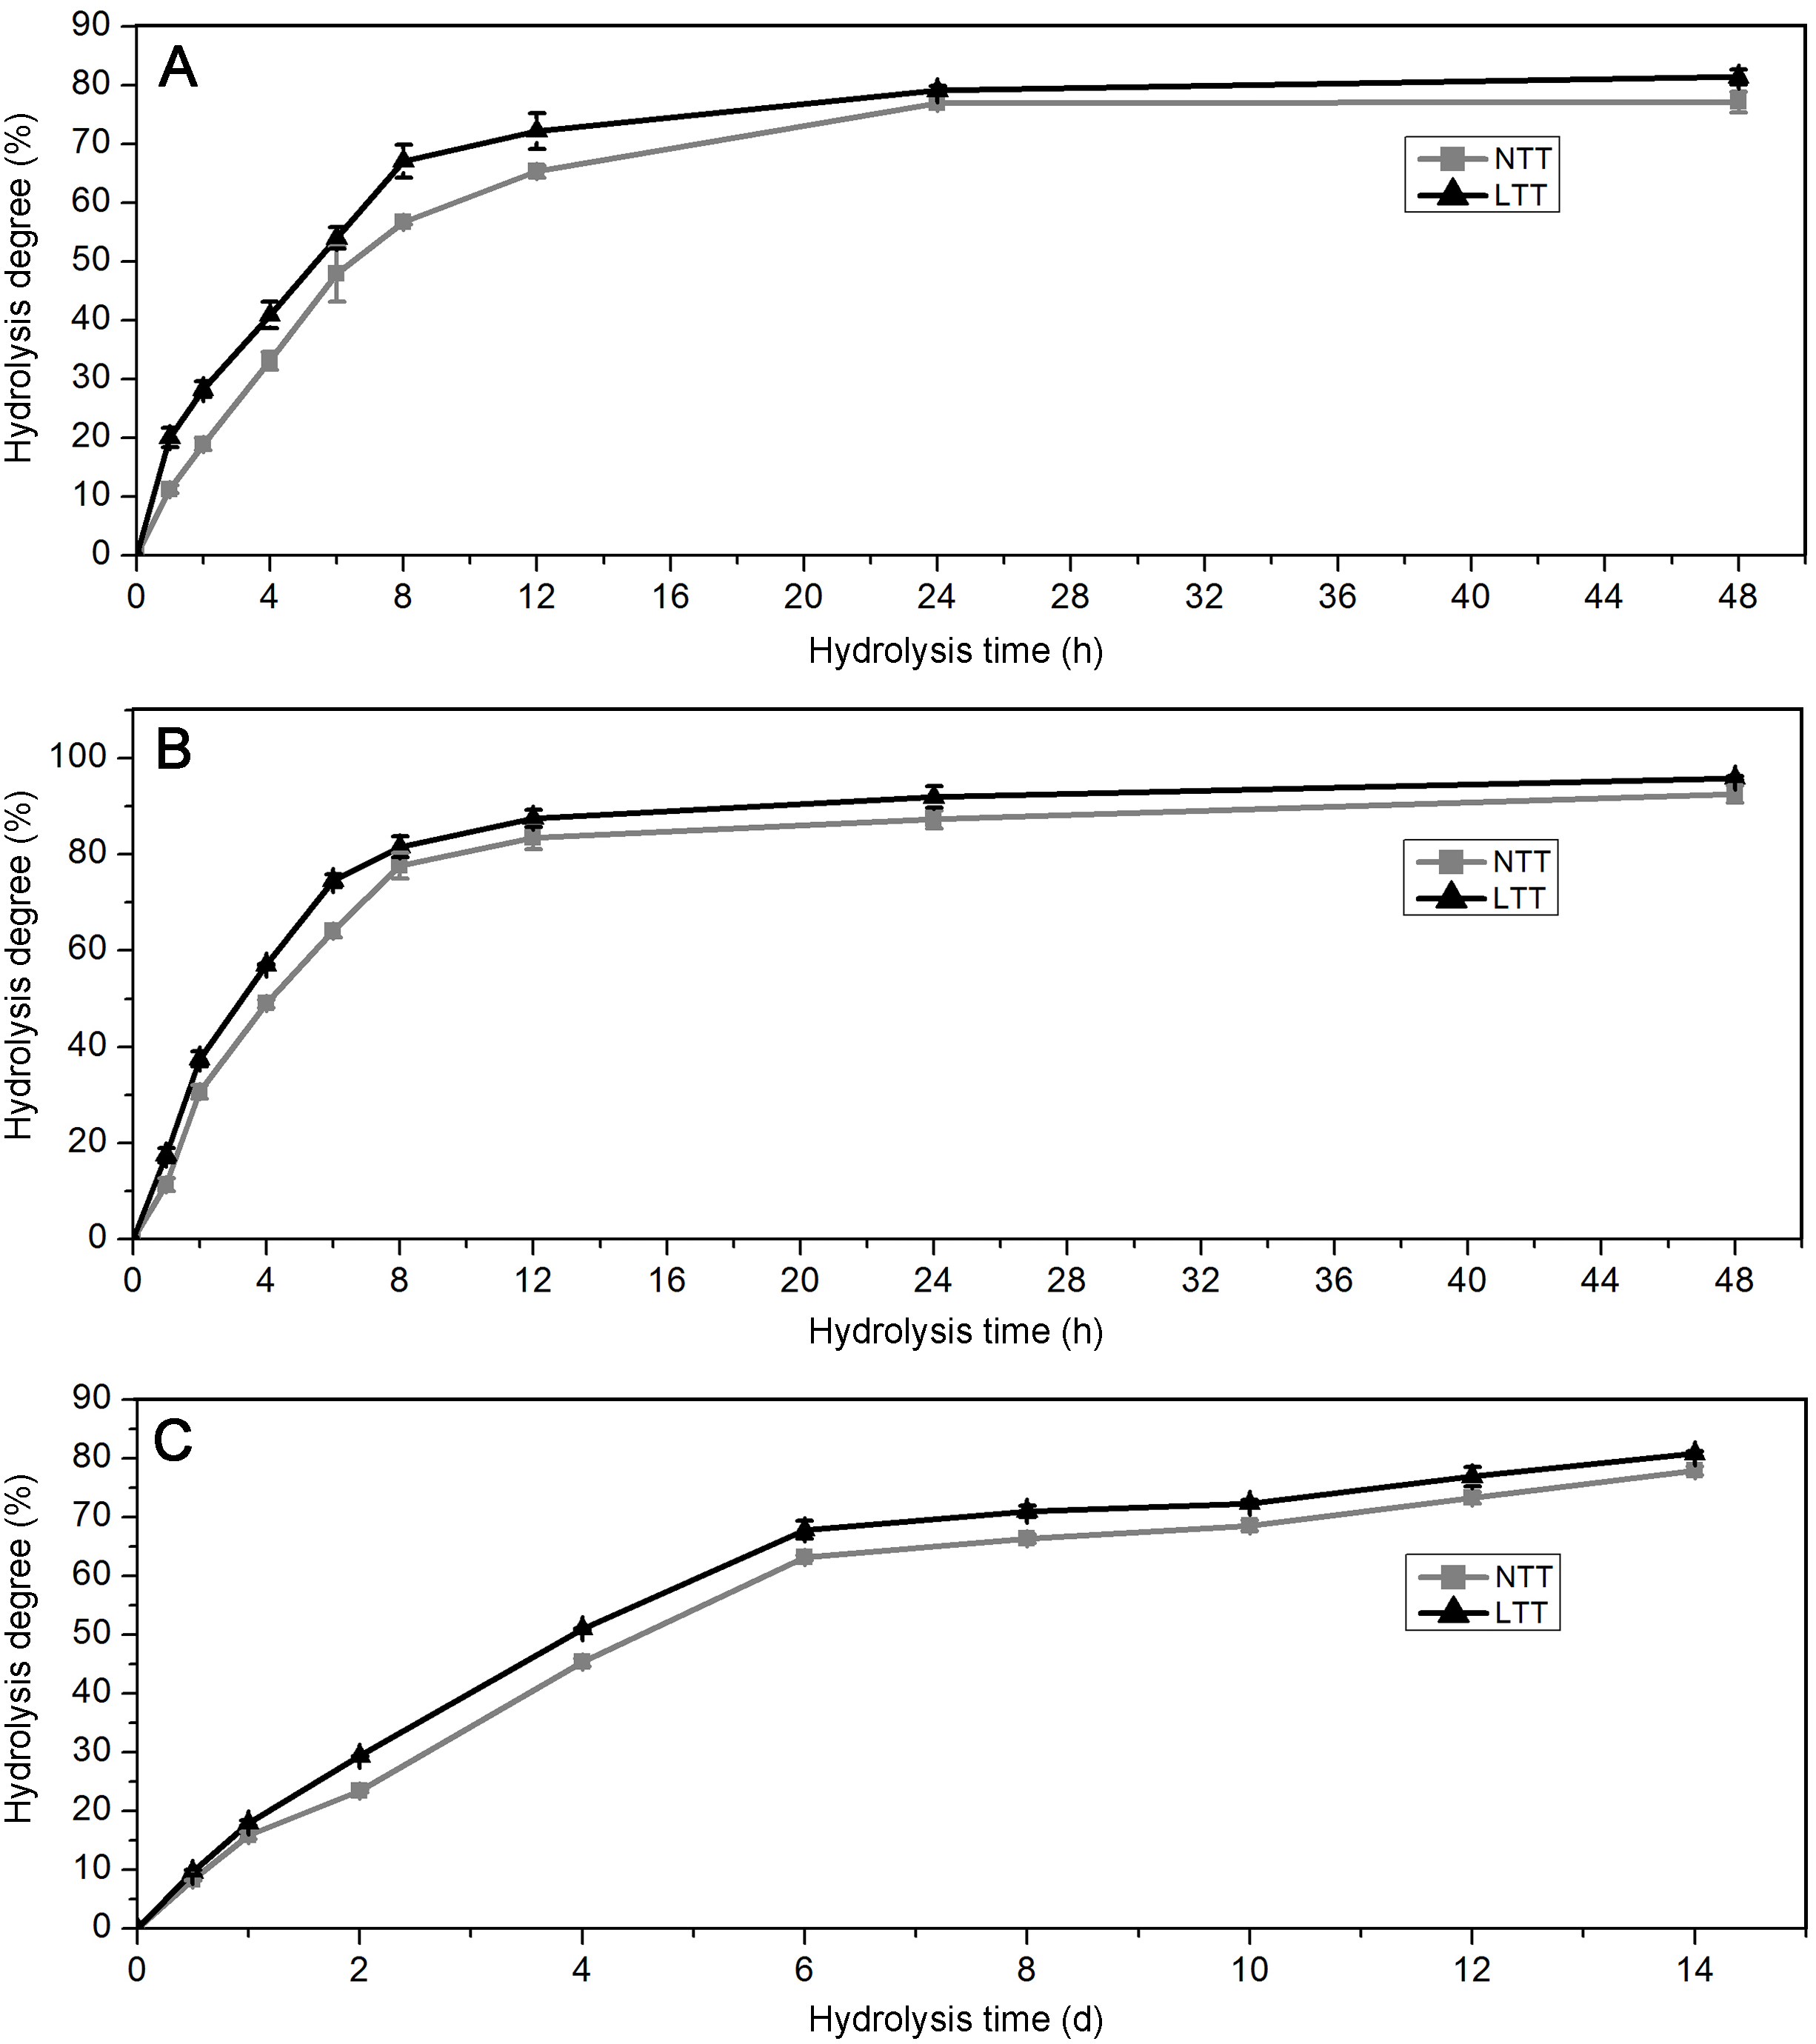
Discussion
Grain development and starch accumulation affected by low temperature
The wheat grain development under low temperature was observed in this study. Similar to other abiotic stresses (Fan et al., 2005; Xiong et al., 2014), low temperature remarkably affected the development of wheat grain. Morphological observation revealed that the development of wheat grain in LTT was faster than that in NTT, which was similar to that of high-temperature treatment in shortening the growth period of rice grains (Ishimaru et al., 2009). On the basis of the morphological change in the wheat grains, we conclude that LTT made the wheat grains mature ahead of time. This conclusion is consistent with the findings of Galiba et al. (2009) and Kang et al. (2012) that spring freeze can lead to early ripening of cereal grains. Meanwhile, LTT significantly increased the amylose content in wheat grains, a result that is not completely consistent with that of Labuschagne, Elago & Koen (2009), who suggested that low temperature at the grain-filling stage reduces the total starch content and increases the amylose content in different wheat cultivars. Singh et al. (2010a) and Singh et al. (2010b) found that the low temperature caused by early sowing of wheat exerts different effects on amylose content under different irrigation conditions. The amylose content increases in irrigated conditions but decreases in rain-fed conditions. The reasons for the inconsistency between their findings and ours might be due to the different of the effects of low temperature at stem elongation stage and the grain-filling stage on the biosynthesis of wheat starch (Thitisaksakul et al., 2012).
Development and morphology of starch granules affected by low temperature
Structural observation showed that low temperature promoted the accumulation of starch granules but reduced the amount of protein bodies in the endosperm cells. Zhao et al. (2008) reported that high temperature enhances the protein content but reduces the starch content. This conclusion, together with our results, suggests that the accumulation of starch and protein is negatively correlated. The B-type starch granules in LTT appeared faster but had less proportion in mature grain than those in NTT. This finding is inconsistent with the result of Yu et al. (2016), who indicated that drought stress increases the amount of small starch granules in early and late stages of wheat endosperm development. The ratio of large and small starch granules is influenced by various environmental factors, such as CO2 concentration (Blumenthal et al., 1995; Rogers et al., 1998), drought stress (Fábián et al., 2011), high temperature (Savin & Nicolas, 1999), and nitrogen fertilizer (Xiong et al., 2014). Geera et al. (2006) pointed out that A-type starch granules have higher amylose and phospholipid contents compared with B-type starch granules. Therefore, the increase in amylose content may be caused by the enhancement of the amount of A-type starch granules in LTT.
Morphology, size distribution, and amylose content affect physicochemical properties
Previous studies have shown that swelling power is correlated negatively with amylose content (Sasaki & Matsuki, 1998; Singh, McCarthy & Singh, 2006). This finding is consistent with our finding that LTT increases the amylose content but decreases swelling power. In general, starch with high amylose content has low swelling power and solubility (Lin et al., 2016; Singh et al., 2010a; Singh et al., 2010b). However, we found that the starch granules in LTT had lower swelling power and higher solubility than those in NTT. This result might be related to the morphology of starch granules. According to Kaur, Singh & Sodhi (2002) and Singh et al. (2003), starch granules with a cuboidal or irregular shape may be helpful in immobilizing amylose and amylopectin molecules, and they have low solubility even in cases of high swelling power. Kaur et al. (2007) and Singh & Kaur (2004) also reported that small starch granules exhibit higher swelling power and lower solubility compared with large granules. This phenomenon may explain our result that the large proportion of irregular C-type starch granules in NTT led to high stability of starch molecules and low solubility during swelling.
Previous studies have confirmed that the RDC of starch is negatively correlated with the content of amylose (Gao et al., 2014; Jiang et al., 2012; Yu et al., 2015) because the crystalline layer is composed of amylopectin molecules. This conclusion supports the finding of our study that the amylose content of starch in NTT is lower but has higher RDC compared with that in LTT. However, Singh et al. (2010a), Singh et al. (2010b) and Vermeylen et al. (2005) indicated that the RDC of A-type starch granules is higher than that of B-type starch granules. This finding contradicts our results because the granule groups in LTT in our study contained more A-type starch granules than those in NTT. On the basis of these conclusions, we can speculate that amylose content is the main factor that affected the RDC in this study because the amylose content of large and small starch grains changed under LTT. Compared with the RDC from XRD, the proportion of crystallized component in the NMR spectrum was higher, indicating that not all of the double-helix chains were in the crystal lamellae (Tan et al., 2007). Compared with the situation in NTT, the starch granules in LTT had a higher proportion of amorphous structure, which may have increased their susceptibility to enzyme and acid attacks (Man et al., 2012). According to Zhang, Venkatachalam & Hamaker (2006) and Srichuwong et al. (2005), the sensitivity of A-type starch granules to hydrolysis is higher than that of B-type starch granules because large granules contain more short double helices than small granules (Imberty et al., 1991). This phenomenon may also explain the high degree of hydrolysis of starch in LTT because they contained more A-type starch granules in comparison with those in NTT. In addition, we found that LTT did not affect the ordered degree in the external region of granules even when the amylose content and size distribution were changed. This result indicates that the ordered structure in the external region of starch granules was relatively stable because starches with the same crystal structure exhibit similar ratios of 1,045/1,022 and 1,022/995 cm−1 (Cai et al., 2014).
Conclusions
Low temperature at the stem elongation stage had obvious effects on spike characteristics, growth process of grains, accumulation of starch, and starch granule development in wheat grains. With regard to agronomic traits, the effects of LTT were negative because it could reduce the spike length, number of grains per spike, and number of spikelets. The amylose contents in wheat grains were significantly enhanced by LTT, which affected the morphology, size distribution, and structural characteristics of the starch granules. The development of starch granules was faster in LTT than in NTT, leading to the earlier appearance time of B-type starch granules but less amount of C-type starch granules in developing wheat grains in the former than the latter. In mature wheat grains, the starch group in LTT contained more A- and B-type granules and less C-type granules than the starch group in NTT. Swelling power was lower but solubility was higher in LTT than in NTT. Crystal structure analysis indicated that LTT increased the amorphous component but reduced the crystalline region within granules, resulting in low RDC and relative proportion of double- and single-helix structures. However, low temperature had no effects on the ordered structure in the external region of granules. Enzyme and acid hydrolysis showed that the hydrolysis degree of starch in LTT was significantly higher than that in NTT. These results can help elucidate the mechanism through which the low temperature in spring can reduce wheat yield.