
Genome-wide analysis of the C3H zinc finger family reveals its functions in salt stress responses of Pyrus betulaefolia
- Published
- Accepted
- Received
- Academic Editor
- Julin Maloof
- Subject Areas
- Bioinformatics, Molecular Biology, Plant Science
- Keywords
- Pyrus betulaefolia, C3H gene family, Genome-wide, Evolution, Salt stress response
- Copyright
- © 2020 Liu et al.
- Licence
- This is an open access article distributed under the terms of the Creative Commons Attribution License, which permits unrestricted use, distribution, reproduction and adaptation in any medium and for any purpose provided that it is properly attributed. For attribution, the original author(s), title, publication source (PeerJ) and either DOI or URL of the article must be cited.
- Cite this article
- 2020. Genome-wide analysis of the C3H zinc finger family reveals its functions in salt stress responses of Pyrus betulaefolia. PeerJ 8:e9328 https://doi.org/10.7717/peerj.9328
Abstract
Transcription factors regulate gene expression in response to various external and internal cues by activating or suppressing downstream genes. Significant progress has been made in identifying and characterizing the Cysteine3Histidine (C3H) gene family in several dicots and monocots. They are characterized by their signature motif of three cysteine and one histidine residues, and reportedly play important roles in regulation of plant growth, developmental processes and environmental responses. In this study, we performed genome-wide and deep analysis of putative C3H genes, and a total of 117 PbeC3H members, were identified in P. betulaefolia and classified into 12 groups. Results were supported by the gene structural characteristics and phylogenetic analysis. These genes were unevenly distributed on 17 chromosomes. The gene structures of the C3H genes were relatively complex but conserved in each group. The C3H genes experienced a WGD event that occurred in the ancestor genome of P. betulaefolia and apple before their divergence based on the synonymous substitutions (Ks) values. There were 35 and 37 pairs of paralogous genes in the P. betulaefolia and apple genome, respectively, and 87 pairs of orthologous genes between P. betulaefolia and apple were identified. Except for one orthologous pairs PbeC3H66 and MD05G1311700 which had undergone positive selection, the other C3H genes had undergone purifying selection. Expression profiles showed that high salinity stress could influence the expression level of C3H genes in P. betulaefolia. Four members were responsive to salt stress in roots, nine were responsive to salt stress in leaves and eight showed inhibited expression in leaves. Results suggested important roles of PbeC3H genes in response to salt stress and will be useful for better understanding the complex functions of the C3H genes, and will provide excellent candidates for salt-tolerance improvement.
Introduction
The zinc finger protein (ZFP) is one of the largest and specific transcription factor families in plants. Members are characterized by common zinc finger (Znf) motifs in which cysteines and/or histidines coordinate with a few zinc ions to form the local peptide structures (Laity, Lee & Wright, 2001; Hall, 2005). The ZFPs are classified into at least 14 gene families based on their structural and functional characteristics, among which RING finger, DOF, LIM, AP2/EREBP and WRKY have been identified to play important roles in plant growth and response to biotic and abiotic stresses (Arnaud et al., 2007; Huang et al., 2015; Ma et al., 2015; Liu & Zhang, 2017). The ZFPs have been categorized into 10 groups (C2H2, C2HC, C2HC5, C2C2, C3H, C3HC4, C4, C4HC3, C6 and C8) based on the number of cysteine and histidine residues and the number of amino acids in the spacer region (Moore & Ullman, 2003). The ZFPs are recognized as master regulators of several downstream genes involved in multiple biological processes, such as development, morphogenesis, signal transduction and environmental stress responses (Takatsuji, 1998; Stege et al., 2002; Yang et al., 2014).
Among ZFPs, Cysteine3Histidine (C3H) ZFPs are characterized by a Znf motif consisting of three cysteines and one histidine coordinated by a zinc cation (Bogamuwa & Jang, 2014), which are conserved mRNA-binding proteins in many eukaryotes (Blackshear, 2002; Wang et al., 2008). Members of this family have been found in eukaryotes ranging from yeast to human (Thompson et al., 1996; De et al., 1999; Carrick, Lai & Blackshear, 2004). A typical C3H protein contains 1-6 C3H-type Znf motifs. Based on the different numbers of amino acid spacers between cysteines and histidines in the C3H motif, a consensus sequence for these motifs was defined as C-X4−17-C-X4−6-C-X3-H (X represents any amino acid) (Peng et al., 2012; Yuan et al., 2015). A whole-genome screen for C3H proteins in Arabidopsis, rice and maize found two common C3H motifs (C-X7-C-X5-C-X3-H and C-X8-CX5-C-X3-H) (Peng et al., 2012).
Increasing evidence has revealed that C3H proteins participate in regulation of growth, developmental processes and environmental responses in plants. In Arabidopsis, HUA1, the first reported C3H-type ZFP with six tandem C3H motifs, was identified as an RNA-binding protein and likely participates in a new regulatory mechanism for flower development (Li, Jia & Chen, 2001). The C3H ZFP AtPEI1 plays an important role during Arabidopsis embryogenesis (Li & Thomas, 1998) and interaction of FES1 with FRI and FRL1 genes, which is required to promote the winter-annual habit in Arabidopsis (Schmitz et al., 2005). A rice C3H ZFP gene, OsLIC, mediates rice architecture via brassinosteroid signaling (Wang et al., 2008). Another rice C3H ZFP gene, OsDOS, is involved in delaying leaf senescence (Kong et al., 2006). Additionally, studies have shown that some C3H ZFPs are involved in abiotic stress, especially in salt stress responses. For example, transgenic Arabidopsis overexpressing AtC3H17 were more tolerant under NaCl and methyl viologen treatment than the wild type (Seok et al., 2018). A cotton Znf gene, GhZFP1, enhanced tolerance to salt stress and resistance to fungal disease in transgenic tobacco (Guo et al., 2009). Arabidopsis genes AtTZF10 (AtSZF2/AtC3H29) and AtTZF11 (AtSZF1/AtC3H47) are involved in salt stress responses (Sun et al., 2007). Over expression of AtTZF2 and AtTZF3 caused enhanced tolerance to drought, oxidative and salt stress. In contrast, the antisense or RNAi plants exhibited reduced to salt stress (Huang et al., 2011; Huang et al., 2012; Lee et al., 2012). In cotton, compared with the WT, GhZFP1 over expression plants show increased salt tolerance, due to changes in Na+ and K+ homeostasis (Guo et al., 2009). Moreover, native CCCH-ZFP gene AtTZF1 over expression in Arabidopsis (Lin et al., 2011; Zang et al., 2016), in rice (Sun et al., 2010; Jan et al., 2013) and in broccoli (Jiang et al., 2017) resulted in higher salt stress-tolerance response.
Abiotic stresses are key environmental threats that constrain plant growth, development and yield (Cramer et al., 2011). Among various abiotic stresses, salinity, drought and extreme temperatures are major factors (Luo et al., 2015). The C3H members play important roles in plant response to the environment. A number of researchers have elucidated the association of C3Hs with diverse plant growth regulatory processes via genome-wide analysis in Arabidopsis and rice (Wang et al., 2008), poplar (Chai et al., 2012), maize (Peng et al., 2012), switchgrass (Yuan et al., 2015), alfalfa (Zhang et al., 2013), citrus (Liu et al., 2014), tomato (Xu, 2014), grape vine (Wang, Zhong & Cheng, 2014), chickpea (Pradhan et al., 2017), banana (Mazumdar et al., 2017) and cabbage (Rameneni et al., 2018).
Pears (Pyrus spp. L.) are one of the most important fruit crops in the Rosaceae family. They are the third most important fruit crop in temperate zones, after grape and apple (Chang et al., 2012; Wu et al., 2013). Pear production is quite limited due to the spread of soil salinization and Pyrus betulaefolia Bunge, a Chinese native wild pear species, is commonly used as a rootstock in pear orchards to improve abiotic stress tolerance (Okubo & Sakuratani, 2000; Matsumoto et al., 2007; Chang et al., 2012; Dong et al., 2019). Although the characterizations of C3H Znf proteins have been reported in some other species of plants and animals, their functions are poorly understood in P. betulaefolia. In this study, we performed a comprehensive analysis of 117 members of the C3H Znf gene family in P. betulaefolia, including phylogenetic analysis, chromosomal location, gene structure, gene evolution and expression profiles in various organs and under salt treatment. Our investigation should provide an important foundation for future cloning and functional studies of PbeC3H proteins and excellent candidates for P. betulaeolia improvement.
Materials and Methods
Identification of C3H proteins
The latest version of the P. betulaefolia genome and protein sequences were downloaded from BioProject (PRJNA529328) of NCBI (https://www.ncbi.nlm.nih.gov/bioproject/) (Dong et al., 2019). The C3H genes of cultivated pear P. bretschneideri were got from genome (version v1.1) project (http://peargenome.njau.edu.cn/). The Malus domestica C3H gene files were downloaded from the Genome Database for Rosaceae (https://www.rosaceae.org/). The Hidden Markov Model (HMM) profiles of C3H domains (PF00642) were obtained from the Pfam database (http://pfam.xfam.org/), and it was employed as a query to identify all possible C3H proteins using HMMER (V3.0) software (Finn, Clements & Eddy, 2011). Then the motif was confirmed using inline tool SMART (http://smart.emblheidelberg.de/) and MOTIF Search (https://www.genome.jp/tools/motif/).
Sequence analyses
Protein properties, including three fields (length, molecular weight and isoelectric point) of each PbeC3H protein were calculated by online ExPasy program (http://www.expasy.org/tools/). The motif analyses of the PbeC3Hs were detected using MEME online software (http://meme-suite.org/tools/meme/) with the default parameter settings, the width of motifs was set from 6 to 50, and the number of motifs was 2 to 15. The gene structures of the PbeC3Hs were parsed from the general feature format (GFF) files of the P. betulaefolia genome database, and diagrams of the exon-intron structures were drawn using the online program Gene Structure Display Server (GSDS, http://gsds.cbi.pku.edu.cn/).
Mapping C3H genes on chromosomes
Positional information of all the C3Hs was parsed from the P. betulaefolia genome; the locations of them was drafted using MapInspect software (version 1.0) (http://mapinspect.software.informer.com/).
Phylogenetic analysis of C3H proteins
All obtained proteins were aligned using ClustalX2.0 (Larkin et al., 2007). Phylogenetic trees were generated using the Maximum Likelihood method in MEGA7 (Kumar, Stecher & Tamura, 2016) software, and the reliability of the interior branches was assessed with 1,000 bootstrap re-samplings.
Ks calculation and divergence time estimation of homologous gene pairs
The ratio of non-synonymous substitutions (Ka)/synonymous substitutions (Ks) was evaluated to determine homologous relationships and divergence time of C3H genes. Ka and Ks values, and the ratio of Ka/Ks of C3H homologous gene pairs in P. Betulaefolia or in apple, and orthologous gene pairs between P. betulaefolia and apple were calculated using DnaSP v5 (Librado & Rozas, 2009). The approximate divergence time of the C3H homologous gene pairs in P. betulaefolia, apple, or between them were calculated based on the formula T = Ks/2λ assuming a clock-like rate (λ) of 9.26 synonymous substitutions per 109 years (Wu et al., 2013). A syntenic diagram was constructed using Circos software (Krzywinski et al., 2009).
Plant material and treatments
The plants of P. betulaefolia were planted in soil from the tissue cultures of one-month seedlings. The seedlings were grown in a growth chamber with fixed chamber condition (light/dark cycle:14 h at 25 °C/10 h at 23 °C; 65% relative humidity). About 45 days later, at the eight-leaf stage, the roots of the P. betulaefolia plants were immersed into solution with 200 mM NaCl and the deionized water as controls as the treatment before (Li et al., 2017). Roots, stems and leaves were collected at 0 h (just prior to the application of the salt treatment) 12 h, 24 h, 48 h and 72 h after the salt treatment. Samples were immediately frozen in liquid nitrogen and stored at −80 °C. The experiments were repeated three times, and each experiment was comprised of 6 plants per treatment. The presented data represents the mean ± the standard error of three biological replicates.
RNA isolation and quantitative reverse transcription PCR
Total RNA was isolated using a plant RNA purification kit (MoLFarming, Cat. No. RK16-50 T, Nanjing, China) from leaf and root tissues according to the manufacturer’s instructions. The expression of PbeC3H genes was analyzed using a BIO-RAD CFX Connect Real-Time system (BIO-RAD, California, USA) with the SYBR Green Master Mix (TSINGKE, Beijing, China). Gene-specific primers were designed based on the gene sequences using Primer Premier 5.0 (Carnegie Institute of Washington, Washington, USA). EF1α (GWHPAAYT007384) of P. betulaefolia was used as internal controls for normalization (Liu et al., 2018). The efficiency of the RT-qPCR primers was tested using both RT-qPCR and polyacrylamide gel electrophoresis. And the specific primers then selected for further analysis. The amplification parameters were as follows: 95 °C hold for 10 min, followed by 40 cycles at 95 °C for 15 s, 60 °C for 15 s, and 72 °C for 15 s. Nonspecific products were identified by inspecting melting curves. Experiments for three technical replicates for each biological replicate were carried out. A t-test was used for statistical analysis. The primers used in this article were list in Table S1.
Results
Identification and characterization of the PbeC3H family genes
The released whole-genome sequence of pear (Wu et al., 2013) and P. betulaefolia (Dong et al., 2019) was used in the present study. To identify C3H family genes in the genome sequence dataset, we performed a Hidden Markov Model (HMM) search using the C3H domain file (PF00642) as a query and 120 and 124 sequences were identified in P. betulaefolia and pear, respectively. After HMM search and manual analysis to remove false positive and redundant genes, a total of 117 and 99 non-redundant, full-length C3H genes in P. betulaefolia and pear were identified and designated PbeC3H1-PbeC3H117 (Table 1 and Table S2). Based on the different amino-acid spacing numbers between Cys and His in Znf motif, we found 11 types but excluded three types that contained zero C3H members: (C-X4-C-X5-C-X3-H, C-X7-C-X6-C-X3-H and C-X15-C-X5-C-X3-H) (Fig. 1). Characterizations of the 117 PbeC3H proteins, including number of amino acids (length), number of C3H motifs, molecular weight (MW), isoelectric point (pI) and physical location are listed in Table 1. We found that the deduced full lengths of PbeC3H proteins ranged from 142 (PbeC3H72) to 2040 amino acids (aa) (PbeC3H110) with an average of 613 aa, among which only 12 of the C3H genes were more than 1000 aa in length. The relevant MW were 16.03 kDa for PbeC3H72 and 223.61 kDa for PbeC3H110. The pI ranged from 4.72 (PbeC3H101) to 9.69 (PbeC3H102).
| Gene | protein ID | Chr. | Position | Number of CCCH | No. of Intron | pI | Mw (kDa) | Length of AA |
|---|---|---|---|---|---|---|---|---|
| PbeC3H1 | GWHPAAYT004872 | Chr10 | GWHAAYT00000010:25730504-25736321( +) | 6 | 11 | 7.79 | 54.22 | 499 |
| PbeC3H2 | GWHPAAYT026042 | Chr16 | GWHAAYT00000016:10835842-10838359( +) | 5 | 6 | 8.66 | 51.79 | 483 |
| PbeC3H3 | GWHPAAYT014629 | Chr13 | GWHAAYT00000013:11223808-11226654( +) | 5 | 6 | 8.71 | 50.24 | 472 |
| PbeC3H4 | GWHPAAYT054422 | Chr9 | GWHAAYT00000009:6818366-6822407( +) | 5 | 6 | 8.51 | 50.25 | 462 |
| PbeC3H5 | GWHPAAYT046338 | Chr6 | GWHAAYT00000006:19036165-19050554( -) | 6 | 21 | 5.41 | 122.09 | 1089 |
| PbeC3H6 | GWHPAAYT012885 | Chr12 | GWHAAYT00000012:27536359-27539624( -) | 5 | 6 | 8.84 | 48.30 | 443 |
| PbeC3H7 | GWHPAAYT028883 | Chr17 | GWHAAYT00000017:7152160-7156121( +) | 5 | 6 | 8.52 | 49.90 | 461 |
| PbeC3H8 | GWHPAAYT009701 | Chr11 | GWHAAYT00000011:34084040-34086781( -) | 5 | 6 | 9.08 | 50.76 | 472 |
| PbeC3H9 | GWHPAAYT037374 | Chr3 | GWHAAYT00000003:30260879-30269328( -) | 5 | 12 | 6.74 | 90.17 | 827 |
| PbeC3H10 | GWHPAAYT018571 | Chr14 | GWHAAYT00000014:19759504-19762970( -) | 5 | 5 | 4.85 | 69.15 | 627 |
| PbeC3H11 | GWHPAAYT018570 | Chr14 | GWHAAYT00000014:19749693-19758430( -) | 6 | 13 | 5.28 | 119.84 | 1077 |
| PbeC3H12 | GWHPAAYT018569 | Chr14 | GWHAAYT00000014:19736980-19742852( -) | 4 | 5 | 7.84 | 61.27 | 548 |
| PbeC3H13 | GWHPAAYT031393 | Chr2 | GWHAAYT00000002:2031754-2033292( -) | 3 | 1 | 6.60 | 38.30 | 340 |
| PbeC3H14 | GWHPAAYT021136 | Chr15 | GWHAAYT00000015:11096960-11098700( -) | 3 | 1 | 8.27 | 38.21 | 340 |
| PbeC3H15 | GWHPAAYT044803 | Chr6 | GWHAAYT00000006:3732359-3736041( -) | 3 | 1 | 7.12 | 37.83 | 344 |
| PbeC3H16 | GWHPAAYT027356 | Chr16 | GWHAAYT00000016:23467664-23473889( +) | 3 | 2 | 6.59 | 83.27 | 751 |
| PbeC3H17 | GWHPAAYT046335 | Chr6 | GWHAAYT00000006:19016194-19020473( -) | 3 | 5 | 5.42 | 51.70 | 451 |
| PbeC3H18 | GWHPAAYT040308 | Chr4 | GWHAAYT00000004:27566275-27567502( -) | 2 | 2 | 6.16 | 26.99 | 247 |
| PbeC3H19 | GWHPAAYT017142 | Chr14 | GWHAAYT00000014:5501838-5504673( -) | 3 | 2 | 9.42 | 30.09 | 288 |
| PbeC3H20 | GWHPAAYT056173 | Chr9 | GWHAAYT00000009:23753571-23754619( +) | 2 | 1 | 6.46 | 34.89 | 309 |
| PbeC3H21 | GWHPAAYT010413 | Chr12 | GWHAAYT00000012:5269776-5272693( -) | 3 | 2 | 9.37 | 31.47 | 302 |
| PbeC3H22 | GWHPAAYT006210 | Chr11 | GWHAAYT00000011:1040419-1043545( -) | 3 | 2 | 9.32 | 31.98 | 302 |
| PbeC3H23 | GWHPAAYT030661 | Chr17 | GWHAAYT00000017:26070704-26071724( +) | 2 | 1 | 7.13 | 33.68 | 299 |
| PbeC3H24 | GWHPAAYT034368 | Chr3 | GWHAAYT00000003:1946353-1948269( -) | 2 | 1 | 9.00 | 27.51 | 258 |
| PbeC3H25 | GWHPAAYT024734 | Chr16 | GWHAAYT00000016:1951119-1952453( -) | 2 | 1 | 6.60 | 37.41 | 332 |
| PbeC3H26 | GWHPAAYT018566 | Chr14 | GWHAAYT00000014:19711176-19722925( -) | 3 | 20 | 5.52 | 97.80 | 869 |
| PbeC3H27 | GWHPAAYT013276 | Chr13 | GWHAAYT00000013:1972178-1976710( -) | 2 | 5 | 6.46 | 70.32 | 622 |
| PbeC3H28 | GWHPAAYT034077 | Chr2 | GWHAAYT00000002:26038459-26043806( -) | 4 | 7 | 7.71 | 45.80 | 411 |
| PbeC3H29 | GWHPAAYT000077 | Chr1 | GWHAAYT00000001:928279-930632( +) | 3 | 1 | 8.77 | 82.70 | 740 |
| PbeC3H30 | GWHPAAYT047287 | Chr7 | GWHAAYT00000007:641667-646360( -) | 4 | 6 | 7.94 | 40.78 | 368 |
| PbeC3H31 | GWHPAAYT007652 | Chr11 | GWHAAYT00000011:14107273-14109742( +) | 2 | 4 | 9.52 | 36.70 | 310 |
| PbeC3H32 | GWHPAAYT057935 | Scaffold13 | GWHAAYT00000030:524170-526802( -) | 2 | 4 | 9.54 | 38.05 | 325 |
| PbeC3H33 | GWHPAAYT016608 | Chr14 | GWHAAYT00000014:1217832-1220347( +) | 2 | 4 | 9.48 | 37.96 | 325 |
| PbeC3H34 | GWHPAAYT037439 | Chr3 | GWHAAYT00000003:30730655-30736825( +) | 2 | 13 | 6.15 | 114.74 | 1015 |
| PbeC3H35 | GWHPAAYT044398 | Chr6 | GWHAAYT00000006:164404-169644( +) | 2 | 11 | 9.09 | 80.95 | 692 |
| PbeC3H36 | GWHPAAYT035367 | Chr3 | GWHAAYT00000003:10446769-10454852( -) | 2 | 11 | 8.29 | 107.94 | 937 |
| PbeC3H37 | GWHPAAYT035368 | Chr3 | GWHAAYT00000003:10461664-10469805( -) | 2 | 12 | 6.68 | 111.28 | 967 |
| PbeC3H38 | GWHPAAYT035458 | Chr3 | GWHAAYT00000003:11484892-11493030( +) | 2 | 12 | 6.68 | 111.28 | 967 |
| PbeC3H39 | GWHPAAYT035459 | Chr3 | GWHAAYT00000003:11499894-11507981( +) | 2 | 11 | 7.99 | 114.44 | 992 |
| PbeC3H40 | GWHPAAYT043462 | Chr5 | GWHAAYT00000005:31128036-31134192( +) | 2 | 8 | 6.08 | 73.74 | 633 |
| PbeC3H41 | GWHPAAYT030146 | Chr17 | GWHAAYT00000017:21761540-21763264( +) | 2 | 1 | 9.21 | 30.19 | 269 |
| PbeC3H42 | GWHPAAYT024365 | Chr15 | GWHAAYT00000015:45055282-45065570( +) | 2 | 14 | 7.86 | 143.22 | 1242 |
| PbeC3H43 | GWHPAAYT049001 | Chr7 | GWHAAYT00000007:16963722-16964921( -) | 1 | 3 | 8.16 | 34.60 | 304 |
| PbeC3H44 | GWHPAAYT057319 | Contig7 | GWHAAYT00000054:142463-143662( +) | 1 | 3 | 8.34 | 35.14 | 308 |
| PbeC3H45 | GWHPAAYT000810 | Chr1 | GWHAAYT00000001:8333661-8334865( -) | 1 | 2 | 6.06 | 35.94 | 316 |
| PbeC3H46 | GWHPAAYT021404 | Chr15 | GWHAAYT00000015:13293137-13297144( +) | 3 | 6 | 6.11 | 107.69 | 984 |
| PbeC3H47 | GWHPAAYT039624 | Chr4 | GWHAAYT00000004:22915022-22916168( +) | 1 | 2 | 6.24 | 35.70 | 317 |
| PbeC3H48 | GWHPAAYT037541 | Chr4 | GWHAAYT00000004:20463-25338( -) | 1 | 9 | 8.32 | 42.20 | 390 |
| PbeC3H49 | GWHPAAYT031715 | Chr2 | GWHAAYT00000002:4399000-4402315( -) | 2 | 9 | 6.20 | 67.20 | 606 |
| PbeC3H50 | GWHPAAYT058631 | Scaffold24 | GWHAAYT00000041:131755-134103( -) | 2 | 3 | 9.16 | 36.49 | 325 |
| PbeC3H51 | GWHPAAYT021385 | Chr15 | GWHAAYT00000015:13170843-13174257( -) | 2 | 9 | 6.42 | 67.54 | 606 |
| PbeC3H52 | GWHPAAYT030139 | Chr17 | GWHAAYT00000017:21665180-21666657( +) | 2 | 1 | 9.15 | 30.26 | 270 |
| PbeC3H53 | GWHPAAYT046336 | Chr6 | GWHAAYT00000006:19022556-19029581( -) | 1 | 10 | 8.33 | 48.64 | 425 |
| PbeC3H54 | GWHPAAYT022983 | Chr15 | GWHAAYT00000015:28484438-28489111( -) | 3 | 2 | 9.15 | 99.03 | 885 |
| PbeC3H55 | GWHPAAYT051284 | Chr8 | GWHAAYT00000008:4635900-4636979( -) | 2 | 0 | 9.09 | 39.61 | 359 |
| PbeC3H56 | GWHPAAYT030480 | Chr17 | GWHAAYT00000017:24593950-24595263( -) | 2 | 0 | 8.05 | 47.78 | 437 |
| PbeC3H57 | GWHPAAYT006773 | Chr11 | GWHAAYT00000011:6308703-6310411( +) | 1 | 2 | 8.74 | 49.80 | 422 |
| PbeC3H58 | GWHPAAYT034798 | Chr3 | GWHAAYT00000003:5499738-5501559( +) | 1 | 2 | 8.64 | 54.84 | 468 |
| PbeC3H59 | GWHPAAYT001887 | Chr1 | GWHAAYT00000001:15813371-15816672( -) | 2 | 7 | 7.14 | 42.01 | 387 |
| PbeC3H60 | GWHPAAYT005485 | Chr10 | GWHAAYT00000010:30174061-30177245( +) | 1 | 4 | 5.12 | 85.24 | 770 |
| PbeC3H61 | GWHPAAYT050090 | Chr7 | GWHAAYT00000007:25191629-25195132( -) | 2 | 8 | 7.14 | 47.22 | 434 |
| PbeC3H62 | GWHPAAYT056049 | Chr9 | GWHAAYT00000009:22592310-22593644( -) | 2 | 0 | 6.67 | 48.90 | 444 |
| PbeC3H63 | GWHPAAYT049908 | Chr7 | GWHAAYT00000007:23993782-23994672( +) | 2 | 0 | 7.89 | 34.33 | 296 |
| PbeC3H64 | GWHPAAYT031639 | Chr2 | GWHAAYT00000002:3718563-3719777( +) | 2 | 0 | 6.56 | 44.28 | 404 |
| PbeC3H65 | GWHPAAYT020039 | Chr15 | GWHAAYT00000015:3758094-3759338( -) | 2 | 1 | 6.63 | 42.70 | 386 |
| PbeC3H66 | GWHPAAYT043888 | Chr5 | GWHAAYT00000005:34068173-34071488( +) | 1 | 4 | 5.34 | 90.44 | 814 |
| PbeC3H67 | GWHPAAYT007452 | Chr11 | GWHAAYT00000011:11989508-11994851( +) | 1 | 14 | 5.50 | 90.89 | 833 |
| PbeC3H68 | GWHPAAYT035218 | Chr3 | GWHAAYT00000003:8805509-8810690( +) | 1 | 13 | 5.48 | 90.74 | 830 |
| PbeC3H69 | GWHPAAYT021328 | Chr15 | GWHAAYT00000015:12834928-12836121( +) | 2 | 0 | 6.61 | 43.58 | 397 |
| PbeC3H70 | GWHPAAYT033934 | Chr2 | GWHAAYT00000002:24630931-24633862( -) | 1 | 7 | 5.96 | 77.20 | 719 |
| PbeC3H71 | GWHPAAYT024373 | Chr15 | GWHAAYT00000015:45121249-45132331( +) | 1 | 14 | 6.94 | 146.29 | 1271 |
| PbeC3H72 | GWHPAAYT012207 | Chr12 | GWHAAYT00000012:23241819-23242865( +) | 1 | 3 | 7.69 | 16.03 | 142 |
| PbeC3H73 | GWHPAAYT008395 | Chr11 | GWHAAYT00000011:23033685-23037002( -) | 1 | 7 | 6.27 | 71.50 | 642 |
| PbeC3H74 | GWHPAAYT036140 | Chr3 | GWHAAYT00000003:19611823-19615676( -) | 1 | 6 | 5.98 | 75.18 | 685 |
| PbeC3H75 | GWHPAAYT008394 | Chr11 | GWHAAYT00000011:23001654-23005914( -) | 1 | 6 | 5.77 | 75.91 | 693 |
| PbeC3H76 | GWHPAAYT021131 | Chr15 | GWHAAYT00000015:11077946-11079958( -) | 3 | 2 | 4.93 | 43.53 | 392 |
| PbeC3H77 | GWHPAAYT056600 | Contig11 | GWHAAYT00000058:4512-6882( +) | 2 | 6 | 9.03 | 49.63 | 457 |
| PbeC3H78 | GWHPAAYT036141 | Chr3 | GWHAAYT00000003:19631658-19634938( -) | 1 | 7 | 6.29 | 69.73 | 625 |
| PbeC3H79 | GWHPAAYT032958 | Chr2 | GWHAAYT00000002:14472402-14474766( -) | 2 | 5 | 9.01 | 53.33 | 487 |
| PbeC3H80 | GWHPAAYT036362 | Chr3 | GWHAAYT00000003:22251997-22254706( +) | 1 | 6 | 6.43 | 63.04 | 557 |
| PbeC3H81 | GWHPAAYT008775 | Chr11 | GWHAAYT00000011:26571528-26574945( +) | 2 | 4 | 6.03 | 55.53 | 507 |
| PbeC3H82 | GWHPAAYT049718 | Chr7 | GWHAAYT00000007:22823019-22825010( +) | 2 | 0 | 7.51 | 72.74 | 663 |
| PbeC3H83 | GWHPAAYT017283 | Chr14 | GWHAAYT00000014:6682374-6684572( -) | 2 | 0 | 6.05 | 79.63 | 732 |
| PbeC3H84 | GWHPAAYT058639 | Scaffold25 | GWHAAYT00000042:5861-8059( -) | 2 | 0 | 6.05 | 79.63 | 732 |
| PbeC3H85 | GWHPAAYT010500 | Chr12 | GWHAAYT00000012:6337374-6339584( -) | 2 | 0 | 5.94 | 80.05 | 736 |
| PbeC3H86 | GWHPAAYT024495 | Chr16 | GWHAAYT00000016:503060-505966( +) | 3 | 2 | 8.67 | 72.79 | 652 |
| PbeC3H87 | GWHPAAYT006735 | Chr11 | GWHAAYT00000011:6089514-6091628( -) | 2 | 0 | 5.70 | 76.88 | 704 |
| PbeC3H88 | GWHPAAYT034763 | Chr3 | GWHAAYT00000003:5237873-5239969( -) | 2 | 0 | 5.80 | 76.34 | 698 |
| PbeC3H89 | GWHPAAYT013030 | Chr13 | GWHAAYT00000013:529675-532829( +) | 3 | 2 | 5.56 | 82.48 | 741 |
| PbeC3H90 | GWHPAAYT032233 | Chr2 | GWHAAYT00000002:7924881-7931140( +) | 1 | 9 | 5.75 | 155.91 | 1417 |
| PbeC3H91 | GWHPAAYT005126 | Chr10 | GWHAAYT00000010:27598083-27603908( +) | 3 | 6 | 7.23 | 73.25 | 669 |
| PbeC3H92 | GWHPAAYT043550 | Chr5 | GWHAAYT00000005:31745087-31750861( +) | 3 | 6 | 6.38 | 73.49 | 671 |
| PbeC3H93 | GWHPAAYT002960 | Chr10 | GWHAAYT00000010:5349432-5351904( +) | 1 | 2 | 8.41 | 80.44 | 755 |
| PbeC3H94 | GWHPAAYT019605 | Chr15 | GWHAAYT00000015:730010-733989( -) | 1 | 3 | 6.09 | 46.52 | 428 |
| PbeC3H95 | GWHPAAYT001497 | Chr1 | GWHAAYT00000001:13445177-13449529( +) | 2 | 2 | 8.55 | 80.82 | 735 |
| PbeC3H96 | GWHPAAYT011456 | Chr12 | GWHAAYT00000012:17323959-17326963( -) | 2 | 7 | 6.98 | 40.72 | 359 |
| PbeC3H97 | GWHPAAYT039053 | Chr4 | GWHAAYT00000004:18005521-18008144( -) | 2 | 7 | 5.41 | 43.07 | 376 |
| PbeC3H98 | GWHPAAYT032215 | Chr2 | GWHAAYT00000002:7795622-7799068( -) | 1 | 3 | 9.25 | 54.07 | 497 |
| PbeC3H99 | GWHPAAYT021769 | Chr15 | GWHAAYT00000015:15920198-15923173( -) | 1 | 3 | 9.35 | 53.12 | 491 |
| PbeC3H100 | GWHPAAYT049365 | Chr7 | GWHAAYT00000007:20269487-20273825( -) | 2 | 6 | 5.36 | 44.17 | 388 |
| PbeC3H101 | GWHPAAYT041019 | Chr5 | GWHAAYT00000005:6231421-6243045( +) | 1 | 9 | 4.72 | 182.06 | 1686 |
| PbeC3H102 | GWHPAAYT055054 | Chr9 | GWHAAYT00000009:11732453-11735229( +) | 1 | 8 | 9.69 | 56.89 | 502 |
| PbeC3H103 | GWHPAAYT054501 | Chr9 | GWHAAYT00000009:7330066-7333040( +) | 1 | 6 | 6.50 | 64.03 | 562 |
| PbeC3H104 | GWHPAAYT001179 | Chr1 | GWHAAYT00000001:11358181-11362387( -) | 2 | 7 | 5.19 | 41.36 | 366 |
| PbeC3H105 | GWHPAAYT049306 | Chr7 | GWHAAYT00000007:19777362-19779399( -) | 1 | 2 | 8.33 | 55.43 | 498 |
| PbeC3H106 | GWHPAAYT056822 | Contig23 | GWHAAYT00000070:61051-63087( -) | 1 | 2 | 8.33 | 55.41 | 498 |
| PbeC3H107 | GWHPAAYT028963 | Chr17 | GWHAAYT00000017:7706609-7709177( +) | 1 | 6 | 5.91 | 63.69 | 562 |
| PbeC3H108 | GWHPAAYT051081 | Chr8 | GWHAAYT00000008:3319927-3322376( -) | 1 | 3 | 5.14 | 55.38 | 501 |
| PbeC3H109 | GWHPAAYT053823 | Chr9 | GWHAAYT00000009:2857541-2864019( +) | 1 | 13 | 6.38 | 127.67 | 1153 |
| PbeC3H110 | GWHPAAYT020685 | Chr15 | GWHAAYT00000015:8141321-8154629( -) | 5 | 9 | 8.83 | 223.61 | 2040 |
| PbeC3H111 | GWHPAAYT054318 | Chr9 | GWHAAYT00000009:6055665-6060630( -) | 1 | 11 | 9.10 | 45.61 | 403 |
| PbeC3H112 | GWHPAAYT024476 | Chr16 | GWHAAYT00000016:394457-396533( +) | 1 | 2 | 6.19 | 52.86 | 464 |
| PbeC3H113 | GWHPAAYT021795 | Chr15 | GWHAAYT00000015:16131190-16137379( +) | 1 | 9 | 5.76 | 158.43 | 1441 |
| PbeC3H114 | GWHPAAYT053636 | Chr9 | GWHAAYT00000009:1667637-1676699( -) | 1 | 10 | 6.15 | 159.11 | 1468 |
| PbeC3H115 | GWHPAAYT028069 | Chr17 | GWHAAYT00000017:1526738-1536447( -) | 1 | 6 | 6.13 | 163.16 | 1505 |
| PbeC3H116 | GWHPAAYT019049 | Chr14 | GWHAAYT00000014:22751706-22755724( -) | 1 | 3 | 9.05 | 107.92 | 974 |
| PbeC3H117 | GWHPAAYT008452 | Chr11 | GWHAAYT00000011:23501475-23502838( +) | 1 | 1 | 9.26 | 47.21 | 422 |
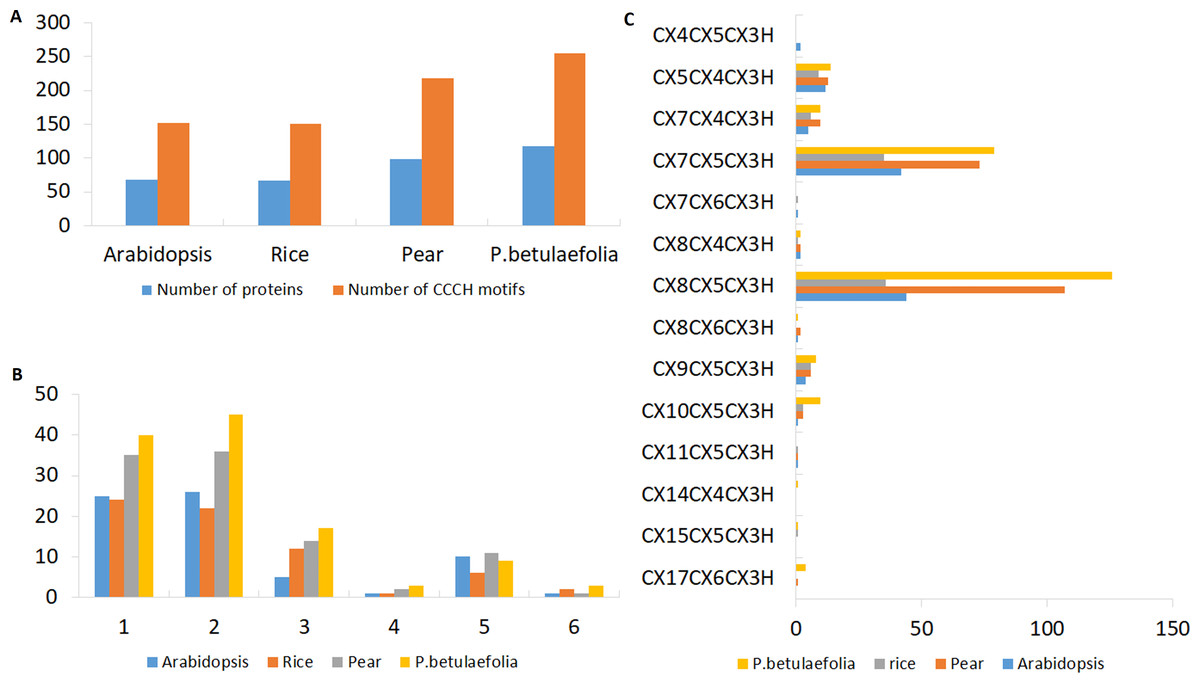
Figure 1: Characterizations of the C3H Znf proteins.
(A) Number of C3H motifs identified in pear, rice and Arabidopsis. (B) Different number of C3H motifs per protein in pear, rice and Arabidopsis. (C) Number of different types of C3H motifs in pear, rice and Arabidopsis.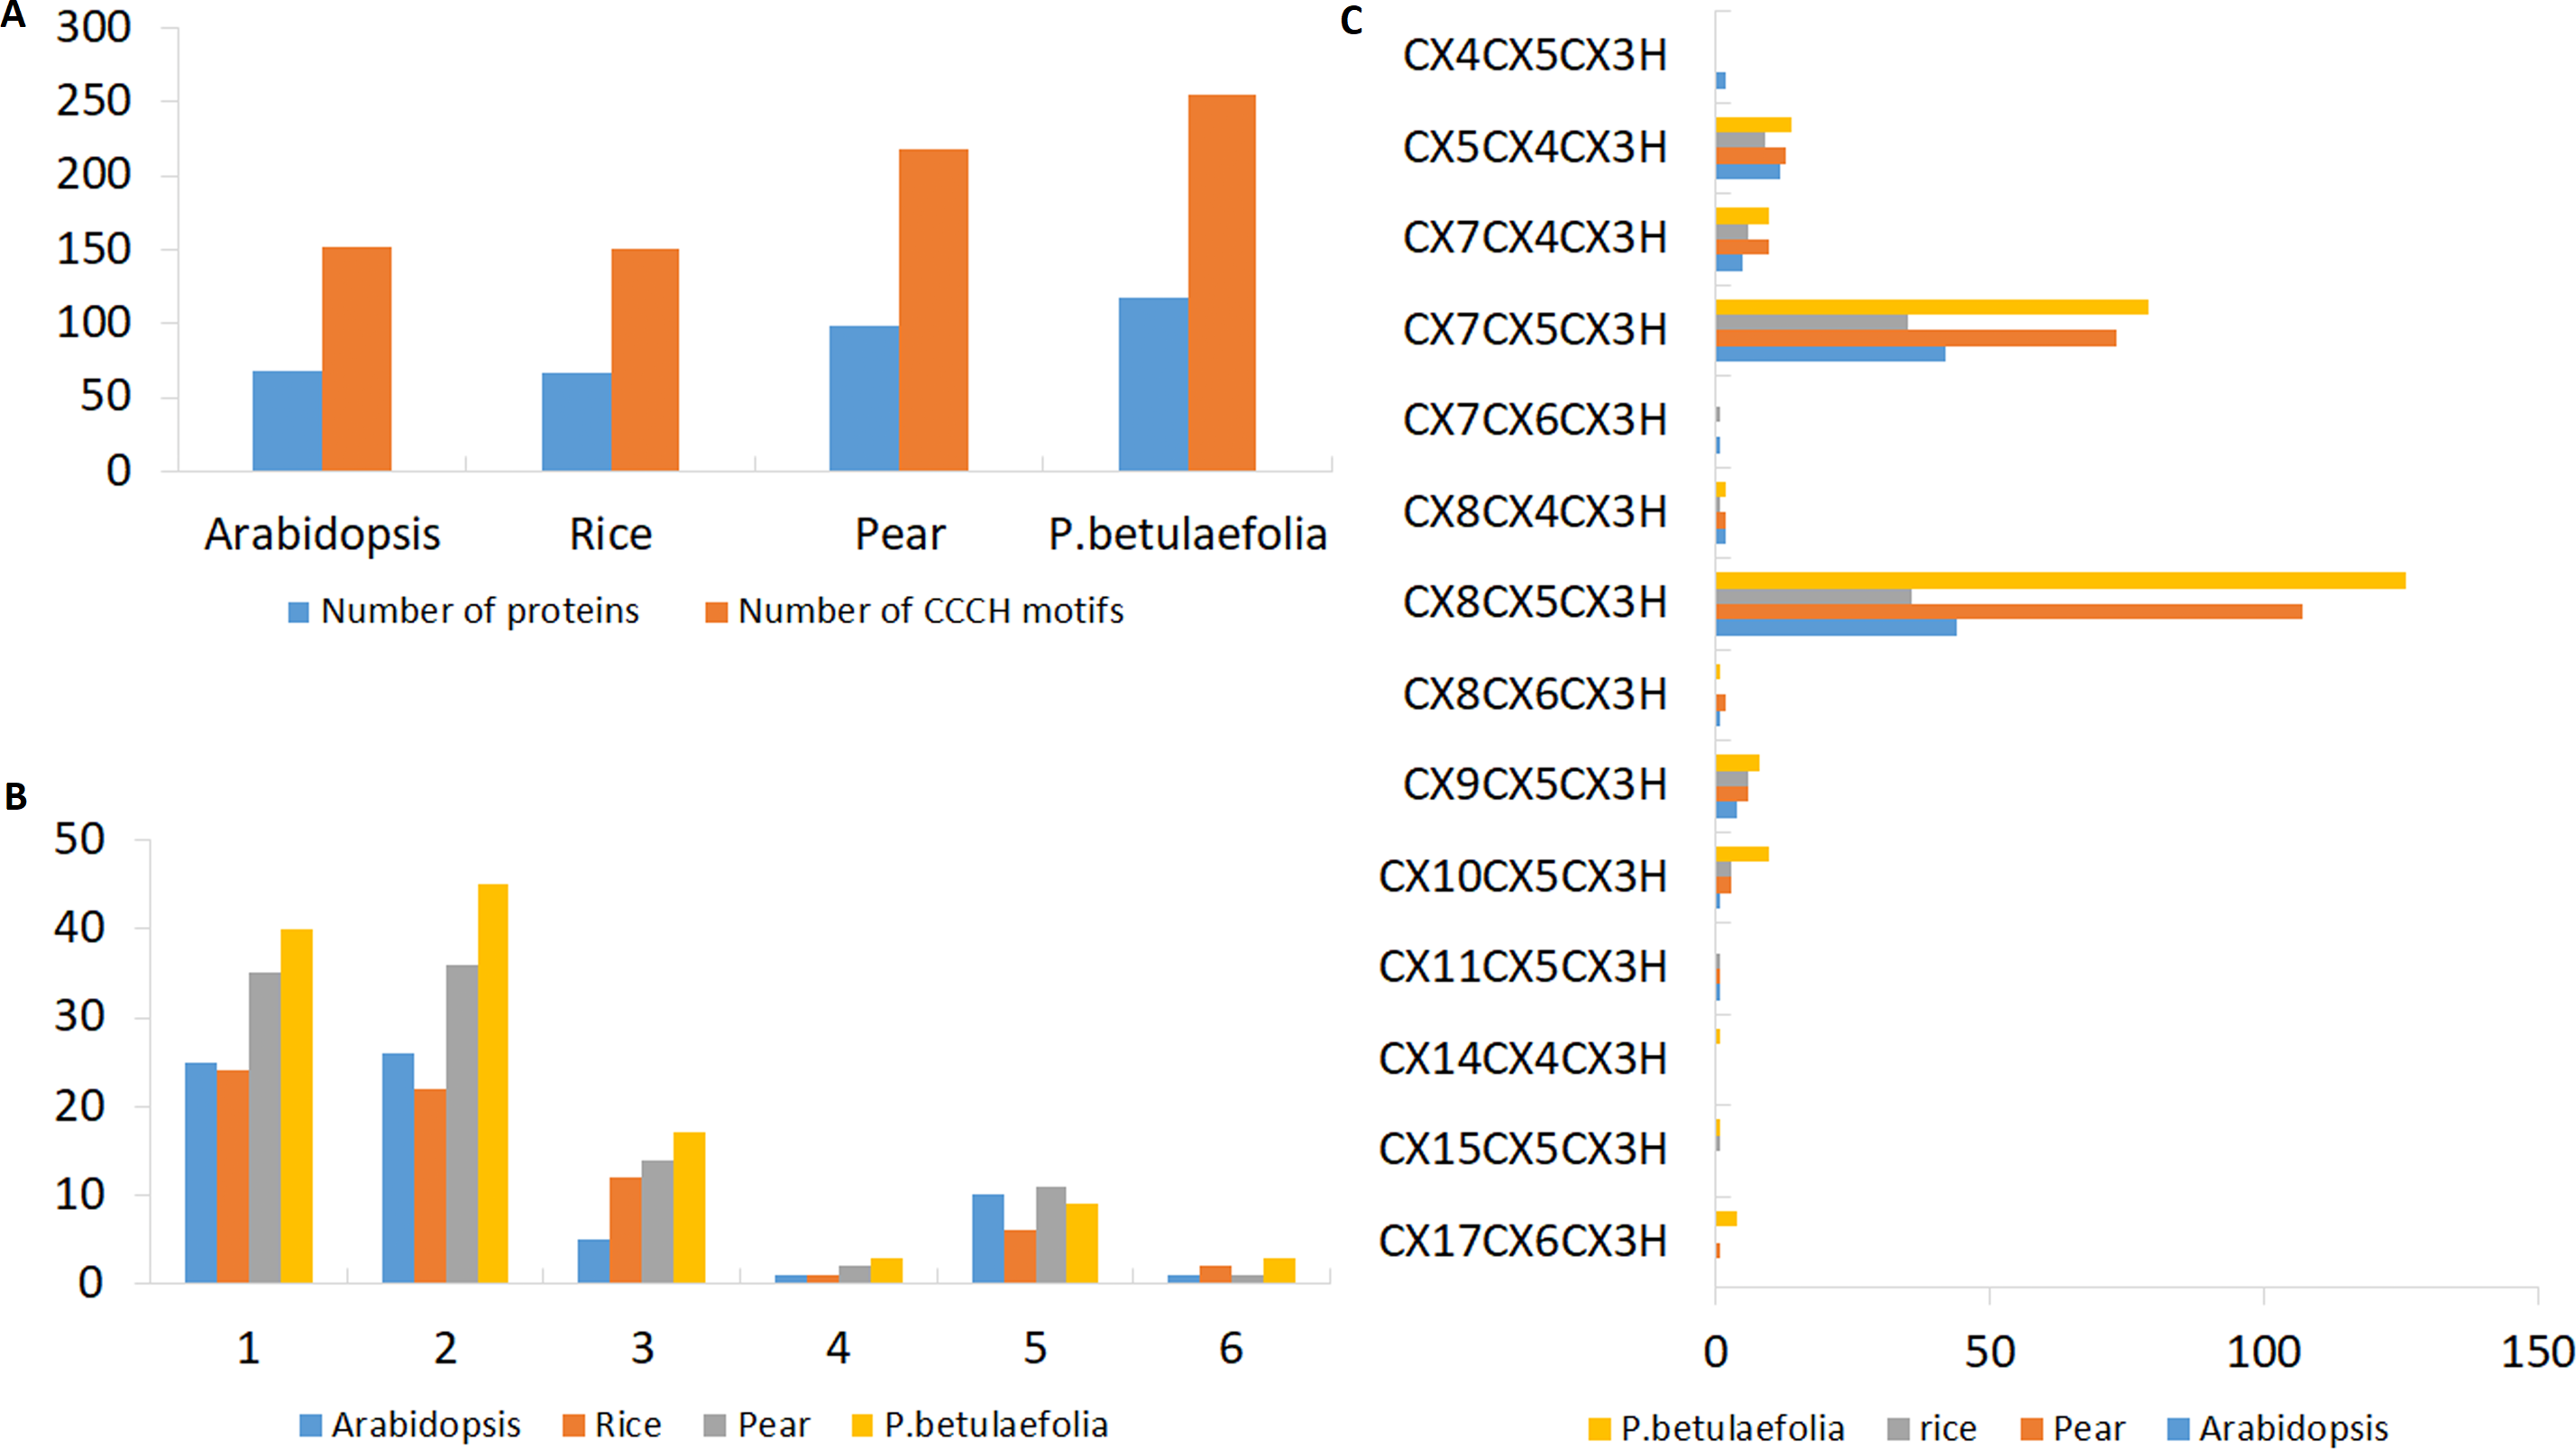
There were more C3H genes found in P. betulaefolia (117) than that in pear (99) and reported for Arabidopsis (68) and rice (67) (Fig. 1A). The numbers of C3H motifs varied accordingly in the three plants (Fig. 1B). the on line tool SMART, MOTIF Search and Pfam databases were used to calculate the total number of C3H Znf motifs in the PbeC3H proteins, and a total of 255 C3H Znf motifs were identified, which exceeded those found in pear (218) (Table S2), Arabidopsis (152) and rice (150) (Wang et al., 2008). We found 1-6 C3H type domains in members of the pear C3H family, and some C3H proteins also carried several other known functional domains, including ANK, KH, RRM, SAP, WD-40, B-box, DEXDc, HELICc, PHD, SWIB, Plus3, GYF, G-patch and ZF-Ring (Fig. 2C), consistent with previous studies (Hudson et al., 2004; Wang et al., 2008; Kramer, Kimblin & Carrington, 2010). We found that the majority of members had either one (40 members) or two (45 members) C3H domains, representing 72.6% of the 117 PbeC3H genes. However, nine members contained five C3H domains, three contained four and three contained six, and 17 contained three domains and one contained one domain (Table 1). As similar results for P. betulaefolia, Arabidopsis and rice, the most common types of C3H motifs in P. betulaefolia were C-X8-C-X5-C-X3-H (49.4%) and C-X8-C-X5-C-X3-H (31.0%) (Fig. 1C). The motif C-X15-C-X5-C-X3-H was only found in member PbeC3H102, motif C-X8-C-X6-C-X3-H was only found in member PbeC3H110 and motif C-X14-C-X6-C-X3-H was only found in PbeC3H117 (Fig. 1C).
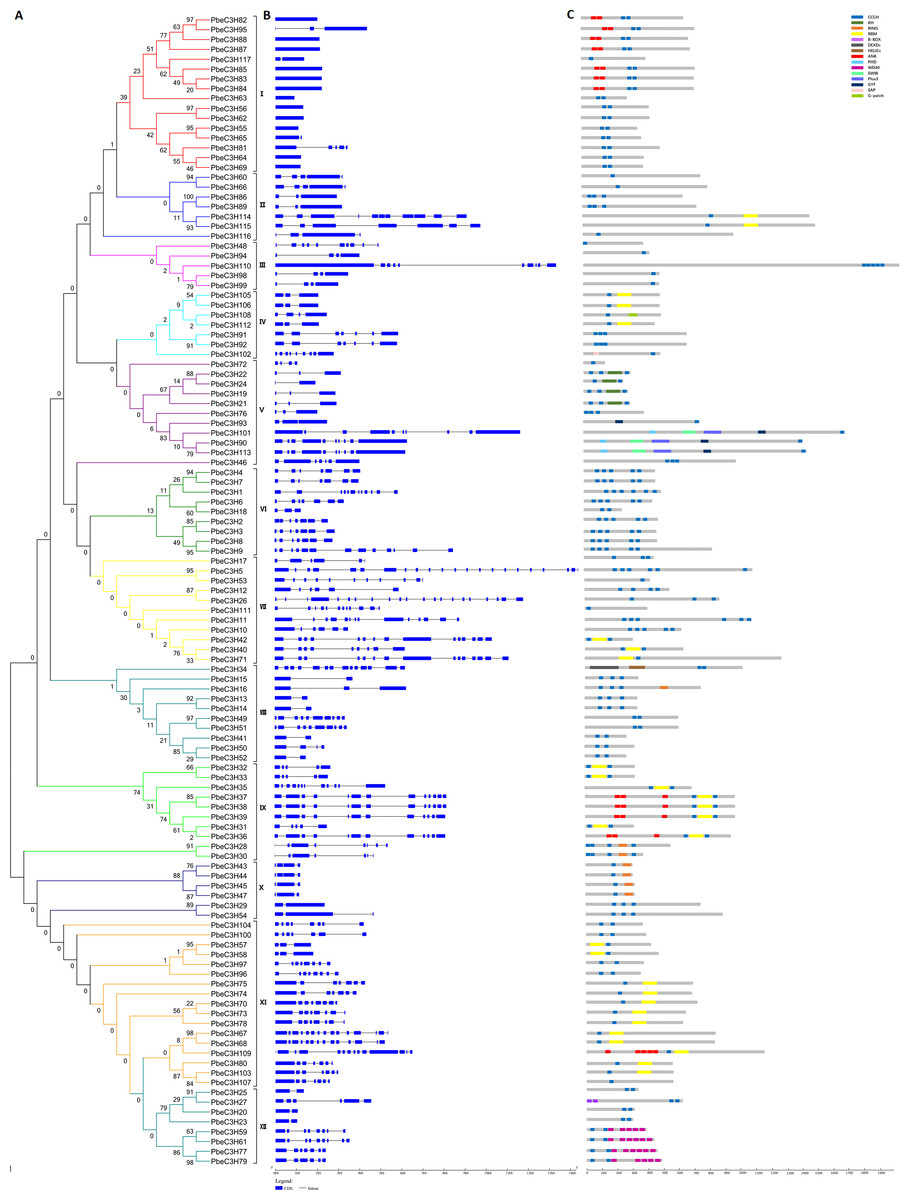
Figure 2: Phylogenetic and structural analysis of the PbC3H family genes.
(A) Phylogenetic tree of the C3H family in pear was generated using the neighbor-joining with 1,000 bootstraps in MEGA 7. (B) Gene structure of the intron-exon and (C) motifs in each C3H proteins.
Phylogeny, classification and structural organization of PbeC3H genes
We constructed a Maximum Likelihood tree based on alignment of the full-length amino acid sequences of the 117 PbeC3Hs to illustrate the evolutionary relationships between them (Fig. 2A). Based on the relationships or clades between proteins and the protein structures or motifs, the 117 PbeC3Hs were divided into 12 groups, designated I-XII. The PbeC3Hs in the same clade shared similar exon-intron structures of their encoding sequences (Fig. 2B) and similar numbers and distributions of functional motifs (Fig. 2C). Conserved exon-intron structures and motif types and number distribution across the PbeC3Hs in each clade strongly supported the reliability of the phylogenetic tree. There were 16 PbeC3H members in group I, seven in group II, five in group III, seven in group IV, 11 in group V, nine in group VI, 11 in group VII, ten in group VIII, ten in group IX, six in group X, 17 in group XI and eight in group XII (Fig. 2A). Group XI and I were the first and second largest with 17 and 16 members. However, group I showed the simplest exon-intron structures. Most of them (12 members) had no intron; PbeC3H65, PbeC3H95 and PbeC3H117 had one or two introns while PbeC3H81 showed much more complex gene structures (Figs. 2A, 2B). Except for most members in group X and some in groups VIII and XII, which contained one or two intron-(s), members of the other groups contained 3-21 introns. Interestingly, although exon-intron organization of C3H genes varied considerably in terms of intron numbers, the intron phase was remarkably well conserved, indicative of exon shuffling during evolution (Kolkman & Stemmer, 2001).
We also noted that the majority of the phylogenetic clades had well-supported bootstrap values, but bootstrap values of some proteins were low at the nodes and the phylogenetic relationships were unclear (Fig. 2A). Even so, considered together with exon-intron structures and conserved motifs, we could also perform gene classification and further analysis. Functional and divers motifs were found among PbeC3Hs including RRMs and K homolog domains (KH) that are involved in RNA processing, and Ankyrin repeats (Ank), WD40 repeats (WD40) and ZF-Ring motifs that are involved in protein-protein interactions or multi-protein complex assembly (Fig. 2C). The conserved motifs were one important basis for classification of C3H genes. For example, the ANK motif was only found in group I, IX and XI, RRM was relatively found in PbeC3H members, the WD-40 was only found in group XII, ZF-Ring was found in groups IX and X, the KH and SWIB motifs were only found in groups V. There are some other motifs such as SAP, B-BOX, DEXDc, HELICc, PHD and G-patch were found in one or two member(s) and Moreover, RRM and KH domain-containing proteins have been demonstrated to play essential roles in many aspects of RNA metabolism, suggesting that the P. betulaefolia C3H proteins harboring these domains may function as RNA-binding proteins and are involved in RNA processing. For example, members PbeC3H19, PbeC3H21, PbeC3H22 and PbeC3H24 contained the conserved KH domain, suggesting that this domain plays important subfamily-specific functions. The phylogenetic reconstruction was further supported by analysis of domain architecture.
Chromosomal locations of PbeC3H genes
Based on the starting position of each gene on the chromosomes, 111 of the 117 PbeC3H genes were physically located on 17 chromosomes, and 6 genes (PbeC3H32, PbeC3H44, PbeC3H50, PbeC3H77, PbeC3H84 and PbeC3H106) remained on unattributed scaffold or contig fragments (Fig. 3 and Table 1). The distribution of PbeC3H genes among chromosomes appeared to be uneven: chromosomes 4, 5, 8, 10 and 13 harbored two to four C3H genes, and relatively high densities of C3Hs were discovered on chromosomes 2, 3, 9, 10, 11 and 15 with more than eight C3H genes. Chromosomes 3 and 15 contained the largest number of C3H genes (13 each) followed by chromosome 11 (ten) and chromosome 2, 9 and 11 (eight each), and sevsn each on chromosome 7 and 17. Notably, some C3Hs located on chromosomes 3, 6, 9, 11, 14 and 15 were arranged in clusters (Fig. 3).
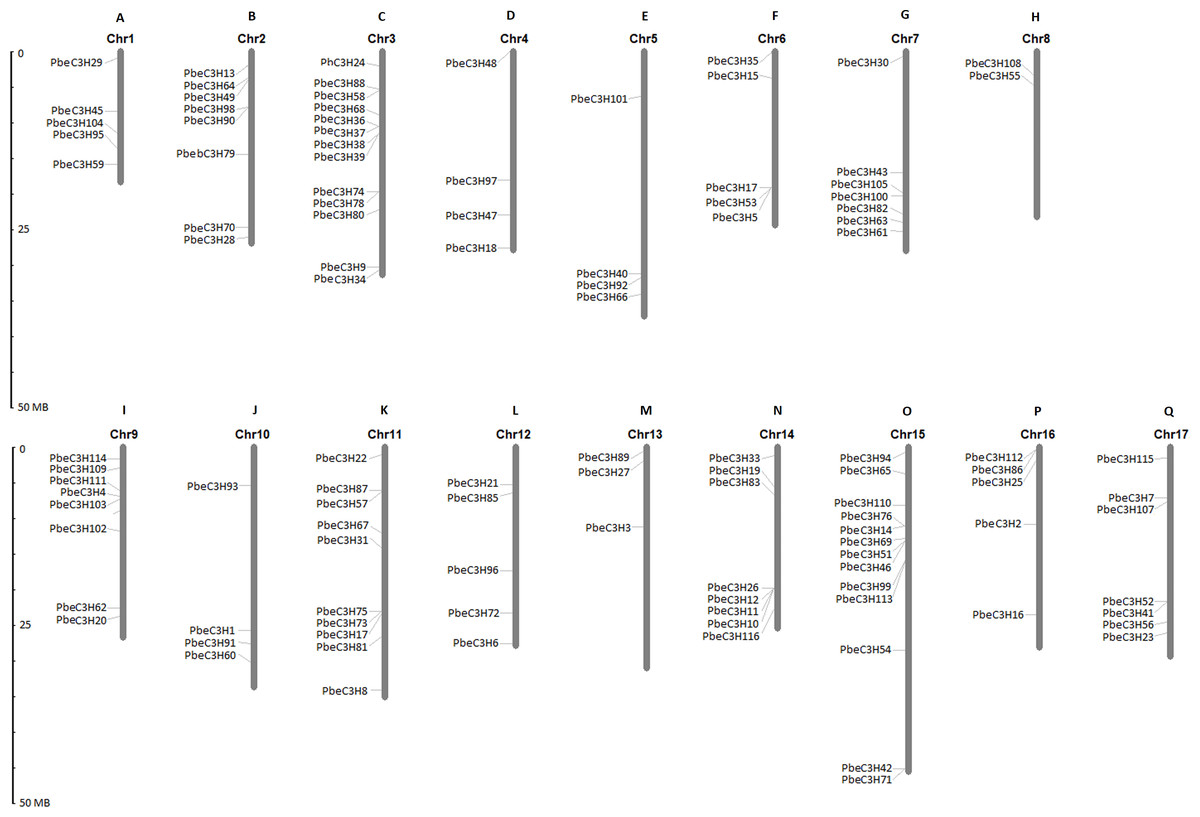
Figure 3: Chromosomal distributions of C3H genes.
The Roman numerals on top of each chromosome represent the number of the chromosome. (A) Chr1, (B) Chr2, (C) Chr3, (D) Chr4, (E) Chr5, (F) Chr6, (G) Chr7, (H) Chr8, (I) Chr9, (J) Chr10, (K) Chr11, (L) Chr12, (M) Chr13, (N) Chr14, (O) Chr15, (P) Chr16 (Q) Chr17.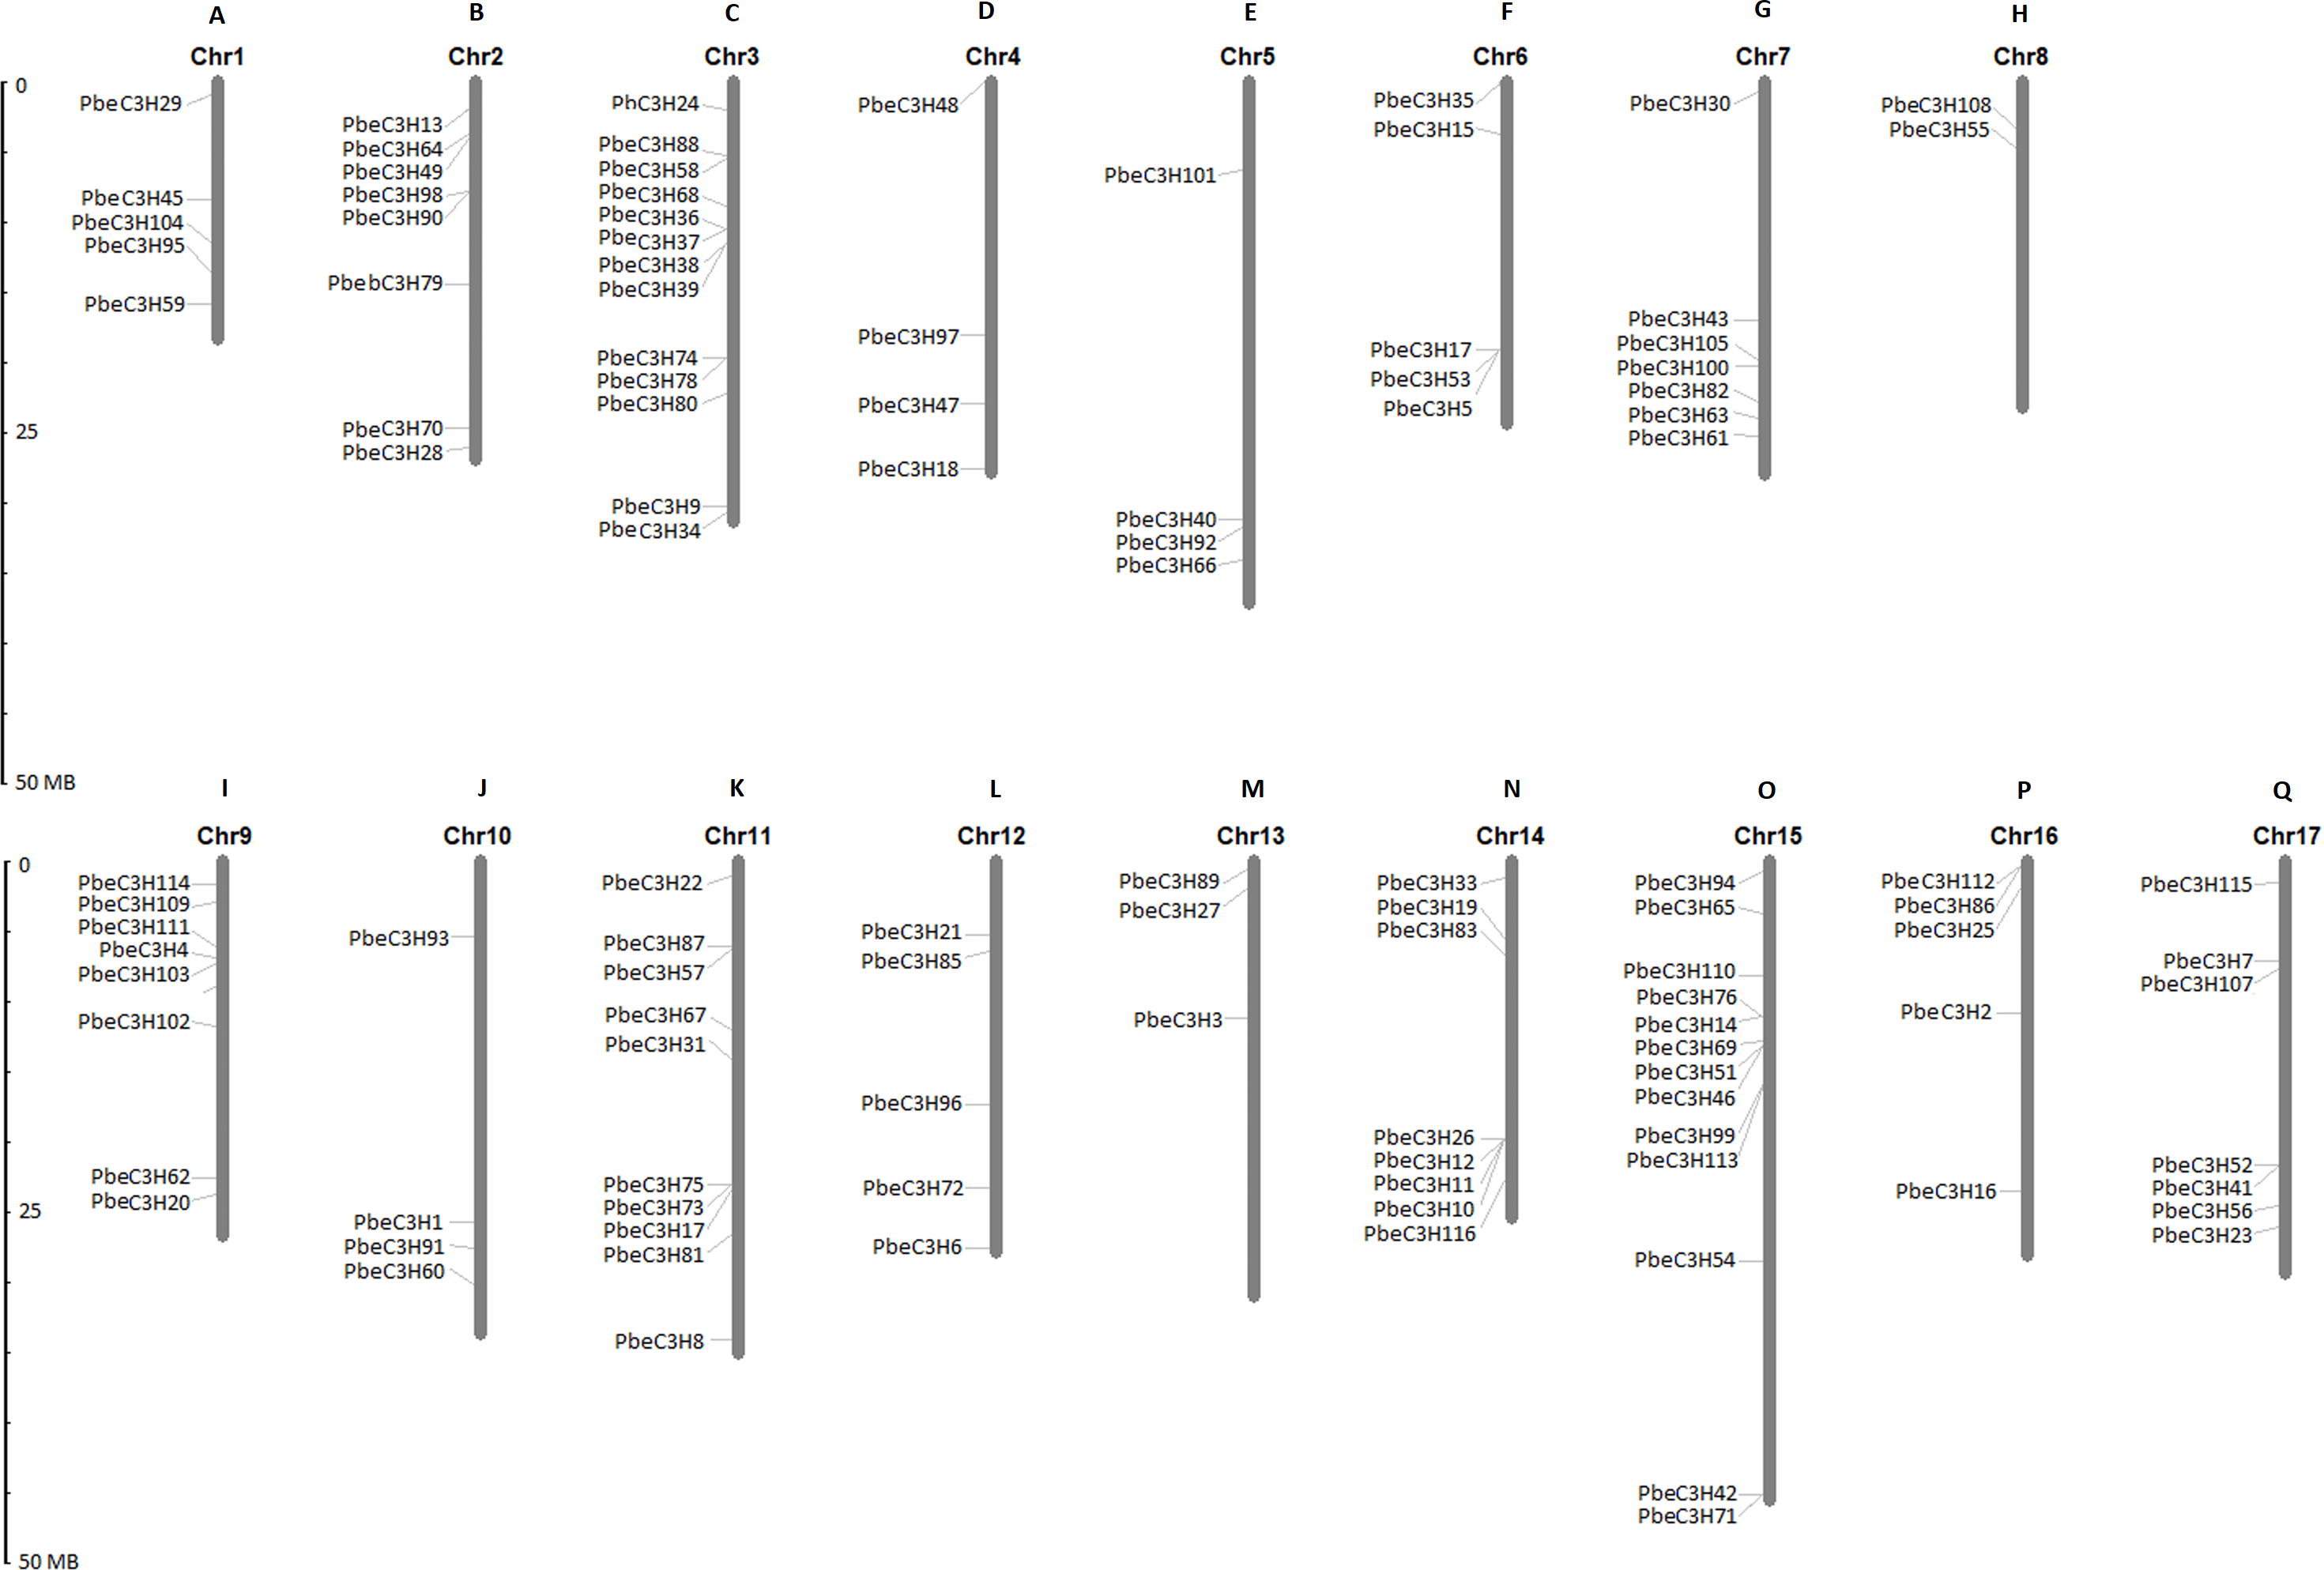
Evolutionary clues of C3H genes in P. betulaefolia and apple
A recent whole-genome duplication (WGD) event shared by P. betulaefolia and apple occurred ∼50 million years ago (MYA), prior to divergence of the two groups ∼22.4–29.4 MYA, but after their divergence from strawberry (Wu et al., 2013; Daccord et al., 2017; Dong et al., 2019). Analysis of the relationship between C3H homologous gene pairs across P. betulaefolia and apple could provide insights into their divergence and evolution. A comparative analysis of the homologous C3H gene pairs across P. betulaefolia and apple was conducted (Fig. 4). Results showed 87 orthologous C3H gene pairs between them, and 35 and 37 paralogous pairs in P. betulaefolia and apple, respectively (Table S3). All the C3H members with synteny relationships were showed using Circos (Fig. 4) (Krzywinski et al., 2009). The Ks values were used to estimate divergence time, which was in range of 0.012–0.125 for orthologous genes and 0.65–6.74 MYA for the time. The estimate of the divergence time was considerably less than that of the speciation time (22.4–39.4 MYA) (Dong et al., 2019). This suggested divergence of the orthologous gene pairs between P. betulaefolia and apple occurred after their speciation (Daccord et al., 2017; Dong et al., 2019). Moreover, the estimated divergence time based on Ks values of the C3H paralogous gene within P. betulaefolia or apple genome was in the range of 5.77–19.40 and 5.45–15.76 MYA, respectively; both occurred after the WGD event in their common ancestor (Fig. 4 and Table S3). This indicates that the C3H genes in both P. betulaefolia and apple experienced the WGD event (Daccord et al., 2017; Dong et al., 2019).
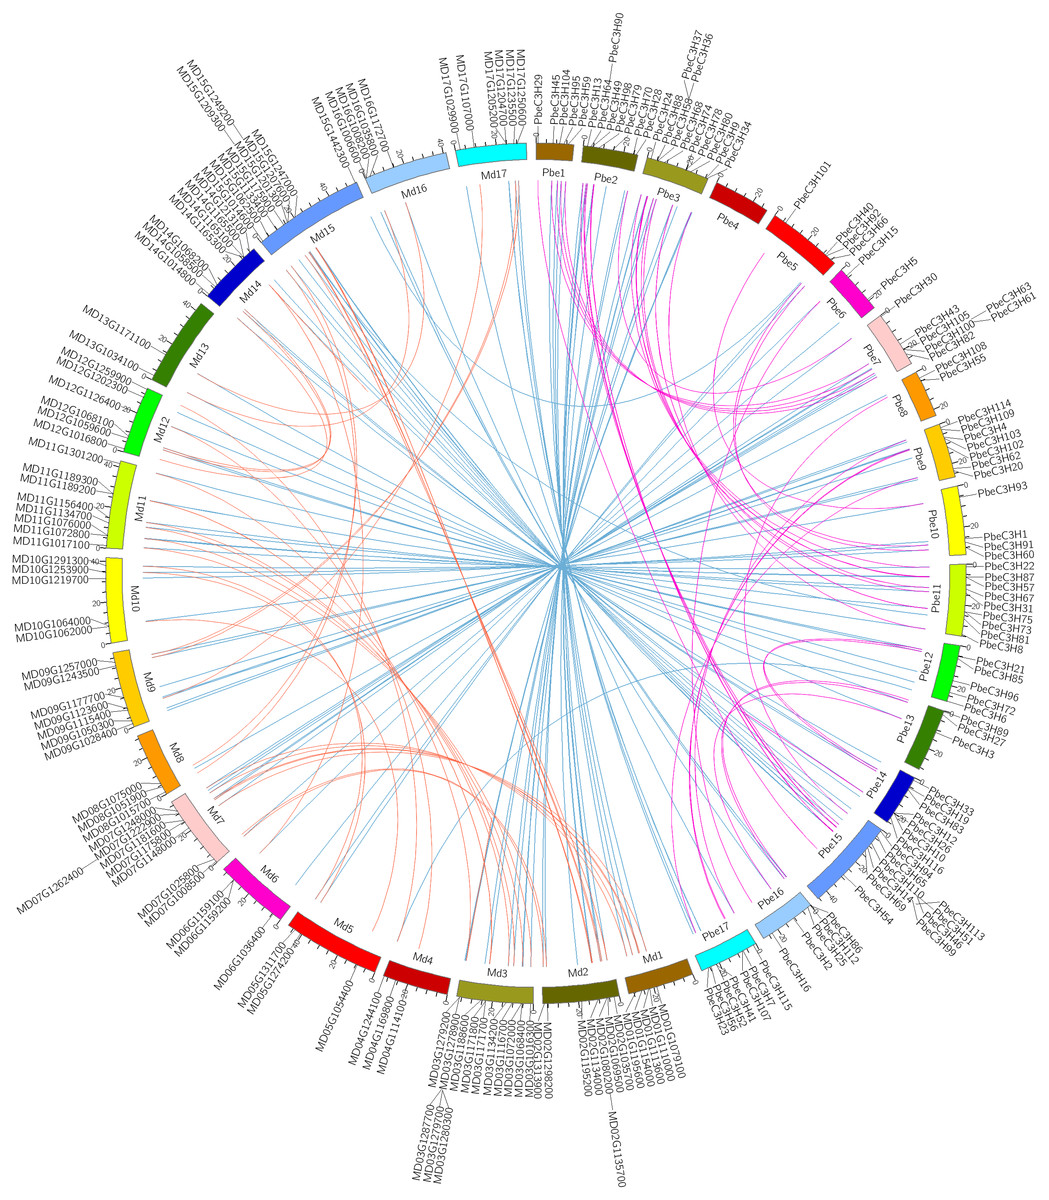
Figure 4: Intra- and interspecific comparisons of C3H genes in pear and apple.
All the C3H gene pairs are depicted in the pear chromosomes. The pink and orange lines indicate intraspecific synteny of C3H genes in pear and apple, the blue lines indicated interspecific synteny between pear and apple.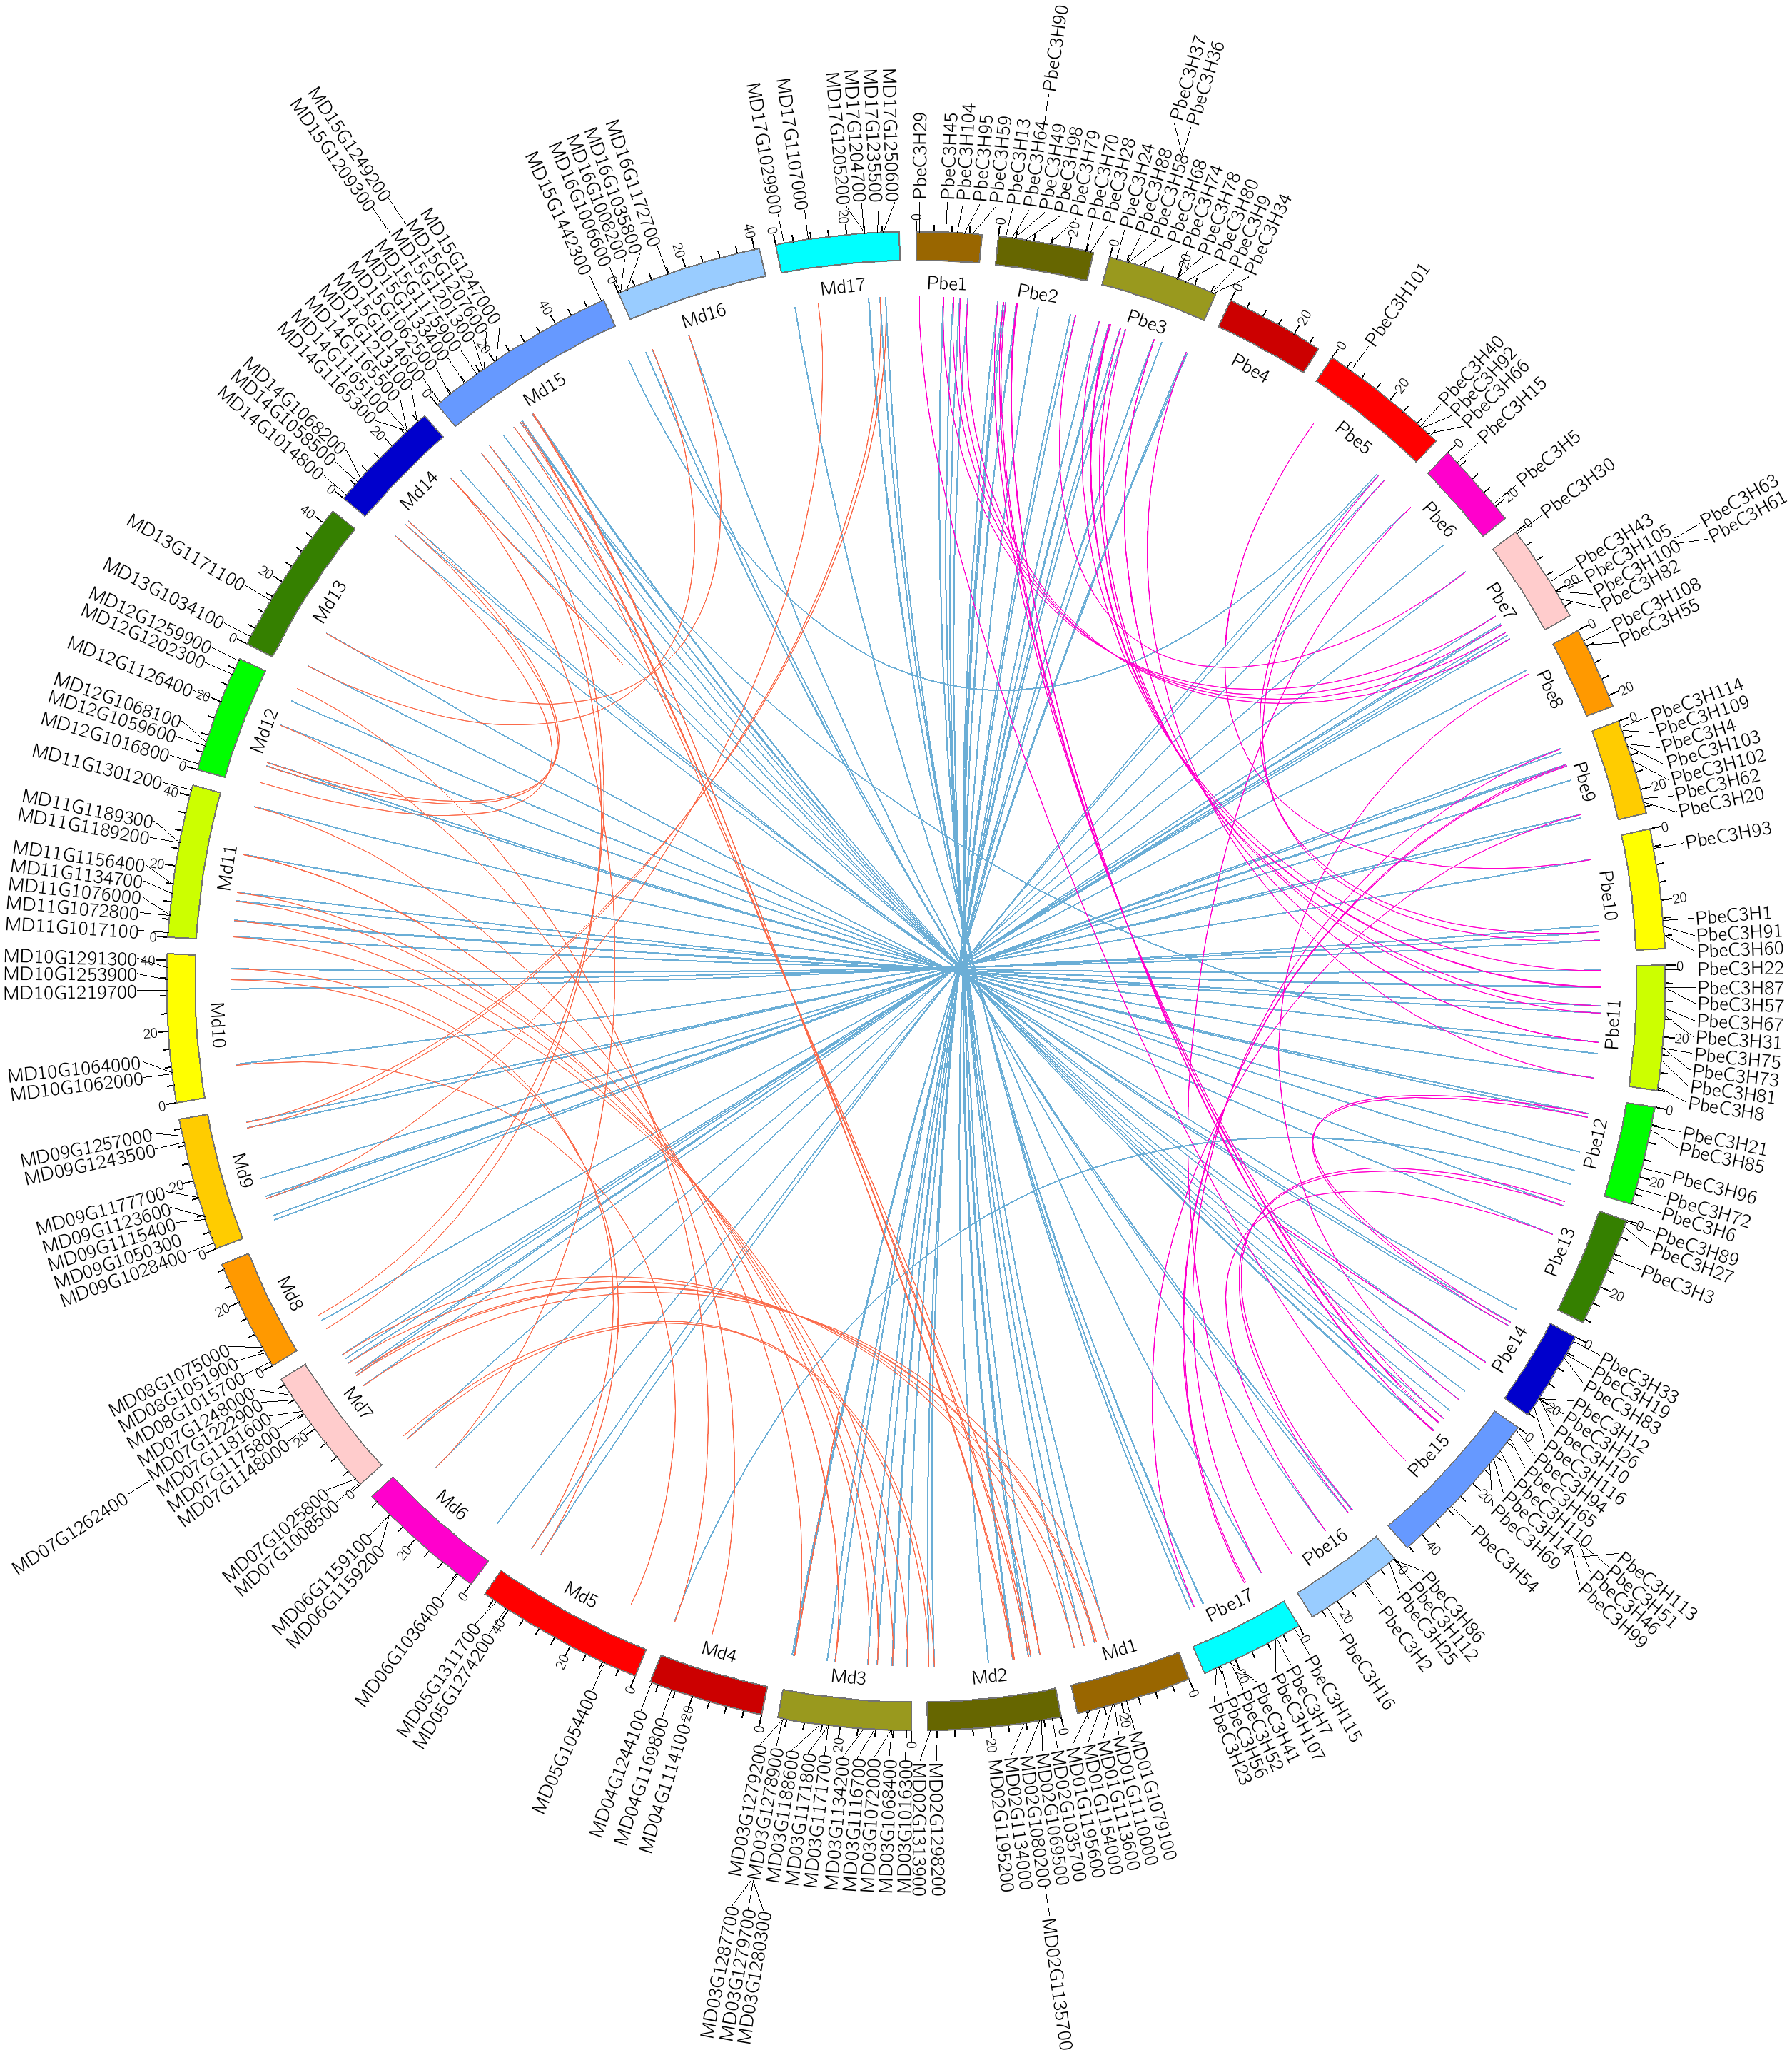
Moreover, the selection types and divergence dates of duplicated gene pairs were investigated by calculating the synonymous (Ks) and non-synonymous substitutions (Ka) per site between duplicated pairs; Ka/Ks = 1 indicates neutral selection, Ka/Ks <1 indicates purifying selection, and Ka/Ks >1 indicates accelerated evolution with positive selection (Yang & Bielawski, 2000; Zhang et al., 2006). The Ks, Ka and Ka/Ks of 35 paralogous gene pairs of C3Hs in P. betulaefolia (Table S3) showed that all paralogous gene pairs of the C3H family had Ks of 0.107–0.359 and Ka/Ks of 0.031–0.586 suggesting all 35 paralogous gene pairs of the PbeC3H family had undergone purifying selection during WGD. The Ks values of 37 paralogous gene pairs of C3Hs in apple within 0.101–0.292 and Ka/Ks ratios was 0–0.877, indicating that they also had undergone purifying selection. The 87 orthologous C3H gene pairs between P. betulaefolia and apple showed slightly different type. Their Ka/Ks ratios was 0–2.198 indicating that most of them in the different species had undergone purifying selection. However, the Ka/Ks of one orthologous gene pairs in P. betulaefolia and apple, PbeC3H66 and MD05G1311700 (Ka/Ks = 20198) undergone strong positive selection (Table S3). The divergence time of the intra-genomic C3H genes was more than that of inter-genomic comparison between P. betulaefolia and apple. This is consistent with the WGD occurring before species differentiation of P. betulaefolia and apple (Daccord et al., 2017; Dong et al., 2019).
Many PbeC3H genes showed induced expression under salt stress
To investigate the expression patterns of the PbeC3H genes, a comprehensive expression analysis was performed based on whole-genome coverage. We analyzed the expression patterns of PbeC3H genes under salt stress using RNA-Seq data generated in a previous study. The RPKM values were used as expressions (Li et al., 2017). Of the 117 C3H genes, 103 showed expression in at least one selected treatment in leaves or roots (Fig. 5). Results indicated that C3H genes showed varied expression patterns in leaves or roots under salt stress. Expression of many of the PbeC3H genes was obviously induced under salt stress in leaves and/or roots. We divided these into five groups according to expression patterns in different organs or under salt stress. To further elucidate the transcription patterns of C3H genes, their expression patterns were clustered across different groups. In general, different groups showed different expression patterns (Fig. 5), suggesting functional divergence of different members of C3H genes. For example, expression of some members in groups a, c and e (Figs. 5A, 5C and 5E) and some in group d (Fig. 5D) was hardly detected in leaves or roots for either salt or control. However, C3H members in groups b and d (Figs. 5B and 5D) and most in group f (Fig. 5F) were relatively highly expressed in all samples (Fig. 5).
Figure 5: Expression patterns of C3H genes under salt stress in leaves and roots.
Scale bars represent the RPKM values. The heat map was drawn using a single color gradient. Groups (A–E) were marked on the right of the picture.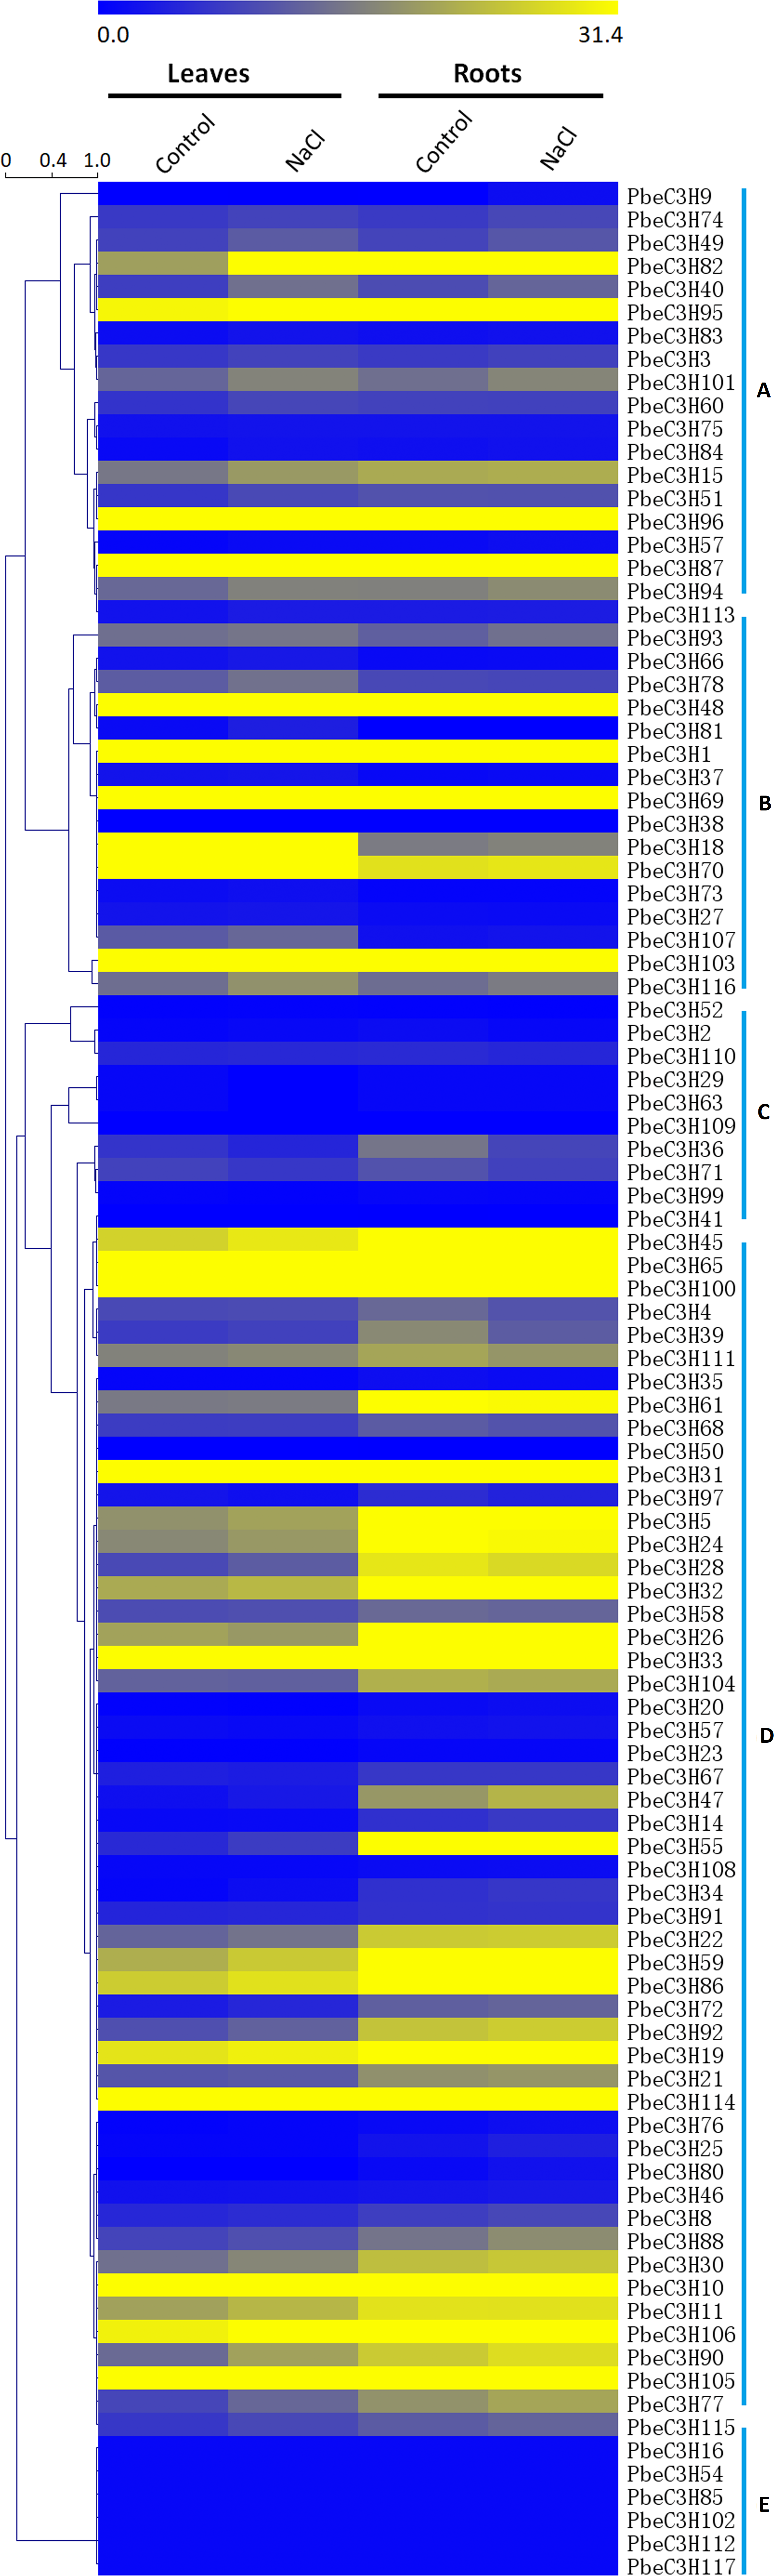
Additionally, Gene Ontology (GO) (https://www.ebi.ac.uk/QuickGO/) analysis was performed to illustrate the function classification of the 117 C3H genes (Table S4). Results showed that the functions of most C3H genes were enriched in metal ion binding, mRNA binding, nuclease activity, transcription factor activity, sequence-specific DNA binding, mRNA 3′-UTR binding, transcription regulatory region DNA binding and transferase activity, transferase activity, etc. This was mostly consistent with the classification of the C3H genes in the phylogenetic tree or the heat map. Results indicate the C3H genes were involved in stress response, such as salt ions transport and metabolism.
To further analyze and validate their expression under salt stress, 18 PbeC3H genes were selected for quantitative real-time PCR. Results showed that four genes (PbeC3H30, PbeC3H59, PbeC3H77 and PbeC3H82) were highly induced by salt stress treatment in roots (Fig. 6). Especially for PbeC3H30, expression was very greatly induced after 24 h under salt stress treatment. Gene PbeC3H59 was induced at 24 and 48 h, but repressed at 12 and 72 h. The PbeC3H77 and PbeC3H82 showed similar expression profiles, being repressed at 24 h but highly induced at the other three time points (Fig. 6). These may indicate complexity in P. betulaefolia root response to salinity.
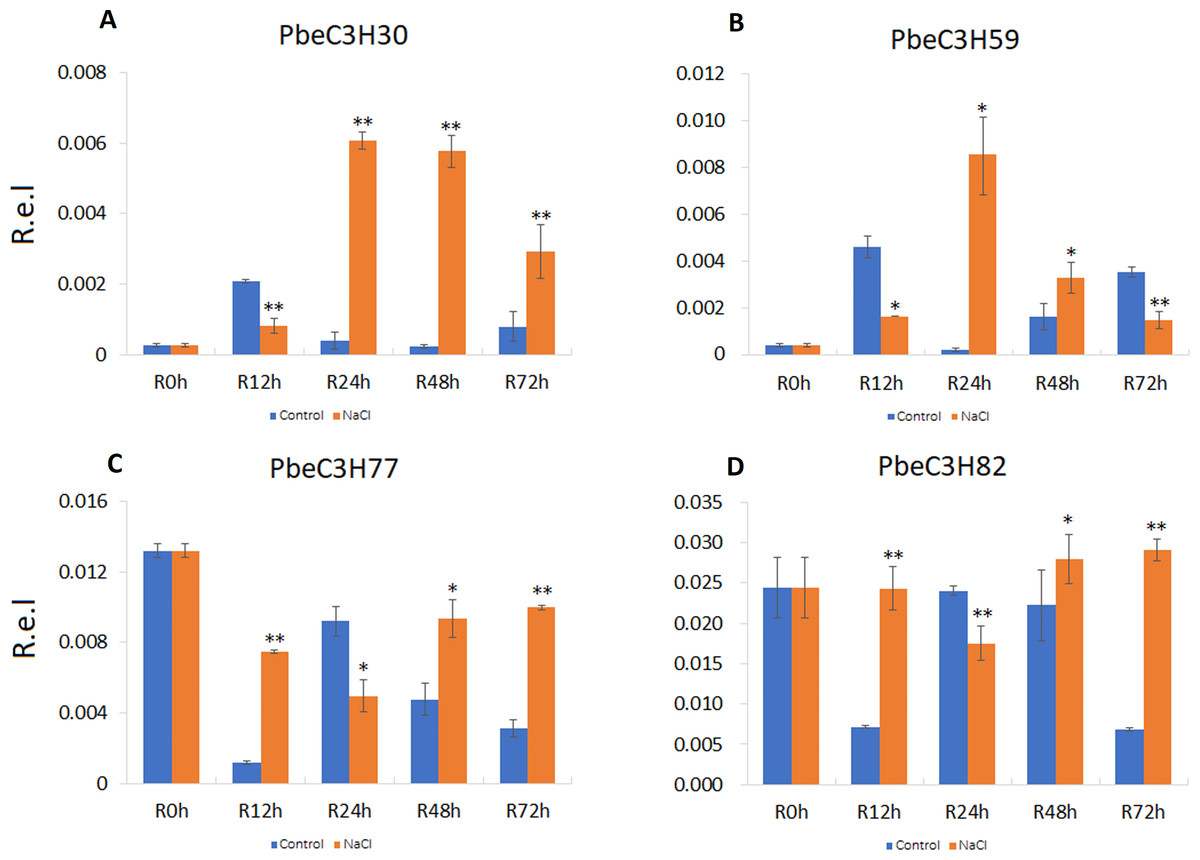
Figure 6: Expression profiles of C3H genes induced under salt stress treatment in roots.
(A–D) Expression for each PbeC3H gene (A) PbeCSH30; (B) PbeC3H59; (C) PbeC3H77; (D) PbeC3H82. Relative expression was calculated using the 2−ΔΔCT method. R.e.l indicates relative expression level. The asterisk and double asterisks represent significant differences at the levels of 0.05 and 0.01, respectively.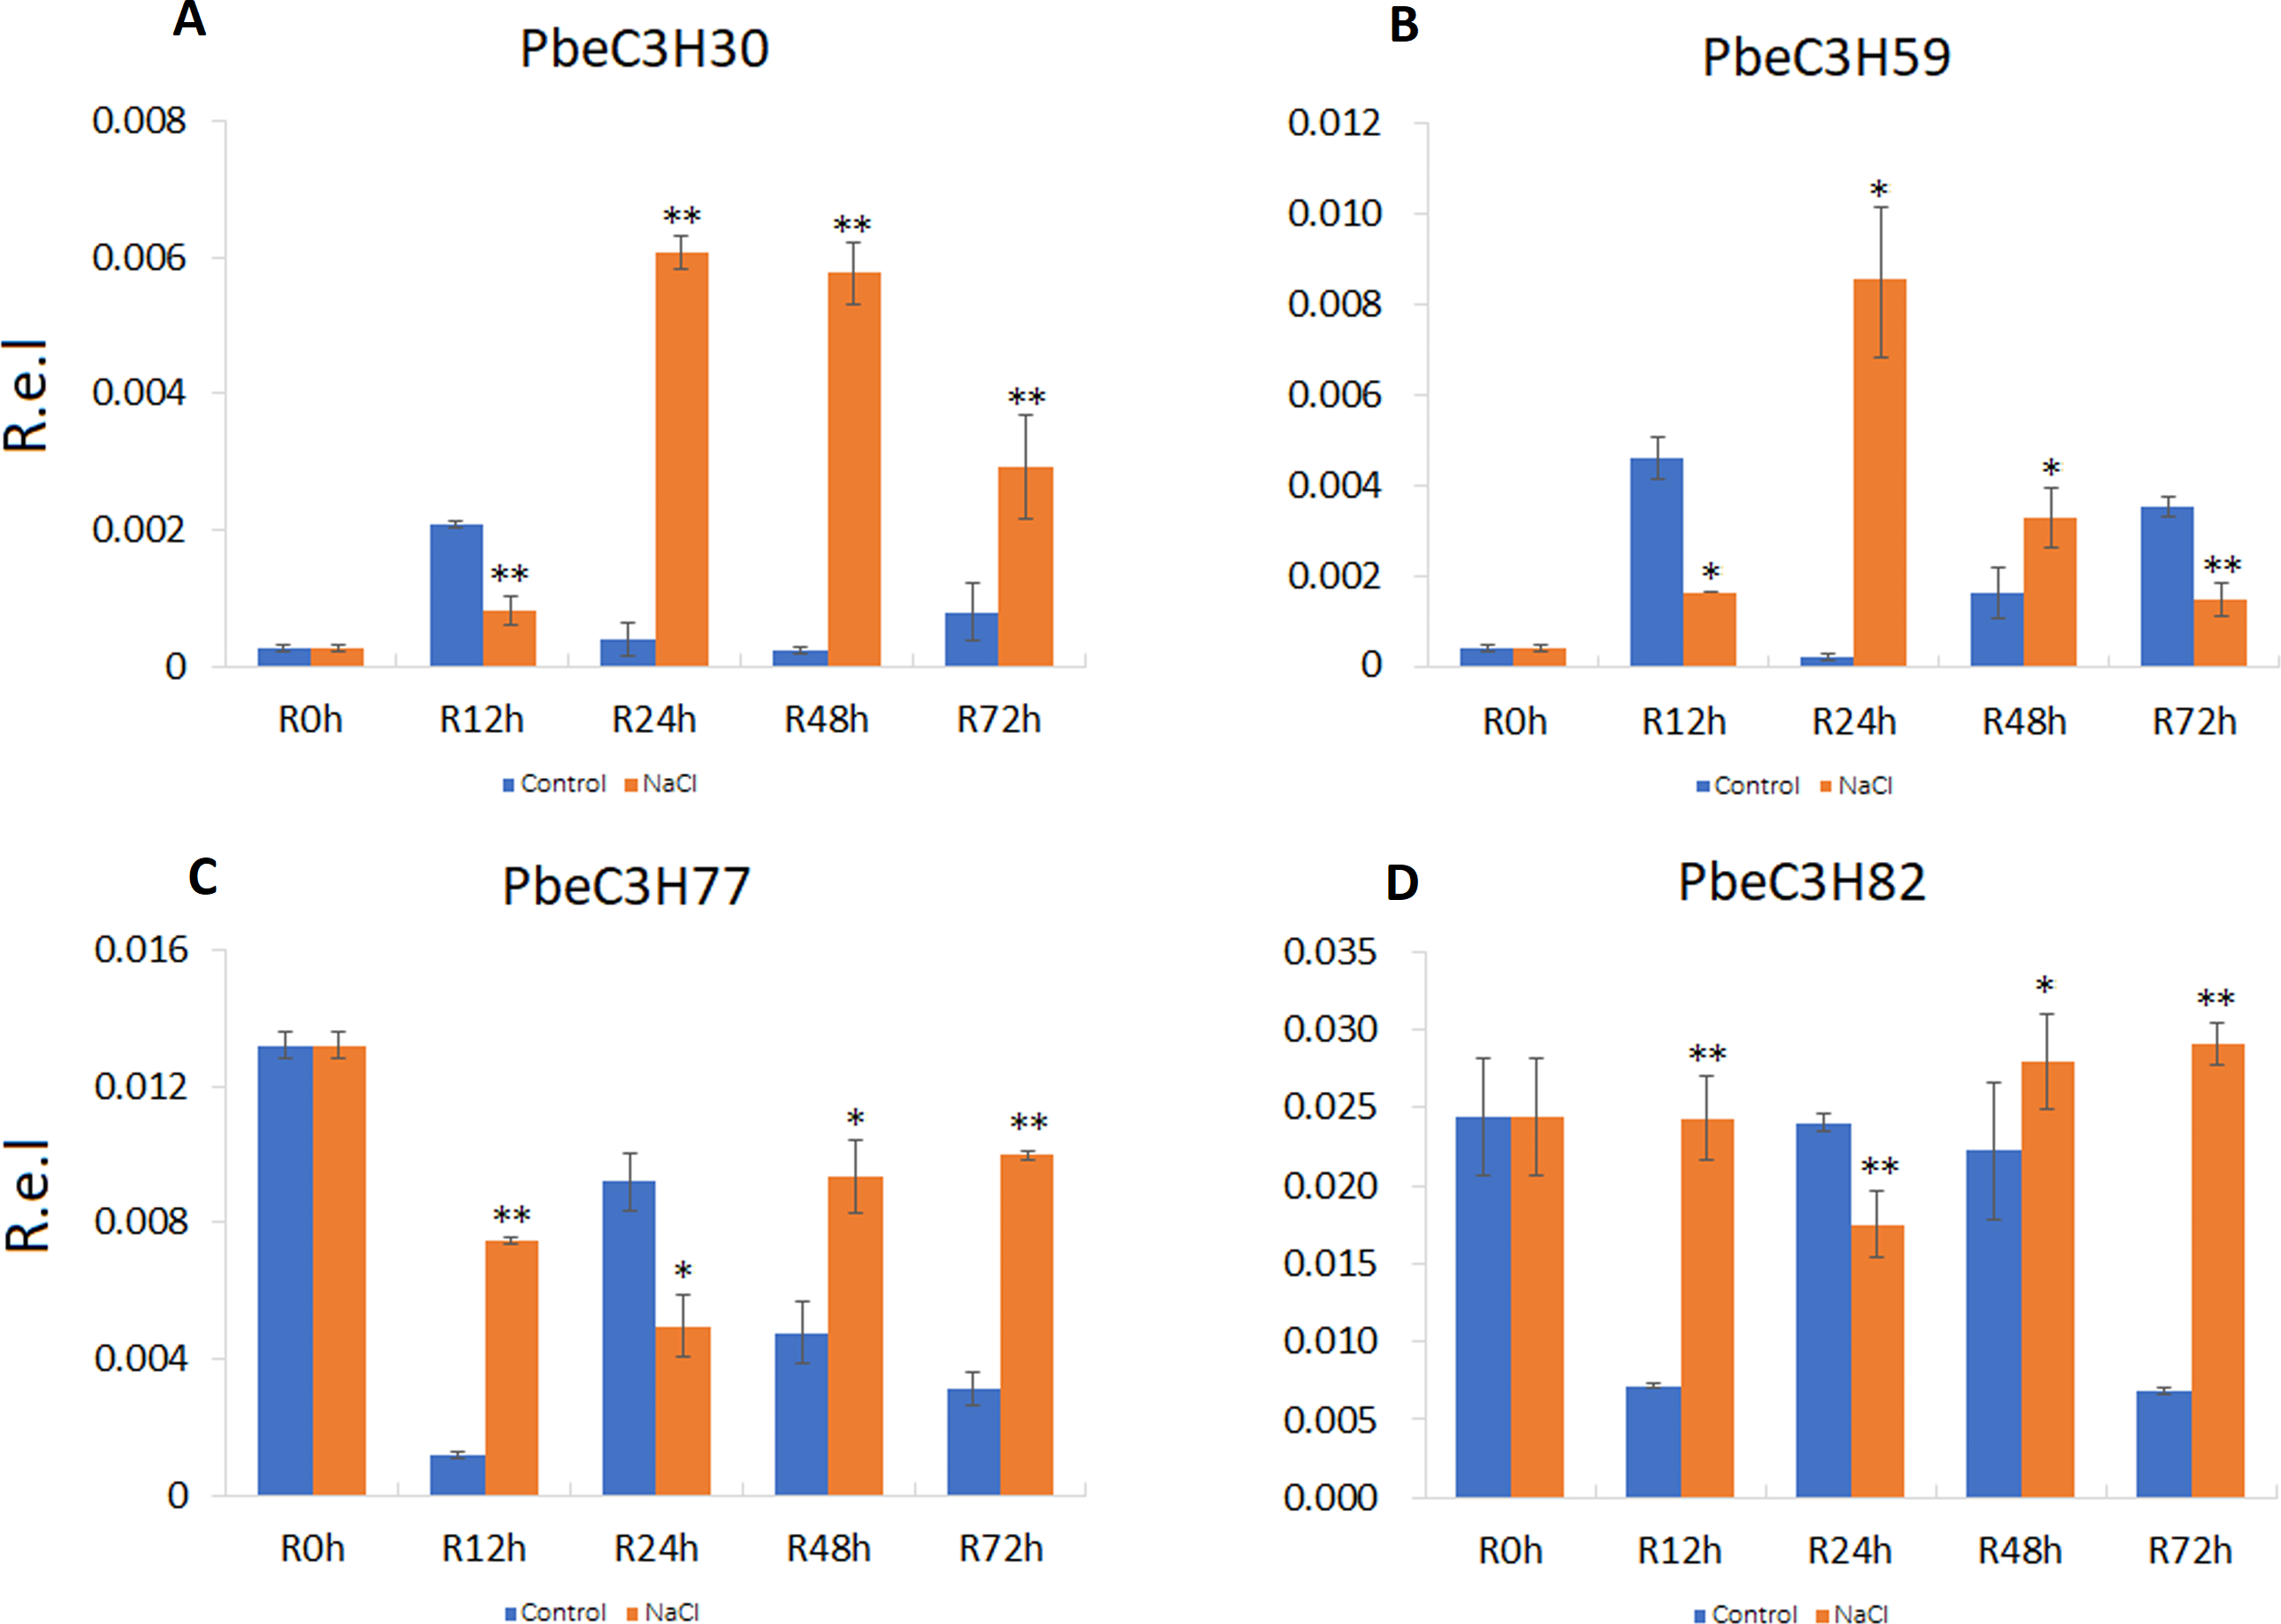
Compared to roots, PbeC3H genes in leaves showed a much more clearly response to salt. Nine of the selected genes (PbeC3H2, PbeC3H30, PbeC3H47, PbeC3H67, PbeC3H96, PbeC3H77, PbeC3H88, PbeC3H92 and PbeC3H113) were significantly induced by salt at least at two time points (Fig. 7), consistent with the RNA-Seq data (Fig. 5). The PbeC3H2 and PbeC3H30 were only induced slightly at two time points. Except for PbeC3H67, PbeC3H96 and PbeC3H92 which were induced by salt at three time points, the other four genes, PbeC3H47, PbeC3H77, PbeC3H88 and PbeC3H113 and significantly induced expression at all the time points under salt stress treatment compared to controls. Notably, PbeC3H113 showed expression levels of 4–5 times than those in controls (Fig. 7). These genes may play important roles in response to salinity and could be ideal candidates in improving salt tolerance in P. betulaefolia.
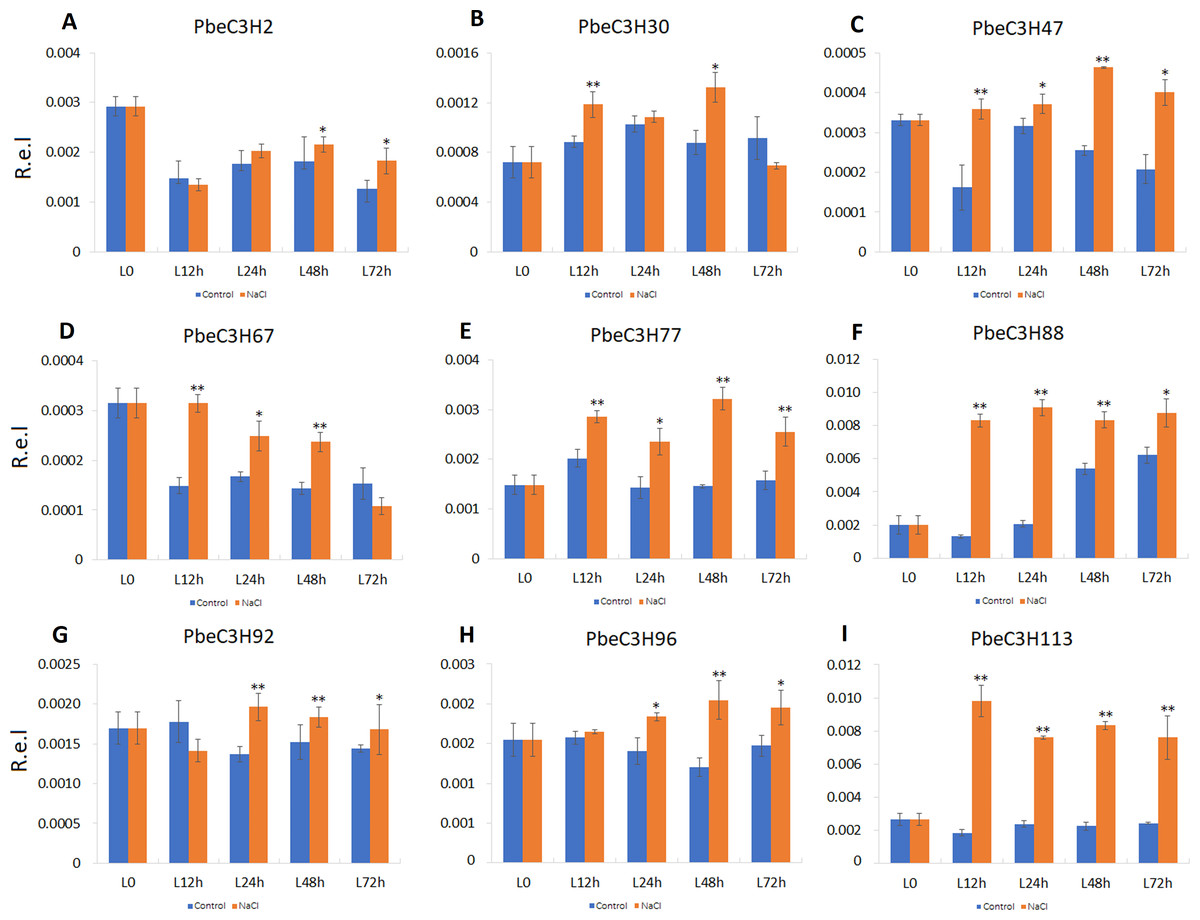
Figure 7: Expression patterns of C3H genes induced under salt stress treatment in leaves.
(A–I) Expression for each PbeC3H gene ((A) PbeC3H2; (B) PbeC3H30; (C) PbeC3H47; (D) PbeC3H67; (E) PbeC3H77; (F) PbeC3H88; (G) PbeC3H92; (H) PbeC3H96; (I) PbeC3H113). Relative expression was calculated using the 2−ΔΔCT method. R.e.l indicates relative expression level. The asterisk and double asterisks represent significant differences at the levels of 0.05 and 0.01, respectively.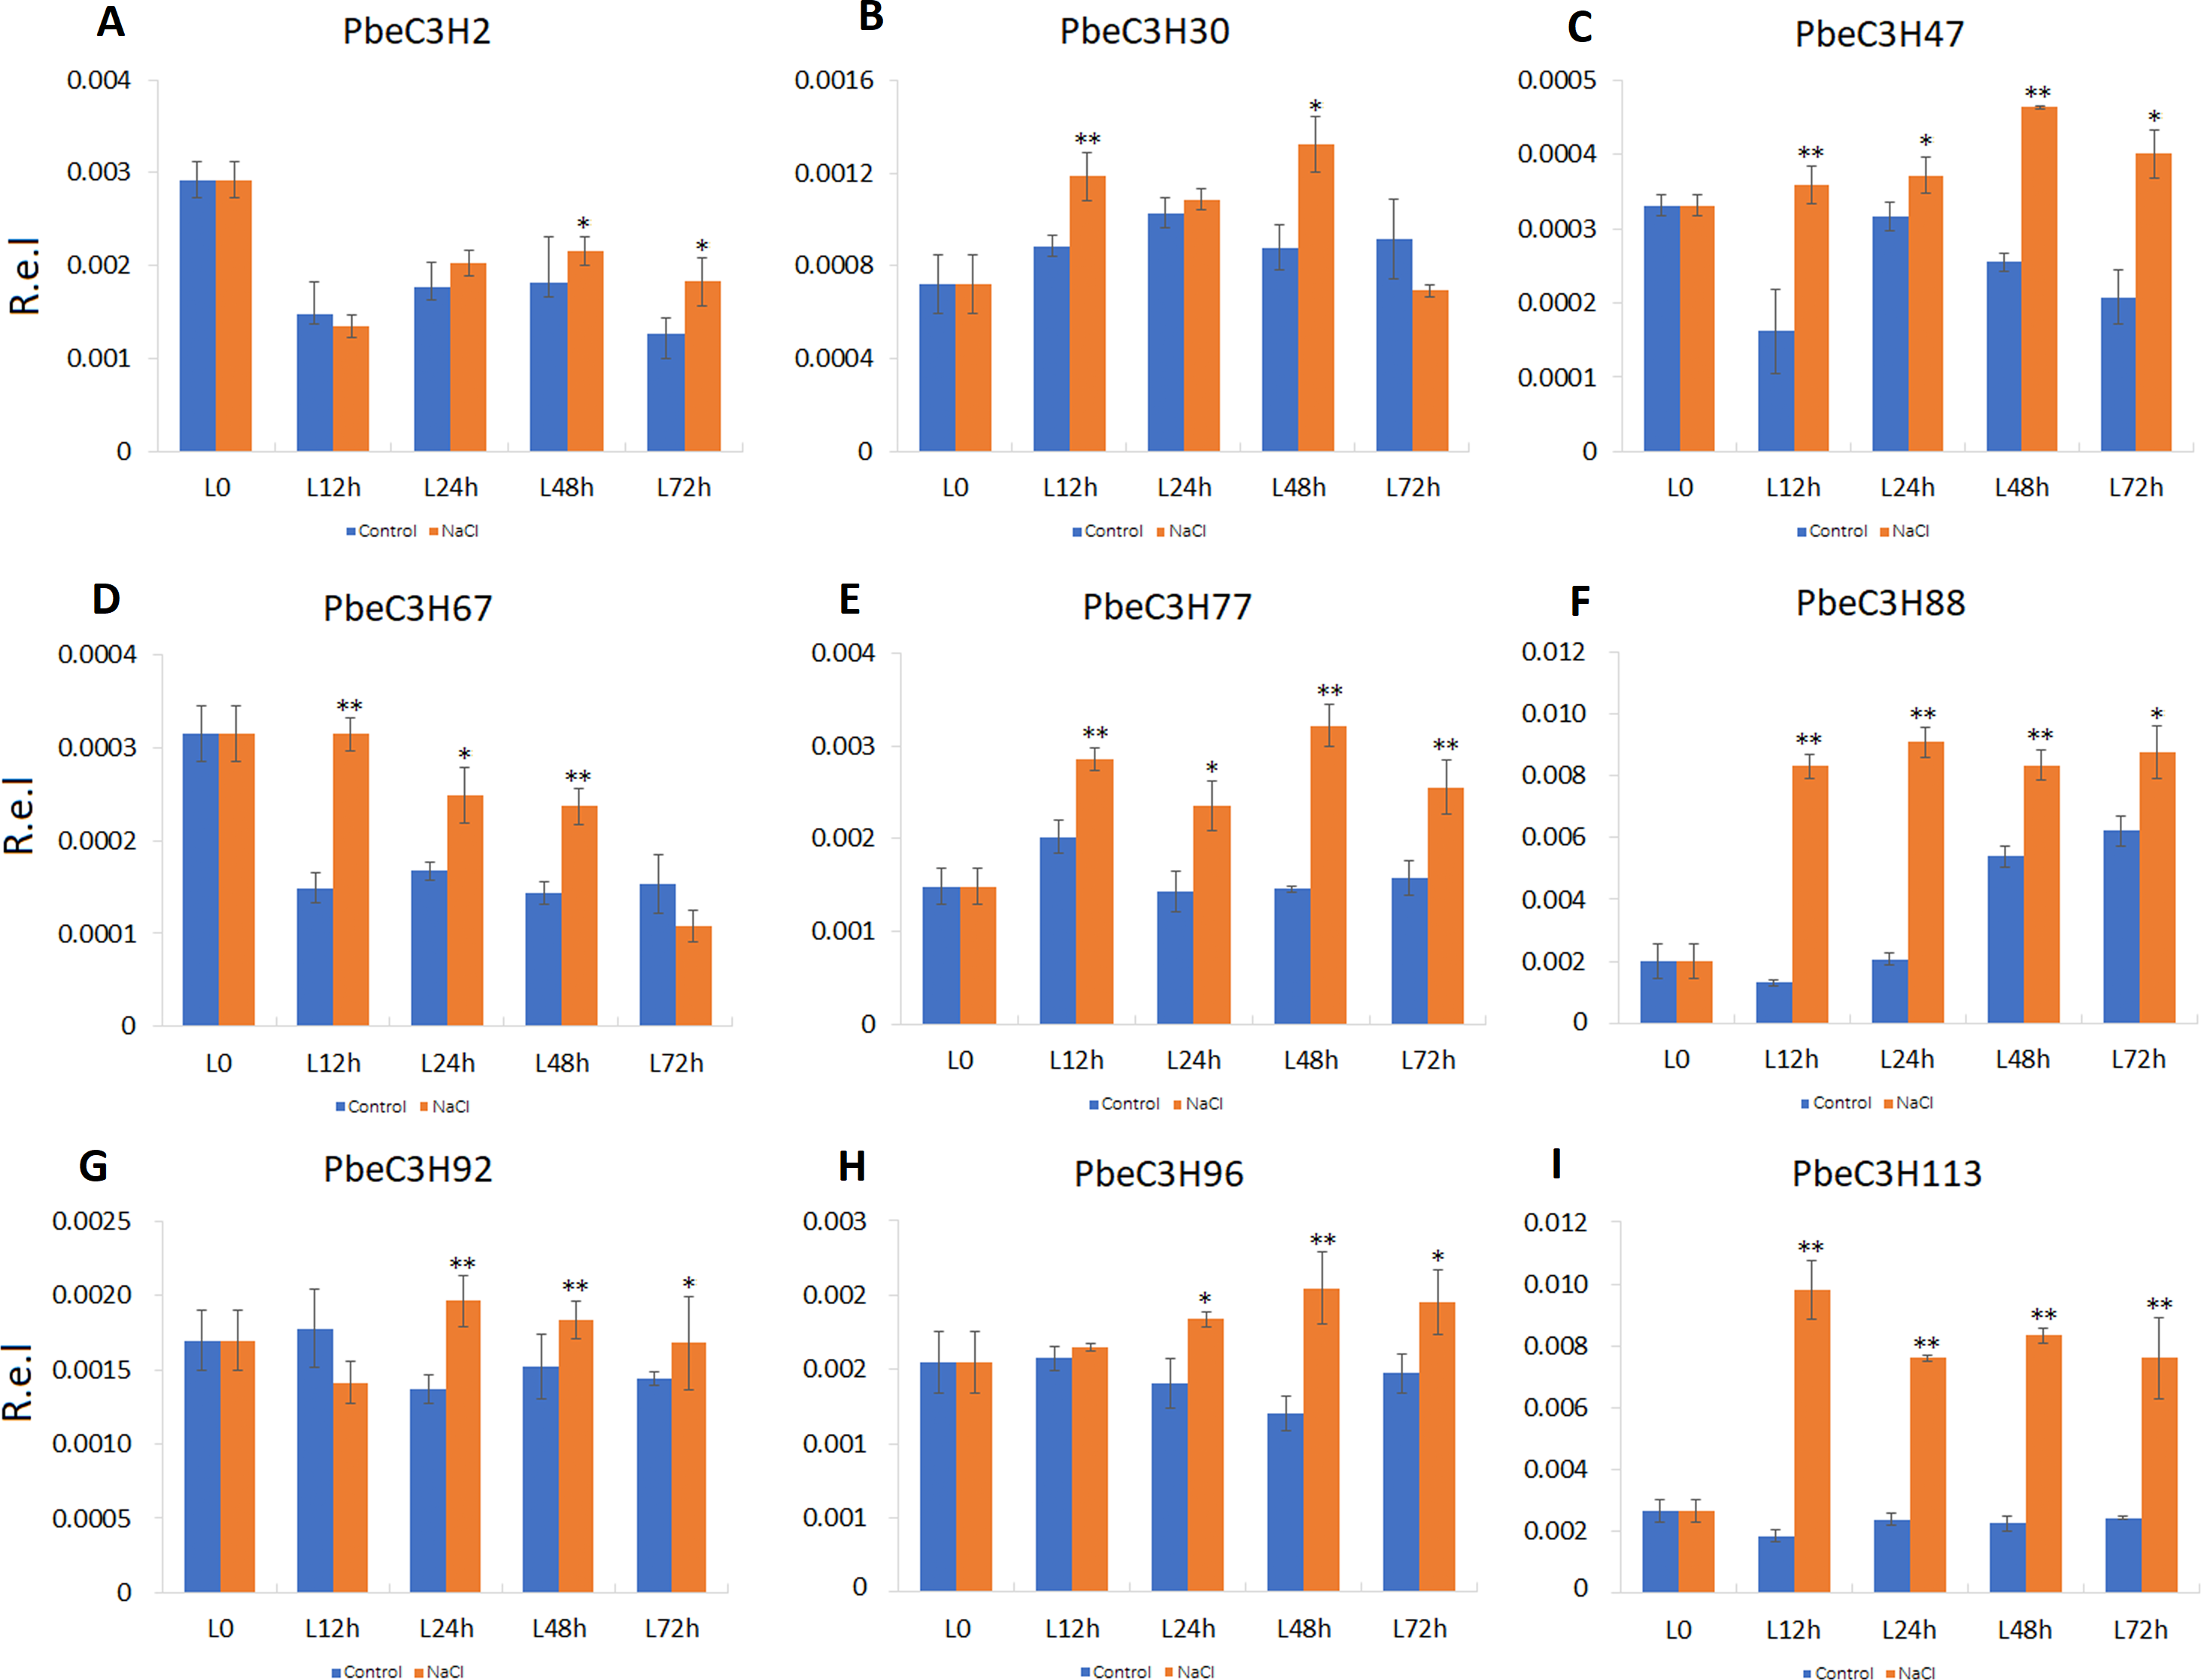
Discussion
C3H gene family in P. betulaefolia
Previous studies showed that the C3H proteins play important roles in many aspects of plant growth and development. Comparisons showed more C3H genes in P. betulaefolia than those reported in pear, Arabidopsis and rice (Fig. 1A and Table S2). The numbers of C3H motifs in the three plants varied accordingly, with P. betulaefolia containing the highest number of C3H motifs (256), followed by pear (218), Arabidopsis (152) and rice (150) (Fig. 1A). The MEME program was used to identify all motifs present in the C3H protein sequences. This led to prediction of a total of 15 different motifs including Znf-C3H (Fig. 2C). Similar to results for Arabidopsis and rice, the most common types of C3H motifs were C-X8-C-X5-C-X3-H followed by C-X7-C-X5-C-X3-H (Fig. 2C). In addition, some members contained unconventional C3H motifs. Although the C3H domain was highly conserved, the number of C3H domains and the spacing between adjacent C3H domains in a gene sequence and adjacent cysteines in the Znf motif in each gene were highly diverse (Wang et al., 2008). A previous study reported that ancestral genes containing the various C3H domain structures appeared early in evolution, and were maintained throughout evolution (Cai et al., 2013).
We also noted that the pI ranged from 4.72 (PbeC3H101) to 9.69 (PbeC3H101). It is because of the length of protein sequences were quite different between members and contained various motifs besides the basic C3H motif. The various values of pI may indicate different physicochemical property or three-dimensional structure to affect gene functions.
Conserved gene structures may reveal specific functions
The C3H proteins have been found to regulate post-transcriptional modification of downstream target pre-mRNAs (Lai & Blackshear, 2001; Stefl, Skrisovska & Allain, 2005), interacting with different proteins (e.g., GhZFP1) (Guo et al., 2009) or transcriptionally activating/repressing target genes (e.g., AtHUA1, AtPEI and OsLIC1) (Li & Thomas, 1998; Li, Jia & Chen, 2001; Wang et al., 2008). The domain architecture and intron/exon structure of the C3H genes in P. betulaefolia were relatively complex but conserved within each group, and one of the bases to classify C3H members. The gene structure was generally consistent with the motif organization. For example, the complexity of structure of C3H members in group I and IX may be related to the number of ANK motifs (Fig. 2). The other examples, PbeC3H59, PbeC3H61, PbeC3H77 and PbeC3H79 in group XII which contained more than five WD-40 motifs each showed similar structure among them but different to the other members in this group. Similar situation in structure organization related to motifs was seen in PbeC3H43, PbeC3H44, PbeC3H45 and PbeC3H47, which contained one ZF-Rings each with different exon-intron structure (Fig. 2). These various but conserved gene structures and motif organizations may reveal functional divergence among different groups and provide excellent candidate genes for researching salt tolerance in P. betulaefolia breeding.
Ks of C3H genes in P. beulaefolia and apple provide evolutionary clues
The WGD is a major force in massive silencing and elimination of gene evolution (Jiao et al., 2011). Studies indicated that a WGD event occurred about 50 MYA in an ancestor of P. betulaefolia and apple, prior to divergence of these two taxa (Dong et al., 2019). In this study, we identified 117 PbeC3H genes in genomes, which had been subjected to the WGD event of the ancestor of P. beulaefolia and apple. Among them, there were 35 and 37 pairs of C3H genes in the P. beulaefolia and apple genome were paralogous, respectively (Table S3). An older divergence time was estimated for the paralogous gene pairs in P. beulaefolia and apple than for the orthologous gene pairs (Table S3). Results indicate the WGD event occurred prior to the speciation, consistent with the premise that the WGD occurred prior to divergence of P. beulaefolia and apple. Most of the C3H genes in P. beulaefolia and apple that were generated from the WGD event were retained, possibly due to their crucial roles in growth and development as well as response to environmental conditions. The relationship between homologous PbeC3H gene pairs will provide unique perspectives on evolution of the Rosaceae.
The paralogous C3H genes in P. beulaefolia and apple and most of those orthologous between themwith Ka/Ks<1 indicated purifying selection; however, PbeC3H66 and MD05G1311700 (Ka/Ks = 2.198) showed strong positive selection (Table S3). This indicated that P. beulaefolia and apple C3H orthologous genes had undergone significant selection after the species differentiation. The results in this paper provide excellent candidate genes to study the domestication of close relative species after their speciation.
C3H genes expanded in P. betulaefolia
WGD or polyploidy, which results in massive silencing and elimination of duplicated genes, has long been recognized as a significant force in plant evolution (Jiao et al., 2011). In previous study, 17477 gene families were identified in P. betulaefolia lineage, among them, 2831 gene families were expanded in P. betulaefolia. The genes expanded are involved in stress and defence responses (Cui et al., 2016; Dong et al., 2019). In this study, we confirmed the results using C3H family genes. We saw C3H genes expanded obviously in P. btulaefolia (117) than that in P. bretschneideri (99) (Table S2), grape (69) (Wang, Zhong & Cheng, 2014), poplar (68) (Chai et al., 2012). The expansion of the C3H gene family is an important force for functional divergence to stress response, this may be why the P. brtulaefolia are used as rootstocks with fine comprehensive stress tolerance. These genes provided clues to the evolution of duplicated genes and stress tolerance improvement of P. betulaefolia.
Excellent candidates for salt-tolerance improvement
In this paper, we identified some important candidate genes that were highly or specifically expressed after salt stress treatment; for example, in roots, PbeC3H30 was significantly induced after 24 h of salt stress, and PbeC3H59 responded to salt stress at 24 and 48 h (Fig. 6). Genes PbeC3H2, PbeC3H30, PbeC3H47, PbeC3H67, PbeC3H96, PbeC3H77, PbeC3H88, PbeC3H92 and PbeC3H113 were induced under salt stress in leaves, especially for PbeC3H77, PbeC3H88 and PbeC3H113 (Fig. 7). A number of studies indicated that C3H genes were involved in various development stage and different stress response. For example, previous studies revealed that CarC3H26 and 51 had higher expression during early stages of chickpea seed development (Pradhan et al., 2017). In rice, OsC3H33, OsC3H37 and OsC3H50 were induced by salt stress (Muhamman, Waqas & Asia, 2010). Another C3H gene in rice, OsC3H12 positively and quantitatively regulates rice resistance to bacterial leaf blight caused by Xanthomonas oryzae pv oryzae, which is likely associated with the jasmonic acid dependent pathway (Deng et al., 2012). These genes involved in salt stress response provide fine candidates for salt-tolerance improvement in P. betulaefolia.
We also found that some PbeC3H genes were repressed under salt stress or sensitive to salt stress; for example, PbeC3H27, PbeC3H34, PbeC3H42, PbeC3H82, PbeC3H81, PbeC3H32, PbeC3H101 and PbeC3H110 (Fig. 8). These genes were significantly repressed after salt stress treatment at one or more tested time point. Notably, expression of PbeC3H42 PbeC3H81, PbeC3H32 and PbeC3H110 were significantly reduced after salt stress treatment. Especially for PbeC3H81, this was about 10% of the expression of controls (Fig. 8). These genes response to salt stress or functionalized in mental ions transport and metabolism (Table S4) are also excellent candidates for studying the mechanism of salt response in P. betulaefolia.
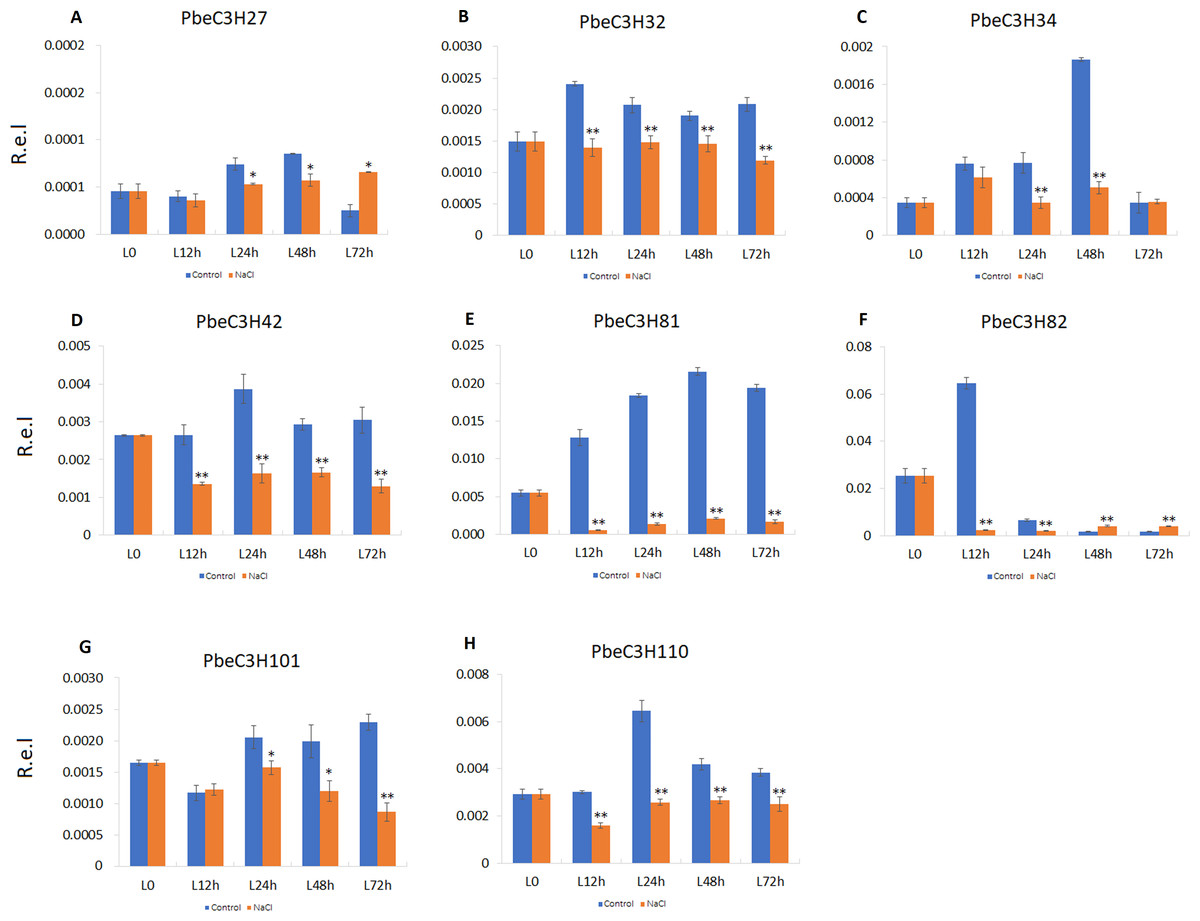
Figure 8: Expression profiles of eight C3H genes repressed by salt stress in leaves.
(A–H) Expression for each PbeC3H gene. ((A) PbeC3H27; (B) PbeC3H32; (C) PbeC3H34; (D) PbeC3H42; (E) PbeC3H81; (F) PbeC3H82; (G) PbeC3H101; (H) PbeC3H110). Relative expression was calculated using the 2−ΔΔCT method. R.e.l indicates relative expression level. The asterisk and double asterisks represent significant differences at the levels of 0.05 and 0.01, respectively.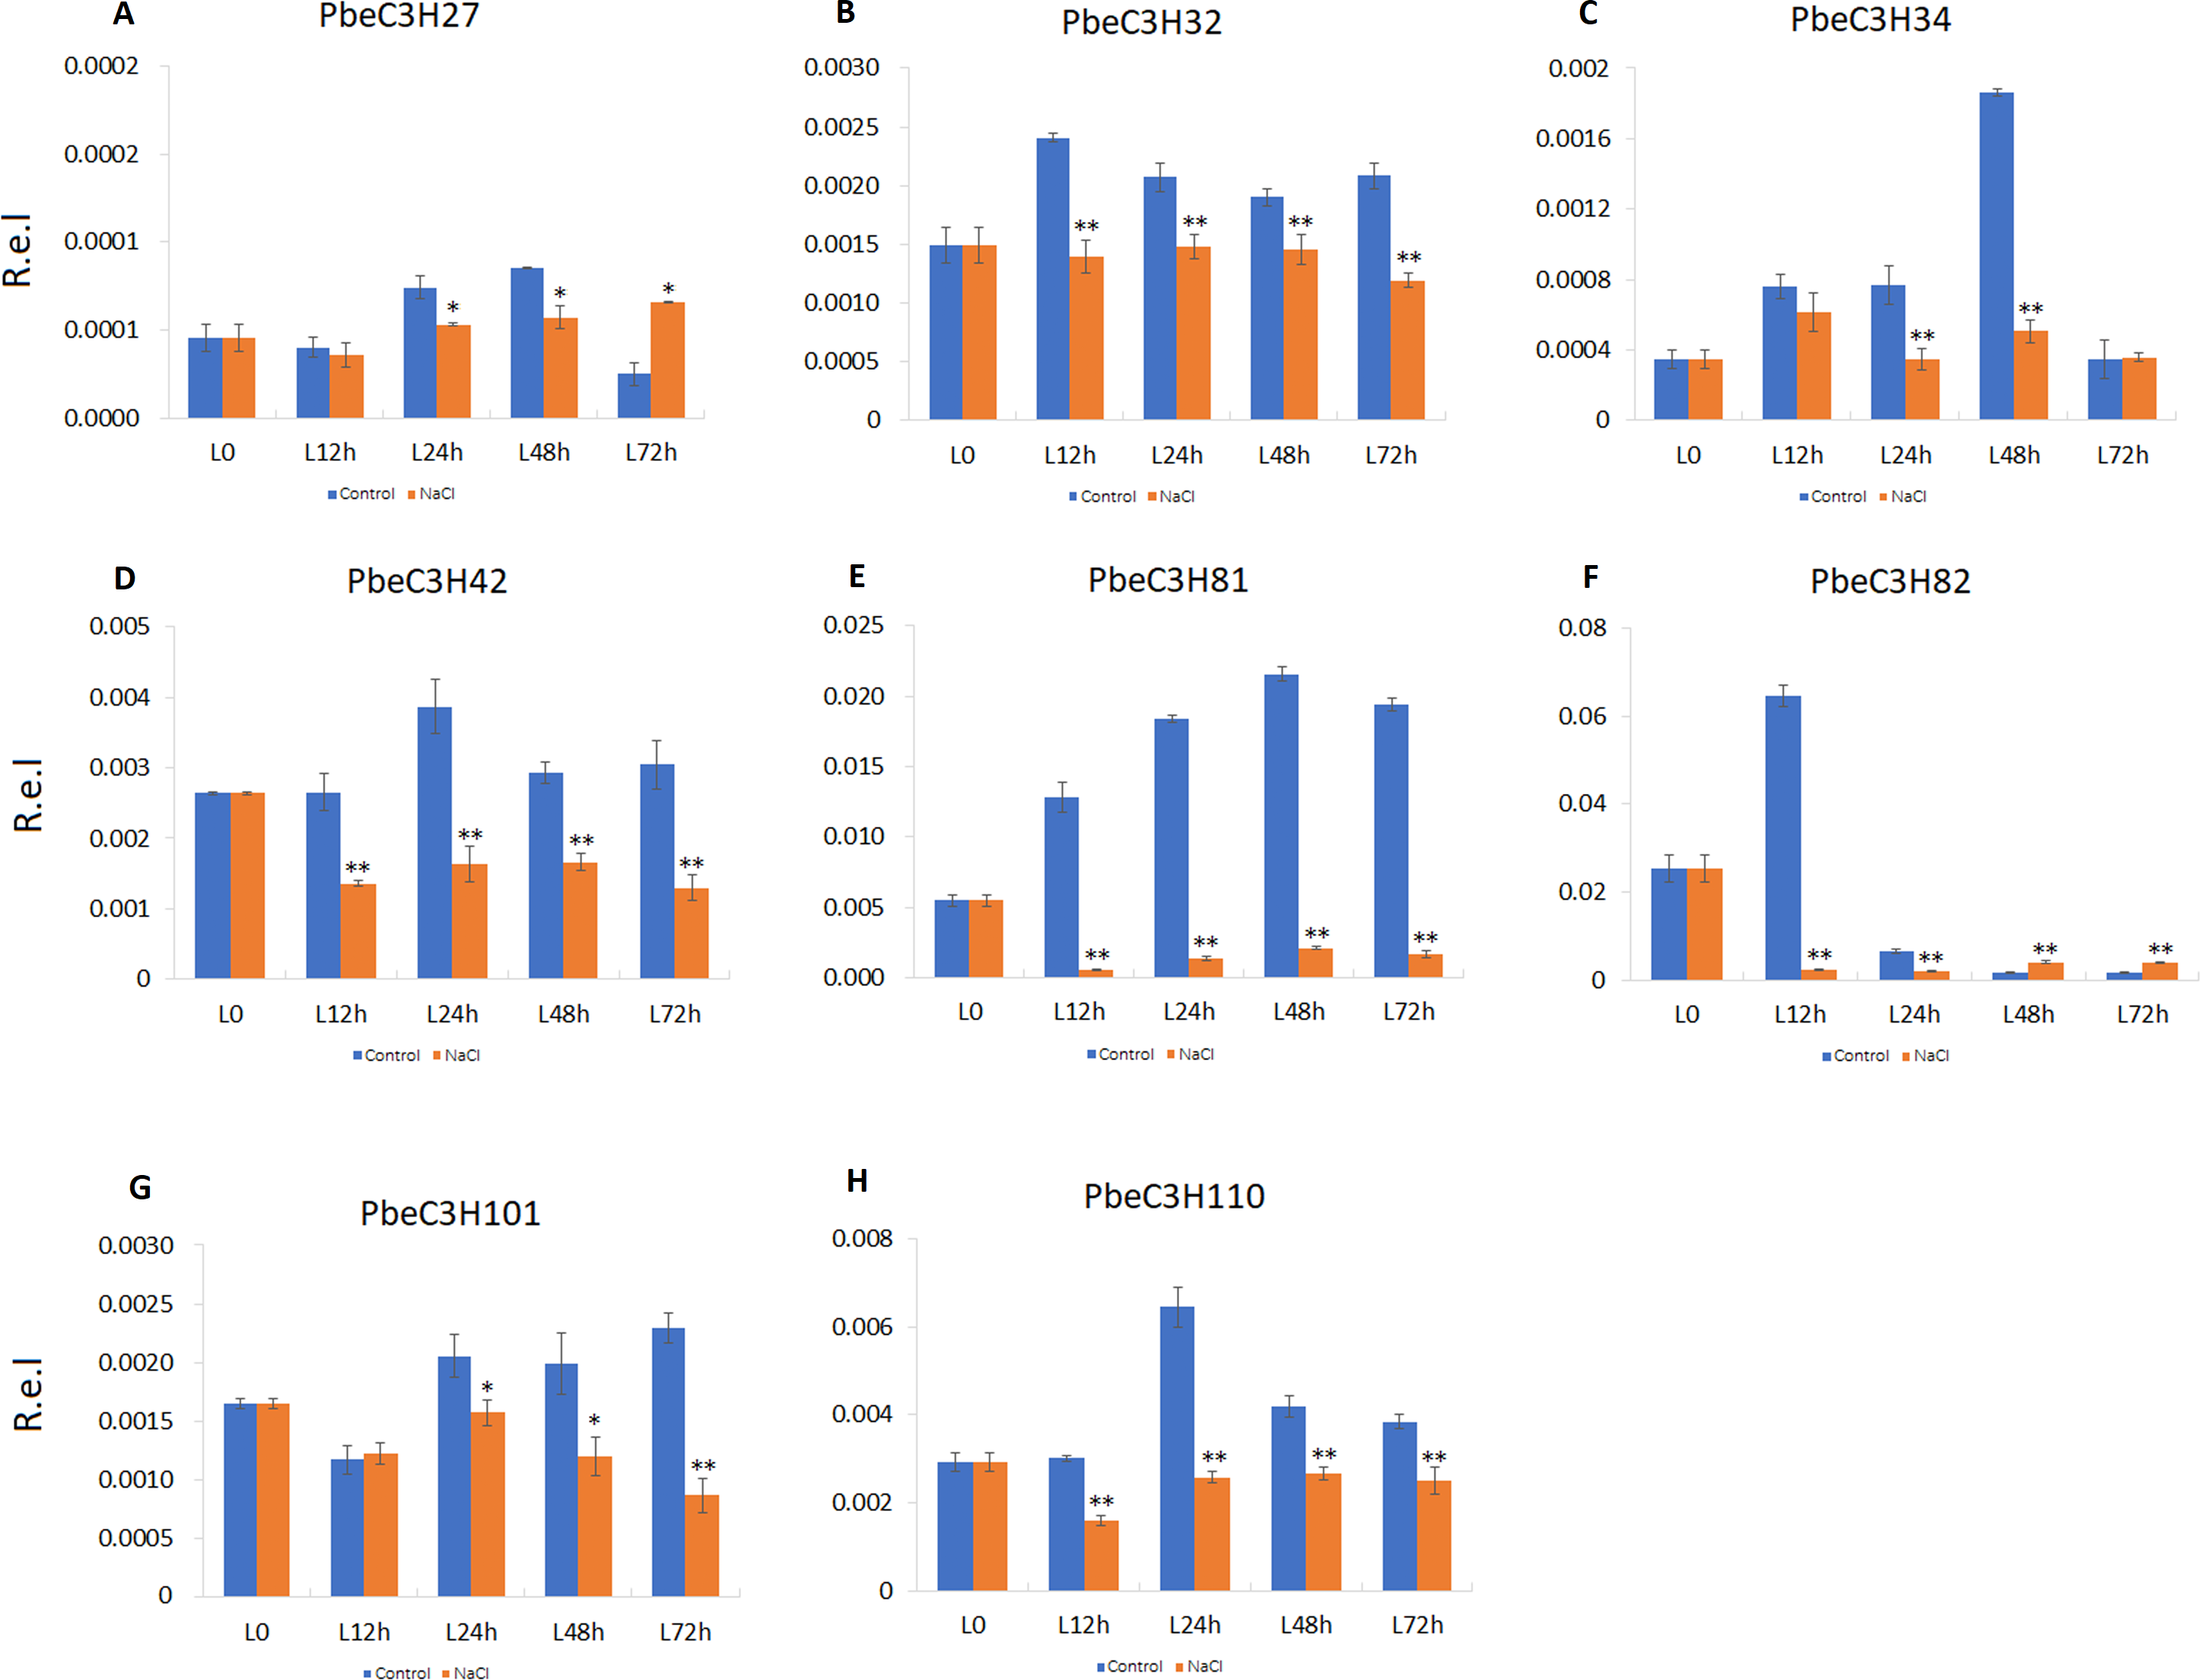
Conclusions
The C3H-type Znf family transcription factors play vital roles in plant development and response to biotic and abiotic stresses. We performed the first genome-wide analysis of the C3H family genes in P. betulaefolia and conducted a detailed investigation of their classification, structure, gene evolution and expression profiles under salt stress. All the 117 PbeC3H genes were classified into 12 groups based on the organization of various characteristic domains and mapped onto 17 chromosomes. The identification and classifications were supported by structural characteristics of the genes and proteins, as well as by phylogenetic analysis. There were 35 and 37 pairs of paralogous genes in the P. betulaefolia and apple genome, respectively, and 87 pairs of orthologous genes between them. Except for one orthologous pairs PbeC3H66 & MD05G1311700 which had undergone positive selections, the other C3H genes had undergone purifying selection. And the C3H genes expanded in P. betulaefolia than that in P. bretschneideri. Expression profiles showed that high salinity stress could influence the expression level of C3H genes in P. betulaefolia and we found genes response to stress contained relative complex gene structure. Genes induced or inhibited by salt could be used as excellent candidates for further stress response research. The present study provides a foundation for understanding the complex functions of the PbeC3H gene family and will facilitate studies of them to salt stress response in P. betulaefolia salt tolerance improvement.