
Role of Glycine max in improving drought tolerance in Zanthoxylum bungeanum
- Published
- Accepted
- Received
- Academic Editor
- Stephen Livesley
- Subject Areas
- Agricultural Science, Ecology, Plant Science, Forestry
- Keywords
- Zanthoxylum bungeanum, Drought, Resistance, Intercropping, Soybean
- Copyright
- © 2020 Li et al.
- Licence
- This is an open access article distributed under the terms of the Creative Commons Attribution License, which permits unrestricted use, distribution, reproduction and adaptation in any medium and for any purpose provided that it is properly attributed. For attribution, the original author(s), title, publication source (PeerJ) and either DOI or URL of the article must be cited.
- Cite this article
- 2020. Role of Glycine max in improving drought tolerance in Zanthoxylum bungeanum. PeerJ 8:e9040 https://doi.org/10.7717/peerj.9040
Abstract
Intercropping may improve community stability and yield under climate change. Here, we set up a field experiment to evaluate the advantages of cultivating Z anthoxylum bungeanum with Capsicum annum, and Z. bungeanum with Glycine max as intercrops, compared with cultivating Z. bungeanum in monoculture. Effects of extreme drought stress conditions on morphological, physiological, and biochemical traits of the three crop species cultivated in the three contrasting planting systems were compared. Results showed that extreme drought conditions induced negative impacts on Z. bungeanum grown in monoculture, due to reduced growth and metabolic impairment. However, limited stomatal conductance, reduced transpiration rate (Tr), and increased water use efficiency, carotenoid content, catalase activity, and accumulation of soluble sugars in Z. bungeanum indicated its adaptive strategies for tolerance of extreme drought stress conditions. Compared with cultivation in monoculture, intercropping with C. annum had positive effects on Z. bungeanum under extreme drought stress conditions, as a result of improved crown diameter, leaf relative water content (LRWC), net photosynthetic rate, and proline content, while intercropping with G. max under extreme drought stress conditions increased net CO2 assimilation rates, LRWC, Tr, and superoxide dismutase (SOD) activity. In conclusion, Z. bungeanum has an effective defense mechanism for extreme drought stress tolerance. Intercropping with G. max enhanced this tolerance potential primarily through its physio-biochemical adjustments, rather than as a result of nitrogen fixation by G. max.
Introduction
With climate change, the magnitude and frequency of extreme drought events has significantly increased in most parts of the world (Beier et al., 2012; Dai, 2012; Liu et al., 2015; Smith, 2011). Drought profoundly impacts all components of the biosphere, from the individual to ecosystem scale (Garg, Burman & Kathju, 2004; He & Dijkstra, 2014; Jentsch & Beierkuhnlein, 2008; Ledger et al., 2012; Sicher, Timlin & Bailey, 2012), and affects economic income and human well-being (He & Dijkstra, 2014). Studies have shown the frequency of extreme drought events in most parts of China has increased and tends to be severe (Ayantobo, Li & Song, 2017; Jiang et al., 2017); therefore, it is important to understand and mitigate impacts on food production of these increasingly frequent severe drought conditions.
In the context of climate-mediated changes in precipitation patterns, some studies have focused on community and ecosystem stability (Isbell, Polley & Wilsey, 2009; Saxon, 2003) in response to predicted increases in extreme drought events that will likely alter ecosystem processes (Sun et al., 2019). In plants, for example, extreme drought affects transportation of metabolites and enzymatic reactions and hampers hydrolytic breakdown processes of proteins, lipids, and carbohydrates as during accumulation of reactive oxygen species (ROS) that leads to lipid peroxidation of cells. High levels of ROS not only cause damage to proteins, lipids, and carbohydrates, but also act as signal molecules (Veselin et al., 2015) to target genes that are subsequently up-regulated and increase plant resilience to drought stress (Mahajan & Tuteja, 2005; Puranik et al., 2011). Increased levels of anti-oxidation are associated with plant tolerance to external stressors (Pan et al., 2016), so it is important to identify effective antioxidant strategies in crop plants to improve tolerance to drought stress conditions.
Increasing the diversity of agricultural systems is an important strategy in sustainable agriculture to mitigate impacts of abiotic stressors (Jackson, Pascual & Hodgkin, 2007; Scherr & Mcneely, 2008). One approach is the use of intercropping, because it has been shown to elicit positive effects on yields through suppression of pests and pathogens, increased water use efficiency and nutrient utilization, and improved soil conditions (Iqbal, Cheema & An, 2007; Keating & Carberry, 1993; Li et al., 2001). Thus, improving the efficiency of intercropping is urgently required. China contains 22% of the global human population, but only <9% of the land area, so intercropping may represent a strategy to increase crop production efficiency in that country (Tong, 1994). The presence of key species has been shown to buffer the impacts of reducing species richness due to agricultural production (Hooper et al., 2005). For example, legume (Fabaceae) crops may represent such key species, because they are known to be important in agroecosystem productivity and stability (Spehn et al., 2002). Normally, leguminous crops fix nitrogen (N) through symbiotic azotobacteria (Mosier, 2002; Yingchao et al., 2019) and provide additional nutrients to nearby crops (Chu, Shen & Cao, 2004; Xin-Ping Chen et al., 2011), and as a consequence, leaf nitrogen concentration in neighboring crops is affected (Temperton et al., 2007). However, drought negatively affects symbiotic nitrogen fixation by leguminous crops, through reduced phloem flow that facilitates nitrogenase activity in nitrogenated nodules (Marino et al., 2007; Serraj, Sinclair & Purcell, 1999). Thus, the role of leguminous species in water and nutrient use efficiencies, and tolerance of neighboring tree crop species to extreme drought conditions is poorly understood, but urgently needed.
Zanthoxylum bungeanum (Rutaceae), which is distributed in tropical and subtropical regions (Feng et al., 2017), is a woody shrub that possesses medicinal properties against toothache and rheumatism, and is also used as a condiment (Yuan et al., 2017). The species tends to grow in arid environments, and the ongoing increases in extreme drought events have led to declines in yield and quality, and increases in mortality (Sun et al., 2016; Wang, 2016). Soybean (Glycine max) is a leguminous crop that benefits in growth from its ability to fix N symbiotically (Yang et al., 2018), and is commonly used in agroforestry systems, mainly to increase land use efficiency and crop yield (Echarte et al., 2011; Gong et al., 2014); it is one of the most well-studied crops under drought stress (Manavalan et al., 2009). In contrast, hot pepper (Capsicum annum: Solanaceae), which is sensitive to low levels of moisture (Qin et al., 2014), is an important horticultural crop widely cultivated in China, India, Indonesia, and Thailand, due to its enriched levels of antioxidants, high pungency, rich flavor, and vitamin content (Jeeatid et al., 2018; Sahitya et al., 2018). Here, we compared effects of intercropping Z. bungeanum with soybean or C. annum under extreme drought conditions to test the hypotheses that inter-cropping with G. max and C. annum will induce difference drought stress responses in Z. bungeanum, and that G. max, as a legume, will facilitate N uptake and enhance the tolerance of Z. bungeanum to extreme drought conditions.
Materials and Methods
Study site description
The study site, characterized by the Udic Luvisol soils, was located in Mao County (31°41′N, 103°53′E, 1,686 m a.s.l.), in southwestern China, where mean annual temperature is 8.9 °C, lowest mean annual temperature is –11.6 °C, and highest mean annual temperature is 32.3 °C; mean annual precipitation is 920 mm that mainly occurs during the period May–September (data collected at Mao County Ecological Station of Chinese Academy of Science). Extreme drought conditions in this region have increased significantly in recent years (Xia et al., 2018). Permission to conduct the study and collect samples at the field site was obtained from the farmer, Mr. Li Xingfu.
Experimental design
The experiment was conducted from 1−30 August 2015 as a randomized block experiment, comprising three replicates of six treatments applied to 2.6 × 2.6-m plots. The experimental plots were covered with a rainproof shield constructed as a 2 m high steel frame with a transparent plastic roof (Borken et al., 2006); there was a 1-m wide buffer area between each plot and plots were surrounded by plastic partitions to prevent flow of surface and soil water.
Treatments comprised application of average rainfall (control: CK) or extreme drought conditions to (i) Z. bungeanum monoculture (Z); (ii) intercropping of Z. bungeanum and G. max (Z-G) and (iii) intercropping of Z. bungeanum and C. annuum (Z-C). Z. bungeanum seedlings with the same basal stem and plant height were selected as experimental materials and planted in the center of the plots in April 2013, and G. max and C. annuum were evenly planted at a density of 0.27 m−2 (25 plants) per plot in April 2015; plots were kept weed-free. Extreme drought is defined as continuous precipitation of <0.1 mm day−1 in August (Zhiyuan Wang et al., 2015); thus, the extreme drought treatment comprised no watering. The CK was the average rainfall in August (1983–2013) at the study site of 3.0 mm day−1 (Ng et al., 2015); CK plots were evenly irrigated twice a day (07:00–09:00 and 18:00–20:00, 1–30 August 2015) to allow for water loss through transpiration and evaporation.
On 30 August 2015, height (cm) of the experimental plants was recorded and crown size was measured as the average of two perpendicular transverse widths (Sánchez-González, ICRD & GM, 2007). Fully expanded leaves were sampled from the experimental plants, quickly placed in liquid N2, and returned to laboratory for storage at −80 ° C prior to analysis.
Leaf relative water content
We measured leaf relative water content (LRWC) using the method described by Galle, Haldimann & Feller (2007) and calculated as LRWC = [(FW-DW)/(TW-DW)] ×100%, where FW is fresh weight of a single, fully expanded leaf per plant and DW is dry weight. After FW of the fully expanded leaves had been recorded, the samples were immediately dipped in distilled water, in the dark, at 4 °C. After 4 h, leaves were weighed to obtain turgor weight (TW), and then dried in an oven for 24 h at 70°; to determine DW.
Pigment and photosynthetic parameters
Pigment was measured from 0.2 g of fresh leaves that were placed in five mL of 100% acetone for 36 h at room temperature in the dark. Then, reflectance of the extracting solution was determined at 662, 645, and 470 nm using a spectrophotometer and calculation of pigment content was based on the method reported by Liu et al. (2014).
Net CO2 assimilation rate (Pn), stomatal conductance (Gs), intercellular CO2concentration (Ci), and transpiration rate (Tr) were measured on fully expanded leaves at the end of the experiment between 09:00 and 11:00 hrs using a portable photosynthetic instrument (LI-6400, LI-COR Inc., USA). Photon flux density, CO2 concentration, and air relative humidity were maintained at 800 µmol m−2 s−1, 400 µmol mol−1, and 70–80% respectively. Intrinsic water use efficiency (WUEintr) was determined as WUEintr = Pn/Tr, and Ls was calculated as Ls = 100% × (Ca–Ci)/Ca.
Soluble sugars, soluble protein, and proline
A supernatant was created from 0.2 g of DW leaves that were extracted three times using 6 ml of 80% ethanol at 80 °C for 30 min. Then, content of soluble sugars was separated with linear gradient from 50 to 150 Mm and determined following the method reported by Quan et al. (2004) and soluble protein content was determined using Bradford G-250 reagent. Proline was extracted from DW leaves using two mL of 10% acetic acid and five mL of 3% sulfosalicylic acid; proline content of the final supernatant was determined using the method described by Liu et al. (2014).
ROS and membrane lipid peroxidation
Superoxide anion (O2−) production rate in leaves was determined from oxidation of hydroxylamine (Zhou et al., 2004) that was extracted from 0.2 g of DW leaves using two mL of 65 mM phosphate buffer (pH 7.8) followed by centrifugation at 5,000 g for 10 min. Then, 0.1 mL of supernatant was incubated at 25 °C for 20 min in 0.9 mL of 65 Mm phosphate buffer (pH 7.8), 0.1 mL of 10 mM hydroxylammonium chloride; next, 17 mM sulphanilamide and 7 mM α-naphthylamine were added to the mixture and incubated again at 25 °C for 20 min. Ethyl ether at the same volume was added to the mixture that was then centrifuged at 1,500 g for 5 min, and absorbance was read at 530 nm using a spectrophotometer (UV 330, Perkin Elmer, USA).
Content of hydrogen peroxide (H2O2) was determined by measuring absorbance of the titanium–peroxide complex at 410 nm (Zhou et al., 2004). Fresh leaves (0.2 g) were ground with five mL of acetone and centrifuged at 3,000 g for 10 min; then, 0.1 mL of titanium reagent (50 µL of 20% titanium tetrachloride in concentrated HCl), 0.2 mL of ammonia, and one mL of supernatant were added and the mixture was centrifuged at 3,000 g for 10 min. The resulting precipitate was washed five times with acetone and centrifuged at 10,000 g for 5 min, before it was dissolved in three mL of 1 M H2SO4; finally absorbance was measured at 410 nm using a spectrophotometer.
We used the thiobarbituric acid (TBA) method (Zhou, Lam & Zhang, 2007) to determine malondialdehyde (MDA) content. We ground 0.2 g of fresh leaves in two mL of 50 mM phosphate buffer (pH 7.8) that was then centrifuged at 12,000 g for 20 min. Next, one mL of the supernatant was mixed with three mL of 20% trichloroacetic acid solution that contained 2% TBA, and the reaction mixture was incubated in water at 95 °C for 30 min before it was cooled quickly in an ice bath and centrifuged at 15,000 g for 10 min. Absorption at 532 and 600 nm was determined using a spectrophotometer, and MDA content was calculated according to an extinction coefficient of 155 mM−1 cm−1.
Antioxidant enzyme activity
The NBT method (Fu & Huang, 2001) was used to determine superoxide dismutase (SOD) activity, where one unit of SOD activity was defined as the amount of enzyme required for 50% inhibition of NBT reduction at 560 nm. Activity of catalase (CAT) was measured using the method described by Fu & Huang (2001), by determining H2O2 decomposition per 1 min at 240 nm absorbance, where one unit of CAT activity was defined as change in absorbance of 0.01 units per min.
Statistical analyses
We used two-way ANOVA to test for effects of cropping system and extreme drought on physio-biochemical parameters, and one-way ANOVA to test effects of all treatments on physio-biochemical parameters. Data were checked for normality and homogeneity of variances prior to ANOVA, and means were compared using Duncan’s test. Statistical analyses were conducted in SPSS v.17.0 (SPSS Inc., Chicago, IL). Presented data are means ± SE.
Results
Morphological traits
Overall, there was a strong reduction in the morphological traits in extreme drought stressed plants compared with the control across the three cropping systems (Table 1). Extreme drought reduced the crown diameter of Z. bungeanum across the three cropping systems (decreases of 60.27, 32.12, and 44.33% in Z, Z-C, and Z-G, respectively), but there was no effect on tree height. Although height and crown diameter of C. annuum and G. max decreased slightly after 30 d of extreme drought stress, there were no significant effects of drought (Table 2).
Leaf relative water content, photosynthetic pigments, and gas exchange
Z. bungeanum LRWC was slightly reduced by extreme drought across the three cropping systems. We found that the LRWC content in Z. bungeanum was significantly lower in the cropping system, regardless of drought conditions, than in the other two systems (Table 1) and LRWC in C. annuum was greater than in G. max (Table 2). There was no effect of extreme drought stress on chlorophyll b (Chl b) or carotenoid (Car) content, but it decreased Chl a content in Z. bungeanum (Table 1). Irrespective of extreme drought, content of Chl a, Chl b, and Car in G. max was greater than in C. annuum (Table 2). Extreme drought led to a decrease in Car in G. max, but there were not effects on Chl a or Chl b (Table 1). In general, extreme drought decreased photosynthesis and increased Ls in Z. bungeanum across the three cropping systems. There were no effects of extreme drought on Cior Gs in Z. bungeanum across the three cropping systems; however, there were decreases in Tr in Z. bungeanum in Z and Z-C. WUEintr of Z. bungeanum in Z was greater under extreme drought conditions. There were no effects of extreme drought on photosynthetic parameters in C. annuum or G. max across the three cropping systems (Table 2).
Antioxidant defense system
Extreme drought increased the O2− production rate and H2O2 content in Z. bungeanum in the Z and Z-C treatments, but there was no effect in the Z-G treatment. There was no effect of extreme drought stress on MDA content in Z. bungeanum in the three cropping systems (Fig. 1); however, extreme drought stress led to increased SOD activity in Z. bungeanum in Z-C and Z-G and greater CAT activity in Z and Z-G (Fig. 2). Content of H2O2 in C. annuum and MDA in G. max were greater under extreme drought conditions, and there was no effect on SOD or CAT activity (Table 2).
| Plant system | Z | Z-C | Z-G | ||||||
|---|---|---|---|---|---|---|---|---|---|
| Parameters | Control | Drought | Control | Drought | Control | Drought | System | Drought | System* Drought |
| Height (cm) | 161.50 ± 3.75A | 158.50 ± 5.48A | 180.00 ± 15.31A | 149.00 ± 28.29A | 158.00 ± 27.51A | 136.00 ± 24.76A | ns | ns | ns |
| Crown diameter (cm) | 100.67 ± 5.36A | 40.00 ± 3.46C | 100.67 ± 9.82A | 68.33 ± 15.25C | 110.78 ± 1.15A | 61.67 ± 15.34B | ns | *** | ns |
| Chl a (mg/g) | 4.86 ± 0.47A | 3.92 ± 0.00A | 4.69 ± 0.10A | 4.21 ± 0.31A | 4.97 ± 0.36A | 4.37 ± 0.18A | ns | * | ns |
| Chl b (mg/g) | 2.25 ± 0.06A | 2.19 ± 0.29A | 2.86 ± 0.22A | 2.86 ± 0.10A | 1.70 ± 0.30A | 1.78 ± 0.13A | ** | ns | ns |
| Car (mg/g) | 1.73 ± 0.12A | 1.92 ± 0.14A | 1.91 ± 0.22A | 2.03 ± 0.14A | 1.90 ± 0.04A | 1.90 ± 0.04A | ns | ns | ns |
| LRWC (%) | 86.15 ± 2.08A | 74.74 ± 1.61AB | 66.59 ± 5.85BC | 62.24 ± 5.74C | 85.65 ± 1.78A | 84.50 ± 2.04A | ** | ns | * |
| Pn (µmol m−2s−1) | 15.36 ± 0.03AB | 12.75 ± 0.83C | 16.39 ± 0.01A | 13.71 ± 1.08BC | 13.93 ± 0.87BC | 11.77 ± 0.81C | * | ** | ns |
| Ci(µmol mol−1) | 305.06 ± 5.47A | 291.73 ± 10.92A | 301.20 ± 17.65A | 295.94 ± 5.76A | 302.40 ± 10.86A | 289.45 ± 3.88A | ns | ns | ns |
| Gs (mol m−2s−1) | 0.34 ± 0.02AB | 0.31 ± 0.04AB | 0.31 ± 0.01AB | 0.29 ± 0.01B | 0.37 ± 0.03A | 0.35 ± 0.00AB | * | ns | ns |
| Tr (mmol m−2 s−1) | 3.55 ± 0.18AB | 2.35 ± 0.16D | 3.70 ± 0.03A | 2.79 ± 0.10C | 3.12 ± 0.07BC | 2.86 ± 0.21C | ns | *** | ns |
| WUEintr (µmol mol−1) | 4.35 ± 0.23B | 5.41 ± 0.03A | 4.43 ± 0.04AB | 4.96 ± 0.57AB | 4.47 ± 0.33AB | 4.14 ± 0.27B | ns | ns | ns |
| Ls | 0.77 ± 0.01B | 0.86 ± 0.02A | 0.73 ± 0.01B | 0.85 ± 0.03A | 0.78 ± 0.01B | 0.89 ± 0.03A | ns | *** | ns |
| Soluble sugar (mg g−1 DW) | 0.56 ± 0.02B | 0.86 ± 0.13AB | 0.90 ± 0.13AB | 0.90 ± 0.10AB | 1.05 ± 0.00AB | 1.35 ± 0.31A | * | ns | ns |
| Soluble protein (mg g−1 DW) | 23.43 ± 1.34B | 21.40 ± 0.20B | 30.80 ± 0.78A | 24.75 ± 0.35B | 24.70 ± 2.51B | 11.25 ± 0.46C | *** | *** | ** |
| Proline (µg g−1 DW) | 0.28 ± 0.01A | 0.26 ± 0.01AB | 0.26 ± 0.00AB | 0.27 ± 0.00A | 0.25 ± 1.15B | 0.26 ± 0.01AB | ns | ns | * |
Notes:
“Z-G” denotes Z. bungeanum intercropping with G. max, “Z-C” denotes Z. bungeanum intercropping with C. annuum, and “Z” denotes the Z. bungeanum monoculture. Different uppercase letters indicate significant differences among all treatments. Two-way ANOVA was used to test the effects of planting systems and extreme drought on the growth and pigment contents.
| Plant system | C. annuum | G. max | ||
|---|---|---|---|---|
| Parameters | Control | Drought | Control | Drought |
| Height (cm) | 25.67 ± 0.35A | 25.00 ± 1.20A | 29.93 ± 0.98A | 27.80 ± 3.12A |
| Crown diameter (cm) | 27.44 ± 1.06A | 19.22 ± 3.29A | 25.44 ± 2.26A | 24.33 ± 3.36A |
| Chl a (mg/g) | 4.32 ± 0.39B | 4.64 ± 0.03B | 6.59 ± 0.48A | 5.82 ± 0.19A |
| Chl b (mg/g) | 2.23 ± 0.23A | 2.36 ± 0.10A | 2.67 ± 0.18A | 2.54 ± 0.14A |
| Car (mg/g) | 1.64 ± 0.25B | 2.04 ± 0.12B | 2.77 ± 0.06A | 1.98 ± 0.06B |
| LRWC (%) | 89.41 ± 0.03A | 81.86 ± 0.05A | 49.05 ± 9.84B | 55.38 ± 5.09B |
| Pn (µmol m−2s−1) | 16.04 ± 0.68A | 16.68 ± 1.21A | 14.26 ± 1.48A | 12.63 ± 1.43A |
| Ci(µmol mol−1) | 307.56 ± 16.04A | 297.69 ± 11.36A | 309.62 ± 10.38A | 306.20 ± 7.25A |
| Gs (mol m−2s−1) | 0.37 ± 0.05A | 0.51 ± 0.09A | 0.48 ± 0.01A | 0.37 ± 0.01A |
| Tr (mmol m−2 s−1) | 2.99 ± 0.94A | 4.03 ± 0.62A | 3.99 ± 0.51A | 3.71 ± 0.43A |
| WUEintr (µmol mol−1) | 4.30 ± 0.49A | 3.80 ± 0.34A | 4.34 ± 0.43A | 3.18 ± 0.51A |
| H2O2content (µmol g−1 FW) | 126.36 ± 16.89B | 265.28 ± 40.96A | 53.94 ± 17.20B | 77.40 ± 5.31B |
| O2− producing rate (nmol min−1 g−1 FW) | 0.03 ± 0.005A | 0.03 ± 0.025A | 0.052 ± 0.019A | 0.039 ± 0.009A |
| MDA content (µmol g−1 FW) | 8.50 ± 1.11B | 12.79 ± 0.32B | 12.28 ± 1.38B | 20.32 ± 2.23A |
| SOD activity (nmol mg−1 protein min−1) | 22.79 ± 1.43A | 23.16 ± 0.77A | 30.21 ± 5.49A | 26.41 ± 3.53A |
| CAT activity (nmol mg−1 protein min−1) | 0.008 ± 0.003B | 0.024 ± 0.003B | 0.085 ± 0.007A | 0.095 ± 0.027A |
| Soluble sugar (mg g−1 DW) | 0.63 ± 0.05A | 0.56 ± 0.11A | 1.18 ± 0.37A | 0.79 ± 0.06A |
| Soluble protein (mg g−1 DW) | 31.57 ± 1.16A | 31.23 ± 0.33A | 26.32 ± 4.98A | 26.03 ± 3.54A |
| Proline (µg g−1 DW) | 0.04 ± 0.004A | 0.04 ± 0.002A | 0.04 ± 0.005A | 0.03 ± 0.003A |
Notes:
“Z-G” denotes Z. bungeanum intercropping with G. max, “Z-C” denotes Z. bungeanum intercropping with C. annuum, and “Z” denotes the Z. bungeanum monoculture. Different uppercase letters indicate significant differences among all treatments. ANOVA was used to assess the effects of extreme drought on plant physiology properties.
Osmolytes and soluble proteins
Content of soluble sugar and proline in Z. bungeanum did not vary with cropping system under extreme drought stress conditions; however, content of soluble protein of Z. bungeanum was reduced in Z-C and Z-G (Table 1). There were no effects of extreme drought conditions on soluble sugar, soluble protein or proline content in C. annuum and G. max (Table 2).
Discussion
Plant growth, LRWC, pigment content, and gas exchange
Drought is the principal abiotic stress factor that limits agricultural crop productivity, growth, and development by lowering plant nutrient uptake from arid soils due to reduced expansion of plant cells (Ihsan et al., 2016; Luo et al., 2010). As shown in Tables 1 and 2, short-term extreme drought had no effect on height of Z. bungeanum, C. annuum, or G. max, indicating that plant height is a long-term nutrient accumulation process (Table 2). However, we found that extreme drought reduced Z. bungeanum crown diameter in Z, Z-C and Z-G cropping systems (Table 1). Water deficit reduces soil nutrient availability and plant nutrient uptake, and has a negative effects on soil microbe activities (Hu & Schmidhalter, 2001). Our experiment showed that crown diameter in Z. bungeanum is sensitive to extreme drought conditions that will then likely affect levels of light radiation interception.
Leguminous crops may provide additional nutrients to nearby crops, and our previous study (Sun et al., 2019) showed that the Z-G treatment led to lower content of soil and leaf N content than the Z-C and Z treatment. This effect is probably due to the sensitivity of synergetic N fixation to drought during the reproductive stage that leads to reductions in N accumulation in leguminous crops (Serraj, Sinclair & Purcell, 1999), and the greater sensitivity of N2 fixation to drought stress than N uptake and assimilation in soil (Purcell & Andyking, 1996).
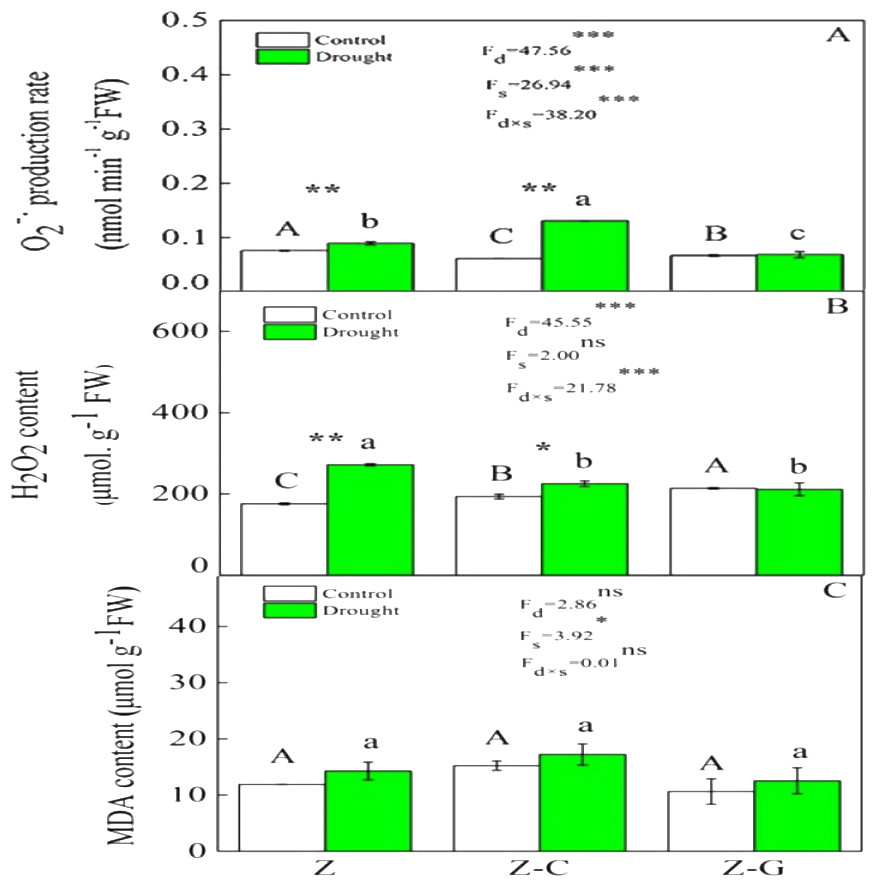
Figure 1: Effects on the ROS content of Z. bungeanum under extreme drought.
“Z-G” denotes Z. bungeanum intercropping with G. max, “Z-C” denotes Z. bungeanum intercropping with C. annuum, and “Z” denotes the Z. bungeanum monoculture. Vertical bars show ± SE of the mean (n = 3). Different uppercase letters indicate significant differences among control (normal rainfall) treatments. Different lowercase letters indicate significant differences among extreme drought treatments. “d” denotes extreme drought; “s” denotes planting system; “d ×s” denotes the interaction of extreme drought and planting system; Proportion of explained variance by extreme drought and planting system effects and by their interactions (two-way ANOVA). Significant levels:∗P < 0.05,∗∗P < 0.01,∗∗∗P < 0.001, “ns” no significant.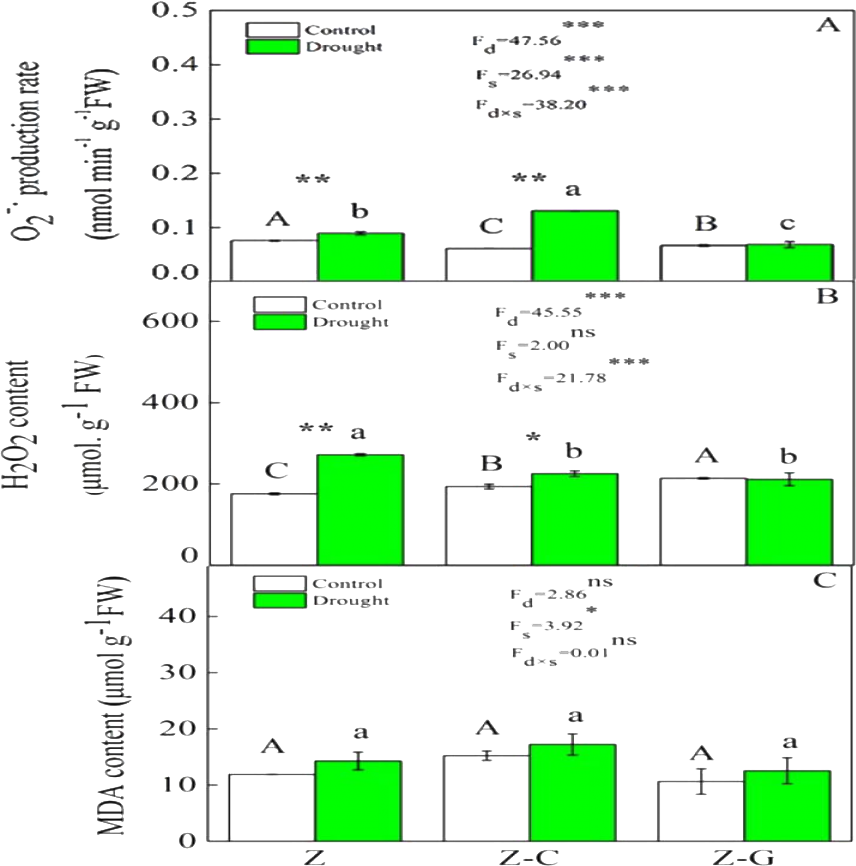
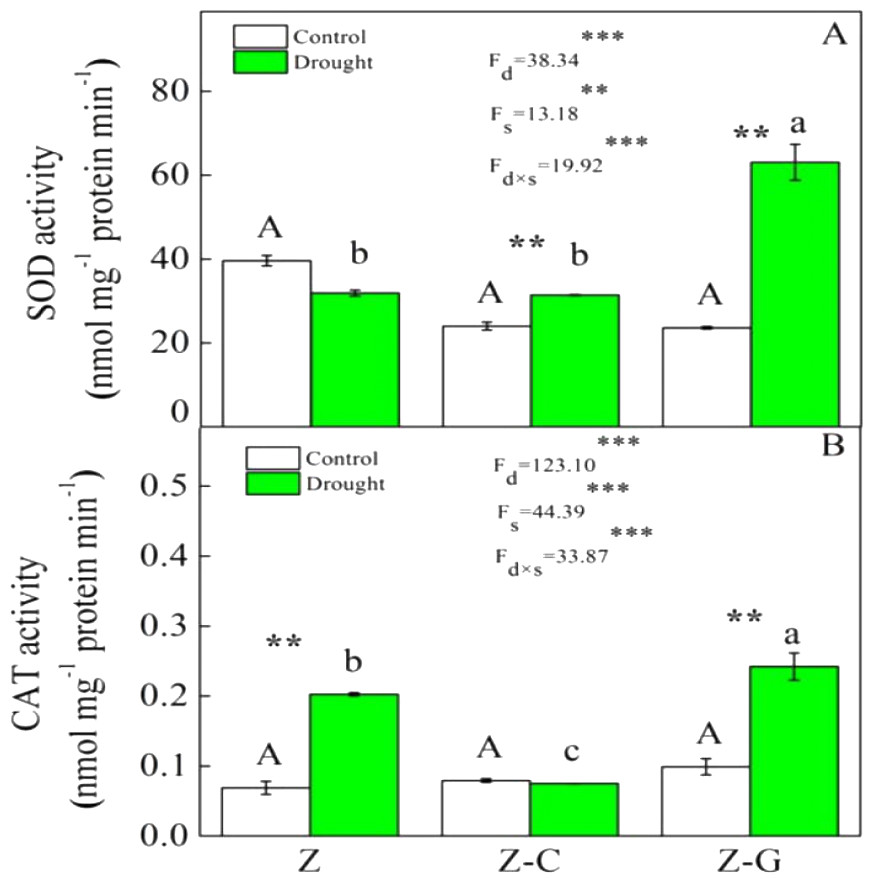
Figure 2: Effects on the SOD and CAT activity of Z. bungeanum under extreme drought.
“Z-G” denotes Z. bungeanum intercropping with G. max, “Z-C” denotes Z. bungeanum intercropping with C. annuum, and “Z” denotes the Z. bungeanum monoculture. Vertical bars show ± SE of the mean (n = 3) Different uppercase letters indicate significant differences among control (normal rainfall) treatments. Different lowercase letters indicate significant differences among extreme drought treatments. “d” denotes extreme drought; “s” denotes planting system; “d ×s” denotes the interaction of extreme drought and planting system; Proportion of explained variance by extreme drought and planting system effects and by their interactions (two-way ANOVA). Significant levels:∗P < 0.05,∗∗P < 0.01,∗∗∗P < 0.001, “ns” no significant.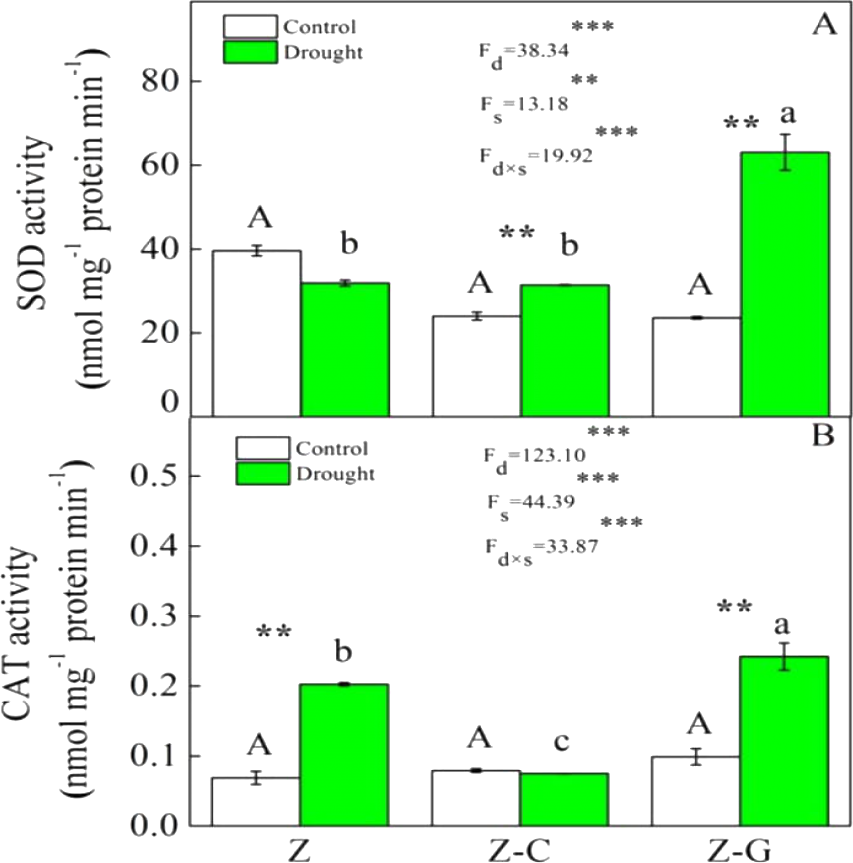
Plant pigment is a receptor of light radiation, and its level of content directly affects intensity of photosynthesis and formation of dry matter (Ghosh et al., 2004). Declines in Chl content commonly occur under drought stress (Bijanzadeh & Emam, 2010; Din et al., 2011), indicating effects on the pigment synthesis pathway or pigment degradation (Batra, Sharma & Kumari, 2014). However, we found there were no effects of extreme drought conditions on pigment content in Z. bungeanum in any of the three cropping systems, indicating that short-term extreme drought conditions did not affect the synthesis of chlorophyll encoded by the Cab gene family (Din et al., 2011). Efficient N nutrition alleviates effects of extreme drought conditions, by maintaining normal crop metabolism, even under low tissue water condition (Abid et al., 2016), and we found that Car content in G. max decreased under extreme drought conditions (Table 2), possibly due to reductions in NH4+-N and NO3−-N absorption.
Leaf growth reflects the physiological state of the plant when there is a water deficit (Parida et al., 2007), and LRWC directly reflects leaf water status. We found that LRWC of Z. bungeanum was lower in the Z monoculture than in the two intercropping systems (Table 1); however, the slight decreases in Z. bungeanum LRWC in Z-C and Z-G indicate that increasing diversity of crops may increase the water-holding capacity of the main crop species. Water-holding capacity directly affects plant metabolism, and leaf water status is closely related to photosynthetic activity (Ramachandra, Chaitanya & Vivekanandan, 2004). Our findings revealed that Pn in Z. bungeanum decreased in the Z monoculture and Z-C intercropping system under extreme drought stress conditions (Table 2), indicating that intercropping with G. max not only enhanced the water holding capacity of Z. bungeanum, but also promoted its photosynthetic capacity under extreme drought stress conditions. A key driver of decline in photosynthetic capacity is stomatal closure (Cornic, 2000); however, it is unclear whether drought inhibits photosynthesis due to stomatal closure or other metabolic impairments (Tezara et al., 1999). We found that extreme drought stress conditions led to increases in Ls in the three cropping systems and reduced levels of Ci in all three species, indicated that the decrease in photosynthetic capacity was related to water holding capacity and stomatal closure. Intercropping with G. max facilitated the maintenance of levels of Pn and Gs in Z. bungeanum under extreme drought conditions, indicating that stable LRWC allows normal photosynthetic activity to continue. Intercrops tend to have high water-use efficiency compared with single cropping (Morris & Garrity, 1993); however, our experiment showed there were high levels of WUEintr in Z. bungeanum in the Z monoculture ,probably in response to drought. The lack of effect of extreme drought on levels of Pn in Z. bungeanum in the Z-G mixed culture showed that intercropping with G. max may alleviate declines in Z. bungeanum photosynthetic activity under extreme drought stress conditions. We also found that Gs in G. max decreased under extreme drought conditions, indicating that water absorption was blocked that may have reduced competition for soil water between G. max and Z. bungeanum. Supporting our findings, previous work has shown that levels of Tr in G. max decrease under drought stress (He et al., 2017). Extreme drought conditions led to decreases in Pn in Z. bungeanum, but no changes in WUEintr or Gs in the Z-C intercropping system. However, we found that compared with Z-G, levels of Tr in Z. bungeanum were greater in the Z-C intercropping system, indicating greater water demand in C. annuum and competition for water between C. annuum and Z. bungeanum that likely affected levels of water absorption in Z. bungeanum.
ROS production and antioxidant enzymes
Plants that suffer drought stress accumulate free radicals, including superoxide anion, and hydrogen peroxide (Munné-Bosch & Penuelas, 2003), and sudden rises in ROS production induce DNA breakage, lipid peroxidation, protein degradation, and ultimately, cell death (Apel & Hirt, 2004). Responses of Z. bungeanum to drought stress conditions include increases in MDA content (Duling & Liu, 2010), and in this experiment, we found that Z. bungeanum ROS (O2− and H2O2) production and MDA content were greater under extreme drought stress conditions in the Z-C intercropping system than in the control (Fig. 1). Similarly, SOD activity was greater in the Z-C intercropping system, supporting previous findings that elevated levels of SOD activity improve tolerance of oxidative stress (Anikó Mátai & Éva, 2019; Oliveira et al., 2014; Pan, Wu & Yu, 2006) and demonstrating antioxidant defense mechanisms are active in Z. bungeanum under drought conditions. We found that H2O2 and MDA content were also greater in C. annuum under extreme drought conditions. In the Z-G intercropping systems, there were no effects of extreme drought on ROS or MDA content in Z. bungeanum; however, SOD activity in Z. bungeanum (Fig. 2) and MDA content in G. max were greater, indicating that G. max facilitates greater drought tolerance in Z. bungeanum than when Z. bungeanum is grown in a monoculture or with C. annuum.
Soluble sugars, proline and soluble proteins
Under normal moisture conditions, content of soluble sugars and soluble protein in Z. bungeanum were found to be greater in the Z-C intercropping system than in the Z monoculture or Z-G intercropping system, while proline content was greater in the Z monoculture than in the Z-G intercropping system. In contrast, under extreme drought conditions, soluble sugars and soluble protein content in Z. bungeanum was greater in the Z monoculture and Z-C intercropping system than in the Z-G treatment. We found that extreme drought conditions had no effect on content of soluble sugars, soluble protein, or proline in C. annuum and G. max.
When osmotic regulation reduces osmotic potential, plants accumulate a variety of osmolytes that allow the absorption of water by cells that is essential during prolonged drought for the maintenance of physiological activity (Farooq et al., 2009; Ramanjulu & Bartels, 2002). Short periods of drought stress increase soluble sugar content in leaves (Haiyan Wang et al., 2015), and our results showed that, under normal moisture conditions, soluble sugar and soluble protein content in Z. bungeanum was greatest in the Z-G intercropping system than the Z monoculture or Z-C treatment, but under extreme drought conditions, they were lower in the Z-G treatment. These results may reflect the drought-mediated limitation of normal utilization and transport of osmotic substances or subsequent hydrolysis of starch (Shubhra Dayal, Goswami & Munjal, 2004). Our results show that osmoregulation in Z. bungeanum under extreme drought conditions was lowest in the Z-C intercropping system.
Conclusions
Z. bungeanum exhibits strong drought resistance, because of its high photosynthetic parameters, water use efficiency, and osmotic flexibility. We found that G. max and C. annum coped with extreme drought stress conditions by improving water holding capacity in Z. bungeanum, but by contrasting modes of action proving the first hypothesis of this study. Greater drought resistance in Z. bungeanum was facilitated by G. max, due to its positive effect on drought responses in Z. bungeanum, rather than through N fixation, which disapproves the second hypothesis of this study. There was evidence of water competition between C. annum and Z. bungeanum; therefore, we conclude the Z-G intercropping system facilitated better tolerance to extreme drought conditions for Z. bungeanum than the Z-C treatment.