
Similarity of salivary microbiome in parents and adult children
- Published
- Accepted
- Received
- Academic Editor
- Tatiana Tatarinova
- Subject Areas
- Bioinformatics, Genetics, Microbiology, Molecular Biology
- Keywords
- Metagenomics, Next generation sequencing, Saliva, Microbiota, Similarity, 16S rRNA gene
- Copyright
- © 2020 Sundström et al.
- Licence
- This is an open access article distributed under the terms of the Creative Commons Attribution License, which permits using, remixing, and building upon the work non-commercially, as long as it is properly attributed. For attribution, the original author(s), title, publication source (PeerJ) and either DOI or URL of the article must be cited.
- Cite this article
- 2020. Similarity of salivary microbiome in parents and adult children. PeerJ 8:e8799 https://doi.org/10.7717/peerj.8799
Abstract
Background
Human saliva contains approximately 700 bacterial species. It has been reported that the salivary microbiome of a large family of closely related individuals consisting of multiple households is similar but the relatedness of salivary bacteria between generations of parents and their children has not yet been investigated. The objectives were to investigate the entirety of salivary bacterial DNA profiles and whether and how families share these profiles and also compare these communities between grandparents and their first daughter generations (F1) using 16S rRNA gene amplicon sequencing.
Results
The most abundant phyla in two separate families were Firmicutes, Bacteroidetes, Proteobacteria, Fusobacteria and Actinobacteria. Family ties explained 13% of the variance between individuals’ bacterial communities (R2 = 0.13; P = 0.001). Mothers shared more OTUs with adult children compared to fathers, but this linkage seemed to be weaker in the nuclear family with older adult children. We identified 29 differentially abundant genus level OTUs (FDR < 0.05) between families, which accounted for 31% of the total identified genus level OTUs.
Conclusions
Our results indicate that adult family members share bacterial communities and adult children were more similar to mothers than fathers. The observed similarity in oral microbiome between parent–child pairs seemed to weaken over time. We suggest that our analysis approach is suitable for relatedness study of multigenerational salivary bacteria microbiome.
Background
The human body is considered as holobiont, meaning an organism consisting of the host and all its associated microbiota (Rosenberg & Zilber-Rosenberg, 2016), which consists of approximately 3.0 × 10¹³ human cells and 3.8 × 10¹³ bacterial cells (Sender, Fuchs & Milo, 2016). Bacteria are transmitted to the host in two ways: horizontal transmission occurs between unrelated individuals by contact or by respiratory, oral or fecal spread. Vertical transmission occurs directly from parents to offspring, for example, via ovum, placenta, vagina, milk or saliva (Van Winkelhoff & Boutaga, 2005; Matsumiya et al., 2002). According to the holobiont theory, where humans are a combination of host and microbial cells, birth is more than just an origin of a new individual; it is an origin of a new community, that is, a new holobiont (Gilbert, 2014).
The holobiont theory is supported by studies on meconium, the first stool of a mammalian infant, which is secreted during foetal time and shown to contain bacteria (Gosalbes et al., 2013). Jimenez et al. (2008) showed in mice studies that labelled Enterococcus faecium was found in the pup’s meconium after an aseptic caesarean section in those pregnant mice whose diet contained the same bacteria. Infants acquire their mothers’ microbiota from multiple anatomic sites after birth. Previous studies have demonstrated a high degree of similarity of oral bacterial compositions between mothers and their children; the two may share as much as 94% of their oral bacterial spectra, including cariogenic species (Li et al., 2007).
The oral cavity is a major gateway for bacteria to enter the human body and a natural route for passage to respiratory and gastrointestinal tracts. The oral cavity consists of a diverse and complex community containing hundreds of different bacterial species. Saliva is a good candidate to study human microbiota since the sampling is non-invasive and fast. Salivary microbiota can also be distinguished from other oral microbiomes, such as gingival or tongue microbiome (Segata et al., 2012). It contains approximately 700 different bacterial species (Aas et al., 2005) at an average density of 1.4 × 10⁸ organisms per millilitre (Lazarevic et al., 2011). Due to the abundance of bacteria and its’ distinguished characteristics, it is easy to build up individual bacterial profiles. Moreover, the microbiome in the mouth is considered more stable than in the gastrointestinal tract and other microbial sites of the body (Costello et al., 2009). A longitudinal twin study showed that there is a core oral microbiome that does not change over time, but also that there is no difference between monozygotic and dizygotic twins, indicating that genetics do not affect oral microbiome composition (Stahringer et al., 2012). However, the similarity of the oral bacterial microbiome among adult family members has been reported (Shaw et al., 2017), but it is not known whether this bacterial microbiome profile characterizes families over generations.
Our aim was to do a feasibility study on the relatedness of oral microbiome by amplifying the 16S rRNA gene from salivary samples and to evaluate similarity of salivary bacterial profile between generations of parents and their children.
Materials and Methods
Study population
The study subjects were a family of three generations including ten adults, and an unrelated family of two generations including four adults (Fig. 1) (ethical approval by the Regional Ethics Committee of the Expert Responsibility area of Tampere University Hospital, reference number: R12217, and oral consent). Subjects were asked using a questionnaire about their general health, smoking habits and living conditions. Relatedness was based on a self-reported pedigree and not confirmed by DNA-testing since household sharing is the proposed main driver of salivary microbiome similarity. All adult children have shared household with their parents at least until the age of 18 years. Both families live in the same area in Southern Finland in an urban or suburban setting. All sampled subjects were used to study the entirety and total bacterial genera of oral microbiota using NGS.
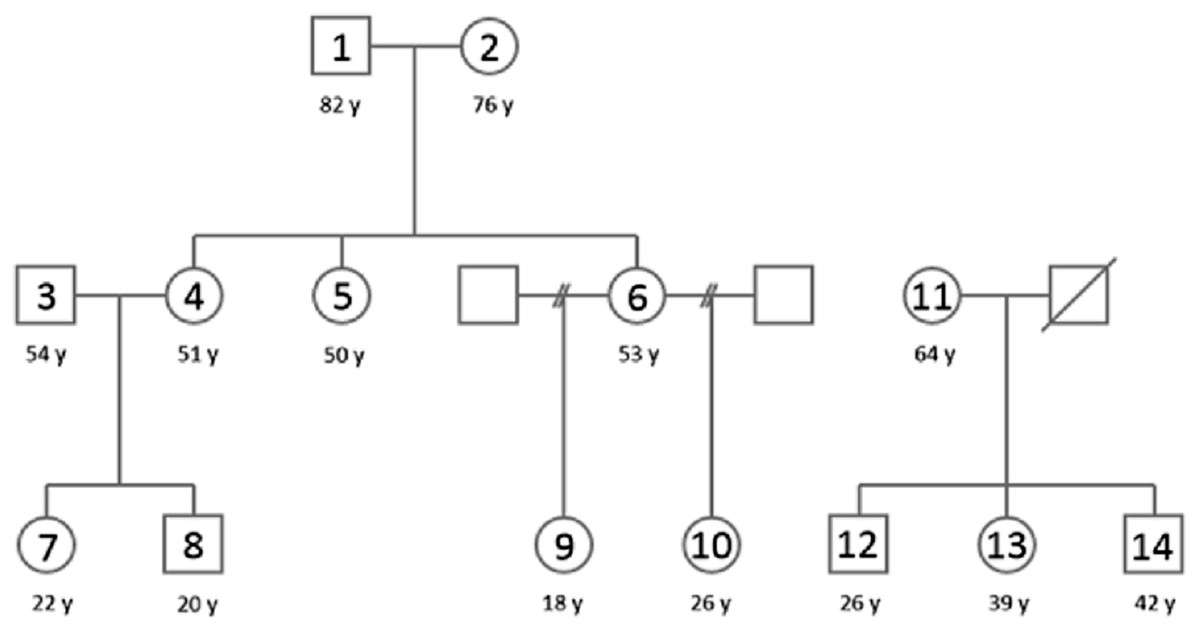
Figure 1: A pedigree of the population used in this study.
Family 1 (subjects 1–10) is located on the left and family 2 (subjects 11–14) on the right. The squares denote males and circles females, sample numbers are marked inside and ages (y) below the circles/squares. Subject 11 was excluded for pathogenic bacteria dominance in sequencing results and subject 13 was excluded due to smoking. Therefore core Family 1 included subjects 1–10 and core family 2 included subjects 12 and 14.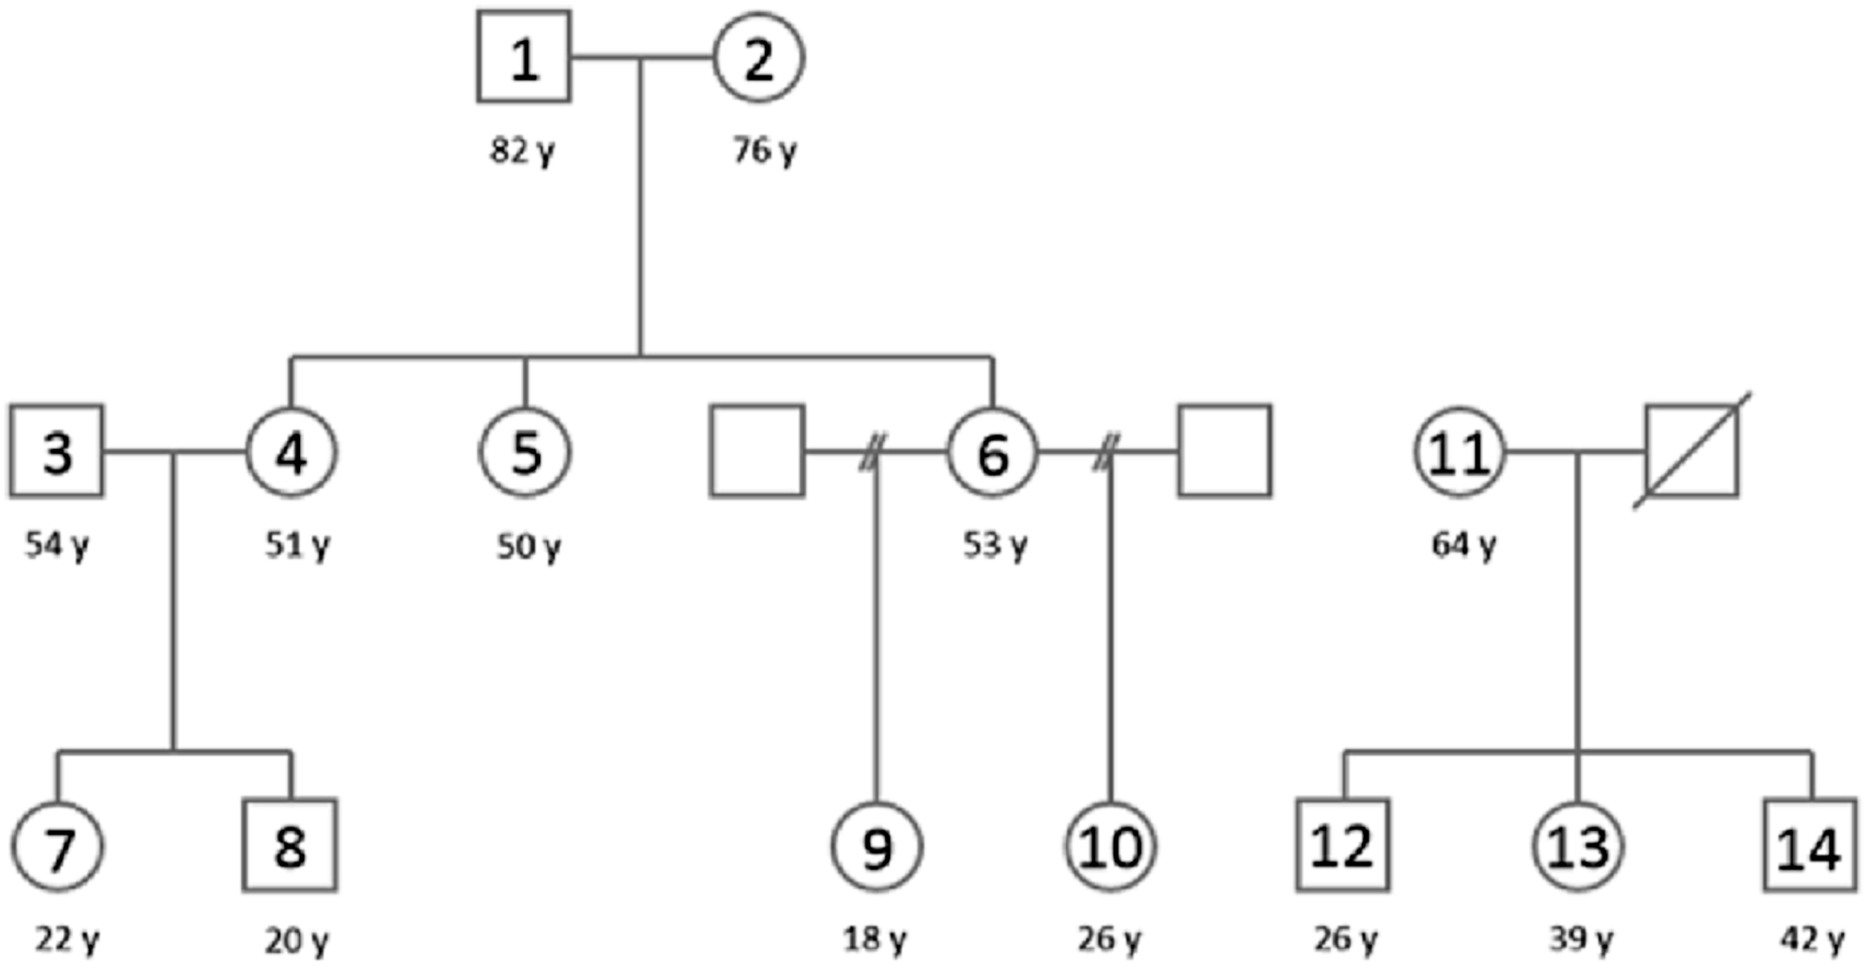
Collection of saliva samples
Unstimulated saliva samples were collected into sterile plastic vials (Sarstedt AG & Co., Nümbrecht, Germany). Samples were stored at −20 °C and analysed within 18 h. The subjects were asked to not eat or drink for 2 h prior to sampling. Subject 13 was excluded due to being the only smoker, thus smoking is not a confounding factor in this study.
DNA extraction and sequencing of the 16S rRNA gene
DNA was extracted from a maximum volume of two ml saliva according to the PureLink microbiome DNA purification kit (Thermo Fisher Scientific, Waltham, MA, USA). All samples were amplified in triplicates using universal primers targeting the V3–V4 regions on 16S rRNA gene: the forward primer with adapter was 341F TCG TCG GCA GCG TCA GAT GTG TAT AAG AGA CAG CCT ACG GGA GGC AGC AG (Muyzer, De Waal & Uitterlinden, 1993) and the reverse primer with adapter was R806 GTC TCG TGG GCT CGG AGA TGT GTA TAA GAG ACA GGG ACT ACH VGG GTW TCT AAT (Caporaso et al., 2011). The reaction mixture (25 µL) contained 2.5 µL genomic DNA, 2× KAPA HiFi HotStart ReadyMix (Kapa Biosystems, Wilmington, MA, USA), and 0.2 mM forward and 0.5 mM reverse primer. The PCR reaction conditions for amplification of DNA were as follows: Initial denaturation at 95 °C for 3 min, followed by 35 cycles of denaturation at 95 °C for 20 s, annealing beginning at 65 °C and ending at 55 °C for 15 s and extension at 72 °C for 30 s. The annealing temperature was lowered 1 °C every cycle until reaching 55 °C, which was used for the remaining cycles. Final elongation was for 5 min at 72 °C. Negative controls were included in triplicates during amplification. Magnetic bead purification (Beckman Coulter, Brea, CA, USA), second PCR, normalization and pooling were performed according to Illumina’s 16S metagenomic sequencing library preparation protocol (Illumina Ltd., San Diego, CA, USA). MiSeq® Reagent Kit v3 for 600 sequencing cycles (Illumina Ltd., San Diego, CA, USA) was used for MiSeq library with a final concentration of 4 pM and with 10% PhiX control. The DNA pool included a commercial Streptococcus mitis strain (ATCC® 49456™, LGC Standards, Teddington, Middlesex, UK) as mock community (Pyysalo et al., 2019).
Data analysis
The analyses were performed with Quantitative insight to microbial ecology (QIIME) (Caporaso et al., 2010) and Mothur software (Schloss et al., 2009). Low quality sequences were trimmed with minimum average PHRED quality score threshold of 20 (Q20) using Trimmomatic version 0.33 (Bolger, Lohse & Usadel, 2014). Sequences shorter than 200 nucleotide bases were dropped out. Chimeric sequences were identified using usearch61 (Edgar, 2010) method in de novo mode via identify_chimeric_seqs.py script in QIIME 1.9.1. Contaminants, that is, Archaea, Eukarya, mitochondrial and unknown sequences were filtered out with remove.lineage command in Mothur (version 1.38.1.). Taxonomies that were different among replicates were considered as bacterial contamination and were removed separately from each sample.
OTU picking was done with QIIME (version 1.9.1.) with UCLUST (Edgar, 2010) in de novo mode via the pick_otu.py script. Default parameters were used and clusters were generated with 97% similarity threshold but we focused our report to genus level based on assigned taxonomy to OTUs. Taxonomy assignment was done to the representative sequences for each of the OTUs via assign_taxonomy.py script against SILVA database (123 release) (Pruesse et al., 2007) as well as Human oral microbiome database (HOMD) (version 14.51) (Chen et al., 2010) using default parameter settings. Similarly, alignment of the representative sequences, filtration of the gaps present in all sequences in the alignment and building of a phylogenetic tree using the alignment were accomplished using the scripts in QIIME 1.9.1 software suite. Picked OTUs were converted to an OTU table in BIOM format for subsequent analysis using make_otu_table.py script. The OTU table was normalized using cumulative sum scaling (Paulson et al., 2013) via normalize_table.py script in QIIME 1.9.1.
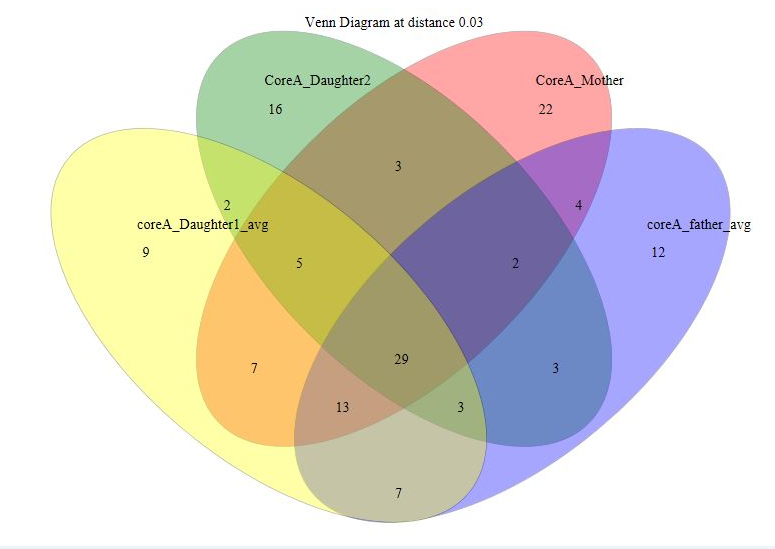
Beta diversity was calculated using unweighted UniFrac method via beta_diversity.py script. Adonis test (Anderson, 2001) was performed to assess the difference in bacterial community between the two families. Homogeneity of dispersion among groups and the validity of Adonis was tested using PERMDISP method (Anderson, 2006) via compare_categories.py script in QIIME 1.9.1 software suite. Differential abundance analysis was done using DESeq2 method via differential_abundance.py script in QIIME 1.9.1. Two nuclear families from our cohort were chosen to investigate the difference in OTUs shared between mother or father with adult children using Venn diagrams in R. Significance of the overlaps were estimated with hypergeometric test. Nuclear family A consists of parents and three daughters (subjects 1, 2, 4, 5 and 6) and nuclear family B consists of parents, one son and one daughter (subjects 3, 4, 7 and 8) (Figs. S1–S3). Figures S1 and S2 represent core A dataset. Figure S3 represent core B dataset. Two plots were generated for core A dataset because there are five groups in it and venn diagram can be clearly plotted with maximum of four groups.
Results
The quality control rate, Q30%, for the run was 75.7%. The total number of sequences obtained in one single run from the analyzed samples was 5,293,569, the average number of reads per sample was 182,536, and the average Shannon species diversity was 2.997 (SD = 0.108). Family transmission study was conducted in Family 1 for subjects 1–8 because only core families with both father, mother and all adult children present can be used for family studies. Subjects 9 and 10 from family 1 were not used for transmission study because they had two different fathers and comparison could not be made. Family 2 was not used for transmission study due to lack of father. Moreover, even if dental health was not examined in detail before sampling, no subjects claimed oral disease except for subject 11. In case of this subject, the saliva sample was mixed with a significant amount of blood and sequencing results showed dominance in pathogenic, mostly periodontitis bacterial sequences. For this reason, we excluded subject 11.
Differential abundance analysis of SILVA based taxonomy yielded 69 oral taxa. The analysis was repeated with HOMD based taxonomy, which yielded 91 taxa. According to SILVA, the major phyla were Firmicutes, Bacteroidetes, Proteobacteria, Fusobacteria and Actinobacteria (38% of the total identified phyla). The most common genera were Streptococcus spp., Veillonella spp., Prevotella spp., Neisseria spp. and Leptotrichia spp. (3.7% of the total identified genera). The most significant abundances were observed in bacterial taxa like unclassified Synergistaceae, Atopobium spp., Human oral bacterium BD1-5, Lactobacillus spp. and Butyrivibrio spp. (Table 1).
| Operational taxonomic unit | Padjusted | Stat |
|---|---|---|
| Synergistaceae unclassified | 1.66 × 10⁻¹¹ | −7.381 |
| Atopobium spp. | 6.28 × 10⁻⁹ | 6.441 |
| Human oral bacteria BD1-5 | 8.21 × 10⁻⁸ | −5.973 |
| Lactobacillus spp. | 1.84 × 10⁻⁷ | 5.792 |
| Butyrivibrio spp. | 1.07 × 10⁻⁴ | −4.492 |
Differences in oral microbiome between and within families
The R2 value obtained from Adonis test indicates that approximately 13% of the variances in the distances is explained by grouping based on families (R2 = 0.13; p = 0.001). Significant difference in dispersion was indicated between the two families by PERMDISP test (F-value = 9.17, p = 0.006).
Of the 69 oral taxa detected by Differential abundance analysis in SILVA based taxonomy, 29 were significantly different in two families (FDR < 0.05, Table S1). Of the 91 taxa detected with HOMD based taxonomy, 39 were found to be significantly different (FDR < 0.05, Table S2). Of all observed taxa, 22 were common to both databases. Major differences were observed in unclassified taxa (n = 6, Tables S1 and S2).
Shared OTUs between parents and adult children were mapped in Venn diagrams (Figs. S1–S3). Overlaps with hypergeometric p-value were analyzed, indicating adult children share more OTUs with mothers as compared to fathers but the difference in shared OTUs decreased over time with the child aging (Fig. 2; Table 2).

Figure 2: Shared OTUs between parents and adult children according to Fig. 1.
| Pedigree number | Age of child (y) | Age of parent (y) | Overlap (number of OTUs) | Hypergeometric p-value | |
|---|---|---|---|---|---|
| Nuclear family A | |||||
| CoreA_Mother–coreA_daughter1_avg (Fig. S1) | 2 4 |
51 | 76 | 54 | 0.006811284 |
| CoreA_Mother–coreA_daughter2 (Fig. S1) | 2 5 |
50 | 76 | 39 | NS |
| CoreA_Mother–coreA_daughter3 (Fig. S2) | 2 6 |
53 | 76 | 52 | 4.593393e-05 |
| CoreA_father–coreA_daughter1_avg (Fig. S1) | 1 4 |
51 | 82 | 52 | 3.138095e-05 |
| CoreA_father_avg–coreA_daughter2 (Fig. S1) | 1 5 |
50 | 82 | 37 | NS |
| CoreA_father_avg–coreA_Daughter3_avg (Fig. S2) | 1 6 |
53 | 82 | 46 | 0.0001144497 |
| Nuclear family B | |||||
| CoreB_mother_avg–coreB_daughter_avg (Fig. S3) | 4 7 |
22 | 51 | 60 | 2.649257e-06 |
| CoreB_mother_avg–coreB_Son (Fig. S3) | 4 8 |
20 | 51 | 62 | NS |
| CoreB_father_avg–coreB_daughter_avg (Fig. S3) | 3 7 |
22 | 54 | 39 | 0.0005486819 |
| CoreB_father_avg–coreB_Son (Fig. S3) | 3 8 |
20 | 54 | 42 | NS |
Discussion
Saliva is one of the most studied oral microbiomes in humans due to the ease of collection (Cameron et al., 2015). We investigated the entirety of salivary bacterial DNA profiles and whether and how families share these profiles and also compare these communities between grandparents and their first daughter generation (F1) using 16S rRNA gene amplicon sequencing. Our results indicate that adult family members share bacterial communities and adult children were more similar to mothers than fathers. The observed similarity in oral microbiome between parent–child pairs seemed to weaken over time.
We used next generation sequencing and two databases (SILVA, HOMD) to analyze the entirety and vertical transmission of bacterial community in saliva in two families. We used two databases for comparison to increase reliability of our results due to small sample size. In our cohort results were better seen and presented with SILVA (123 release), thus we chose to use this database for presenting results. Databases are constantly updated and for this reason new versions may give different results.
Of the two databases, SILVA is older, and for long considered as the gold standard. SILVA provides updated data sets of aligned small (16S/18S) and large subunit (23S/28S) sequences for all three domains of life (Bacteria, Archaea and Eukarya) (Quast et al., 2013), whereas HOMD is a relatively new database, but has lately been used a lot in oral microbiome related articles (Timby et al., 2017; Vesty et al., 2017; Adams et al., 2017). HOMD is a smaller database, since the human oral cavity only consists of approximately 700 species, whereof 400 are currently listed in HOMD. It is possible to go down to species level with this phylogeny-curated database (Dewhirst et al., 2010). The variety between results from databases can partly be explained by the biases for each database, where certain bacteria genera or phyla are often overrepresented, but also since assigning down to genera level from 16S rRNA gene sequences can hide micro-heterogeneity and thus falsify OTU results (Poretsky et al., 2014). A set of universal primers was used for amplification of bacterial DNA, however, no primer pair is actually universal, and thus there is a possibility of DNA sequence dropout due to the primers, which are not amplifying all sequences.
The most significantly abundant taxa according to SILVA, Synergistaceae unclassified, was not recognized by HOMD. Among all significant taxa, 22 same taxa were observed in both databases, among the 10 most significantly abundant taxa Peptostreptococcaceae, Megasphaera spp., Capnocytophaga spp. and Slackia spp. were recognized in both databases. Overall, the taxa recognized by the databases were relatively similar, but their RFD-values were for the most part not consistent. According to SILVA, we found Firmicutes to be the most abundant phyla. Our results are in line with those by Shaw et al. (2017) who established the same result with a significantly larger sample size and by using the database HOMD. Our results indicating Streptococcus, Veillonella, Prevotella and Neisseria being the most abundant genera. Similarily, Shaw et al. (2017) found that the most abundant genera were Streptococcus, Rothia, Neisseria and Prevotella.
The main reason for similarity of microbiota between newborns and mothers is considered bacteria that relocate from the birth canal during labor and from breast milk in infancy (Verdu, Galipeau & Jabri, 2015). From the birth canal, the child obtains the mother’s vaginal and faecal bacteria (Rosenberg & Zilber-Rosenberg, 2016) and bacteria from milk during breastfeeding (Fernandez et al., 2013). It has been shown that the diversity of a new-born’s gut microbiome changes gradually over time, reflecting changes in diet (Koenig et al., 2011). The earliest colonizers in the child’s oral cavity depend on both surrounding microbes and antibodies inherited from the mother.
Thus, the greater similarity of maternal bacteria dates back to childhood and a close physical contact between mother and infant. In contrast, to our knowledge, the stability of bacterial transfer has not been studied in adulthood between adult mother and child pairs over generations or by comparing oral microbial profiles of the adult child to the father’s microbiome. Previous studies (Li et al., 2007; Könönen, 2000; Milani et al., 2015) have focused on the development of the microbiome in children and adolescents, but not on the resemblance of the microbiome in adulthood and of three generations, as we have now done.
A study based on microbiome analysis of twin-pairs concluded that environmental factors provide the greatest influence on oral microbial composition (Stahringer et al., 2012; Shaw et al., 2017). Kort et al. (2014) however, showed that intimate kissing increases similarity between oral microbiomes of couples only temporarily, suggesting that an adult’s microbiota is stable. In our study, oral bacterial profile comparison between parents and younger adult children show a higher resemblance compared to elderly parents and their older adult children. Younger adult children, seven (22 years) and eight (20 years), still live with their parents, and this could partly explain the larger amount of shared OTUs. Older adult children four (51 years), five (50 years) and six (53 years) have lived in their own households for at least two decades.
It has been suggested that a large part of the oral microbiome is similar around the world (Shaw et al., 2017; Nasidze et al., 2009). Our PERMDISP results suggest that there are certain differences between families, and those differences might be due to the difference in dispersion instead of center. Moreover, the Adonis result reporting 13% variance due to family ties and rest due to environmental bacteria in the mouth is consistent with studies by Kort et al. (2014) and Nasidze et al. (2009).
The major weakness of this study is, however, the sample size. The small sample size interferes especially the heterogeneity calculated using PERMDISP and due the fact that we had only a few parents-adult children pairs to draw Venn diagrams and to calculate hypergeometric p-values. Thus, we conclude that larger cohorts are needed to confirm our preliminary results.
Conclusion
In conclusion, our exploratory study making use of 16S rRNA amplicon sequencing followed by extensive data analysis suggests that even if mothers could be closer to their adult children compared to fathers in early adulthood, this similarity may change over time. Our study suggests that even though the oral cavity is very prone to inhabit environmental bacteria, the mother still has a role in her offspring’s oral microbiota in the adulthood. This research setting can serve as a foundation for further research with larger sample sizes and better defined families.
Supplemental Information
Venn diagram for Nuclear family A comprising five individuals. Two venn diagrams were plotted with maximum four groups in each for clarity.
Venn diagram showing OTU overlaps between family members in Nuclear Family A for parents and daughters 1 and 2 (Subjects 1, 2, 4 and 5).
Venn diagram for Nuclear Family A comprising five individuals. Two venn diagrams were plotted with maximum four groups in each for clarity.
Venn diagram showing OTU overlaps between family members in Nuclear Family A for parents and daughters 2 and 3 (Subjects 1, 2, 5 and 6).
Venn diagrams showing OTU overlaps between family members in Nuclear Family B (Subjects 3, 4, 7 and 8).
Bacterial taxa with adjusted P-values obtained from SILVA. P-values are adjusted for multiple testing correction in order to reduce false positive results.
Stat is DESeq2 Wald statistics that represents difference in abundance of taxa between the compared families. The p-value value (adjusted) represents the probability that the observed difference (Wald statistics) is observed even though there is no real difference (by chance).
Bacterial taxa with adjusted P-values obtained from Human Oral Microbiome Database (HOMD). P-values are adjusted for multiple testing correction in order to reduce false positive results.
Stat is DESeq2 Wald statistics that represents difference in abundance of taxa between the compared families. The p-value value (adjusted) represents the probability that the observed difference (Wald statistics) is observed even though there is no real difference (by chance).