
Genome-wide identification and expression analysis of the VQ gene family in Cicer arietinum and Medicago truncatula
- Published
- Accepted
- Received
- Academic Editor
- Ana Ribeiro-Barros
- Subject Areas
- Agricultural Science, Bioinformatics, Plant Science
- Keywords
- Cicer arietinum, Medicago truncatula, VQ gene family, Gene expression, Abiotic stress, Bioinformatics
- Copyright
- © 2020 Ling et al.
- Licence
- This is an open access article distributed under the terms of the Creative Commons Attribution License, which permits unrestricted use, distribution, reproduction and adaptation in any medium and for any purpose provided that it is properly attributed. For attribution, the original author(s), title, publication source (PeerJ) and either DOI or URL of the article must be cited.
- Cite this article
- 2020. Genome-wide identification and expression analysis of the VQ gene family in Cicer arietinum and Medicago truncatula. PeerJ 8:e8471 https://doi.org/10.7717/peerj.8471
Abstract
Valine-glutamine (VQ) proteins are plant-specific proteins that play crucial roles in plant development as well as biotic and abiotic stress responses. VQ genes have been identified in various plants; however, there are no systematic reports in Cicer arietinum or Medicago truncatula. Herein, we identified 19 and 32 VQ genes in C. arietinum and M. truncatula, respectively. A total of these VQ genes were divided into eight groups (I–VIII) based on phylogenetic analysis. Gene structure analyses and motif patterns revealed that these VQ genes might have originated from a common ancestor. In silico analyses demonstrated that these VQ genes were expressed in different tissues. qRT-PCR analysis indicated that the VQ genes were differentially regulated during multiple abiotic stresses. This report presents the first systematic analysis of VQ genes from C. arietinum and M. truncatula and provides a solid foundation for further research of the specific functions of VQ proteins.
Introduction
Valine-glutamine (VQ) genes are plant-specific genes involved in plant growth, development, and various stress responses (Dong et al., 2018; Guo et al., 2018; Jing & Lin, 2015; Cheng et al., 2012; Li et al., 2014). They contain a conserved motif, named the VQ motif, which possesses approximately 50–60 amino acids with a highly conserved FxxhVQxhTG domain (Jing & Lin, 2015; Cai et al., 2019). The mutant strain of AtVQ14 in the VQ domain causes Arabidopsis to produce smaller seeds (Wang et al., 2010a). Recently, VQ genes have been identified in multiple plants, such as Arabidopsis thaliana (34) (Cheng et al., 2012), Oryza sativa (39) (Kim et al., 2013a), Zea mays (61) (Song et al., 2016), Glycine max (74) (Zhou et al., 2016), and Vitis vinifera (18) (Wang et al., 2015). These genes are phylogenetically clustered into different groups, which are dependent on the analysed genomes (Jiang, Sevugan & Ramachandran, 2018). In addition, most VQ proteins reportedly contain fewer than 300 amino acids and lack introns (Jiang, Sevugan & Ramachandran, 2018; Cai et al., 2019).
The VQ proteins have multiple functions at different stages of plant growth (Jiang, Sevugan & Ramachandran, 2018). For example, the AtVQ8 mutation causes a yellowish-green leaf phenotype and growth retardation throughout the entire developmental period (Cheng et al., 2012). Over-expression of AtVQ29 reduces the hypocotyl growth of seedlings under special light conditions (Perruc et al., 2004). VQ proteins are also involved in plant responses to biotic and abiotic stresses (Perruc et al., 2004). AtVQ21 (MKS1)-overexpressing transgenic plants exhibit decreased resistance to Botrytis cinerea but significantly increased resistance to Pseudomonas syringae (Lai et al., 2011), and AtVQ15 (AtCaMBP25)-overexpressing transgenic plants exhibit sensitivity to osmotic stress during seed germination and seedling growth (Perruc et al., 2004). In addition, the transcript levels of some VQ genes in rice are affected by exposure to drought (Kim et al., 2013a). Most studies have indicated that many VQ proteins interact with WRKY transcription factors, which are not only involved in plant growth but also participate in multiple regulatory pathways (Chen et al., 2018; Lei et al., 2017; Lei, Ma & Yu, 2018; Wang et al., 2015; Yanru et al., 2013; Ye et al., 2016). For instance, AtVQ14 interacts with AtWRKY10 to regulate endosperm growth and seed size (Cheng et al., 2012), and AtVQ9 acts antagonistically with AtWRKY8 to mediate responses to salt stress (Yanru et al., 2013). AtVQ22 could negatively control mediated JA defense through interact with AtWRKY28 and AtWRKY51 (Po et al., 2013). Moreover, MaWRKY26 could physically interact with MaVQ5, restricting the transactivation of the genes which control the JA biosynthetic, indicating that MaVQ5 might act as a repressor of MaWRKY26 in activating the JA biosynthesis in banana (Ye et al., 2016).
Legumes represent the third largest family of seed plants and one of the most important sources of food and nutrition for humans and animals (Wang et al., 2017a; Kim et al., 2013b). Cicer arietinum and Medicago truncatula are common legumes and model plants that have been used to study legume genomics (Wang et al., 2017a). However, VQ genes have not been comprehensively evaluated in C. arietinum or M. truncatula. In this study, we identified 19 and 32 VQ genes in C. arietinum and M. truncatula, respectively. We conducted a comprehensive analysis to examine their phylogenetic relationship, gene structure, protein motifs, chromosome locations, promoters and collinearity, used silico expression analysis of VQ genes to show expression patterns of VQ genes in different tissues, and a qRT-PCR analysis to explore their responses to multiple abiotic stresses. This report provides a theoretical basis for the evolutionary relationship and function of the VQ genes in C. arietinum and M. truncatula.
Materials & Methods
Identification of VQ genes
The current genome sequence and annotation files of C. arietinum and M. truncatula were downloaded from Phytozome v12.1 (https://phytozome.jgi.doe.gov/pz/portal.html). The most updated Hidden Markov Model (HMM) for the VQ gene family (PF05678) was downloaded from the Pfam database (http://pfam.xfam.org) (Punta et al., 2004). We conducted a BLAST search against the entire protein dataset of C. arietinum and M. truncatula with a cut-off E-value of 0.1. Subsequently, all hit protein sequences were extracted using custom Perl scripts. Then, the integrity of the VQ domain was evaluated using SMART tools with an e-value <0.1 (Ivica, Tobias & Peer, 2012), and candidate CaVQ and MtVQ proteins composed of a truncated VQ domain were identified. Peptide length, molecular weight (MW), and isoelectric point (pI) of each VQ protein were calculated using the online ExPASy program (https://www.expasy.org/) (Wilkins et al., 1999). Detailed information of CaVQ and MtVQ proteins can be found in Table S1.
Phylogenetic analysis
To investigate the phylogenetic relationships of the VQ gene families among A. thaliana, O. sativa, C. arietinum, M. truncatula, among them, AtVQ and OsVQ proteins were downloaded from Phytozome v12.1 (http://www.phytozome.org) (Goodstein et al., 2012; Kim et al., 2013a; Cheng et al., 2012). VQ proteins were aligned using the BioEdit program. A neighbour-joining (NJ) phylogenetic tree was constructed for these proteins with MEGA5.0 software (Tamura et al., 2011). Bootstrapping was performed with 1,000 replications. Genes were classified according to their distance homology with A. thaliana, O. sativa, G. max and P. vulgaris genes (Cheng et al., 2012; Kim et al., 2013a).
Motif prediction and gene structure analysis of VQ genes
The online MEME analysis was performed to identify unknown conserved motifs (http://meme.ebi.edu.au/) using the following parameters: site distribution: zero or one occurrence (of a contributing motif site) per sequence; maximum number of motifs: 20; and optimum motif width: ≥6 and ≤200 (Bailey et al., 2015) . A gene structure displaying server program (http://gsds.cbi.pku.edu.cn/index.php) was used to display the structures of the CaVQ and MtVQ genes.
Chromosomal distribution, gene duplication and collinearity analysis
Physical positions of CaVQ and MtVQ genes were retrieved from the GFF3 annotation file using a Perl script, and diagrams of their chromosomal locations and duplication events were drawn using MG2C website (http://mg2c.iask.in/mg2c_v2.0/). In addition, gene duplication information was also identified based on public data in the Plant Genome Duplication Data base (PGDD, http://chibba.agtec.uga.edu/duplication/) (Lee et al., 2013). If two homologous genes were separated by five or fewer genes, they were identified as tandem duplications, while if two genes were separated by more than five genes or distributed in different chromosomes, they were referred to as segmental duplications. BLASTP, OrthoMCL (http://orthomcl.org/orthomcl/about.do#release) and Multiple collinear scanning toolkits (MCScanX) with the default parameters were used to analyze the gene replication events (E <1 e−5, top 5 matches) (Li, Stoeckert & Roos, 2003; Wang et al., 2012).
Calculating Ka and Ks of the homologous VQ gene pairs
Ka and Ks were used to assess the selection history and divergence time of gene families (Li, Gojobori & Nei, 1981). The number of synonymous (Ks) and nonsynonymous (Ka) substitutions of paralogous MtVQ gene pairs and orthologous VQ gene pairs between C. arietinum and M. truncatula were computed using the KaKs_Calculator 2.0 with the NG method (Wang et al., 2010b)). Divergence time (T) was calculated using the formula T = Ks/ (2 × 6. 1 × 10−9) ×10−6 million years ago (MYA) (Wang et al., 2017a).
Analysis of cis-elements in VQ promoters
The cis-elements of CaVQ and MtVQ promoters were analysed to further understand the VQ gene family. The 1,500 bp upstream sequences of the CaVQs and MtVQs promoter regions were downloaded FASTA format from the Phytozome database and used to identify the putative cis-elements in PlantCARE (http://bioinformatics.psb.ugent.be/webtools/plantcare/html/) (Rombauts et al., 1999).
In silico expression analysis of VQ genes
The transcriptome data in different tissues of C. arietinum and M. truncatula were available in the NCBI SRA (http://www.ncbi.nlm.nih.gov) with accession numbers PRJNA413872 and PRJNA80163, respectively. The quality-filtered reads were mapped to the respective C. arietinum and M. truncatula genomes with the spliced read mapper. Clean reads from all samples were mapped to the genome sequence using SAM (Li et al., 2009). TopHat v2.1.0 (Trapnell, Pachter & Salzberg, 2009). Cufflinks v2.1.1 and cuffcompare (Trapnell et al., 2010) were used to estimate the abundance of reads mapped to genes by calculating the fragments per kilobase of transcript per million (FPKM) values. Transcriptome data of the C. arietinum, including the nodule, leaf, flower, root, pod and bud; nodule, blade, flower, root, seedpod and bud in M. truncatula were obtained. The FPKM (fragment per kilobase per million mapped reads) representing the gene expression level of each CaVQ and MtVQ was extracted with custom Perl scripts. The heatmaps showing expression profiles were generated using log10-transformed FPKM values. The heatmaps and k-means clustering were generated using R 3.2.2 software (Gentleman et al., 2004).
Plant material, treatments, RNA extraction and quantitative real-time PCR (qRT-PCR)
C. arietinum (ICC4958) and M. truncatula (Jemalong A17) were used in this study. ICC4958 is drought tolerant, and Jemalong A17 is salt-sensitive and drought-tolerant. In the greenhouse, seeds were planted in a 3:1 (w/w) mixture of soil and sand, germinated, and irrigated with half-strength Hoagland solution once every 2 days. Seedlings were grown at a night temperature of 18 °C, day temperature of 24 °C, relative humidity of 60%, and 14/10 h photoperiod (daytime: 06:00–20:00). Seedlings that germinated after 8 weeks were subjected to the following environmental conditions: temperatures of 4 (cold) or −8 °C (freezing) and treatment with 300 mM mannitol (drought) and 200 mM NaCl solution (salt). The control (untreated) and treated seedlings were harvested at 1 h, 6 h, 12 h, and 24 h after treatment. All samples were frozen in liquid nitrogen and stored at −80 °C until further use.
Primers were designed to amplify 19 CaVQ and 32 MtVQ CDS using Primer Express 3.0 software, and the primer pairs are listed in Table S1. Total RNA was extracted from the root of C. arietinum and M. truncatula using the RNA Prep Pure Plant Kit (Tiangen, Beijing, China). The RNA quality was checked using 1.0% (w/v) agarose gel stained with ethidium bromide (EB) and spectrophotometer analysis and then DNase I treatment was conducted to remove the DNA contaminations (Takara, Shiga-ken, Japan). cDNA was synthesized from total RNA using the ReverTra Ace qPCR RT Kit (Toyobo Life Science, Shanghai, China). Quantitative real-time PCR (qRT-PCR) was performed using SYBR Green and monitored on an ABI 7300 Real-Time PCR system (Applied Biosystems, CA, USA). The PCR conditions were set as follows: 95 °C for 10 min; 40 cycles at 95 ° C for 15 s, 55 °C for 30 s, and 72 ° C for 30 s, a final step to preparation of DNA melting curve at 95 °C for 15 s, and then one cycle at 60 °C for 20 s and one cycle at 95 ° C for 15 s. Rapid detection expression levels of CaVQ and MtVQ genes using the qRT-PCR with DNA melting curve analysis. The gene β-actin was used as a reference gene. The relative expression levels of each gene were analysed using the 2−△△Ct method (Livak & Schmittgen, 2000). All samples were tested with three technical replicates and three independent biological replicates.
Results
Identification and phylogenetic analysis of VQ genes in two legumes
A total of 19 and 32 genes putatively encoding VQ domains were identified in C. arietinum and M. truncatula, respectively. We designated the 19 VQ genes in C. arietinum as CaVQ1 to CaVQ19 and 32 VQ genes in M. truncatula as MtVQ1 to MtVQ32 according to their physical locations on the chromosomes (Table 1). The lengths of these VQ proteins ranged from 82 (MtVQ9) to 419 (MtVQ22) amino acids (aa), with an average of 206 aa. Their molecular weights varied from 9.3 (MtVQ9) to 45.8 (CaVQ17/CaVQ19) kDa, and the theoretical isoelectric points (pI) extended from 4.06 (CaVQ4) to 10.68 (MtVQ21) . Among them, MtVQ30 and MtVQ31 as well as CaVQ17 and CaVQ19 were highly similar.
We constructed a NJ phylogenetic tree to explore the evolutionary relationship between VQ genes in C. arietinum, M. truncatula, A. thaliana and O. Sativa (Fig. 1). As shown in Fig. 1, VQ proteins were classified into eight groups. Groups II and III contained 10 proteins, respectively. While Group V only contained 3 VQ proteins. We also found that CaVQs and MtVQs were clustered together, suggesting that they might have originated from a common ancestor.
Conservative motifs and structural analysis
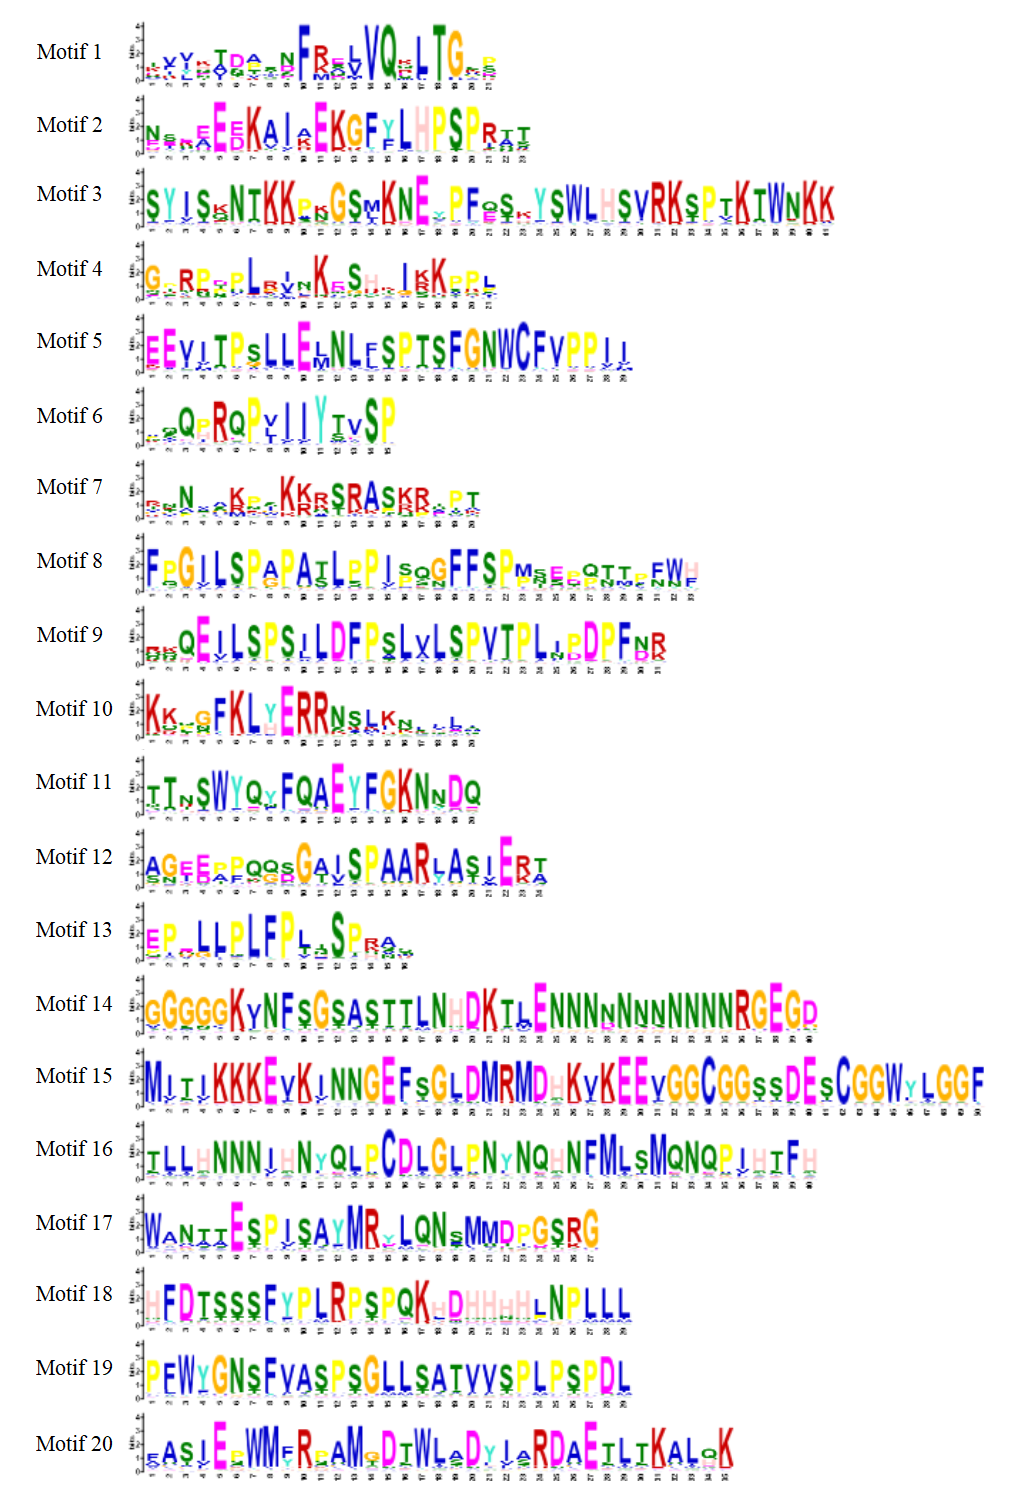
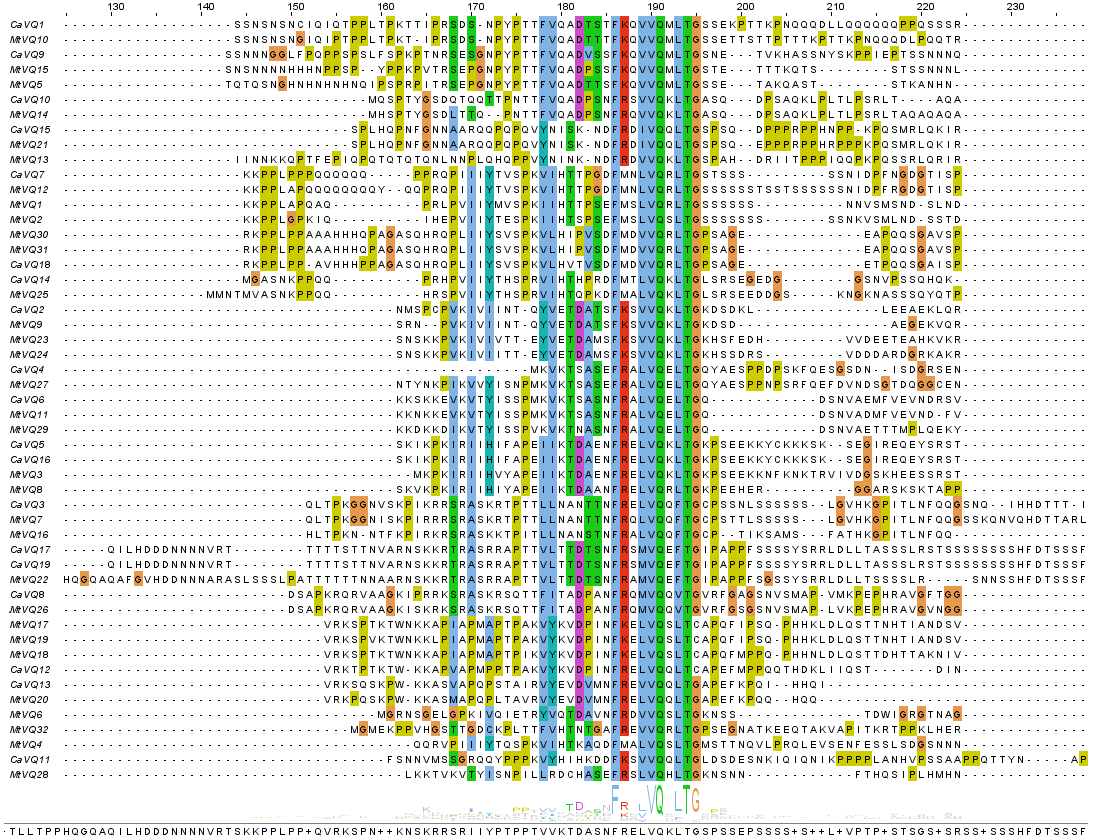
To analyse the sequence characteristics of the CaVQ and MtVQ proteins, we used the MEME tool to predict their conserved motifs (Fig. 2). A total of 20 motifs describing details of CaVQ and MtVQ proteins were predicted and termed motifs 1–20 (Fig. 2B, Fig. S1). Motif 1 contained the VQ domain, which is an essential motif in these proteins. In addition, the VQ proteins in the same group possessed the same conserved motifs, which supported the results of the phylogenetic analysis. For instance, motifs 12 and 16 were especially prominent in Group V, motifs 2 and 9 were observed in Group IV, while motifs 3, 6, and 15 were present only in Groups VIII, IV and III, respectively. Multiple sequence alignment was constructed based on the types of VQ domain proteins (Fig. S2). In this study, four types of VQ motifs, including FxxxVQxLTG (39/51), FxxxVQxFTG (6/51), FxxxVQxLTC (4/51), FxxxVQxVTG (2/57) were identified in CaVQ and MtVQ proteins.
| Gene name | Gene locus | Chromosome location | Length (aa) | pI | Molecular weight (Da) | Family group |
|---|---|---|---|---|---|---|
| CaVQ1 | Ca_00955 | chr1:10979073-10980807 | 249 | 9.1 | 27,619.92 | IV |
| CaVQ2 | Ca_01025 | chr1:12158855-12159148 | 97 | 5.75 | 11,039.64 | I |
| CaVQ3 | Ca_01680 | chr1:26160930-26161682 | 242 | 6.58 | 26,983.87 | VI |
| CaVQ4 | Ca_06894 | chr3:31483218-31483553 | 111 | 4.06 | 12,336.44 | III |
| CaVQ5 | Ca_11582 | chr4:49509075-49509676 | 189 | 8.73 | 21,146.98 | III |
| CaVQ6 | Ca_12232 | chr5:6215916-6216696 | 137 | 5.3 | 15,752.72 | III |
| CaVQ7 | Ca_13983 | chr5:33457054-33457908 | 237 | 9 | 26,258.8 | II |
| CaVQ8 | Ca_15228 | chr6:509649-510383 | 244 | 5.92 | 25,965.88 | VI |
| CaVQ9 | Ca_16724 | chr6:17665023-17665832 | 269 | 9.84 | 29,261.45 | IV |
| CaVQ10 | Ca_17424 | chr6:26291509-26292115 | 189 | 7.99 | 21,123.94 | IV |
| CaVQ11 | Ca_20005 | chr7:18008062-18009111 | 349 | 8.48 | 38,732.05 | VII |
| CaVQ12 | Ca_20836 | chr7:31217857-31218417 | 186 | 9.02 | 21,083.95 | VIII |
| CaVQ13 | Ca_22668 | chr8:5942711-5943082 | 123 | 9.37 | 13,733.34 | VIII |
| CaVQ14 | Ca_23038 | chr8:10629700-10630248 | 182 | 6.64 | 20,155.55 | II |
| CaVQ15 | Ca_23593 | chr8:17315333-17318137 | 322 | 10.66 | 35,254.12 | VII |
| CaVQ16 | Ca_25289 | scaffold02951:10588-11088 | 166 | 8.29 | 18,562.07 | III |
| CaVQ17 | Ca_26110 | scaffold04287:4604-5860 | 418 | 6.54 | 45,765.16 | V |
| CaVQ18 | Ca_28175 | scaffold14608:1146-1814 | 211 | 5.86 | 22,796.72 | II |
| CaVQ19 | Ca_29935 | scaffold24605:2988-4244 | 418 | 6.54 | 45,765.16 | V |
| MtVQ1 | Medtr1g028910 | chr1:9847443-9848042 | 199 | 8.89 | 22,189.14 | II |
| MtVQ2 | Medtr1g028920 | chr1:9855883-9856191 | 102 | 9.7 | 11,217.65 | II |
| MtVQ3 | Medtr1g054055 | chr1:23040618-23041237 | 151 | 5.83 | 16,905.05 | III |
| MtVQ4 | Medtr1g110570 | chr1:49891664-49892623 | 190 | 6.51 | 21,216.83 | II |
| MtVQ5 | Medtr2g013950 | chr2:3839731-3840815 | 264 | 10.18 | 28,841.89 | IV |
| MtVQ6 | Medtr2g019320 | chr2:6269503-6270082 | 109 | 5.09 | 11,918.66 | I |
| MtVQ7 | Medtr2g035850 | chr2:15214004-15215247 | 237 | 8.69 | 26,603.44 | VI |
| MtVQ8 | Medtr2g061720 | chr2:26182404-26183236 | 157 | 8.73 | 17,727.09 | III |
| MtVQ9 | Medtr2g070550 | chr2:29736749-29737159 | 82 | 4.95 | 9250.43 | I |
| MtVQ10 | Medtr2g079120 | chr2:33154057-33155261 | 246 | 9.21 | 27,339.5 | IV |
| MtVQ11 | Medtr3g013980 | chr3:3851224-3851618 | 128 | 5.09 | 14,727.48 | III |
| MtVQ12 | Medtr3g090350 | chr3:41104477-41105804 | 248 | 9.3 | 27,225.67 | II |
| MtVQ13 | Medtr3g099400 | chr3:45563608-45565108 | 310 | 9.54 | 34,283.62 | VII |
| MtVQ14 | Medtr4g009950 | chr4:2137715-2138666 | 180 | 9.36 | 20,196.77 | IV |
| MtVQ15 | Medtr4g088695 | chr4:35302060-35303299 | 244 | 10.13 | 26,801.96 | IV |
| MtVQ16 | Medtr4g094698 | chr4:38752751-38753724 | 167 | 9.26 | 18,856.41 | VI |
| MtVQ17 | Medtr4g097280 | chr4:40092375-40093365 | 191 | 8.42 | 21,569.32 | VIII |
| MtVQ18 | Medtr4g097350 | chr4:40121292-40122380 | 191 | 9.22 | 21,691.77 | VIII |
| MtVQ19 | Medtr4g097360 | chr4:40124928-40125519 | 188 | 8.6 | 21,311.24 | VIII |
| MtVQ20 | Medtr5g015190 | chr5:5227392-5228070 | 116 | 9.57 | 13,004.54 | VIII |
| MtVQ21 | Medtr5g030570 | chr5:12954070-12958319 | 321 | 10.68 | 35,263.31 | VII |
| MtVQ22 | Medtr5g063310 | chr5:26256801-26258739 | 419 | 6.45 | 44,940.2 | V |
| MtVQ23 | Medtr6g041990 | chr6:14496963-14497256 | 97 | 5.88 | 11,037.38 | I |
| MtVQ24 | Medtr6g042010 | chr6:14504568-14504918 | 113 | 5.55 | 12,706.14 | I |
| MtVQ25 | Medtr6g084200 | chr6:31464916-31465653 | 245 | 7.05 | 26,998.07 | II |
| MtVQ26 | Medtr7g088620 | chr7:34541954-34543335 | 235 | 6.91 | 25,107.02 | VI |
| MtVQ27 | Medtr7g089860 | chr7:35219206-35219959 | 165 | 4.48 | 18,179.14 | III |
| MtVQ28 | Medtr7g115420 | chr7:47688748-47689116 | 122 | 8.56 | 13,953.87 | III |
| MtVQ29 | Medtr8g040080 | chr8:14917344-14917700 | 118 | 7.78 | 13,701.43 | III |
| MtVQ30 | Medtr8g093335 | chr8:38970208-38971355 | 214 | 5.84 | 23,180.18 | II |
| MtVQ31 | Medtr8g093390 | chr8:39001408-39002292 | 214 | 5.84 | 23,180.18 | II |
| MtVQ32 | Medtr8g095470 | chr8:39955693-39958827 | 192 | 9.56 | 21,094.07 | IV |
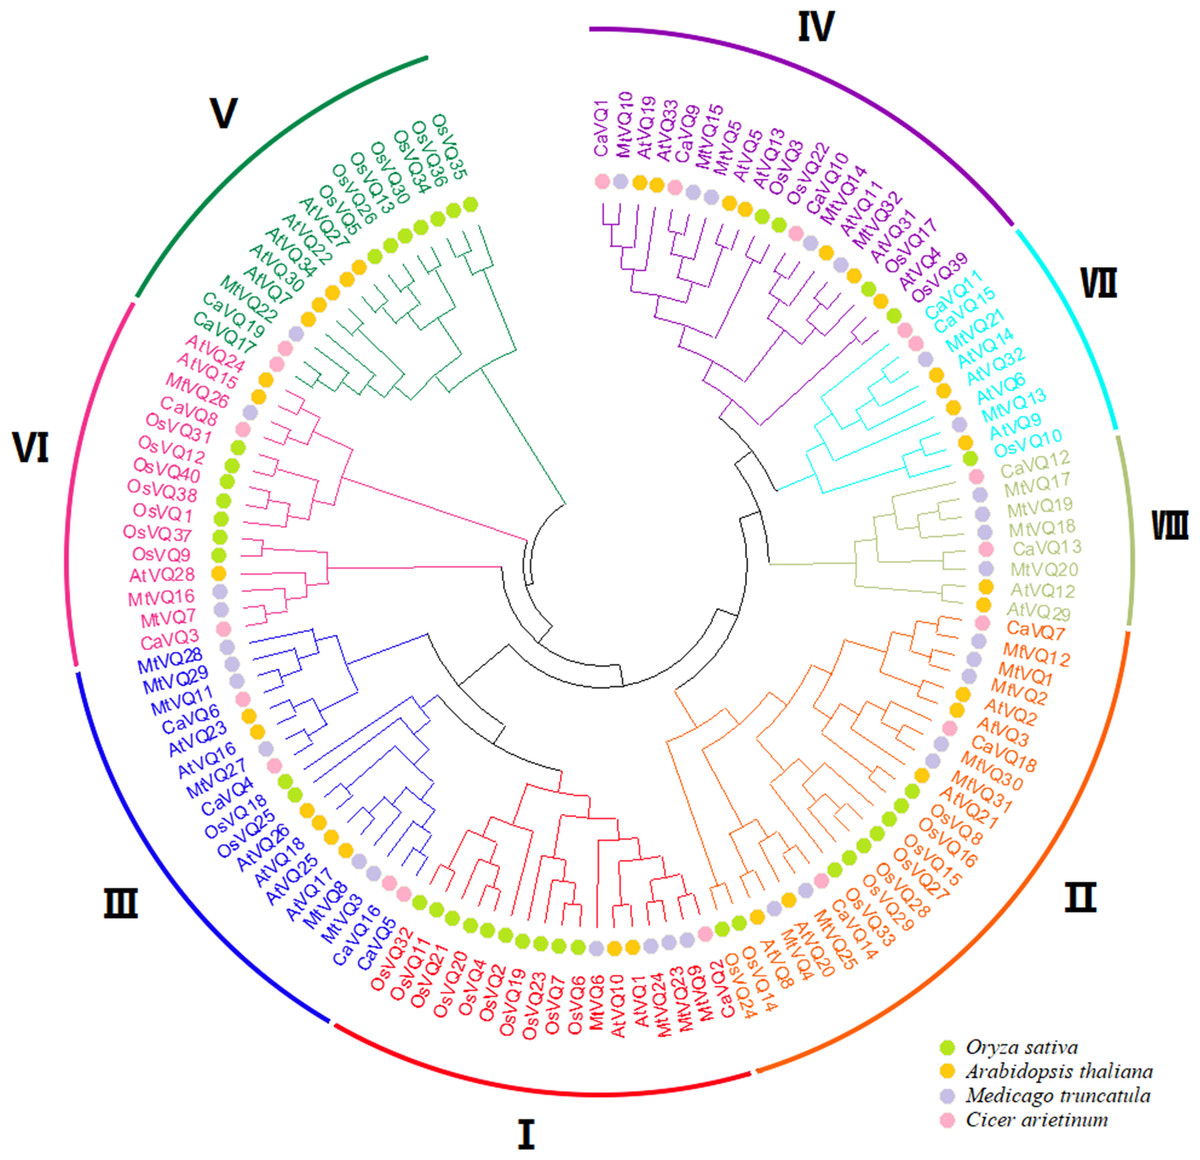
Figure 1: Phylogenetic tree analysis of the VQ genes in Cicer arietinum, Medicago truncatula, Glycine max, Phaseolus vulgaris, Arabidopsis thaliana and Oryza sativa.
The clusters were designated as group I–VII and indicated in a specific color. Different colored circles represent different species.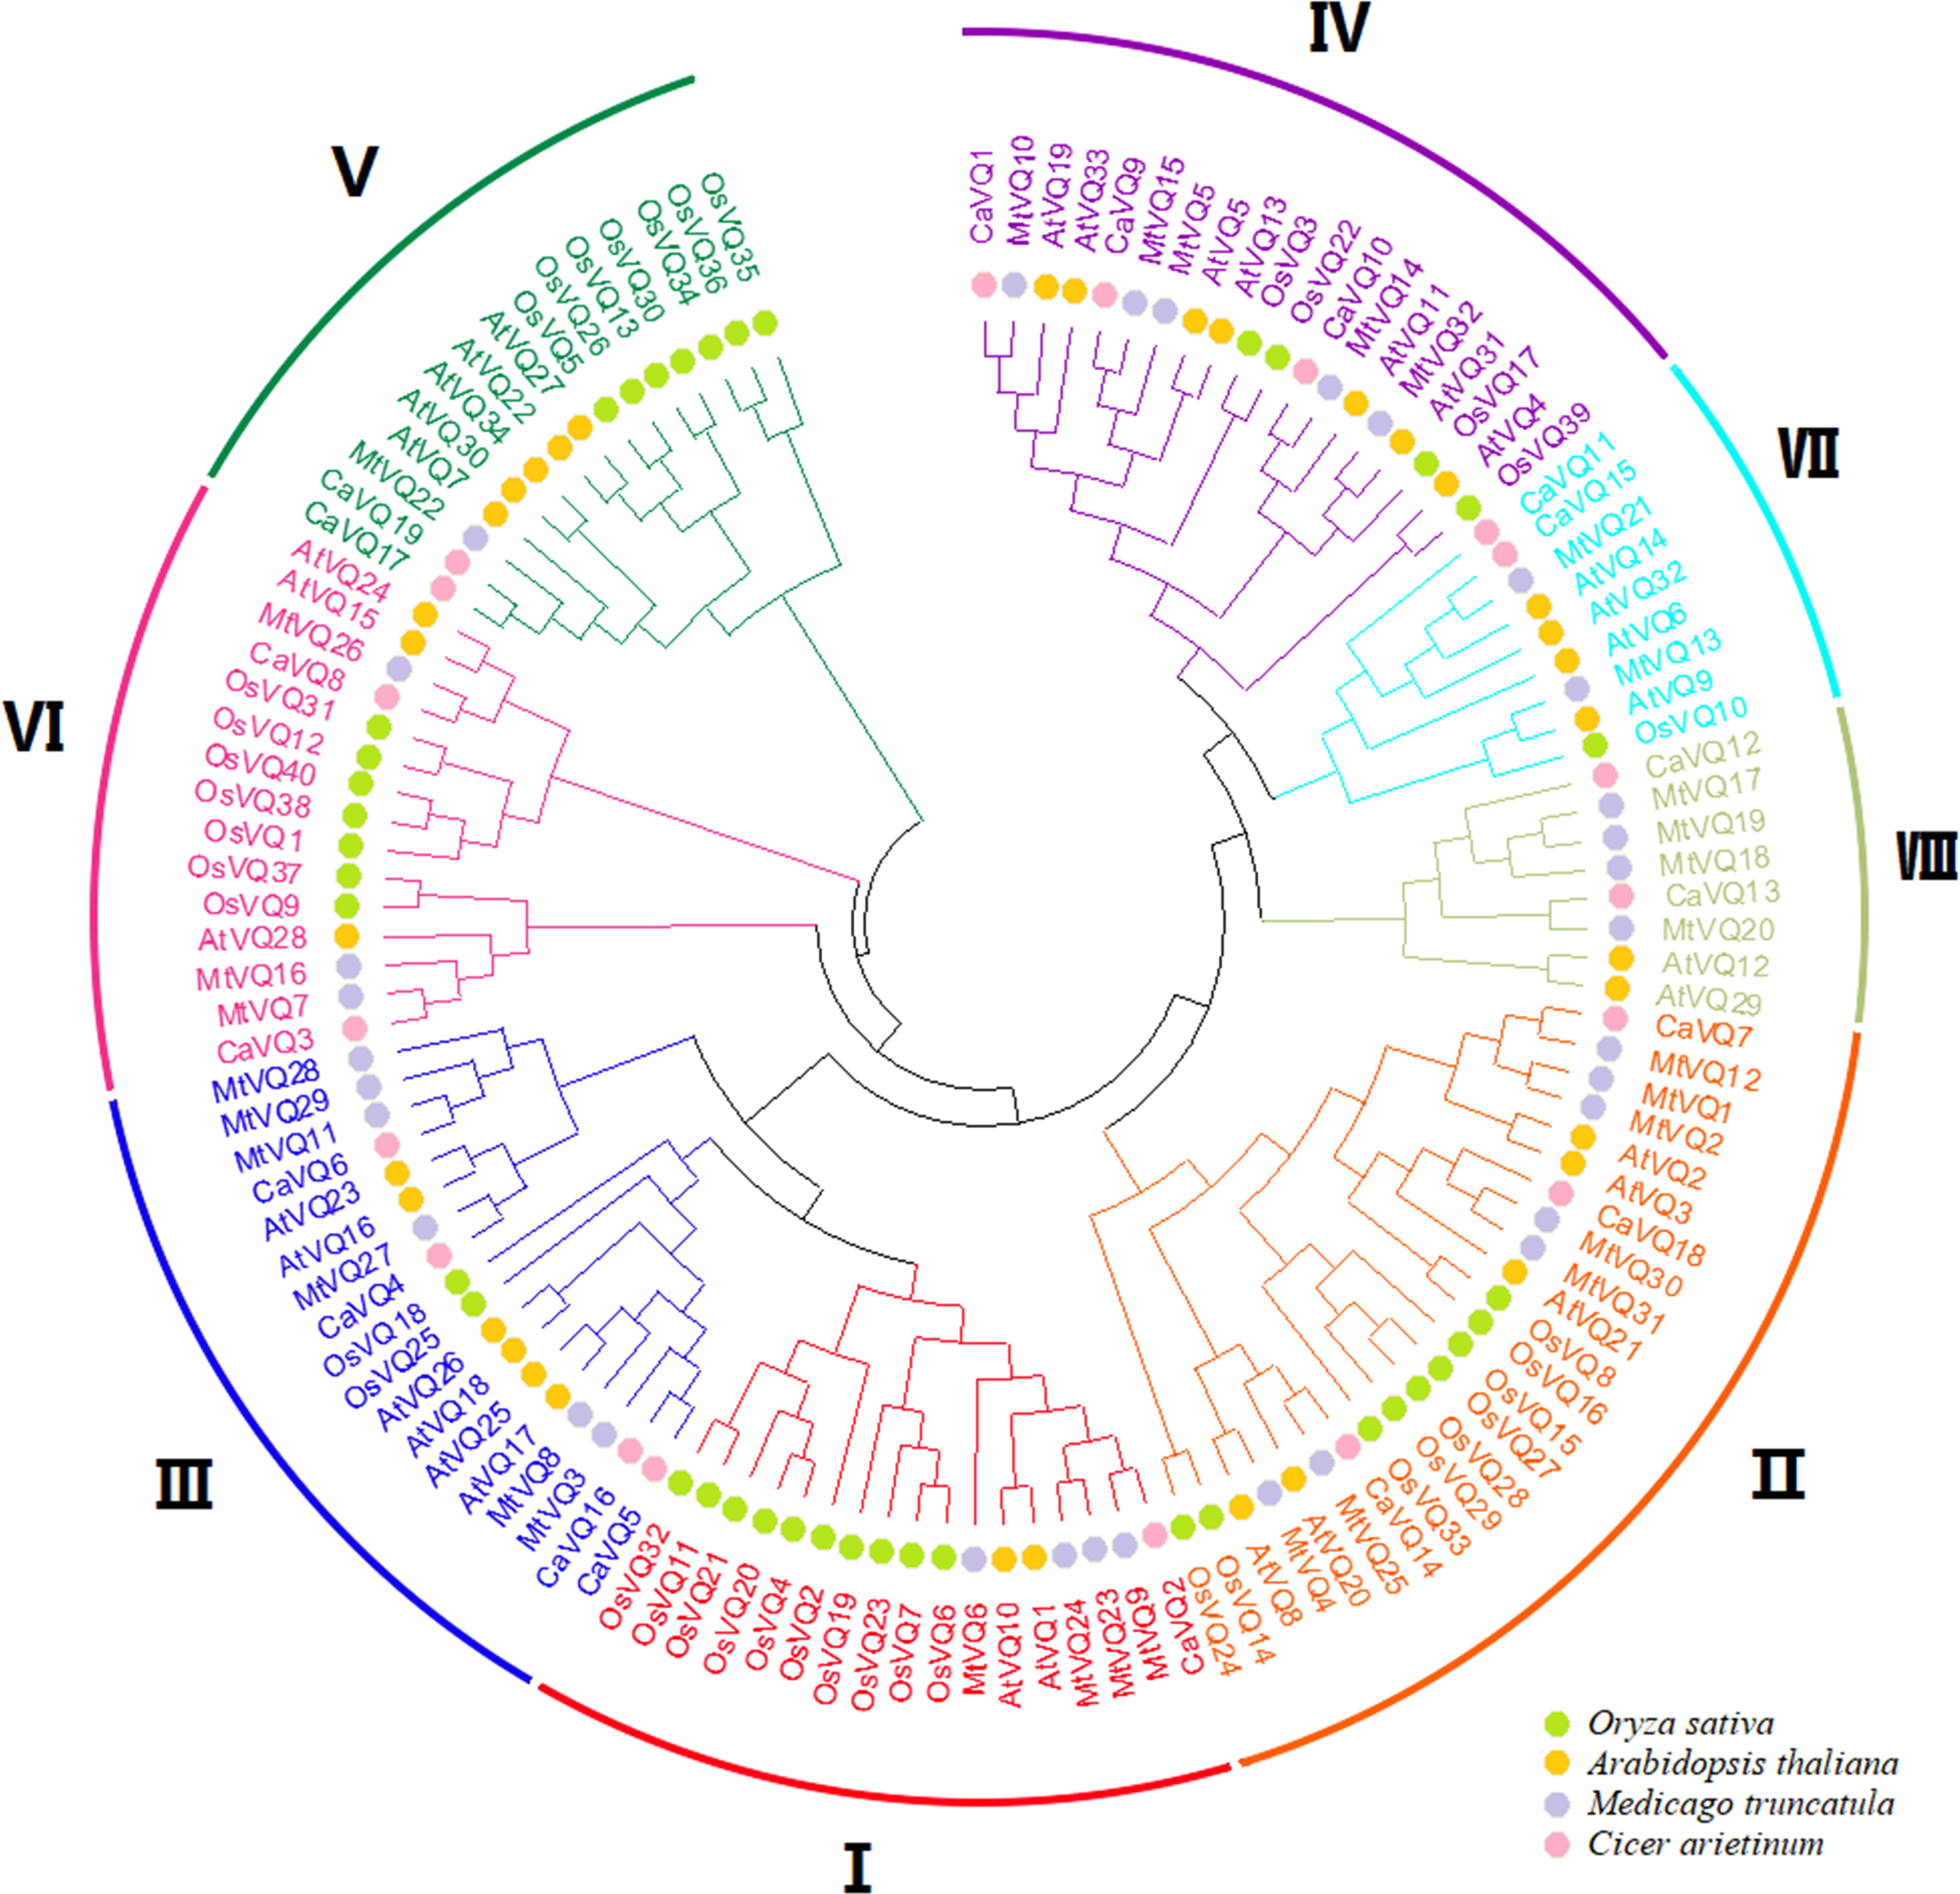
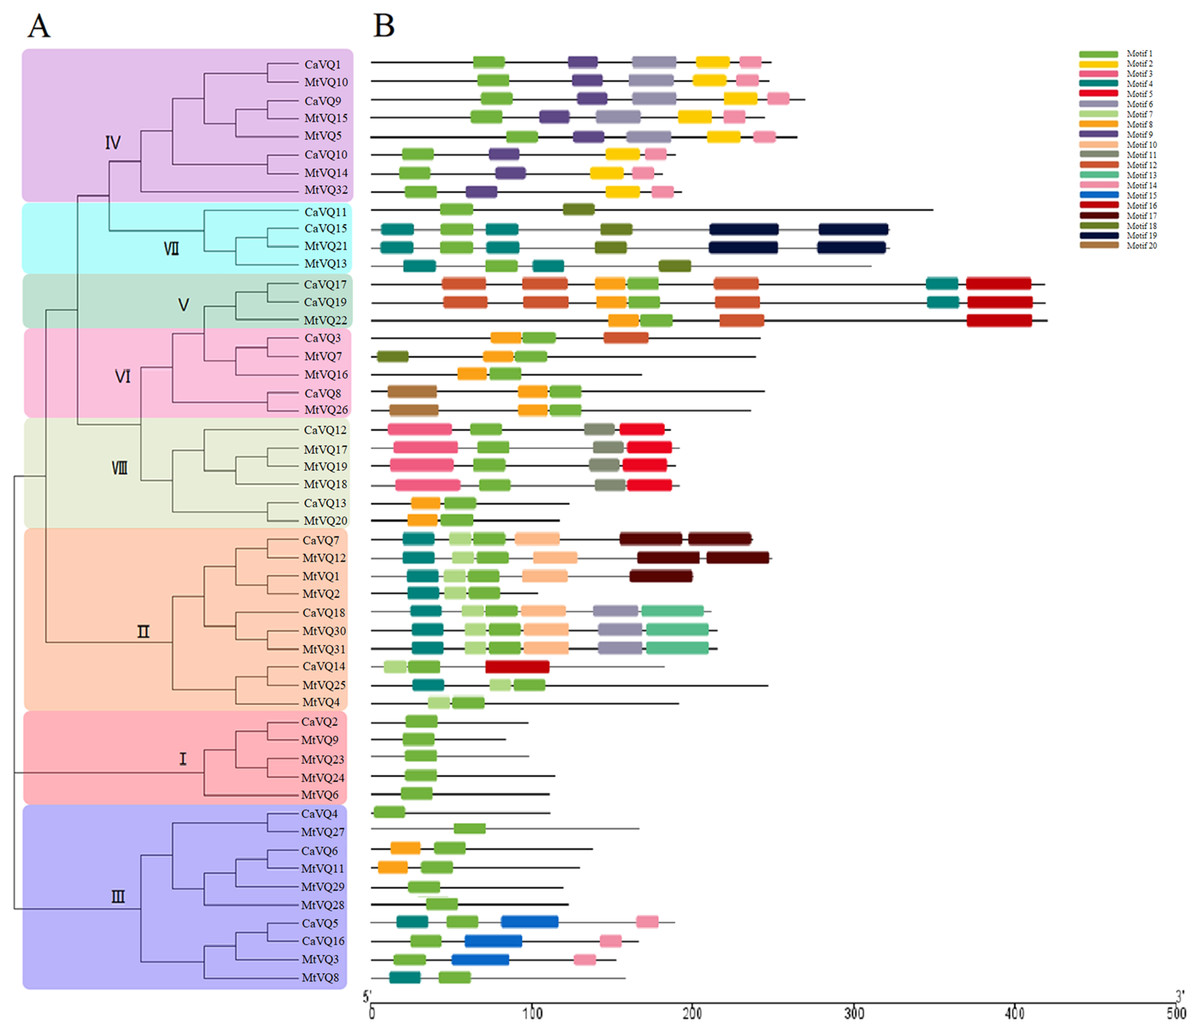
Figure 2: Phylogenetic tree, conserved motifs and gene structure in CaVQs and MtVQs.
(A) Phylogenetic relationships (B) Conserved motifs of the VQ proteins. Each motif is represented by a number in colored box.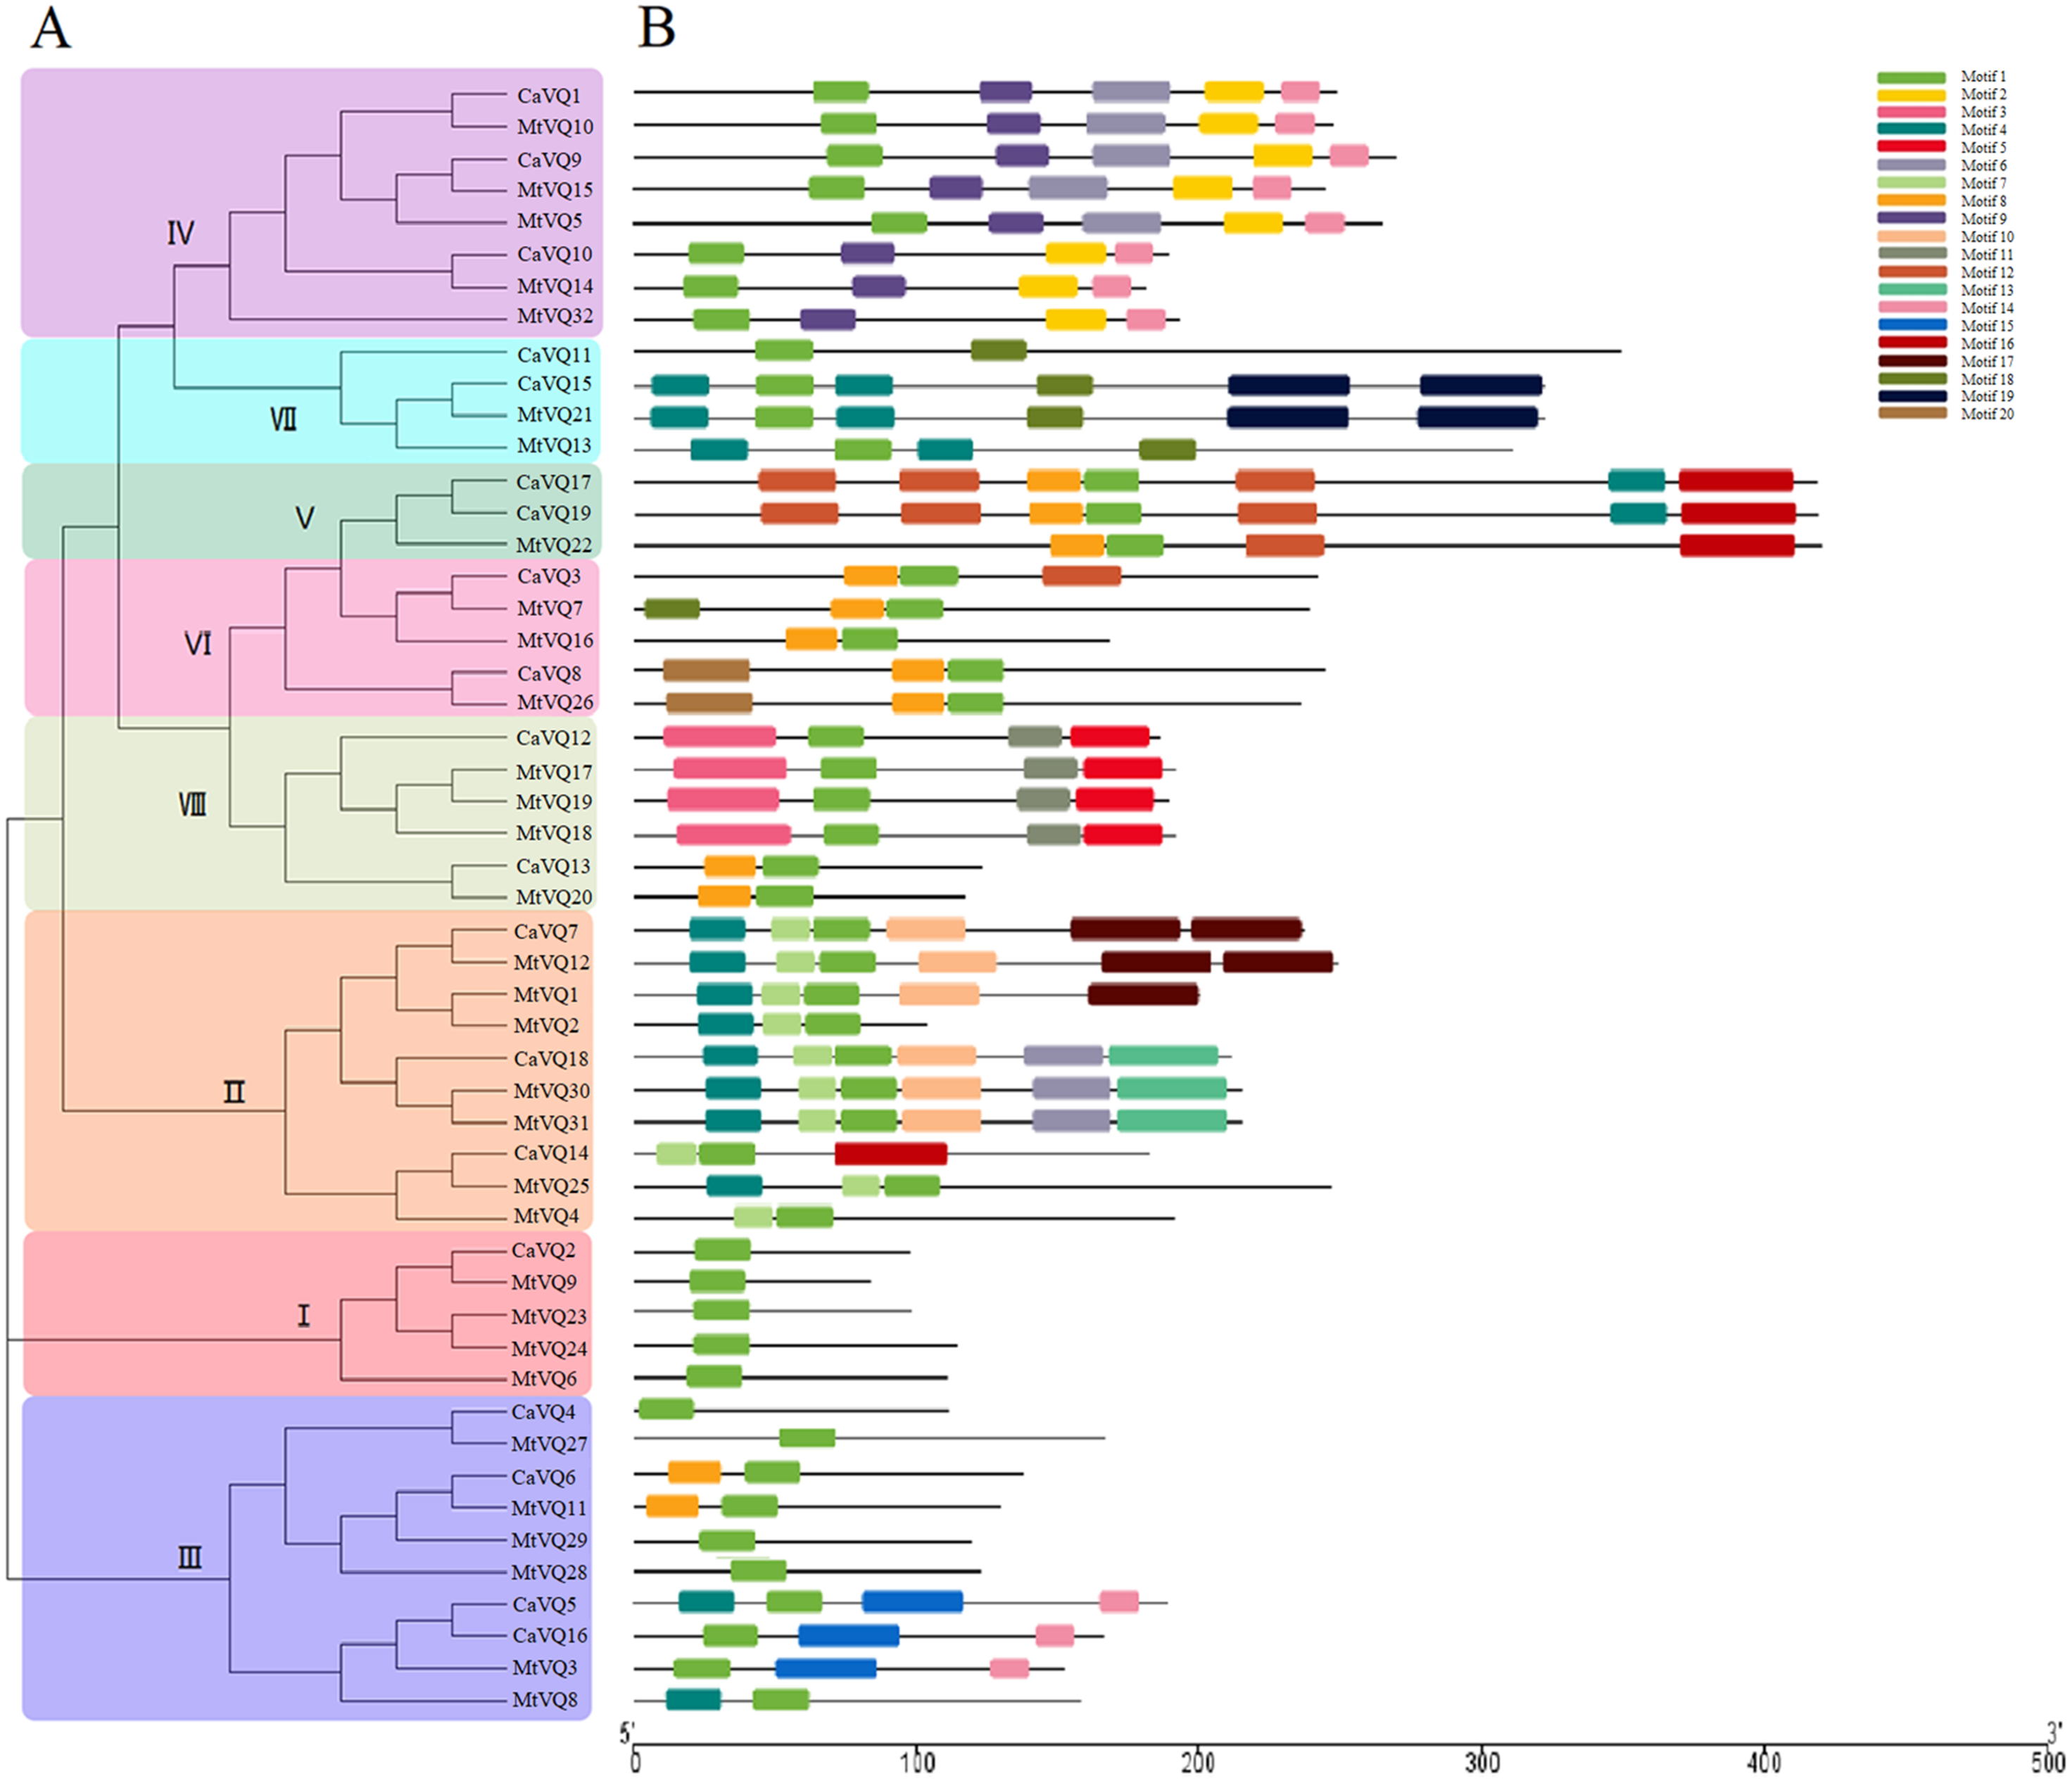
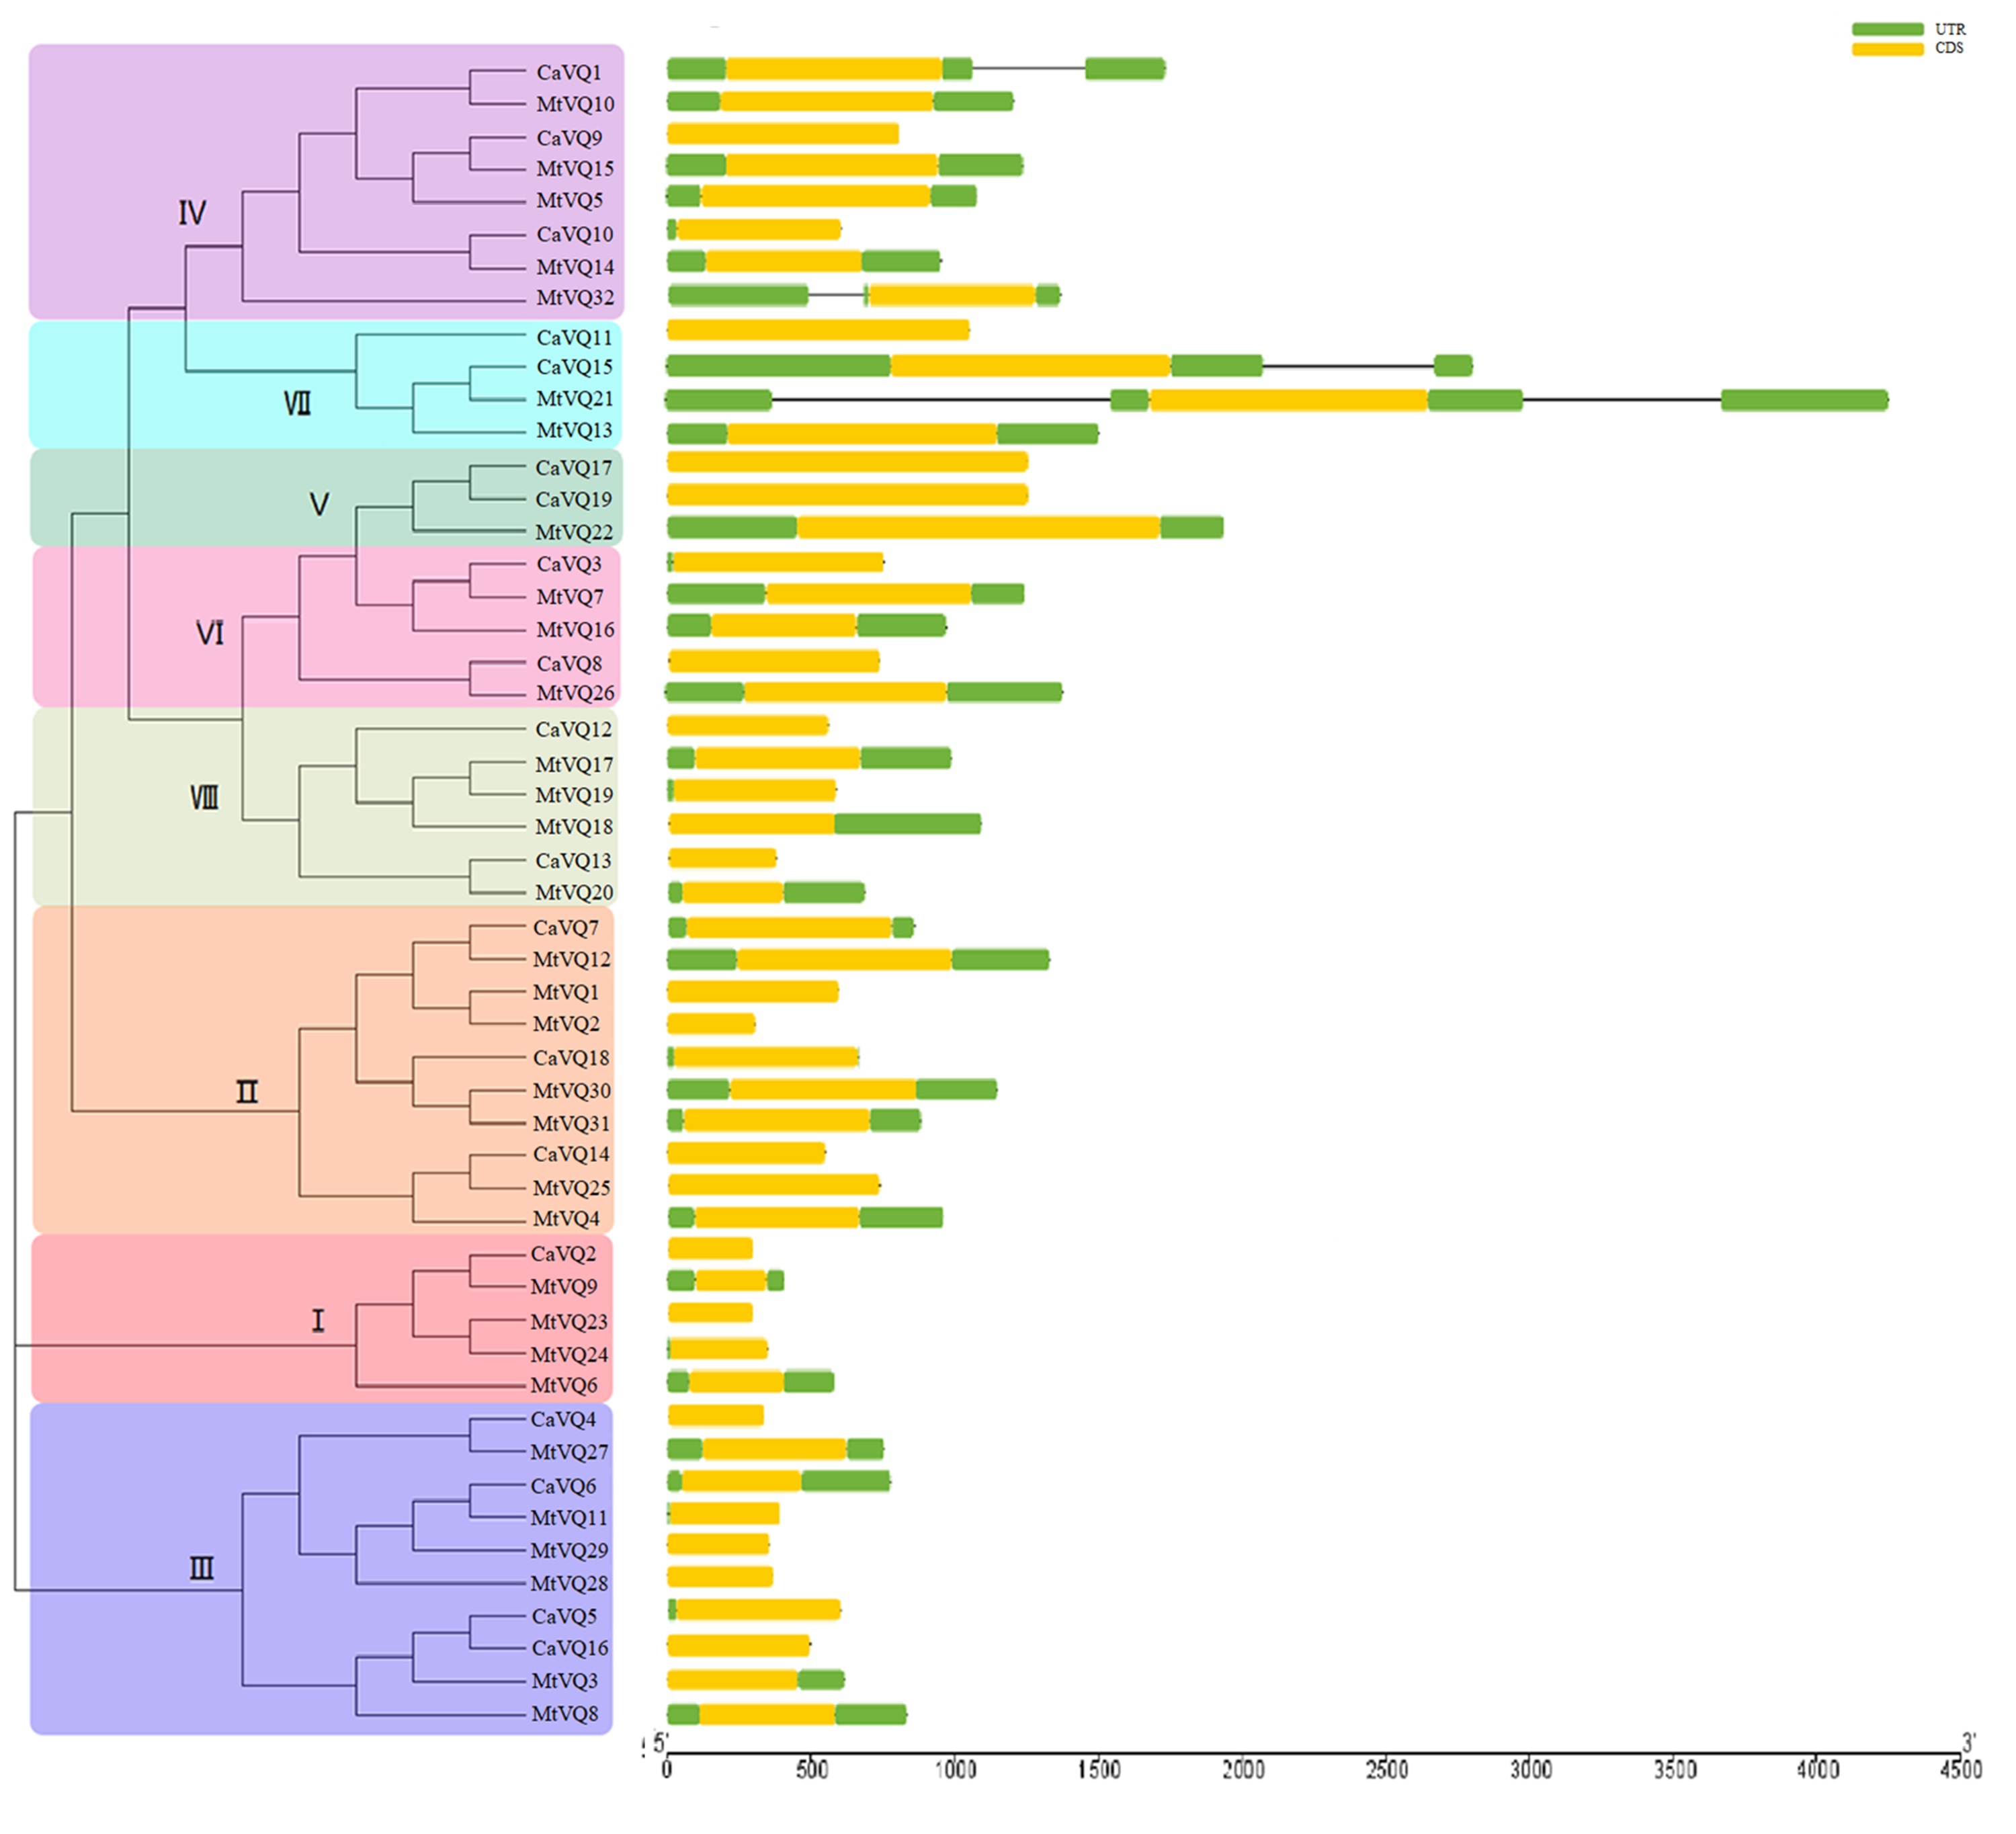
We created exon/intron organizational maps based on the coding sequences of each CaVQ and MtVQ gene (Fig. S3) and found that only 4 VQ genes (CaVQ1, CaVQ15, MtVQ21 and MtVQ32) had introns. Among them, two VQ genes belonged to Group VII. The majority of VQ genes in C. arietinum and M. truncatula lacked introns. Furthermore, Group V members had longer coding regions than the others, and Group I members had shorter coding regions than the others.
Chromosomal locations and gene duplication
The locations of the VQ genes revealed that they were unevenly distributed on their corresponding chromosomes (Table 1, Figs. 3 and 4). VQ genes were identified in 7 of 8 C. arietinum chromosomes and in all M. truncatula chromosomes. In C. arietinum, four genes (CaVQ16, CaVQ17, CaVQ18 and CaVQ19) could not be mapped on any chromosome. In M. truncatula, there were four gene clusters (MtVQ1-MtVQ2, MtVQ17-MtVQ18-MtVQ19, MtVQ23-MtVQ24 and MtVQ30-MtVQ31) located on chromosomes 1, 4, 6 and 8, respectively.
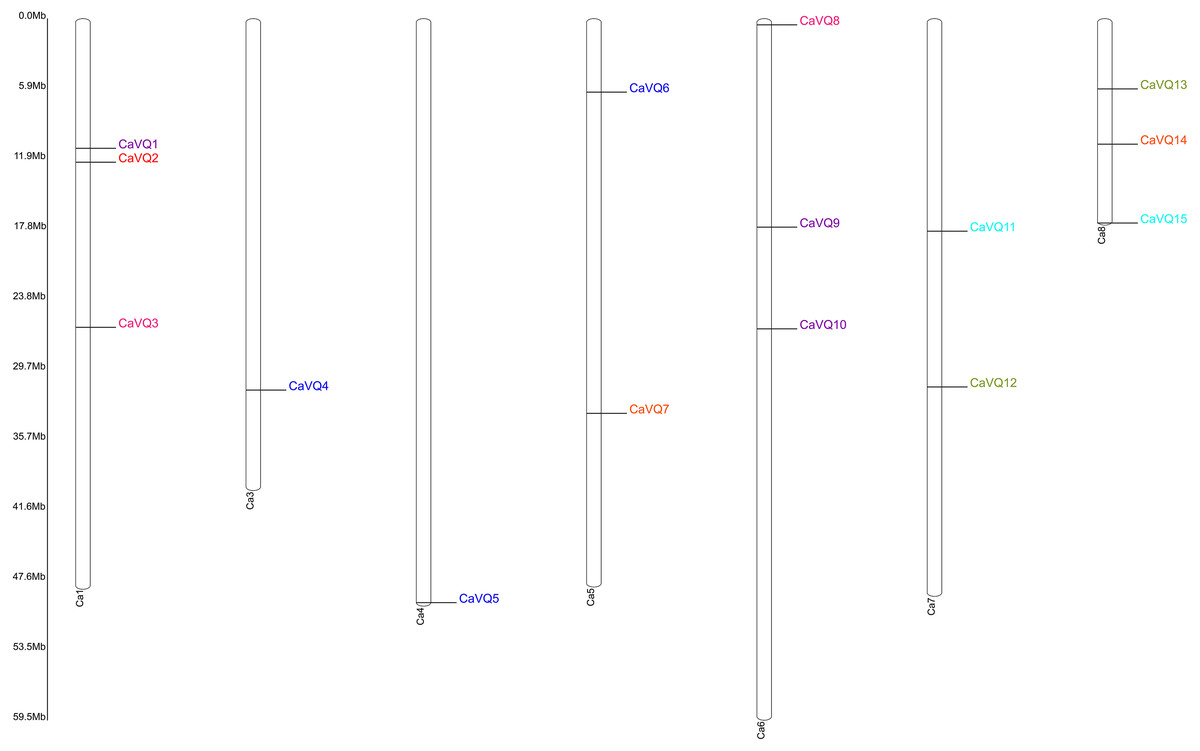
Figure 3: Chromosome location of CaVQ genes in Cicer arietinum.
Genes of different groups are expressed in different colors.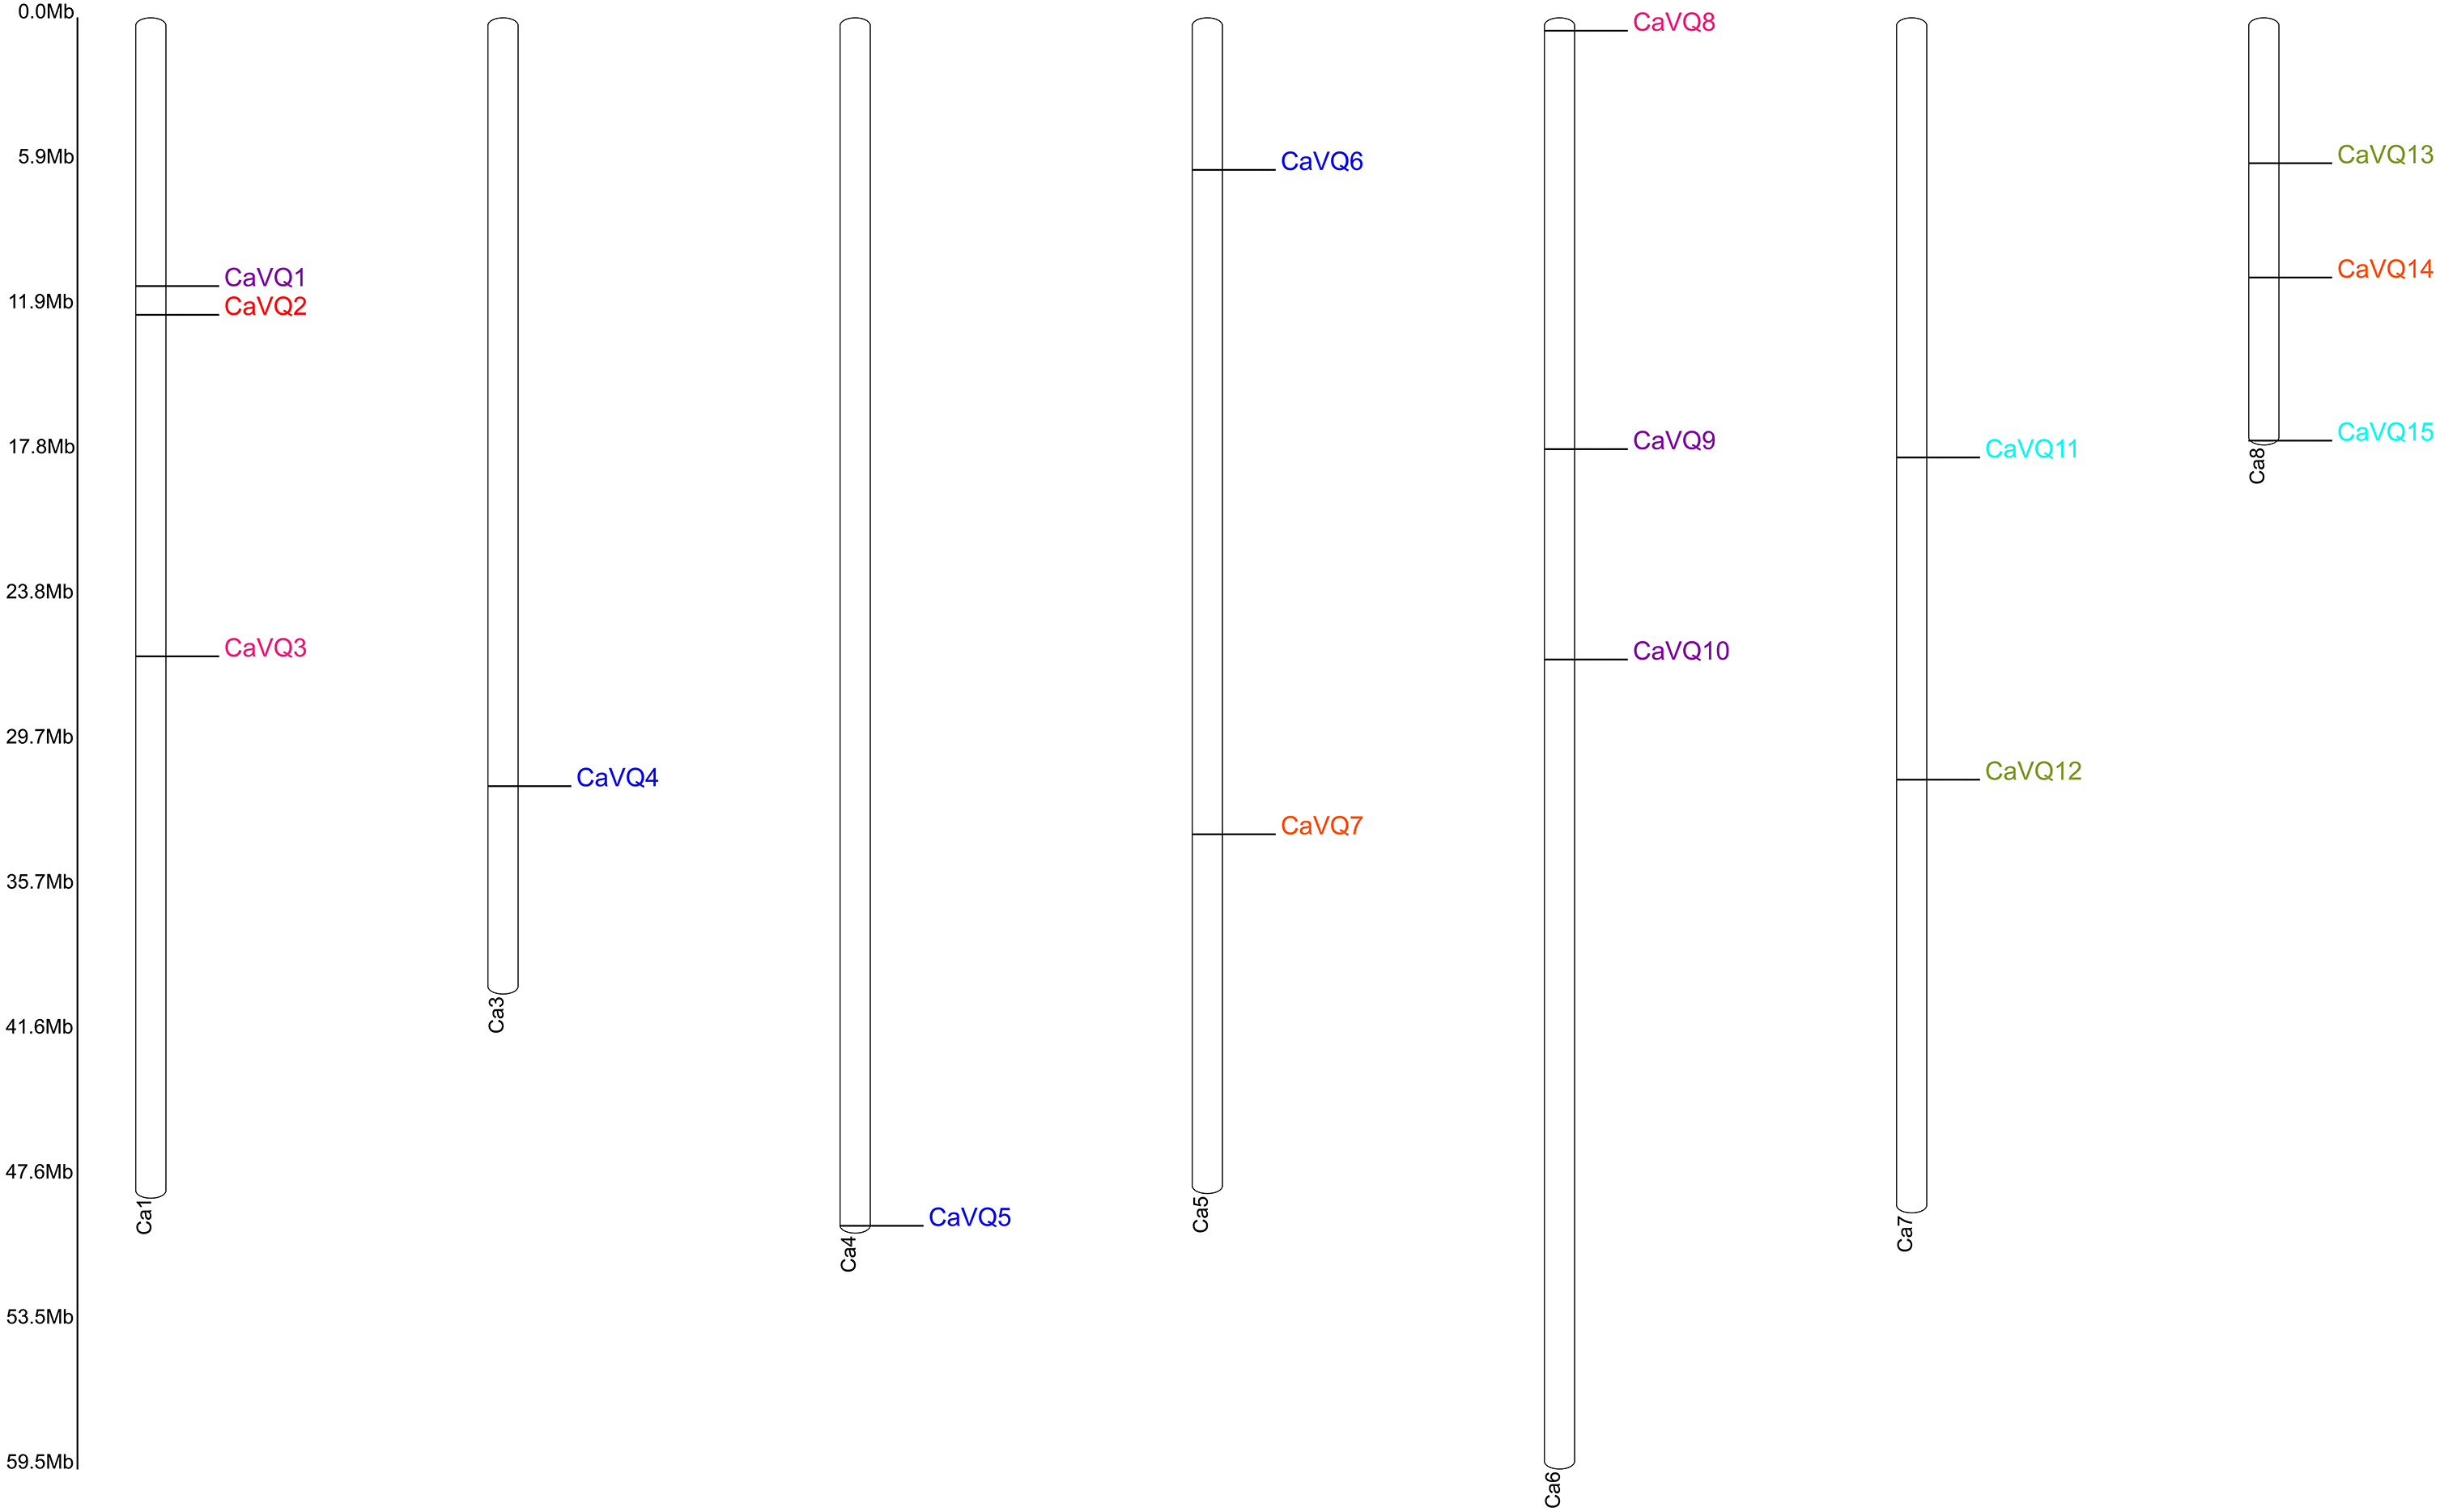
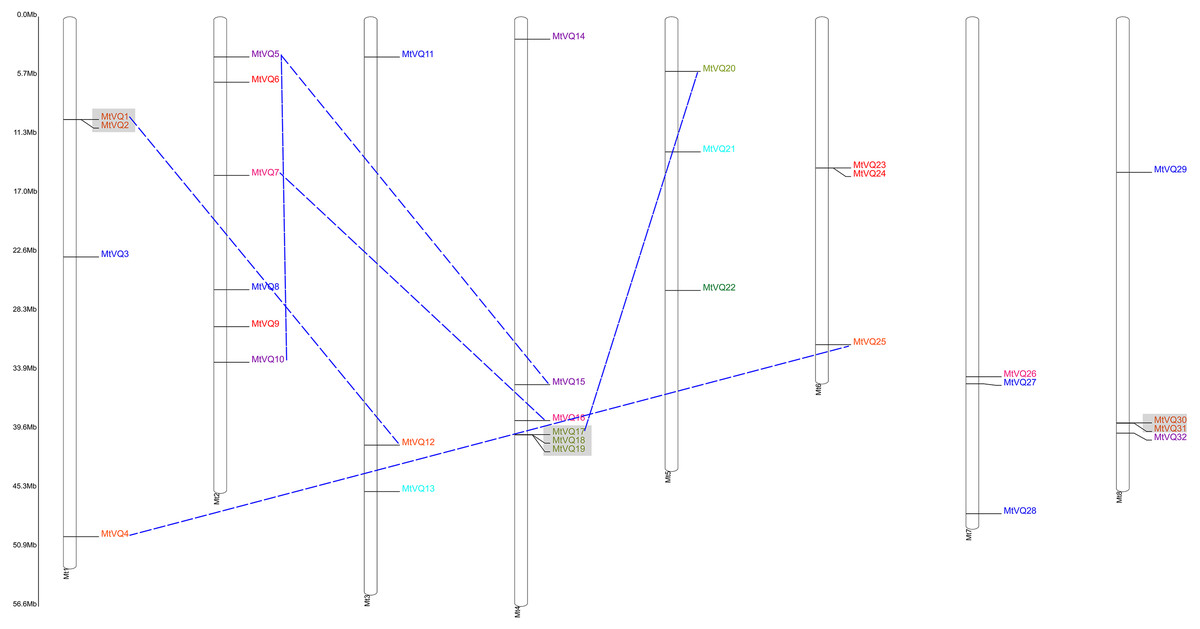
Figure 4: Chromosome location and duplication events analysis of MtVQ genes in Medicago truncatula.
Genes of different groups are expressed in different colors. Gray boxes showed tandem duplication events and blue dashed lines showed fragment duplication events.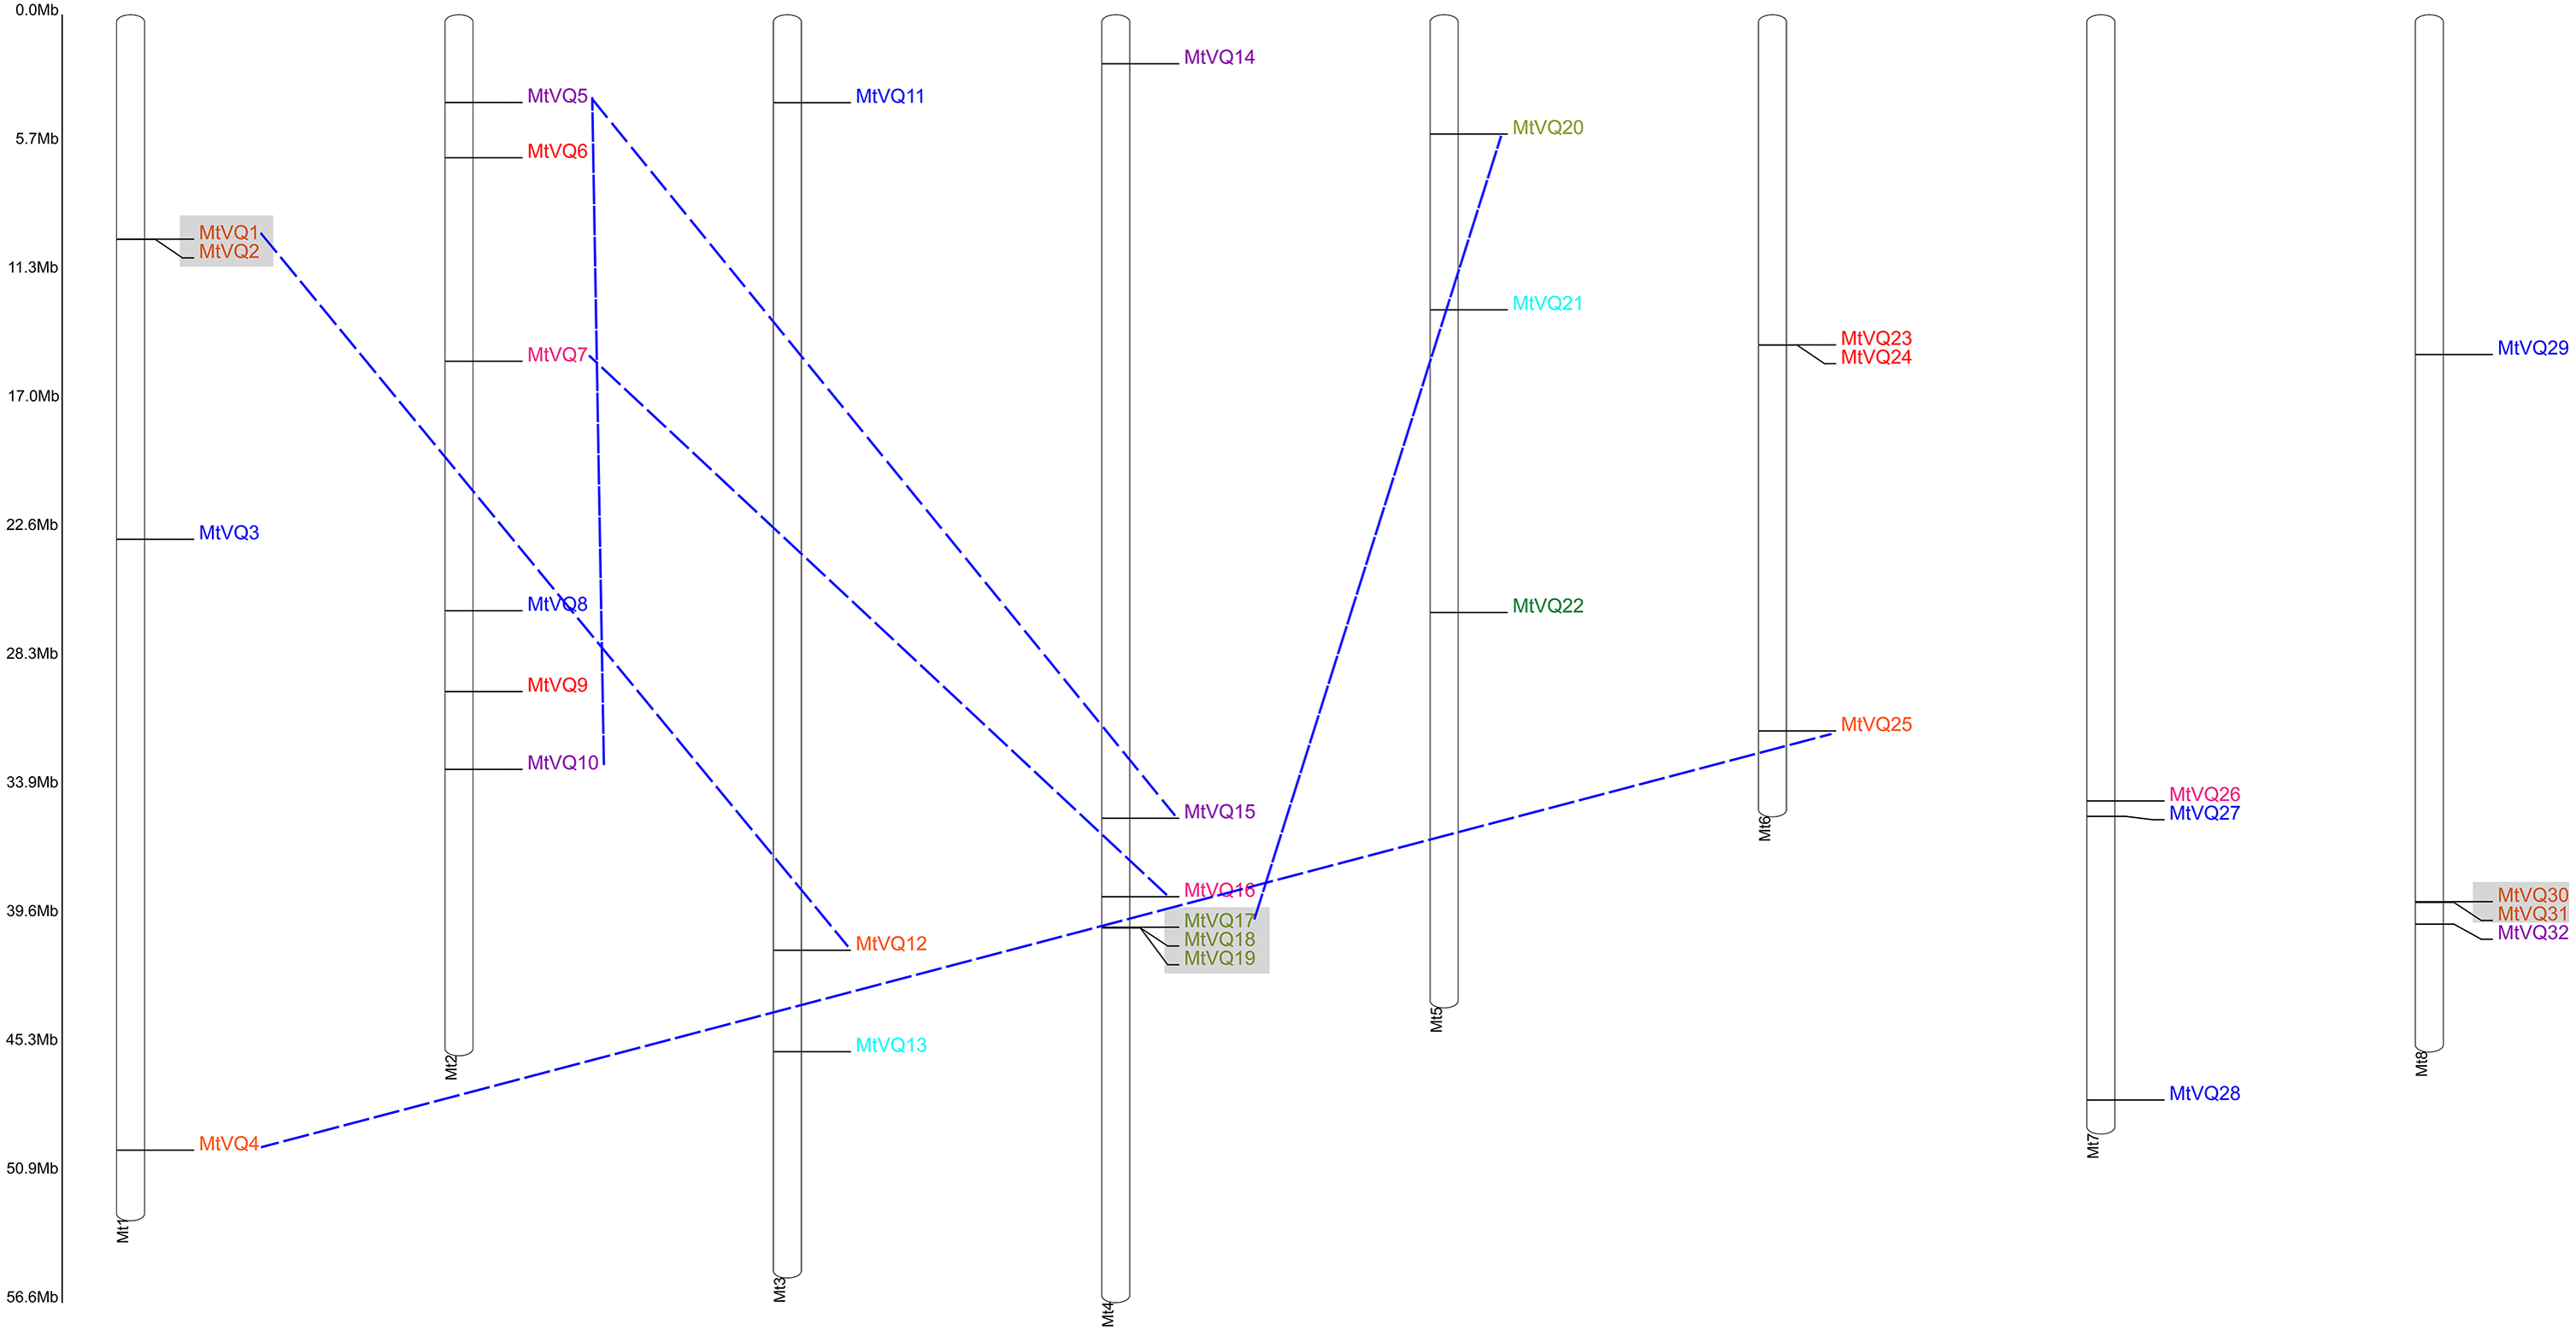
The gene duplication analysis (Figs. 3 and 4) revealed that there were 4 and 6 gene pairs originating in tandem duplication and segment duplication events in M. truncatula; however, there was no gene duplication event in C. arietinum. Three gene clusters were formed by tandem duplication located on chromosomes 1, 4, and 8 in M. truncatula.
Synteny analysis of VQ genes
We analysed collinearity diagrams between the VQ genes in C. arietinum, M. truncatula, and other model plants, such as A. thaliana, O. sativa and G. max (Fig. 5). We found that the VQ genes in C. arietinum had the most homologous gene pairs with VQ genes in G. max (37), followed by A. thaliana (8) (Figs. 5A–5C). Similarly, the VQ genes in M. truncatula had the most homologous gene pairs with VQ genes in G. max (87), followed by A. thaliana (23) and O. sativa (2) (Figs. 5D–5E). However, no homologous gene pairs were observed between C. arietinum and O. sativa (Fig. 5F). Ten homologous gene pairs were observed between the CaVQ and MtVQ genes (Fig. 5G). In addition, one VQ gene in C. arietinum and M. truncatula matched more than one VQ gene in other plants.
Ka/Ks of VQ genes
To better understand the selection pressure acting on paralogous MtVQ gene pairs and orthologous VQ gene pairs between C. arietinum and M. truncatula, we calculated their Ka/Ks substitution ratios (Table 2). Our results suggest that the Ka/Ks values of most gene pairs were <1; the Ka/Ks value of only one gene pair (MtVQ19/MtVQ17) was >1, indicating that they had primarily evolved under purifying selection. We also found that the differentiation time of VQ genes in C. arietinum and M. truncatula was between 110 and 190 MYA and that the differentiation time of paralogous VQ gene pairs in M. truncatula was primarily between 3 and 11 MYA.
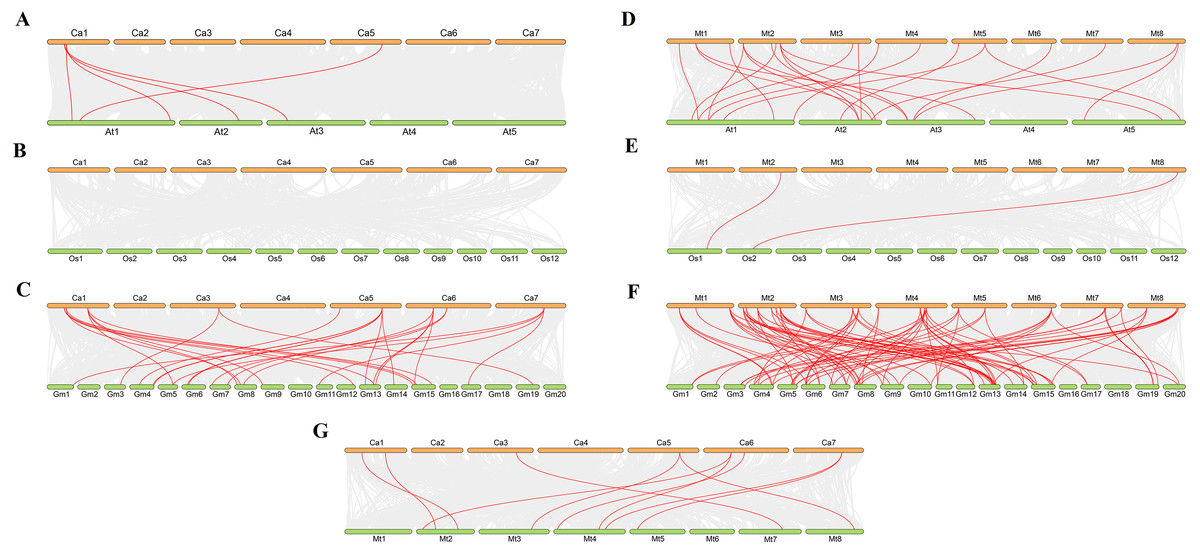
Figure 5: Synteny analysis of VQ genes between Cicer arietinum, Medicago truncatula and plant species.
Synteny analysis of the VQ genes between (A) Cicer arietinum and Arabidopsis thaliana; (B) Cicer arietinum and Oryza sativa; (C) Cicer arietinum and Glycine max; (D) Medicago truncatula and Arabidopsis thaliana; (E) Medicago truncatula and Oryza sativa; (F) Medicago truncatula and Glycine max; (G) Cicer arietinum and Medicago truncatula. Gray lines in the background indicate the collinear blocks within the Cicer arietinum or Medicago truncatula and other plant genomes, while the red lines highlight the syntenic VQ gene pairs.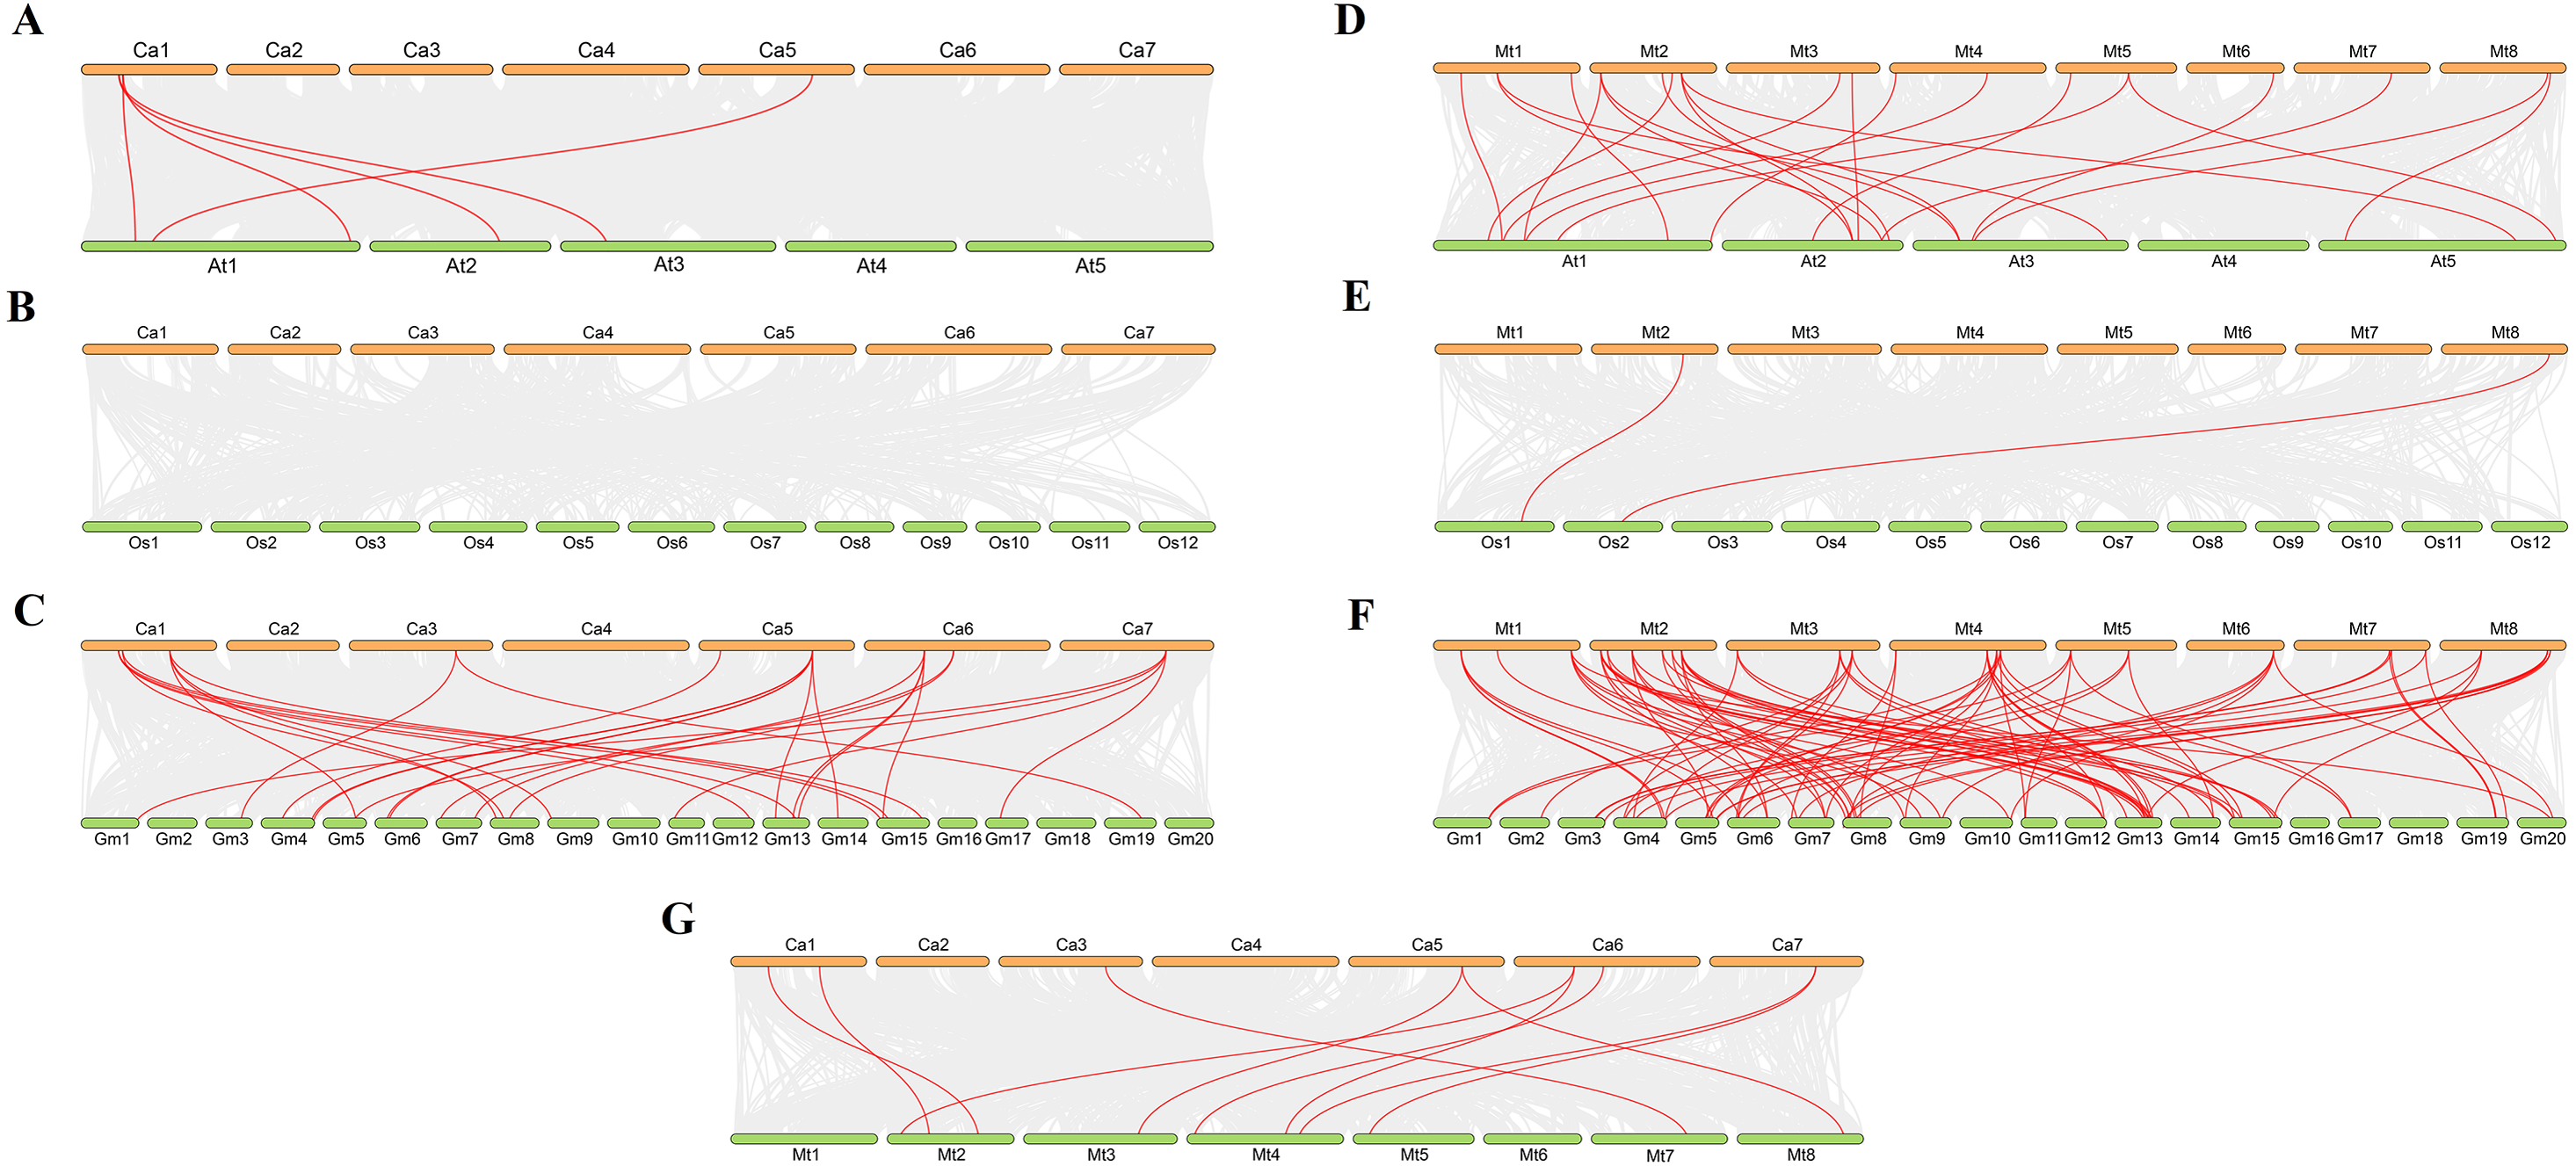
| Gene 1 | Gene 2 | Ka | Ks | Ka/Ks | Differentiation time |
|---|---|---|---|---|---|
| MtVQ8 | MtVQ3 | 0.506 | 3.245 | 0.156 | 265.963 |
| MtVQ15 | MtVQ5 | 0.271 | 0.815 | 0.333 | 66.820 |
| MtVQ17 | MtVQ18 | 0.072 | 0.109 | 0.658 | 8.933 |
| MtVQ18 | MtVQ19 | 0.108 | 0.134 | 0.808 | 10.982 |
| MtVQ19 | MtVQ17 | 0.053 | 0.045 | 1.198 | 3.651 |
| MtVQ24 | MtVQ23 | 0.198 | 0.275 | 0.721 | 22.517 |
| MtVQ3 | CaVQ5 | 0.915 | 1.380 | 0.664 | 113.082 |
| MtVQ5 | CaVQ9 | 1.278 | 2.104 | 0.607 | 172.465 |
| MtVQ7 | CaVQ3 | 1.099 | 2.227 | 0.493 | 182.560 |
| MtVQ9 | CaVQ2 | 0.960 | 2.165 | 0.443 | 177.493 |
| MtVQ10 | CaVQ1 | 1.585 | 2.299 | 0.689 | 188.451 |
| MtVQ11 | CaVQ6 | 0.900 | 1.379 | 0.653 | 113.072 |
| MtVQ12 | CaVQ7 | 0.939 | 1.607 | 0.584 | 131.760 |
| MtVQ15 | CaVQ9 | 1.368 | 1.706 | 0.802 | 139.867 |
| MtVQ25 | CaVQ14 | 1.289 | 2.504 | 0.515 | 205.213 |
| MtVQ26 | CaVQ8 | 1.132 | 1.837 | 0.616 | 150.581 |
| MtVQ27 | CaVQ4 | 1.314 | 2.717 | 0.484 | 222.709 |
Cis-element analysis of VQ genes
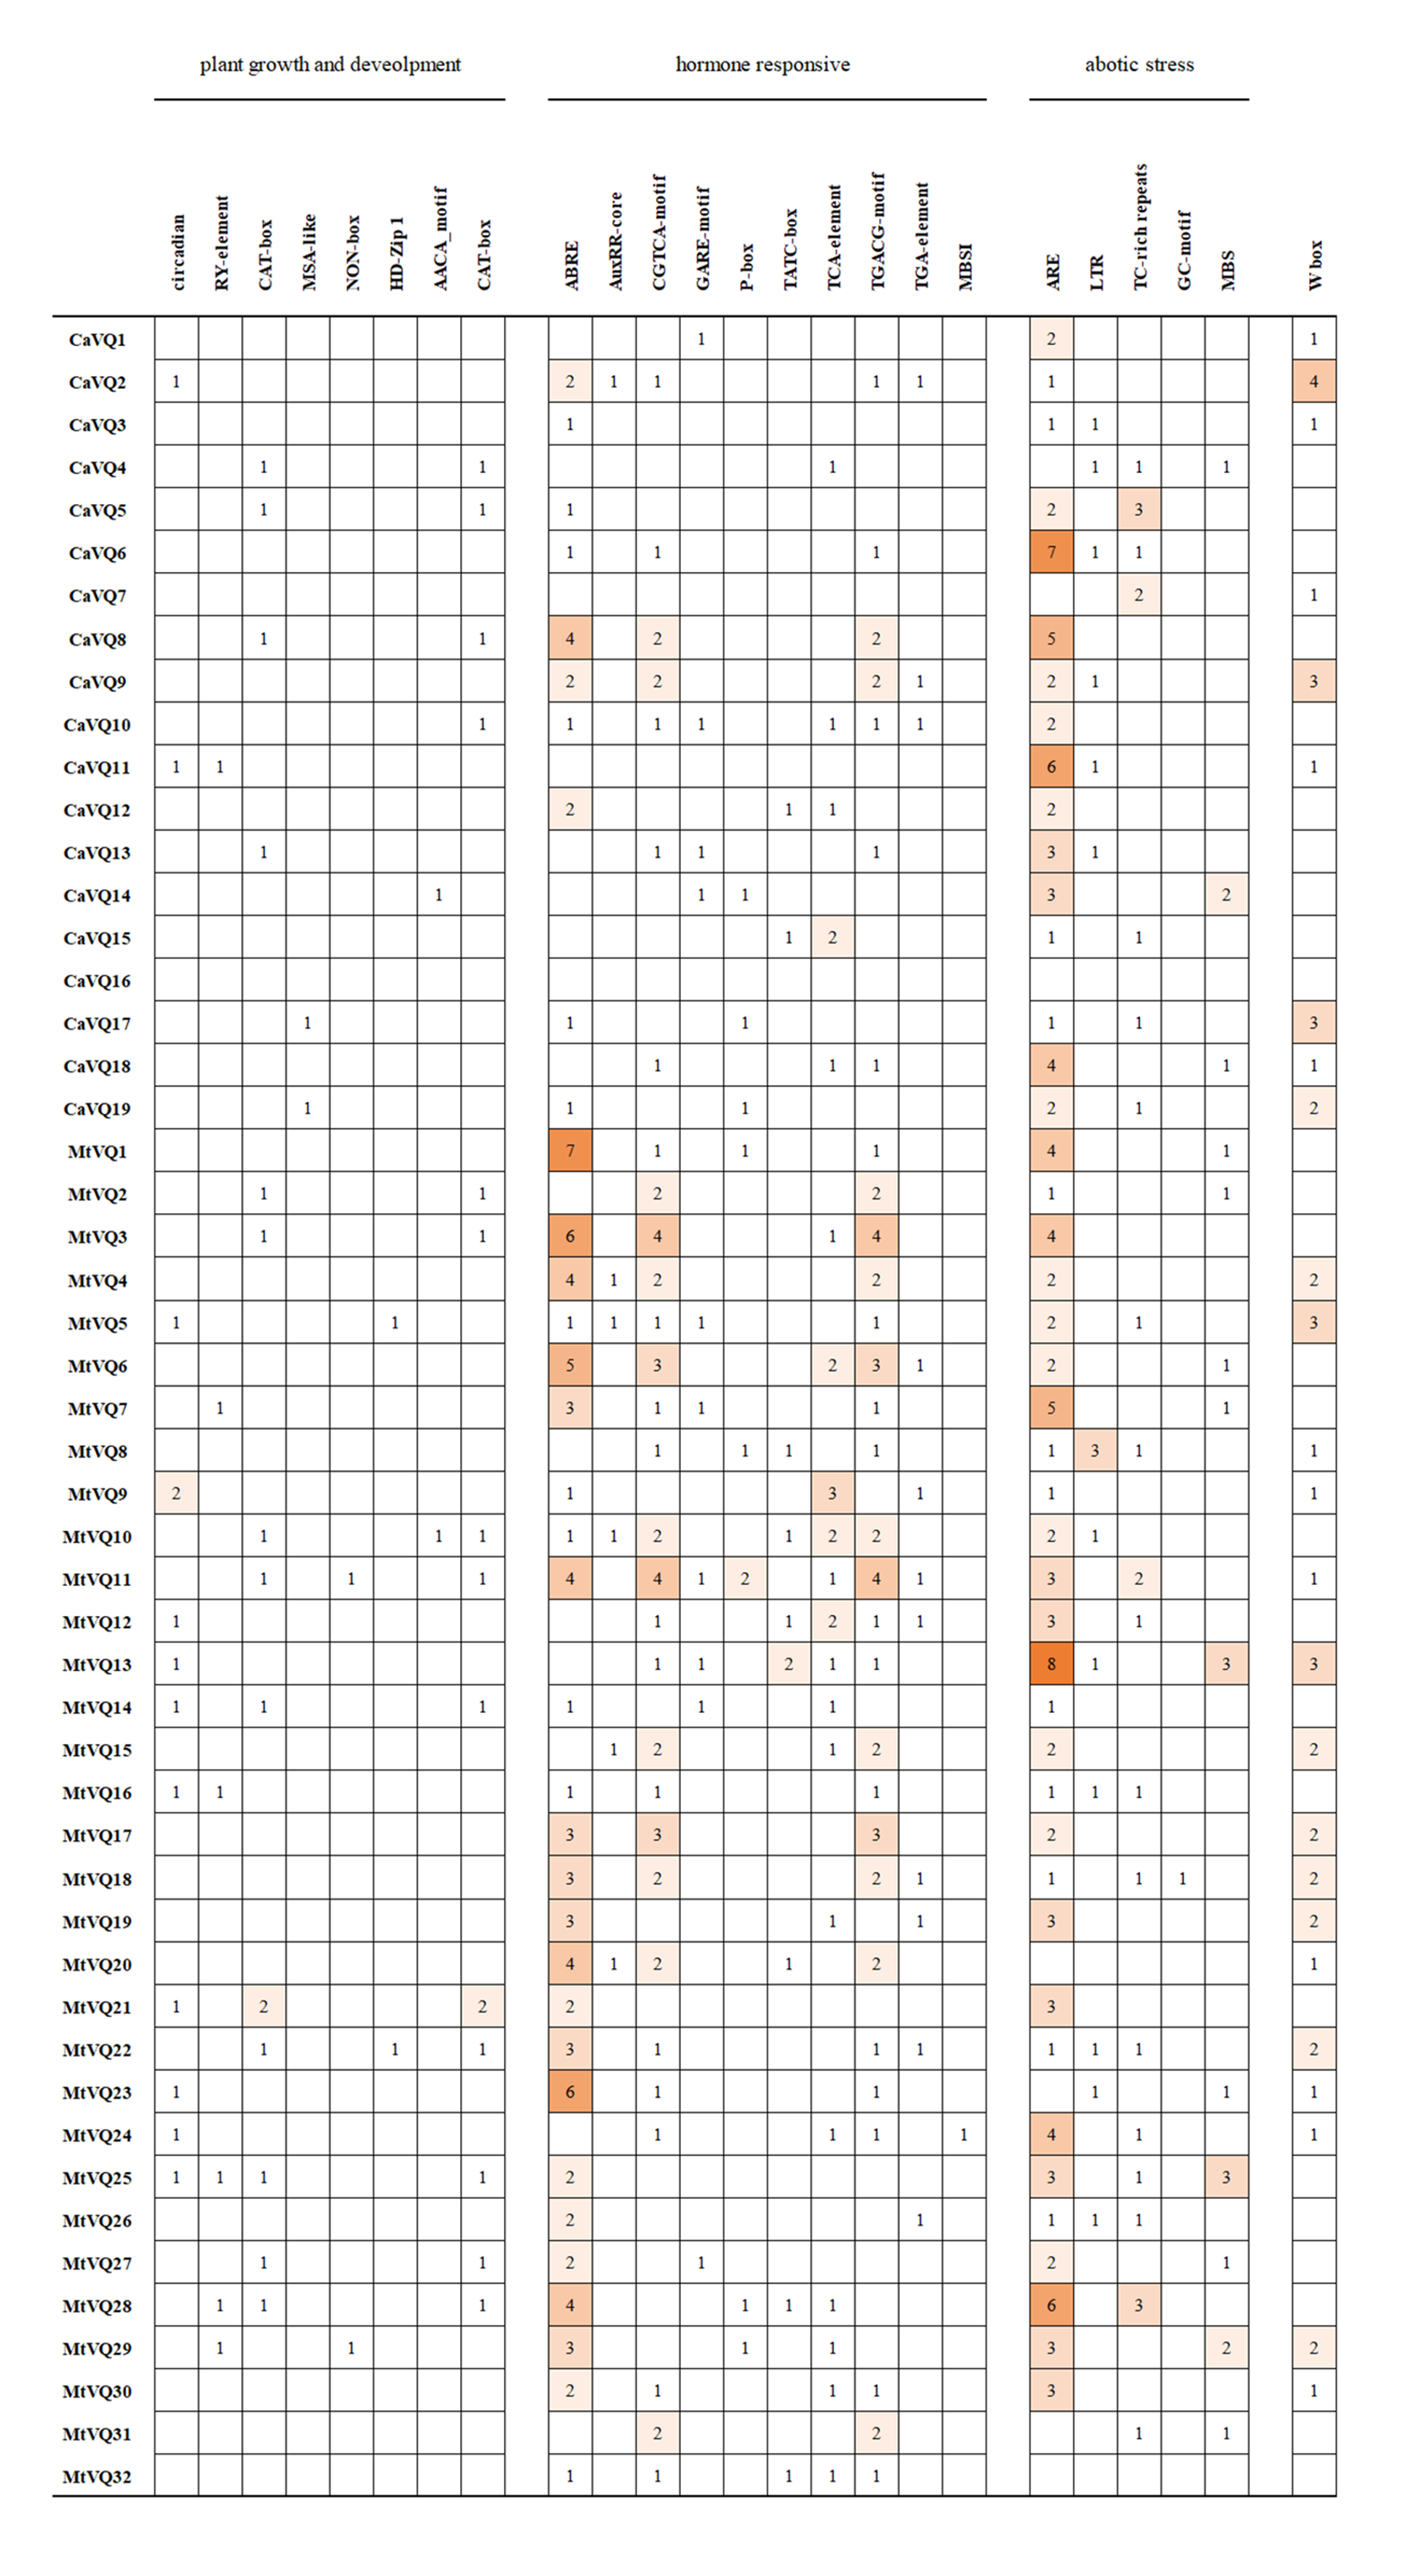
To investigate gene function and regulation, we analyzed cis-elements in the promoters of CaVQs and MtVQs (Table S2, Fig. S4). The multiple light responsive elements were observed in the VQ genes (e.g., G-Box, GT1-motif, 3-AF1 binding site and TCT-motif) (Table S2). Furthermore, some cis-elements participated in plant growth and development (e.g., circadian, RY-element, and CAT-box) (Fig. S4). Other cis-elements could be classified into two major groups: hormone responsive and abotic stress. Ten cis-elements are involved in hormone responses, including ABRE, P-box, TATC-box and AuxRR-core, and five cis-elements are related to stress, i.e., ARE, LTR, MBS, TC-rich repeats and GC-motif. In addition, we found that several VQ genes contained W-box motifs, which are binding sites for WRKY transcription factors (Wang et al., 2010a).
In silico analysis of VQ genes in different tissues
We investigated the expression profiles of CaVQ and MtVQ genes in various tissues using high-throughput sequencing data from NCBI, including leaf, bud, flower, root, pod, nodule in C. arietinum and nodule, blade, flower, root, seedpod, bud in M. truncatula. As shown in Fig. 6, most CaVQ genes exhibited tissue-specific expression patterns. Seven CaVQ genes (CaVQ13, 5, 16, 7, 12, 10 and 15) were highly expressed in the root and nodule; four CaVQ genes (CaVQ18, 4 and 6) were highly expressed in leaf and root; CaVQ14 was expressed only in the bud; CaVQ8 was highly expressed in the six tissues; and six CaVQ genes (CaVQ2, 1, 11, 9, 17 and 19) were expressed at low levels in all tissues. Most CaVQ genes exhibited tissue-specific expression patterns. In M. truncatula (Fig. 7), six genes (MtVQ12, 29, 3, 7, 4 and 20) were highly expressed in the nodule and root; four MtVQ genes (MtVQ23, 16, 11 and 32) were expressed only in the blade; eight MtVQ genes (MtVQ27, 10, 5, 14, 15, 26, 13 and 21) were highly expressed in all detected tissues; and the other MtVQ genes were expressed at low levels in six tissues.
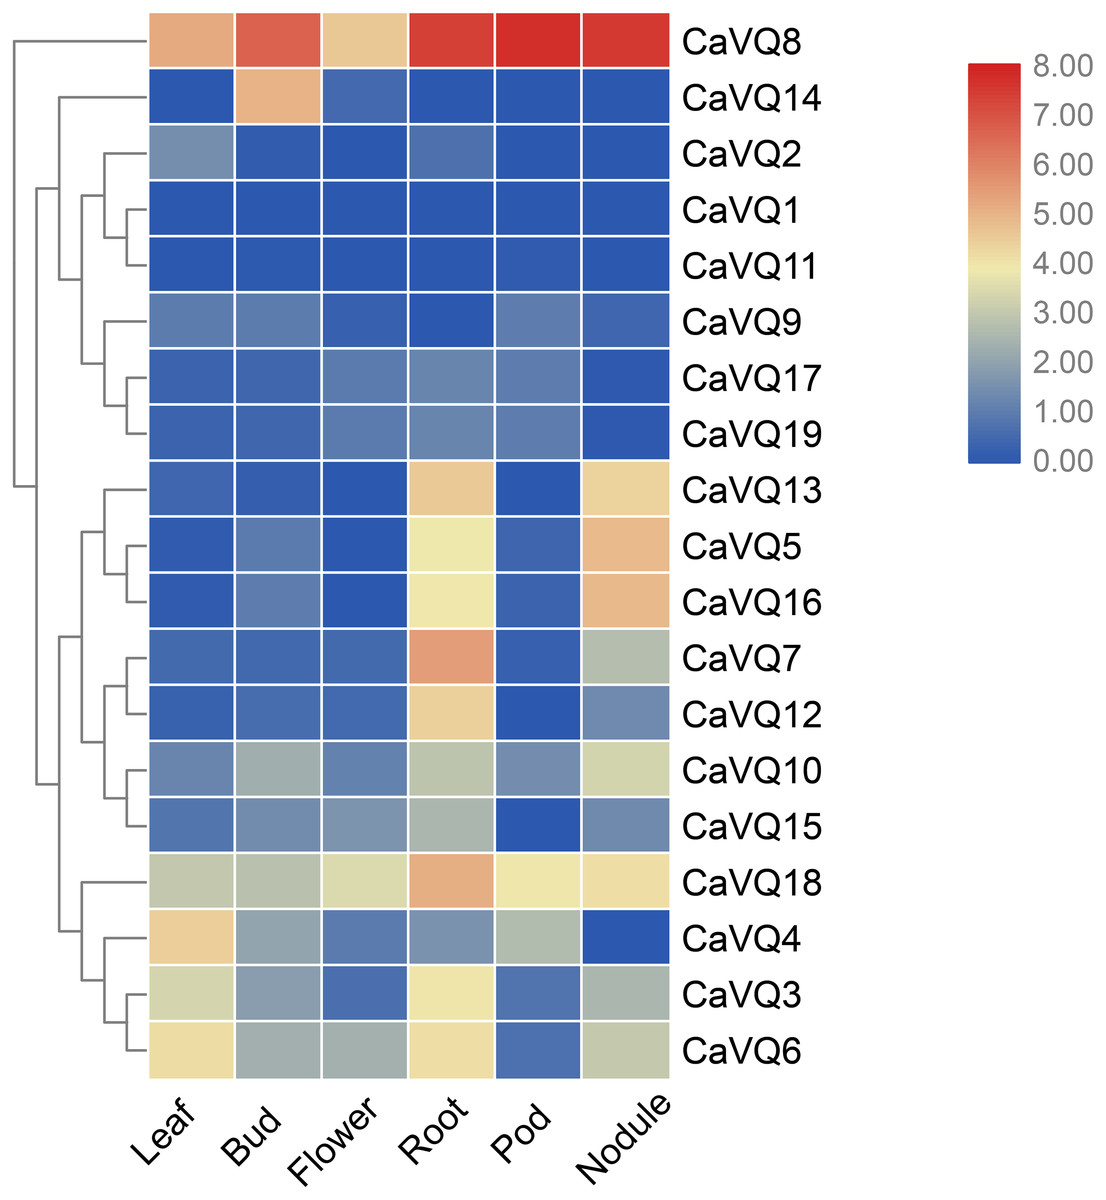
Figure 6: Expression analysis of CaVQ genes in different tissues.
The gene expression values are square-root transformed fragments per kilo-bases per million mapped reads (FPKM). Different colors in map represent gene transcript abundance values as shown in the color bar.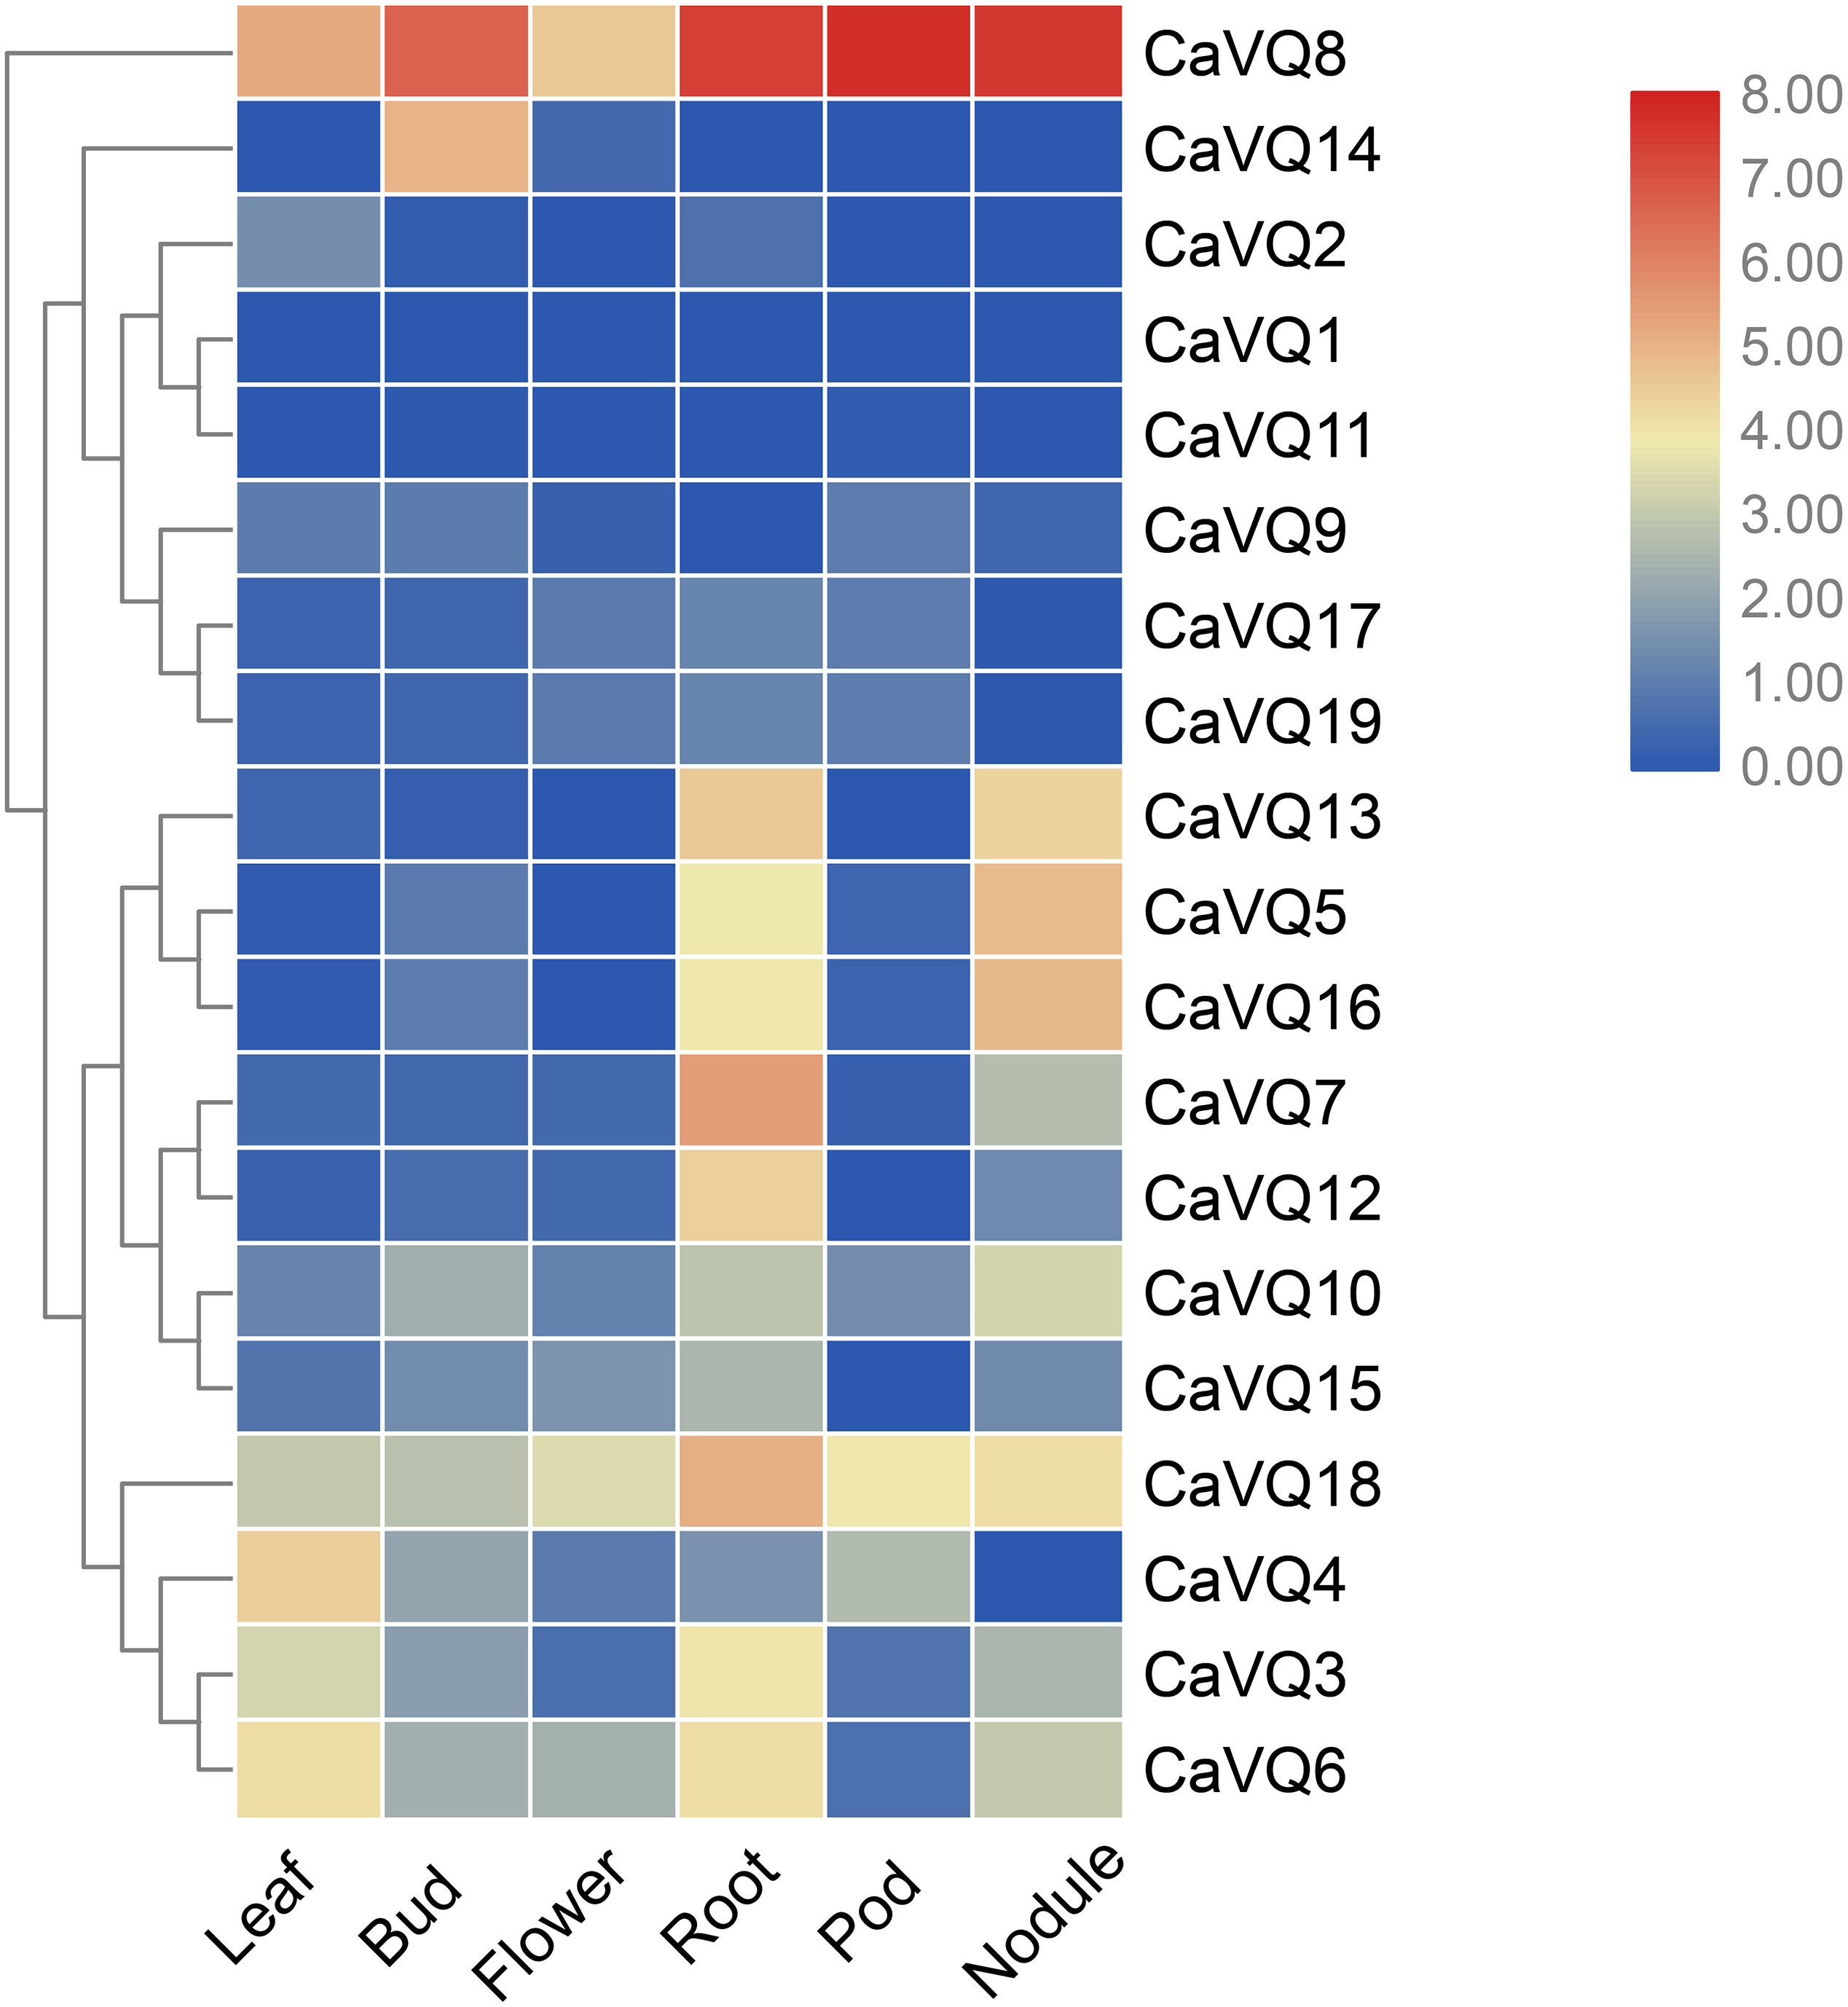
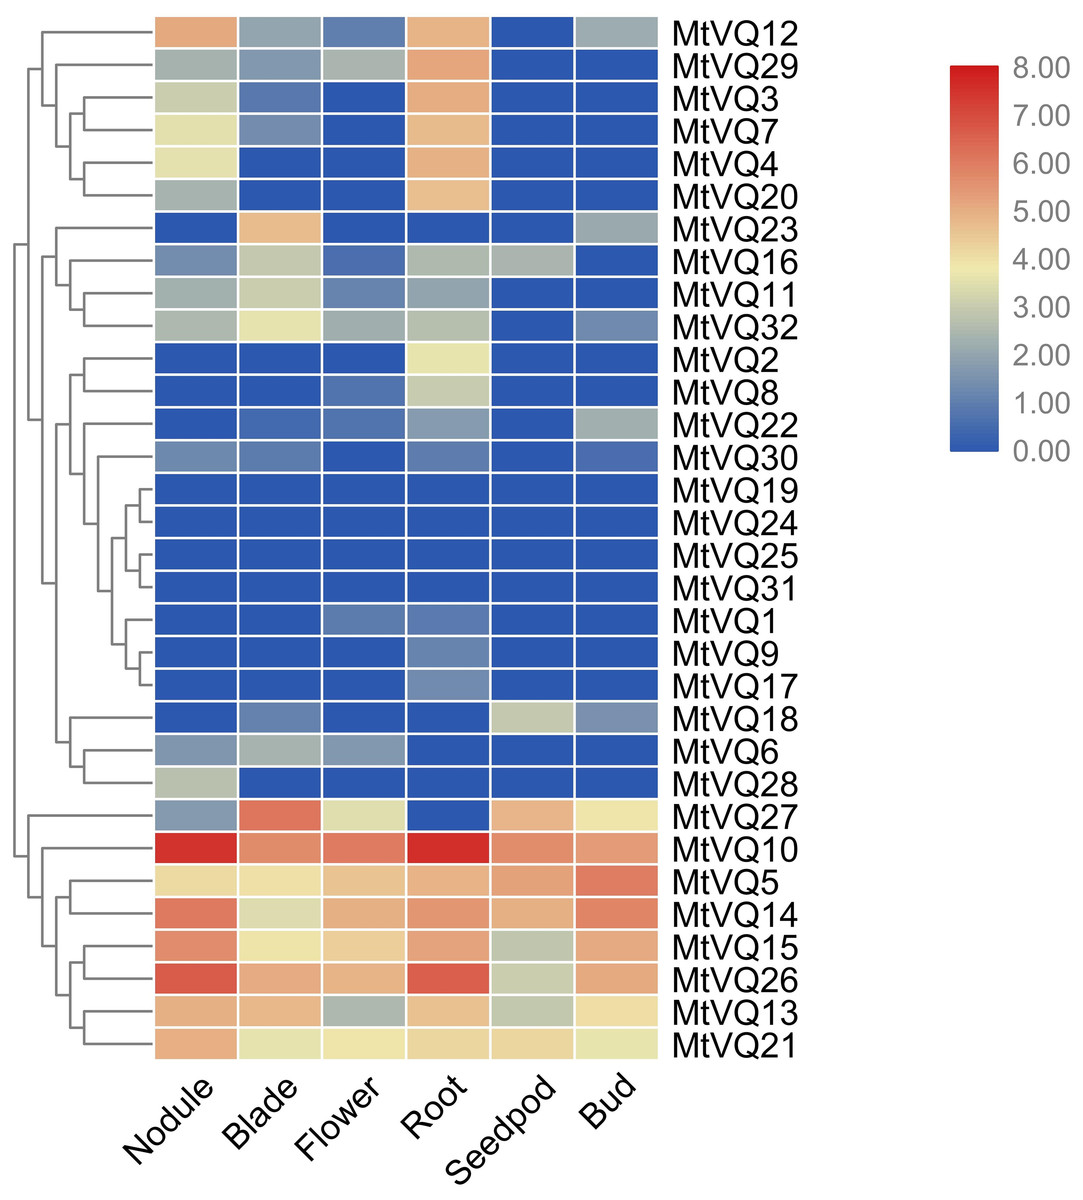
Figure 7: Expression analysis of MtVQ genes in different tissues.
The gene expression values are square-root transformed fragments per kilo-bases per million mapped reads (FPKM). Different colors in map represent gene transcript abundance values as shown in the color bar.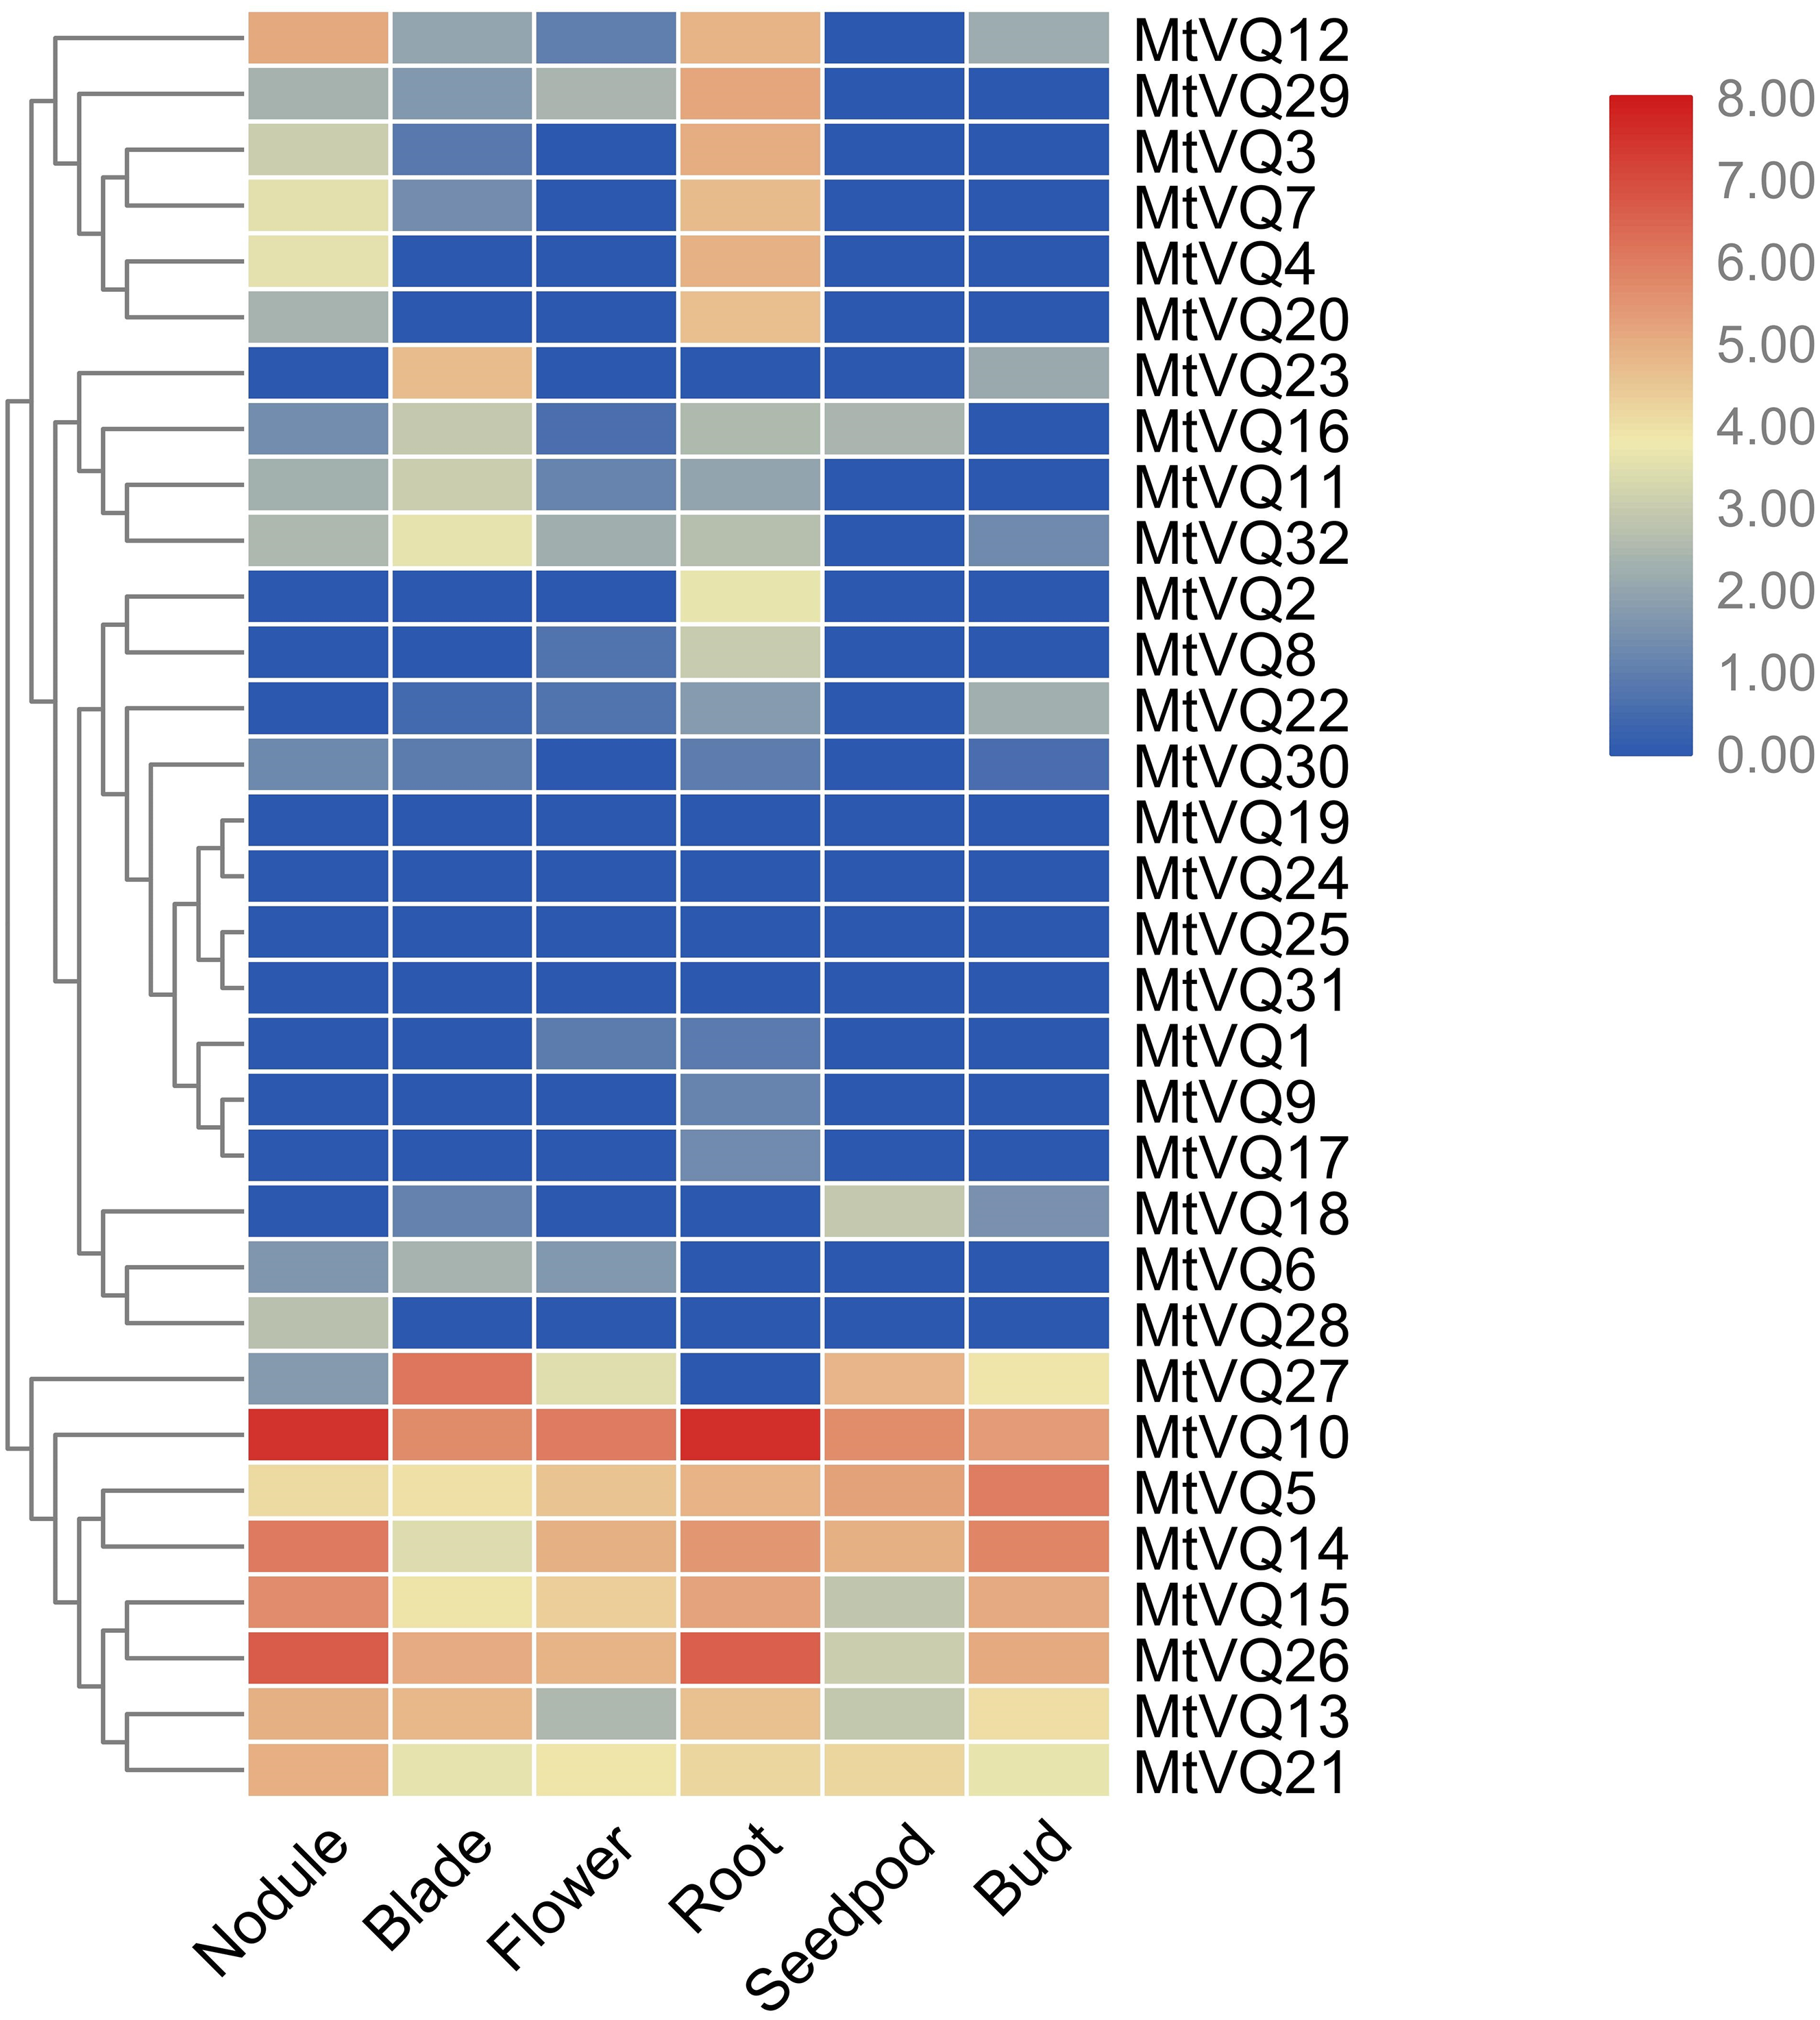
Expression patterns of VQ genes under abiotic stresses
In our study, we examined the expression patterns of CaVQ and MtVQ genes under different stress conditions to identify which genes might take part in abiotic stress responses. We performed a qRT-PCR to analyse the expression profiles of the MtVQ and CaVQ genes under different stresses, such as drought, salt, cold and freezing (Figs. 8–11).
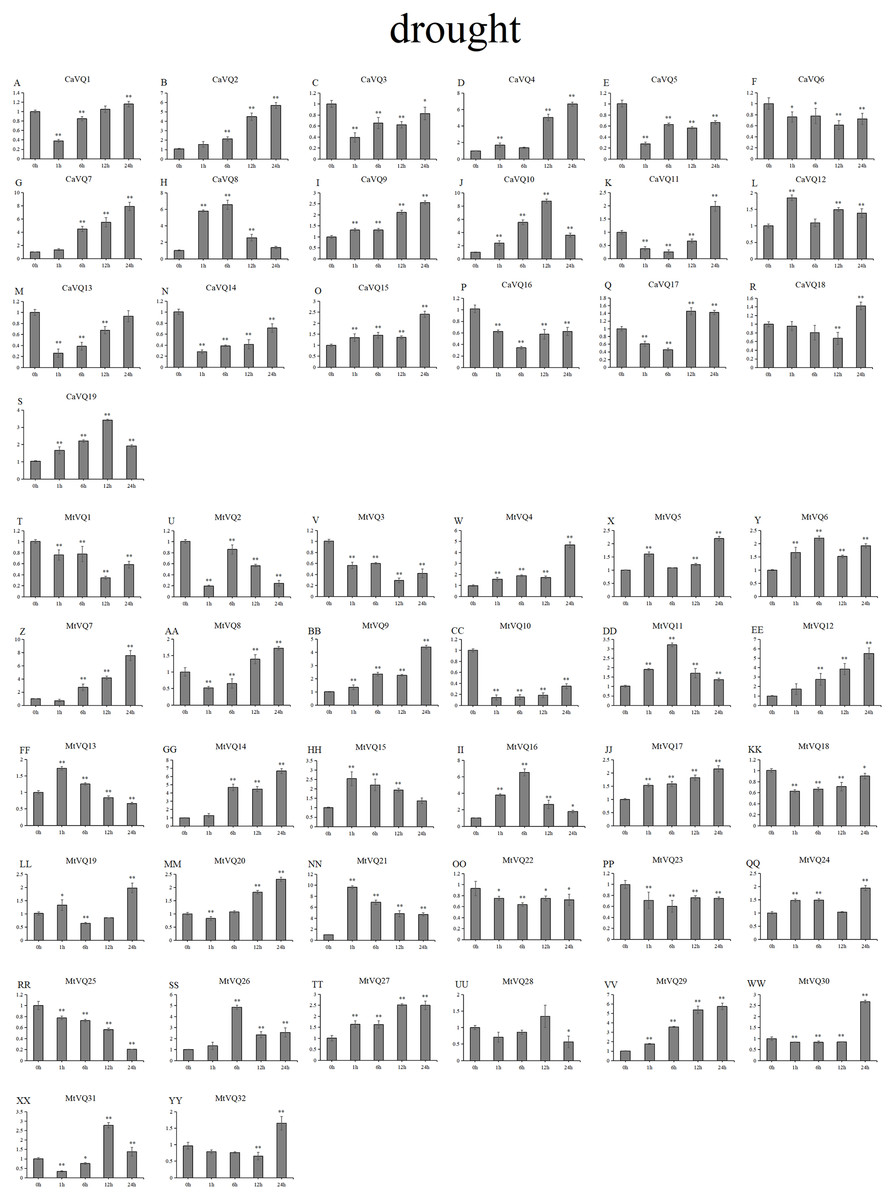
Figure 8: qRT-PCR validation of VQ genes in the response to drought treatment.
Stress treatments and time course are described in “Materials & Methods”. (A-YY) represent different genes which were used in qRT-PCR analysis. Asterisks on top of the bars indicating statistically significant differences between the stress and counterpart controls (∗p < 0.05, ∗∗p < 0.01).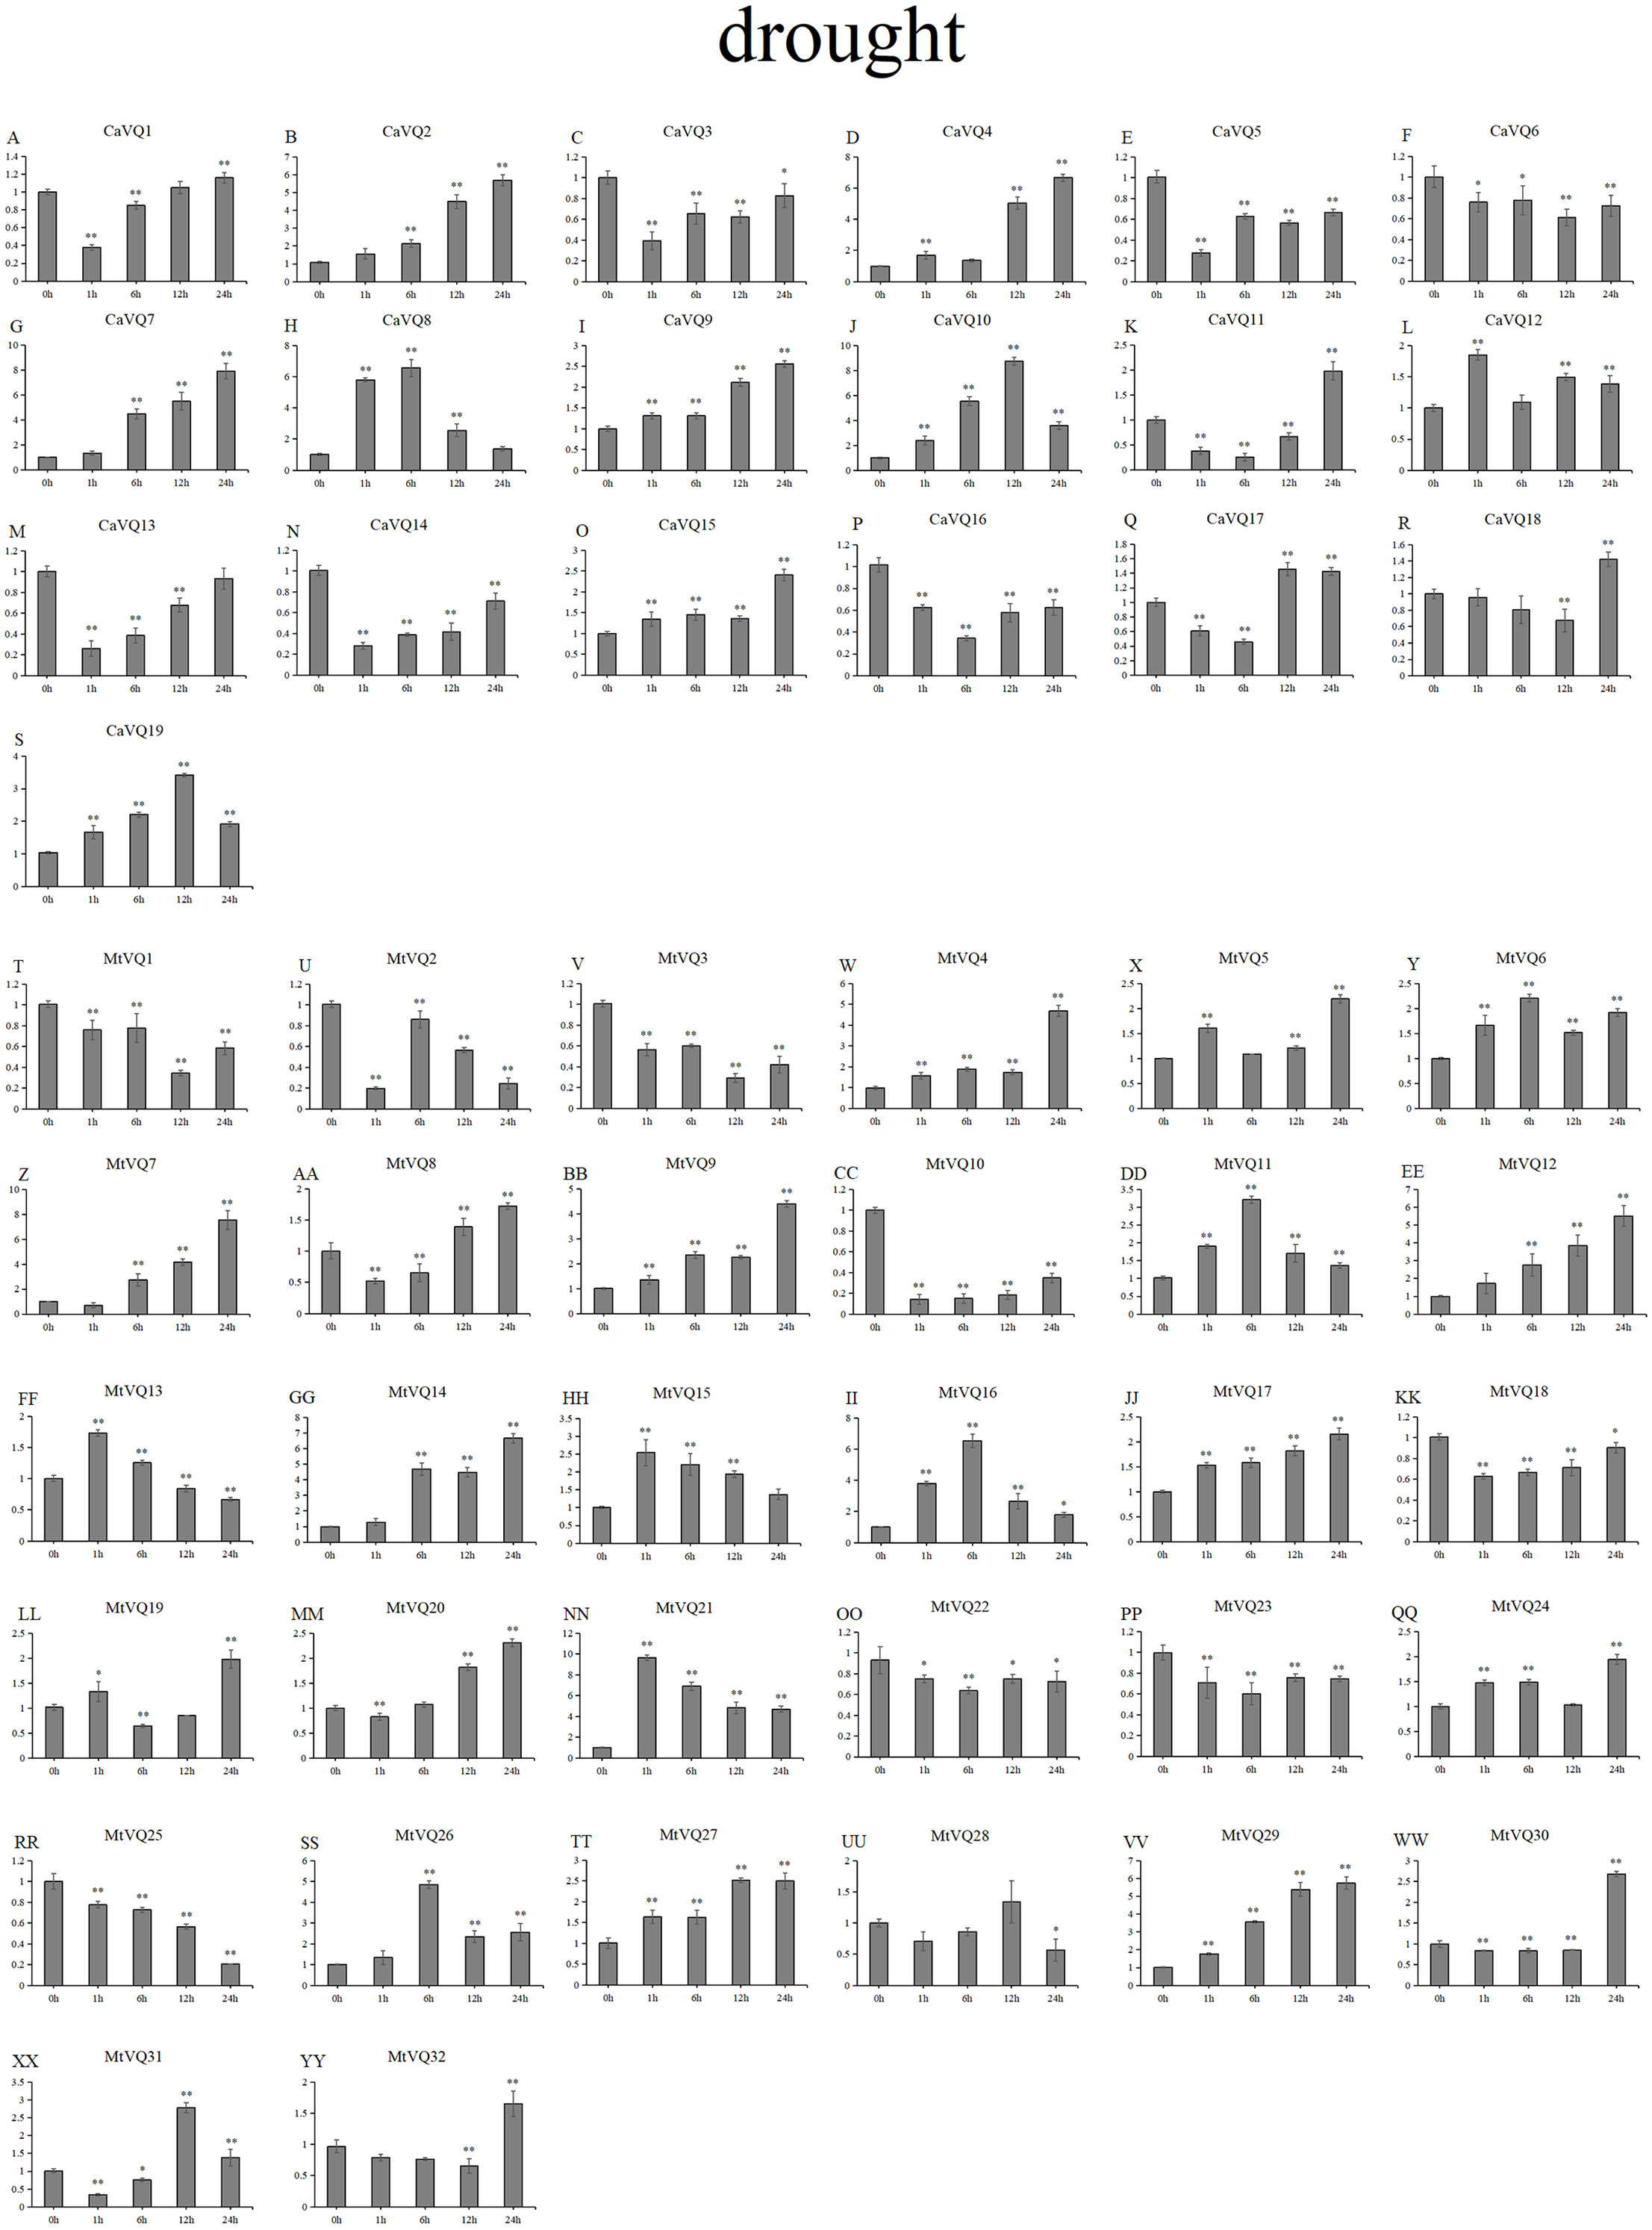
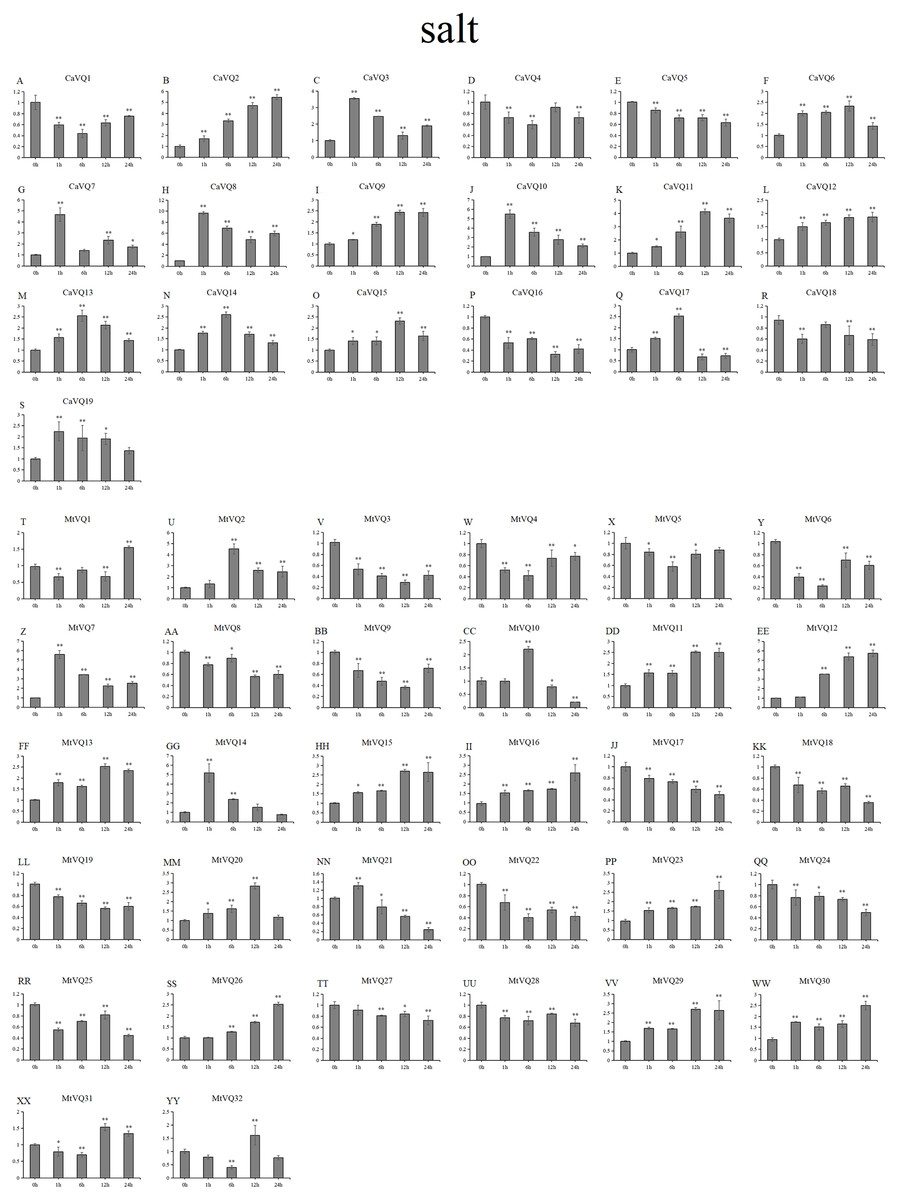
Figure 9: qRT-PCR validation of VQ genes in the response to salt treatment.
Stress treatments and time course are described in “Materials & Methods”. (A-YY) represent different genes which were used in qRT-PCR analysis. Asterisks on top of the bars indicating statistically significant differences between the stress and counterpart controls (∗p < 0.05, ∗∗p < 0.01).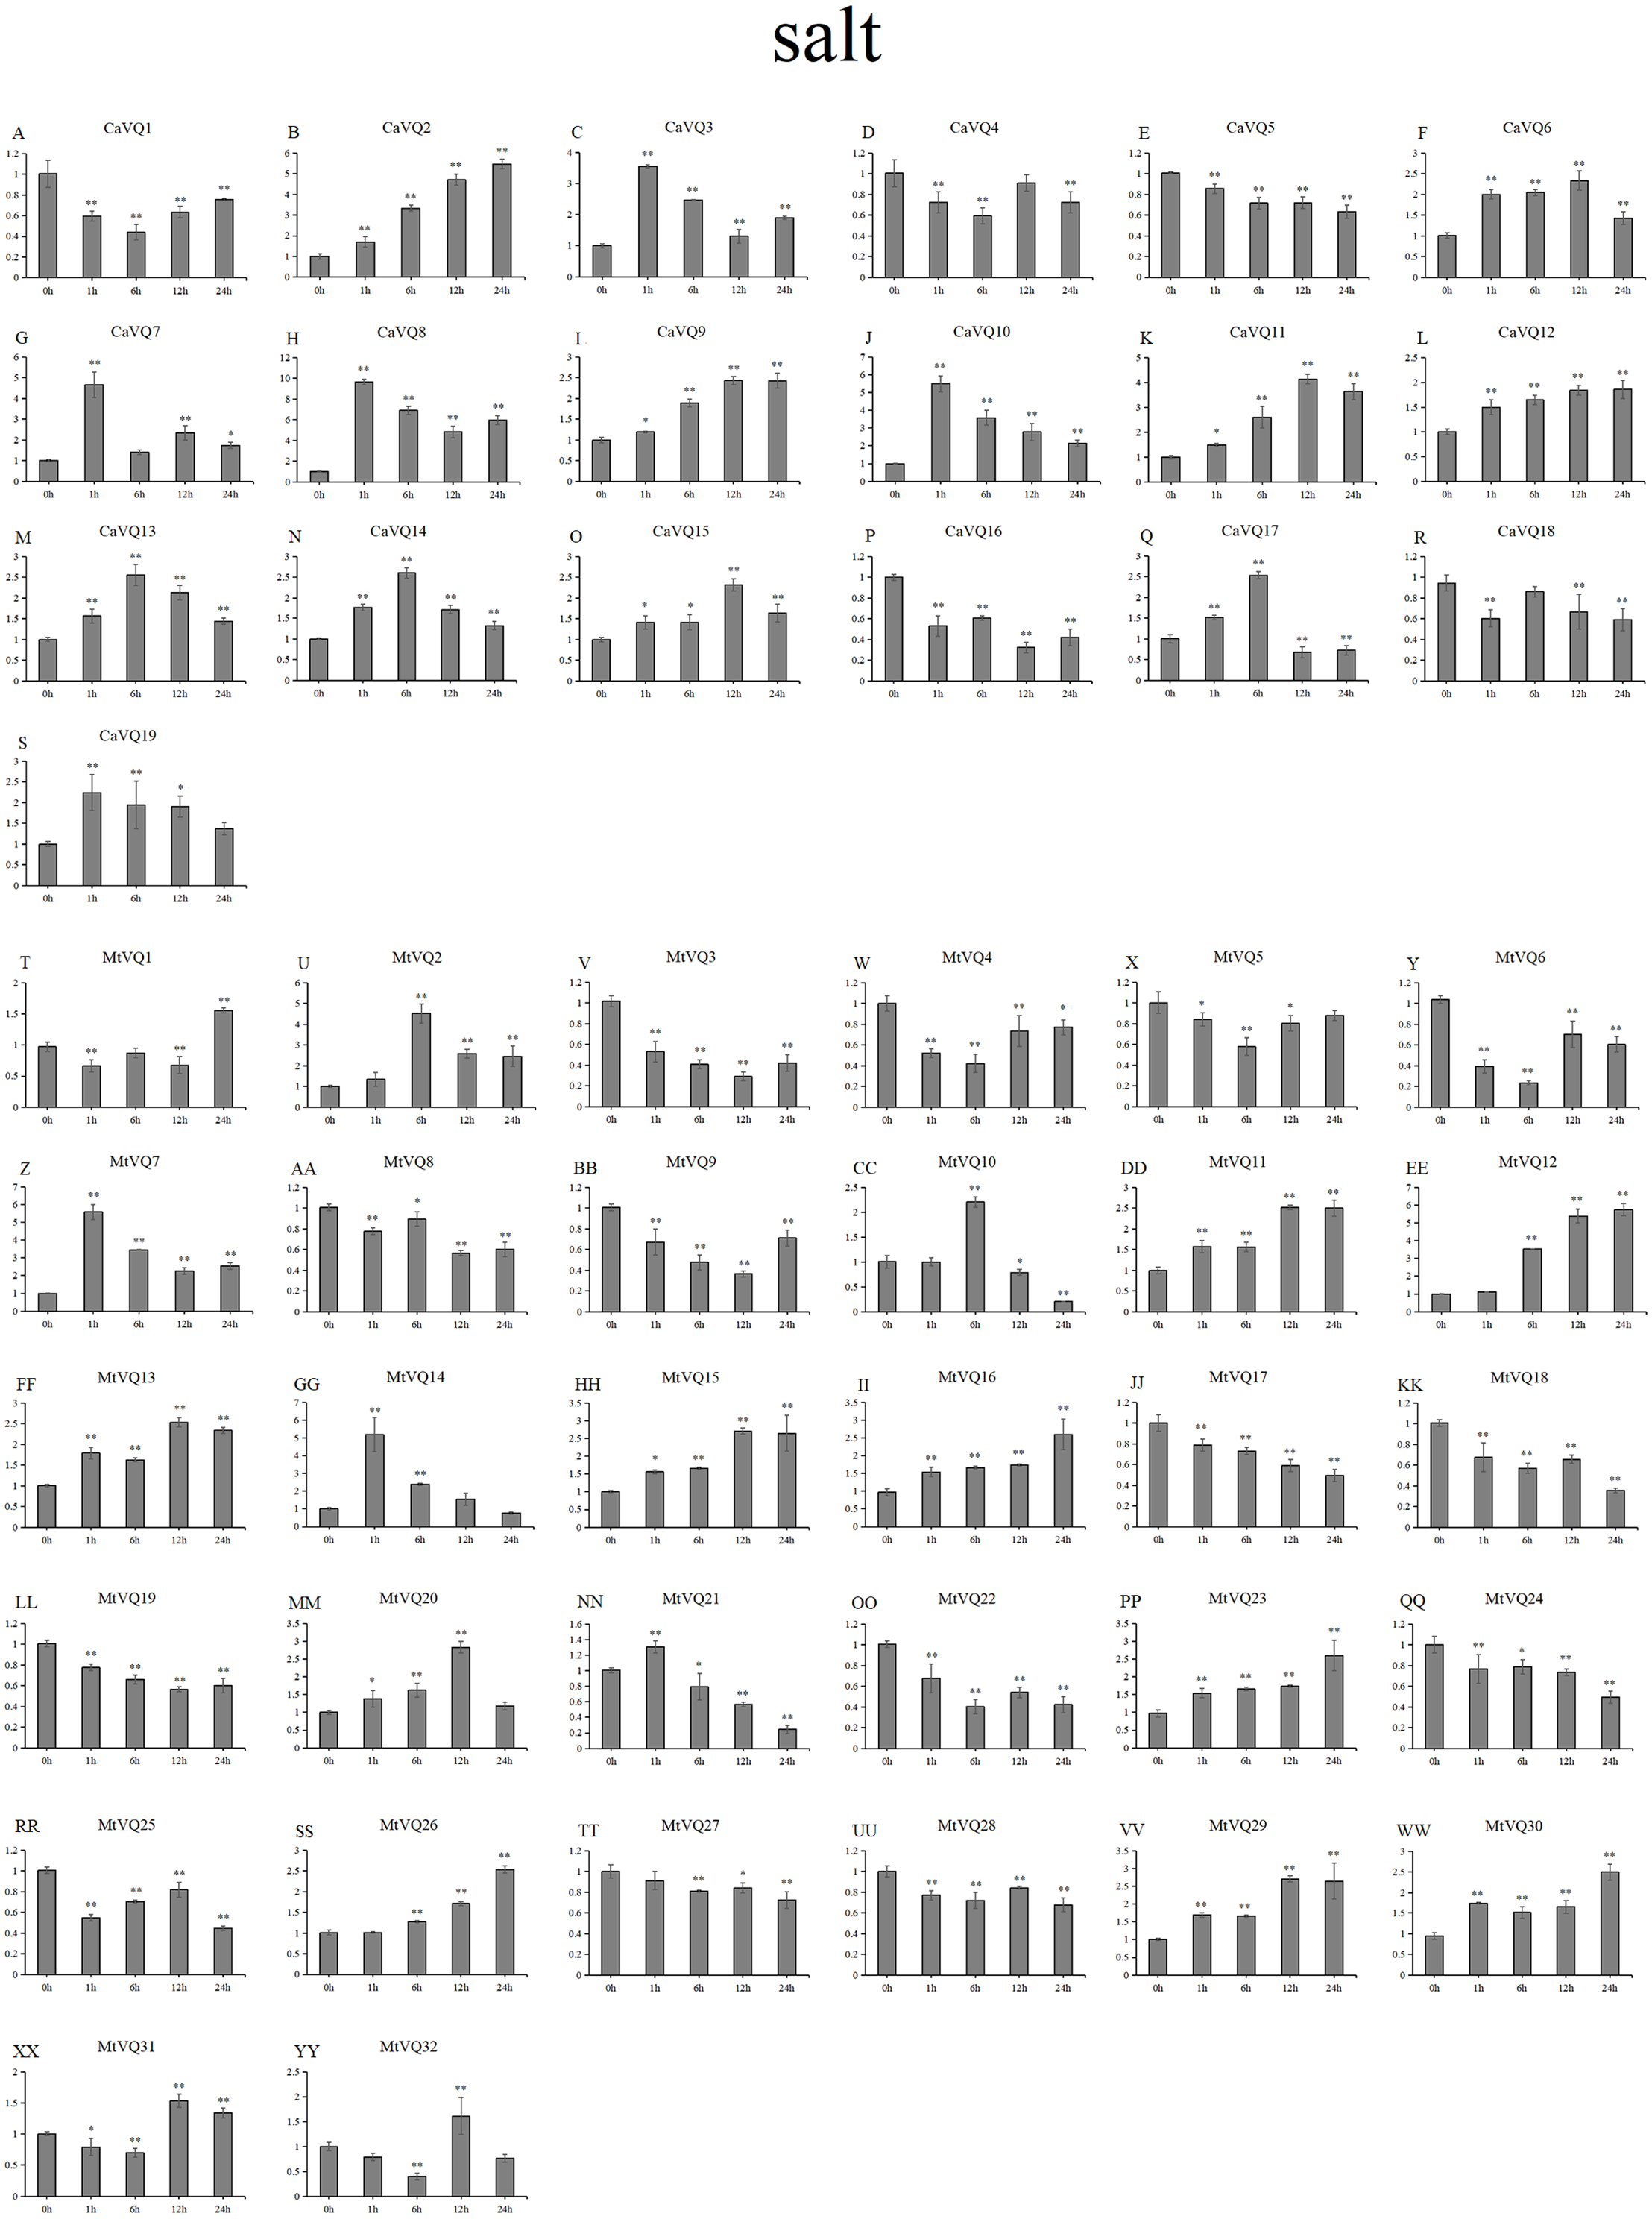
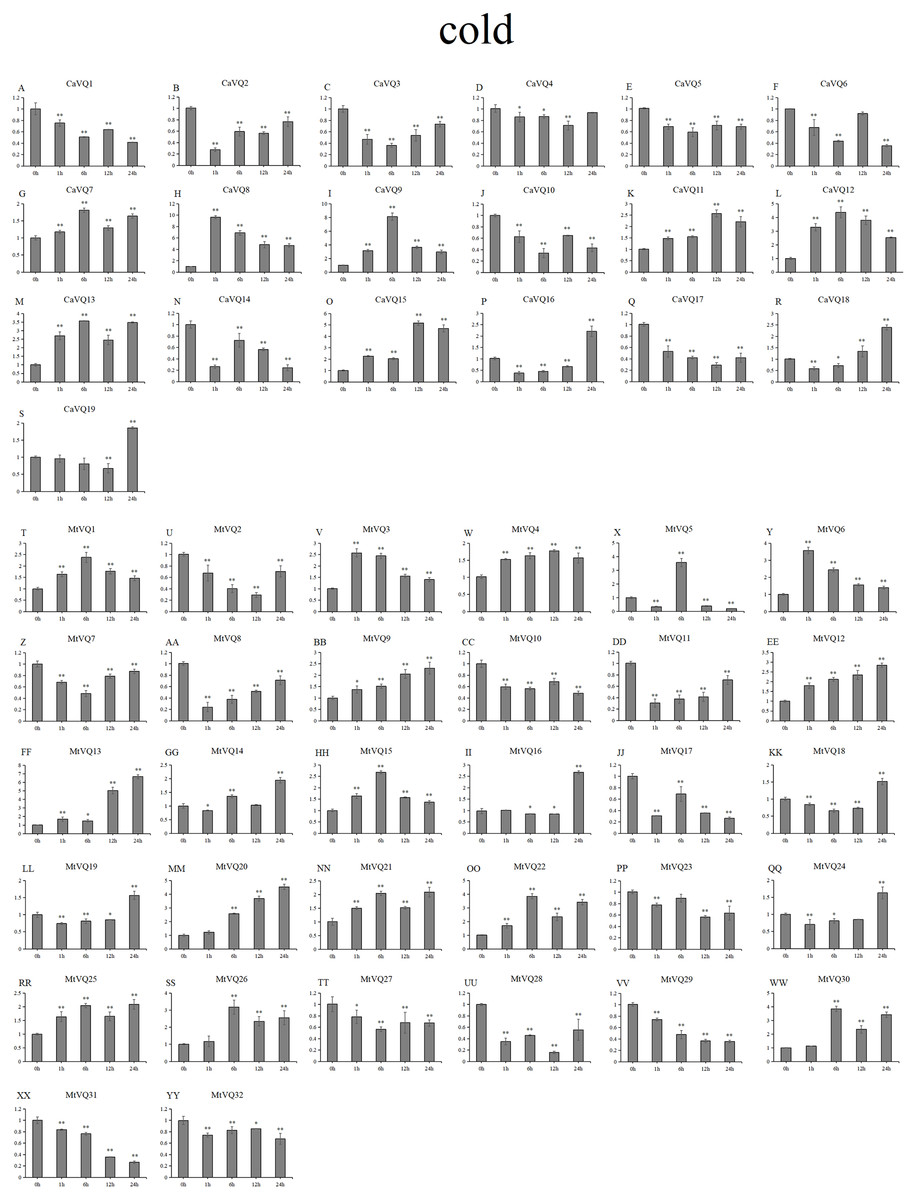
Figure 10: qRT-PCR validation of VQ genes in the response to cold treatment.
Stress treatments and time course are described in “Materials & Methods”. (A-YY) represent different genes which were used in qRT-PCR analysis. Asterisks on top of the bars indicating statistically significant differences between the stress and counterpart controls (∗p < 0.05, ∗∗p < 0.01).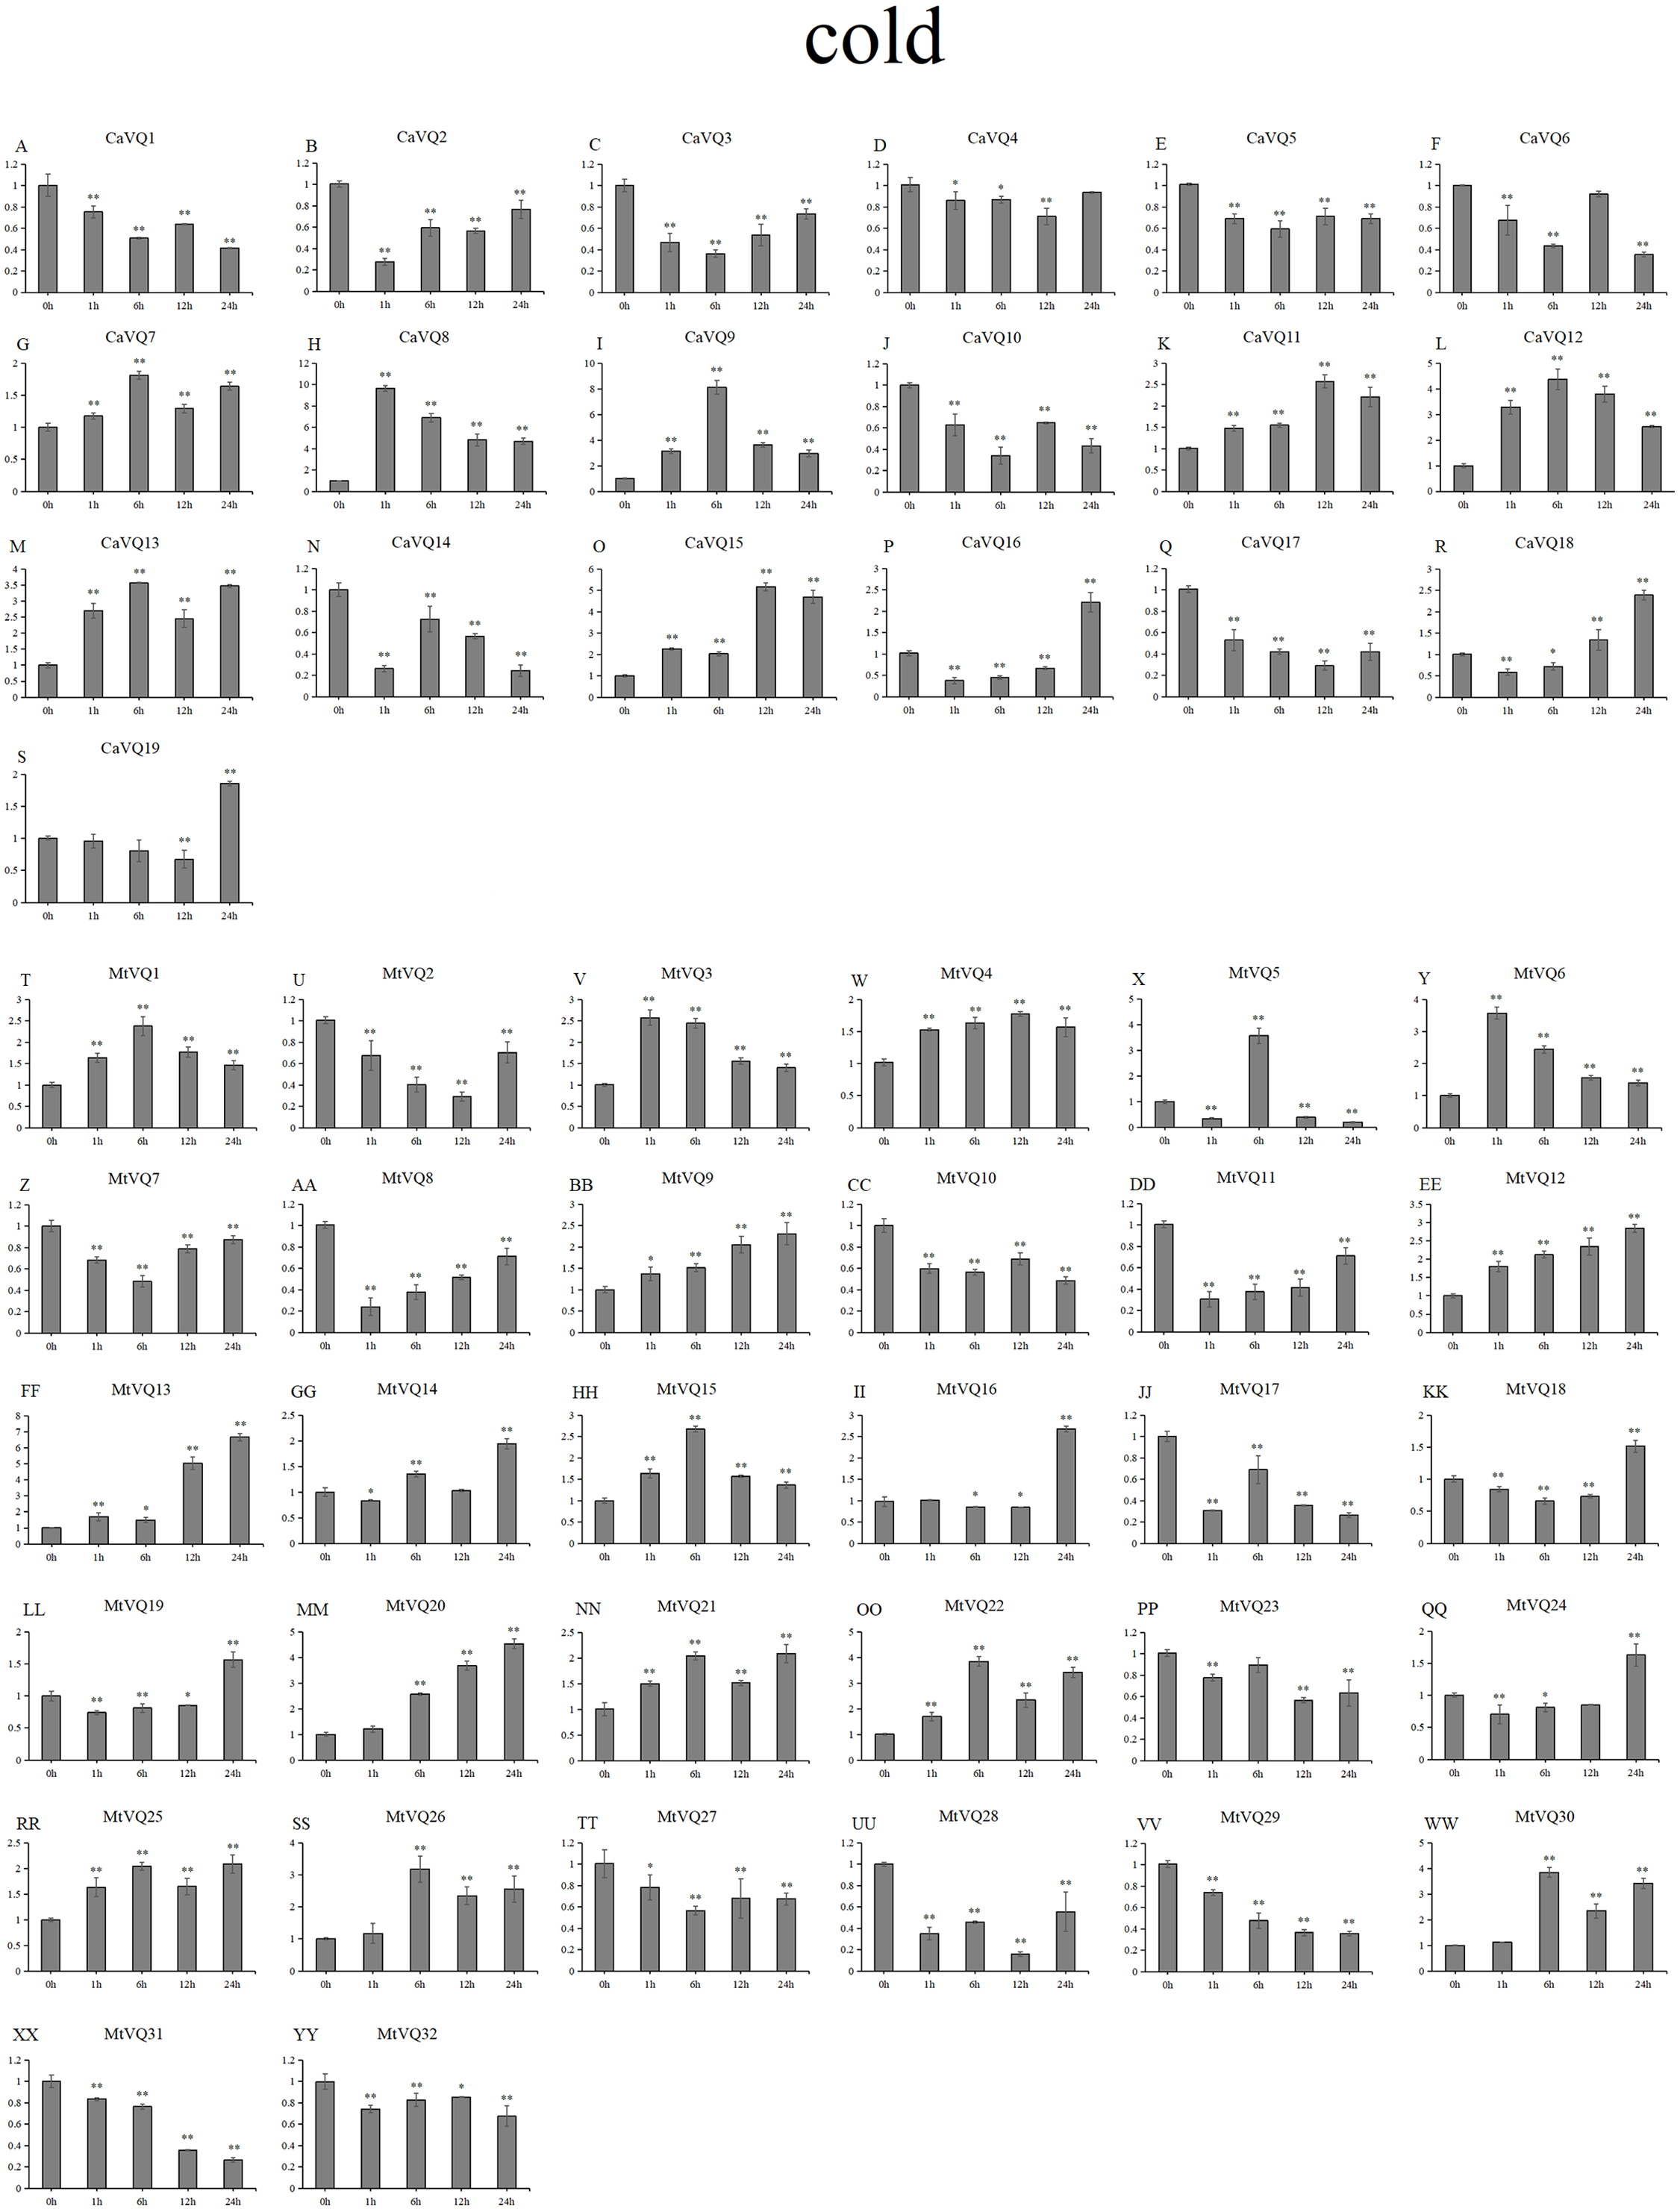
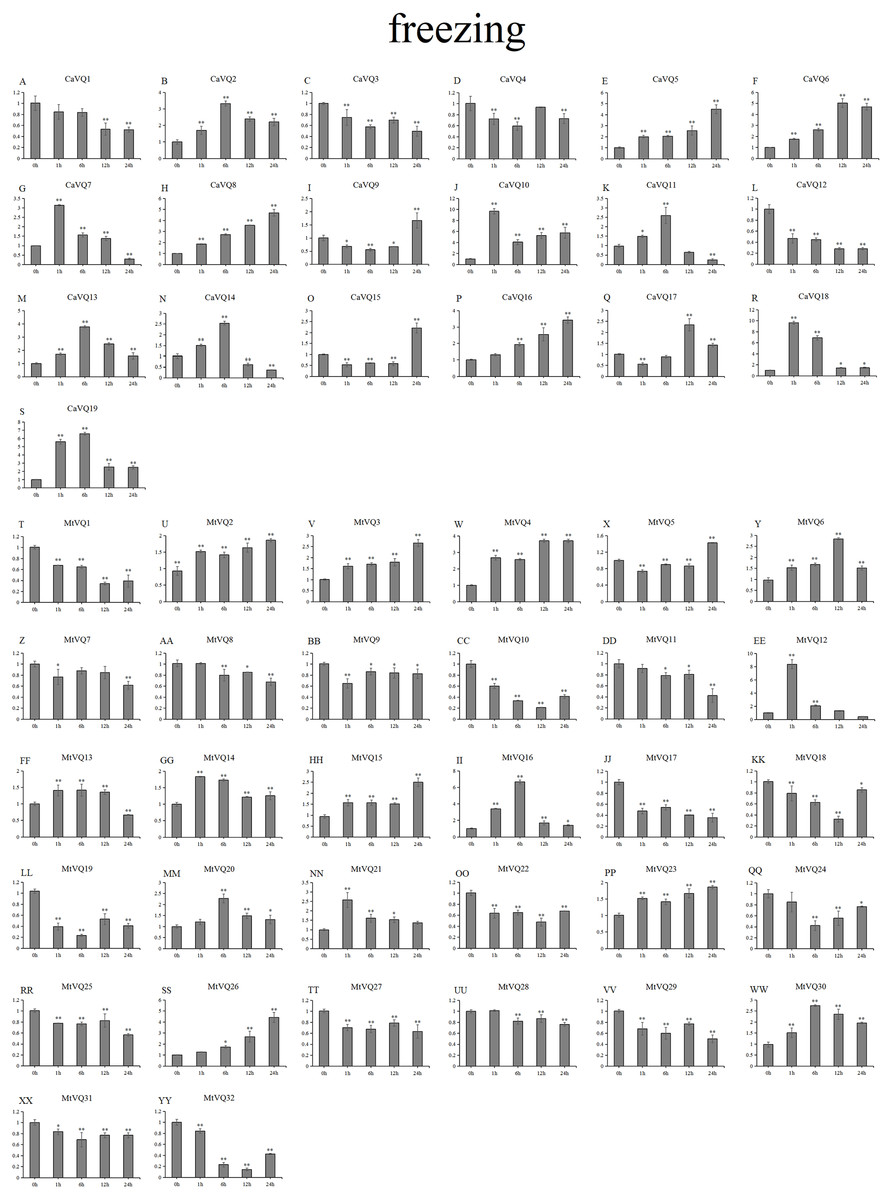
Figure 11: qRT-PCR validation of VQ. genes in the response to freezing treatment.
Stress treatments and time course are described in “Materials & Methods”. (A-YY) represent different genes which were used in qRT-PCR analysis. Asterisks on top of the bars indicating statistically significant differences between the stress and counterpart controls (∗p < 0.05, ∗∗p < 0.01).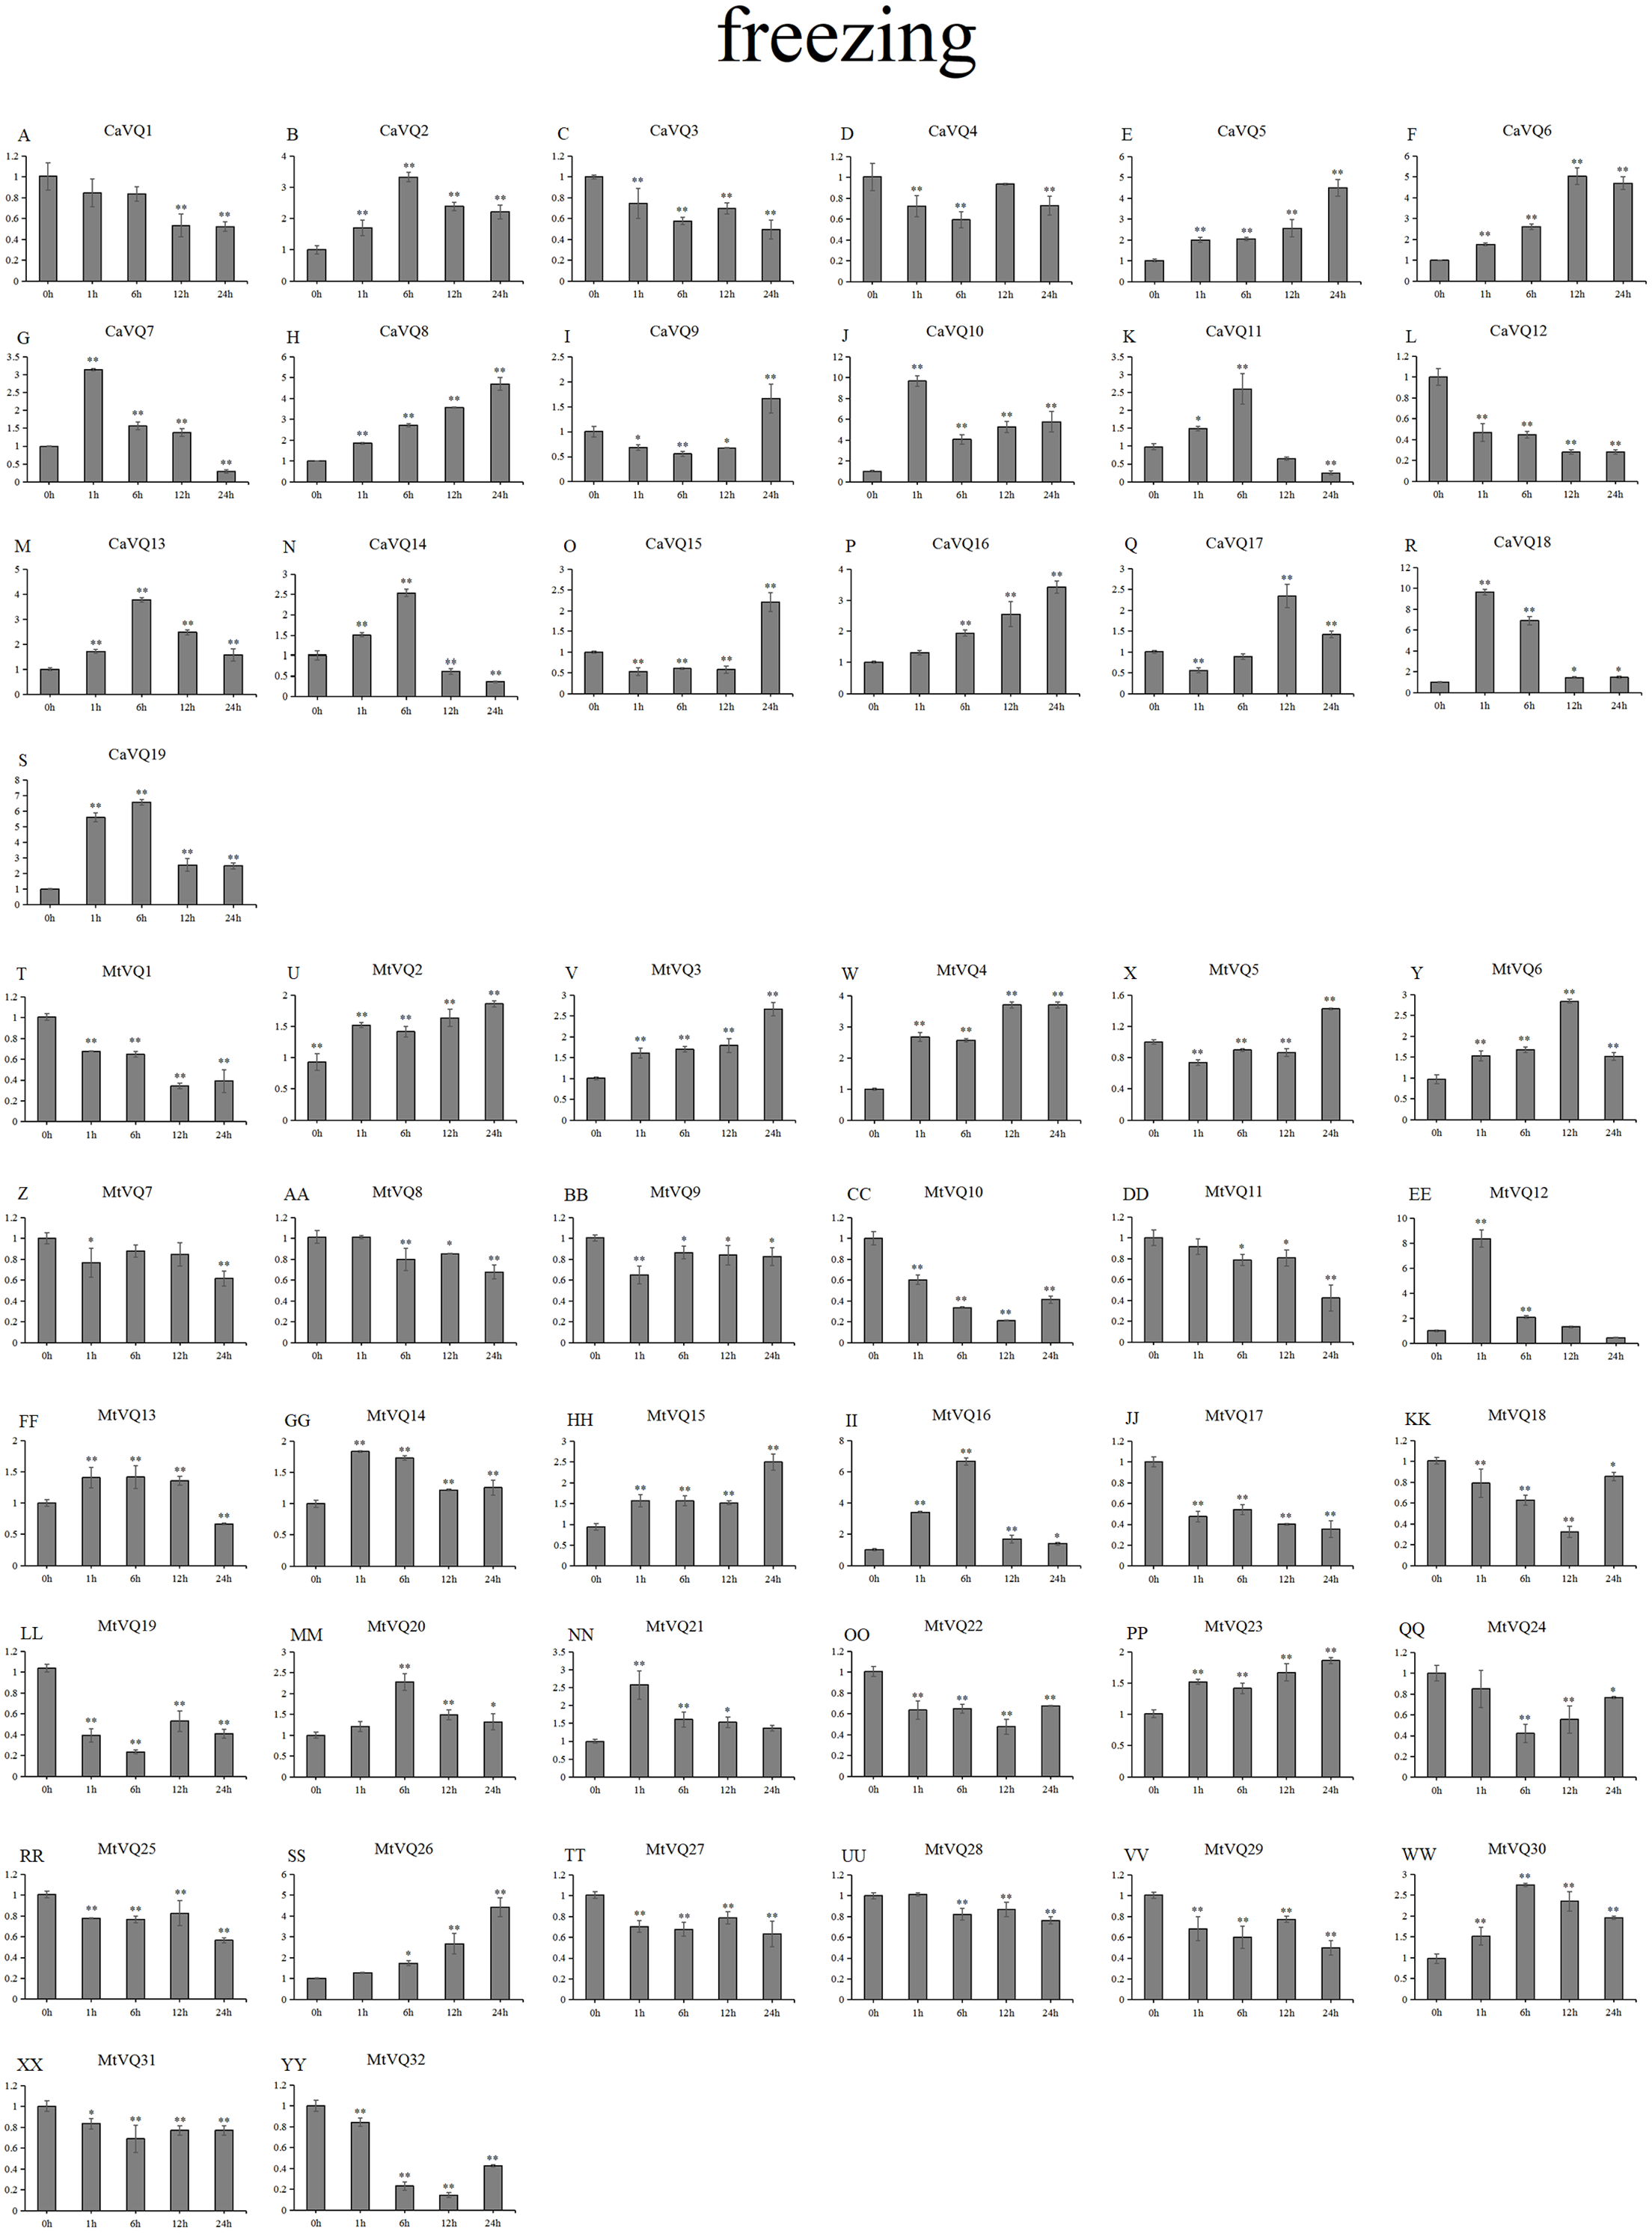
After drought treatment (Fig. 8), the expression of five CaVQ genes (CaVQ2, 4, 7, 9, and 15) and eight MtVQ genes (MtVQ4, 5, 9, 12, 14, 17, 27, and 29) significantly increased (more than 1.5-fold) and peaked at 24 h. In addition, six CaVQ genes (CaVQ1, 5, 11, 13, 14 and 17) and six MtVQ (MtVQ2, 3, 8, 18, 20 and 31) genes were significantly downregulated at early time points, then their expression levels increased. Three genes (MtVQ6, 16 and 26) were upregulated (more than 2-fold) and peak at 6 h. Except these, MtVQ10 was significantly downregulated more than 1.5-fold during the drought stress. During salt stress (Fig. 9), eight CaVQ genes (CaVQ3, 7, 8, 10, 13, 14, 17 and 19) and four MtVQ genes (MtVQ7, 10, 14 and 21) were significantly induced at early time points. On the contrary, four CaVQ genes (CaVQ1, 4, 16 and 18) and three MtVQ genes (MtVQ1, 3 and 6) were downregulated at 1 h and their expression levels were further decreased at 6 h with the exception CaVQ16, CaVQ18 and MtVQ1. For cold treatment (Fig. 10), seven CaVQ genes (CaVQ7, 8, 9, 11,12, 13 and 15) and eleven MtVQ genes (MtVQ1, 4, 6, 9, 12, 13, 15, 20, 21, 22 and 25) were rapidly upregulated at early time points. Among these genes, four CaVQ genes (CaVQ7, 9, 12 and 13) and three MtVQ genes (MtVQ1, 15 and 22) showed the highest expression levels at 6 h. In contrast, seven CaVQ genes (CaVQ1, 2, 3, 5, 10, 14 and 17) and twelve MtVQ gene (MtVQ2, 7, 8, 10, 11, 17, 23, 27, 28, 29, 31 and 32) showed a trend of downregulation from 1 h to 24 h. Interestingly, MtVQ5 was upregulated about 2-fold at 6 h but downregulated more than 4-fold at 24 h. For the case of freezing treatment (Fig. 11), six CaVQ genes (CaVQ2, 7, 13, 14, 18 and 19) and five MtVQ genes (MtVQ12, 16, 20, 21 and 30) at early time points (1 h or 6h) exhibited at least a 1.5-fold increase in expression compared to the untreated control. On the contrary, four CaVQ genes (CaVQ1, 3, 4 and 12) and thirteen MtVQ genes (MtVQ1, 10, 11, 17, 18, 19, 22, 24, 25, 27, 29, 31 and 32). Interestingly, MtVQ12 was rapidly upregulated at 1 h (more than 7-fold), then the expression level decreased.
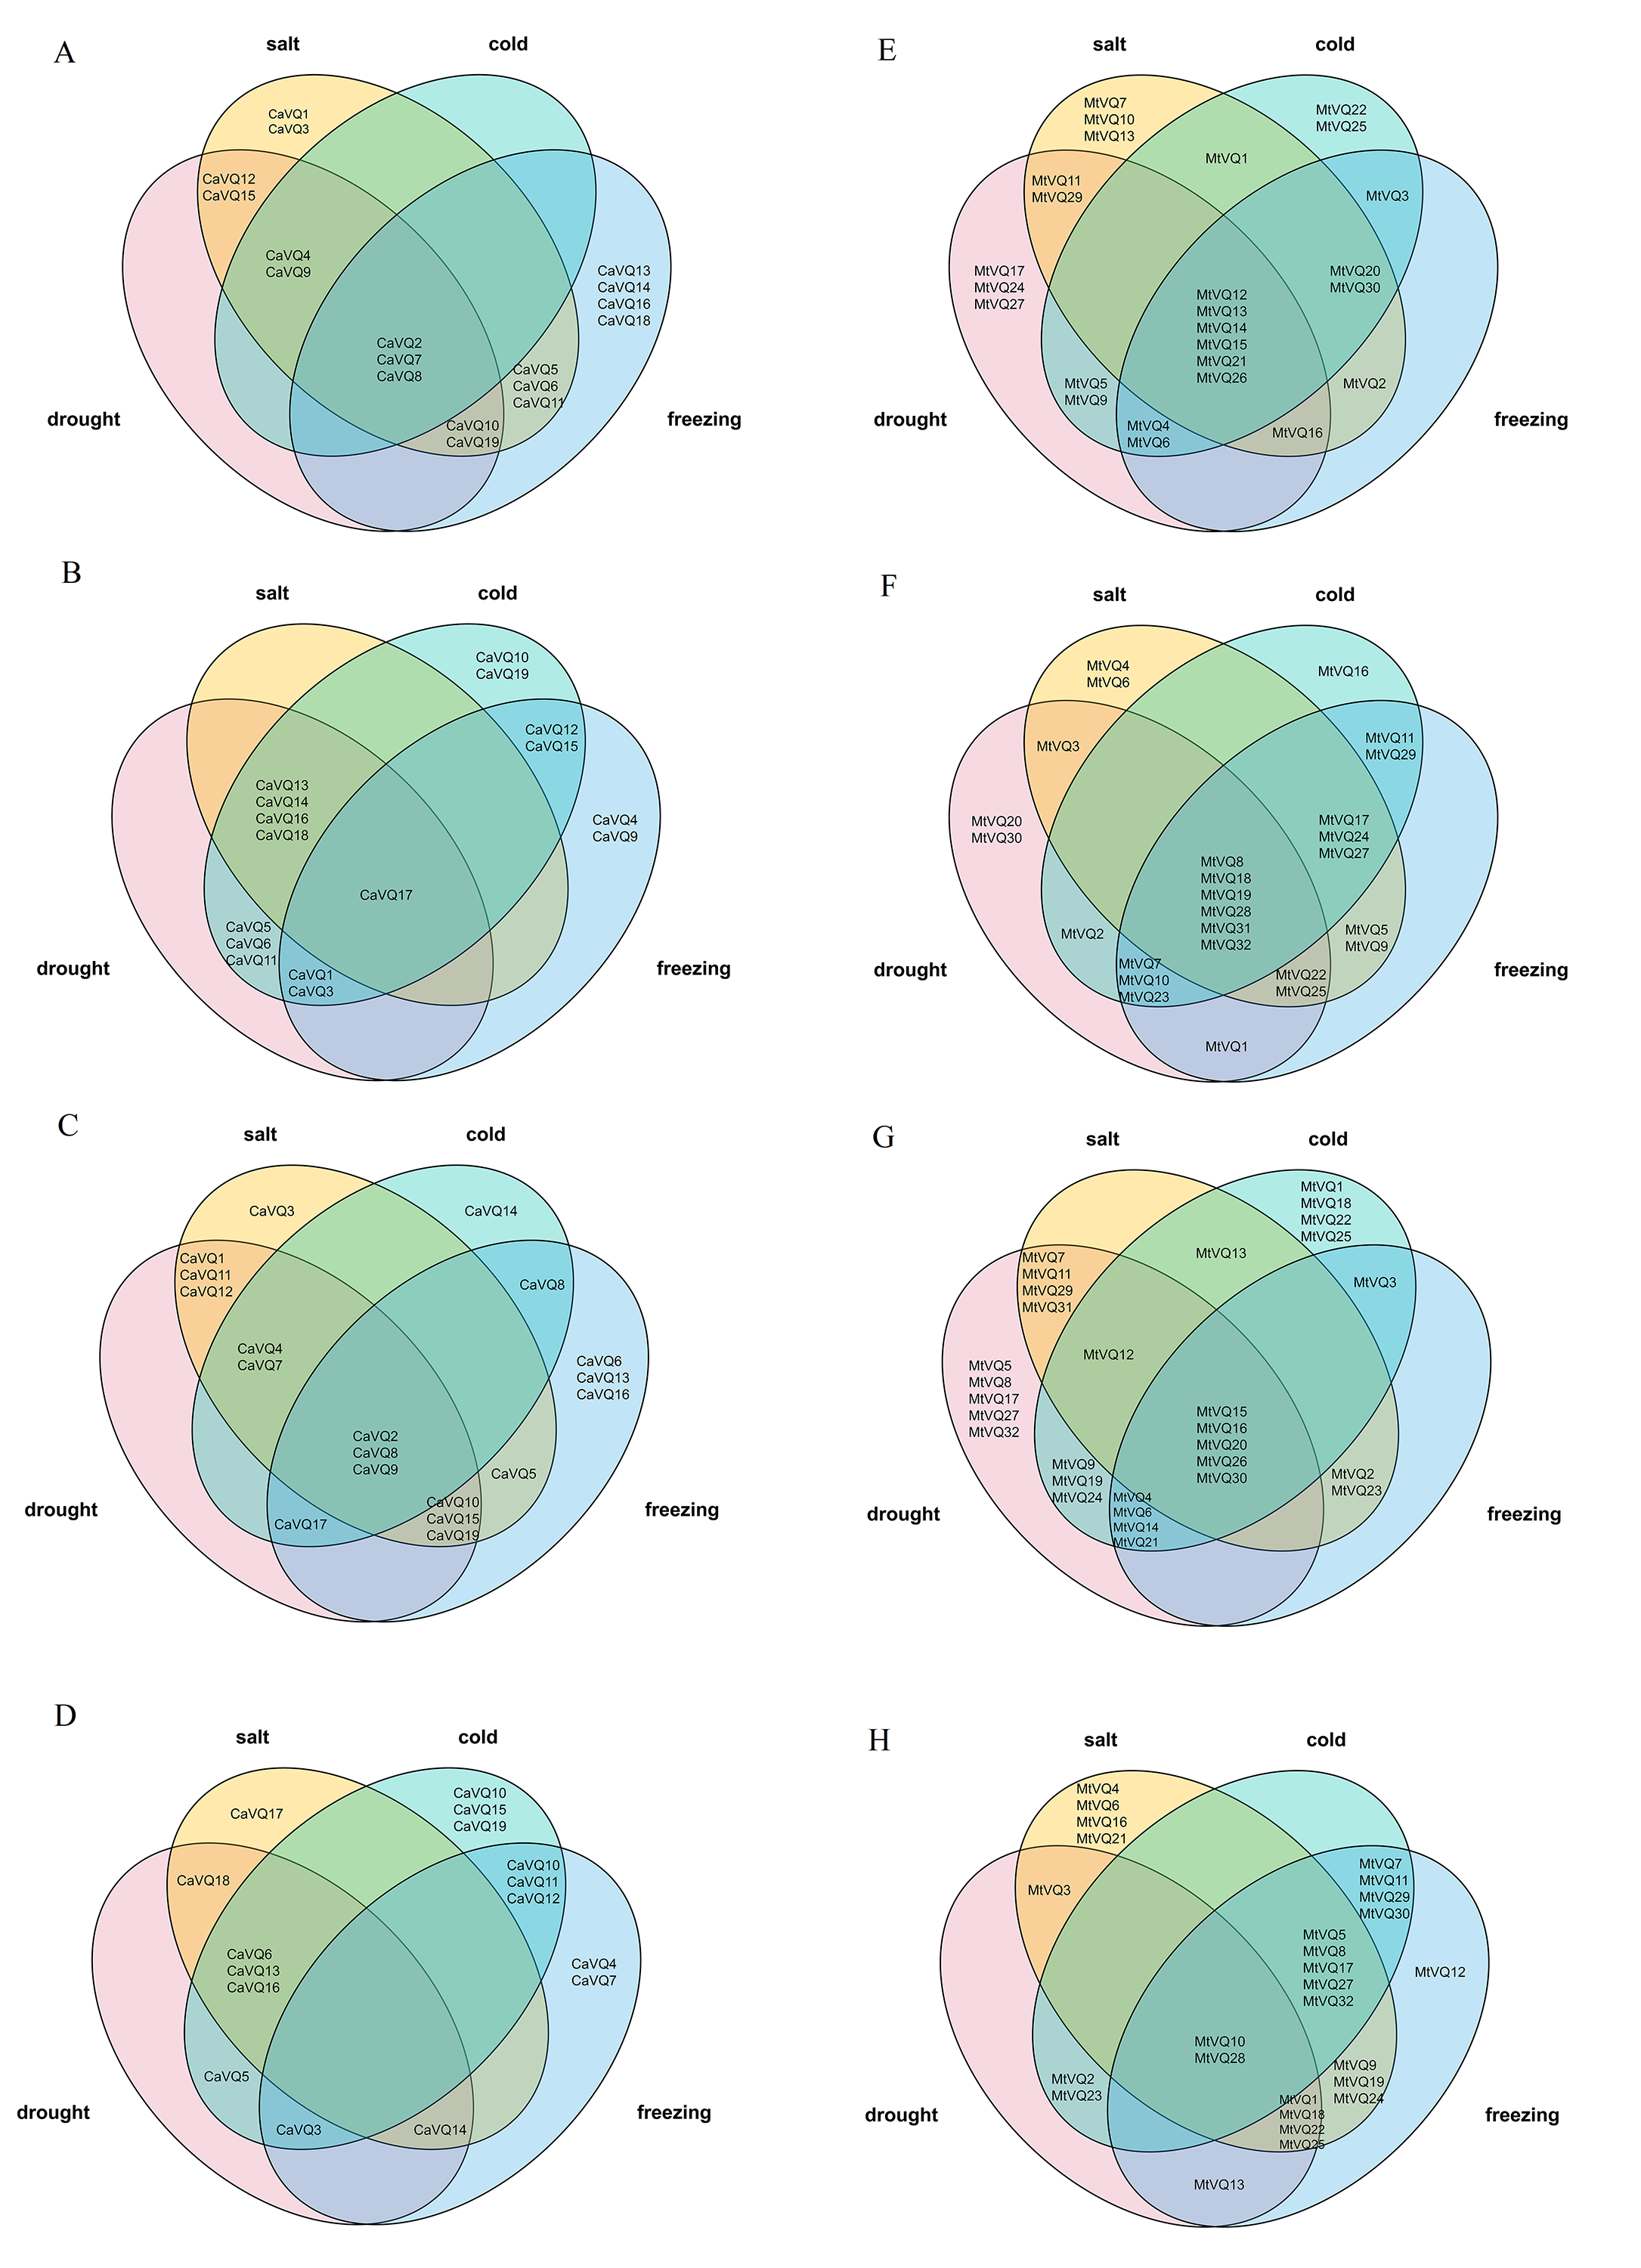
To explore the stress-specific distribution of the VQ gene family under four abiotic stresses (drought, salt, cold and freezing), we compared the gene expression similarly between C. arietinum and M. truncatula under a combination of all stresses, and the results are shown in Fig. S5. Some VQ genes were exclusively induced, and certain VQ genes were exclusively inhibited. Under four stresses, three CaVQ genes (CaVQ2, 7 and 8) were upregulated at all the time points; only CaVQ17 was downregulated at early time point but no gene was downregulated at late time point. six MtVQ genes (MtVQ12, 13, 14, 15, 21 and 26) were upregulated and six MtVQ genes (MtVQ8, 18, 19, 28, 31 and 32) were downregulated genes under all four stresses at early time points. At the same time, five MtVQ genes (MtVQ15,16,20,21 and 23) were exclusively induced and two MtVQ genes (MtVQ21 and 28) were repressed under all stresses at later time points.
Expression patterns of homologous genes under abiotic stresses
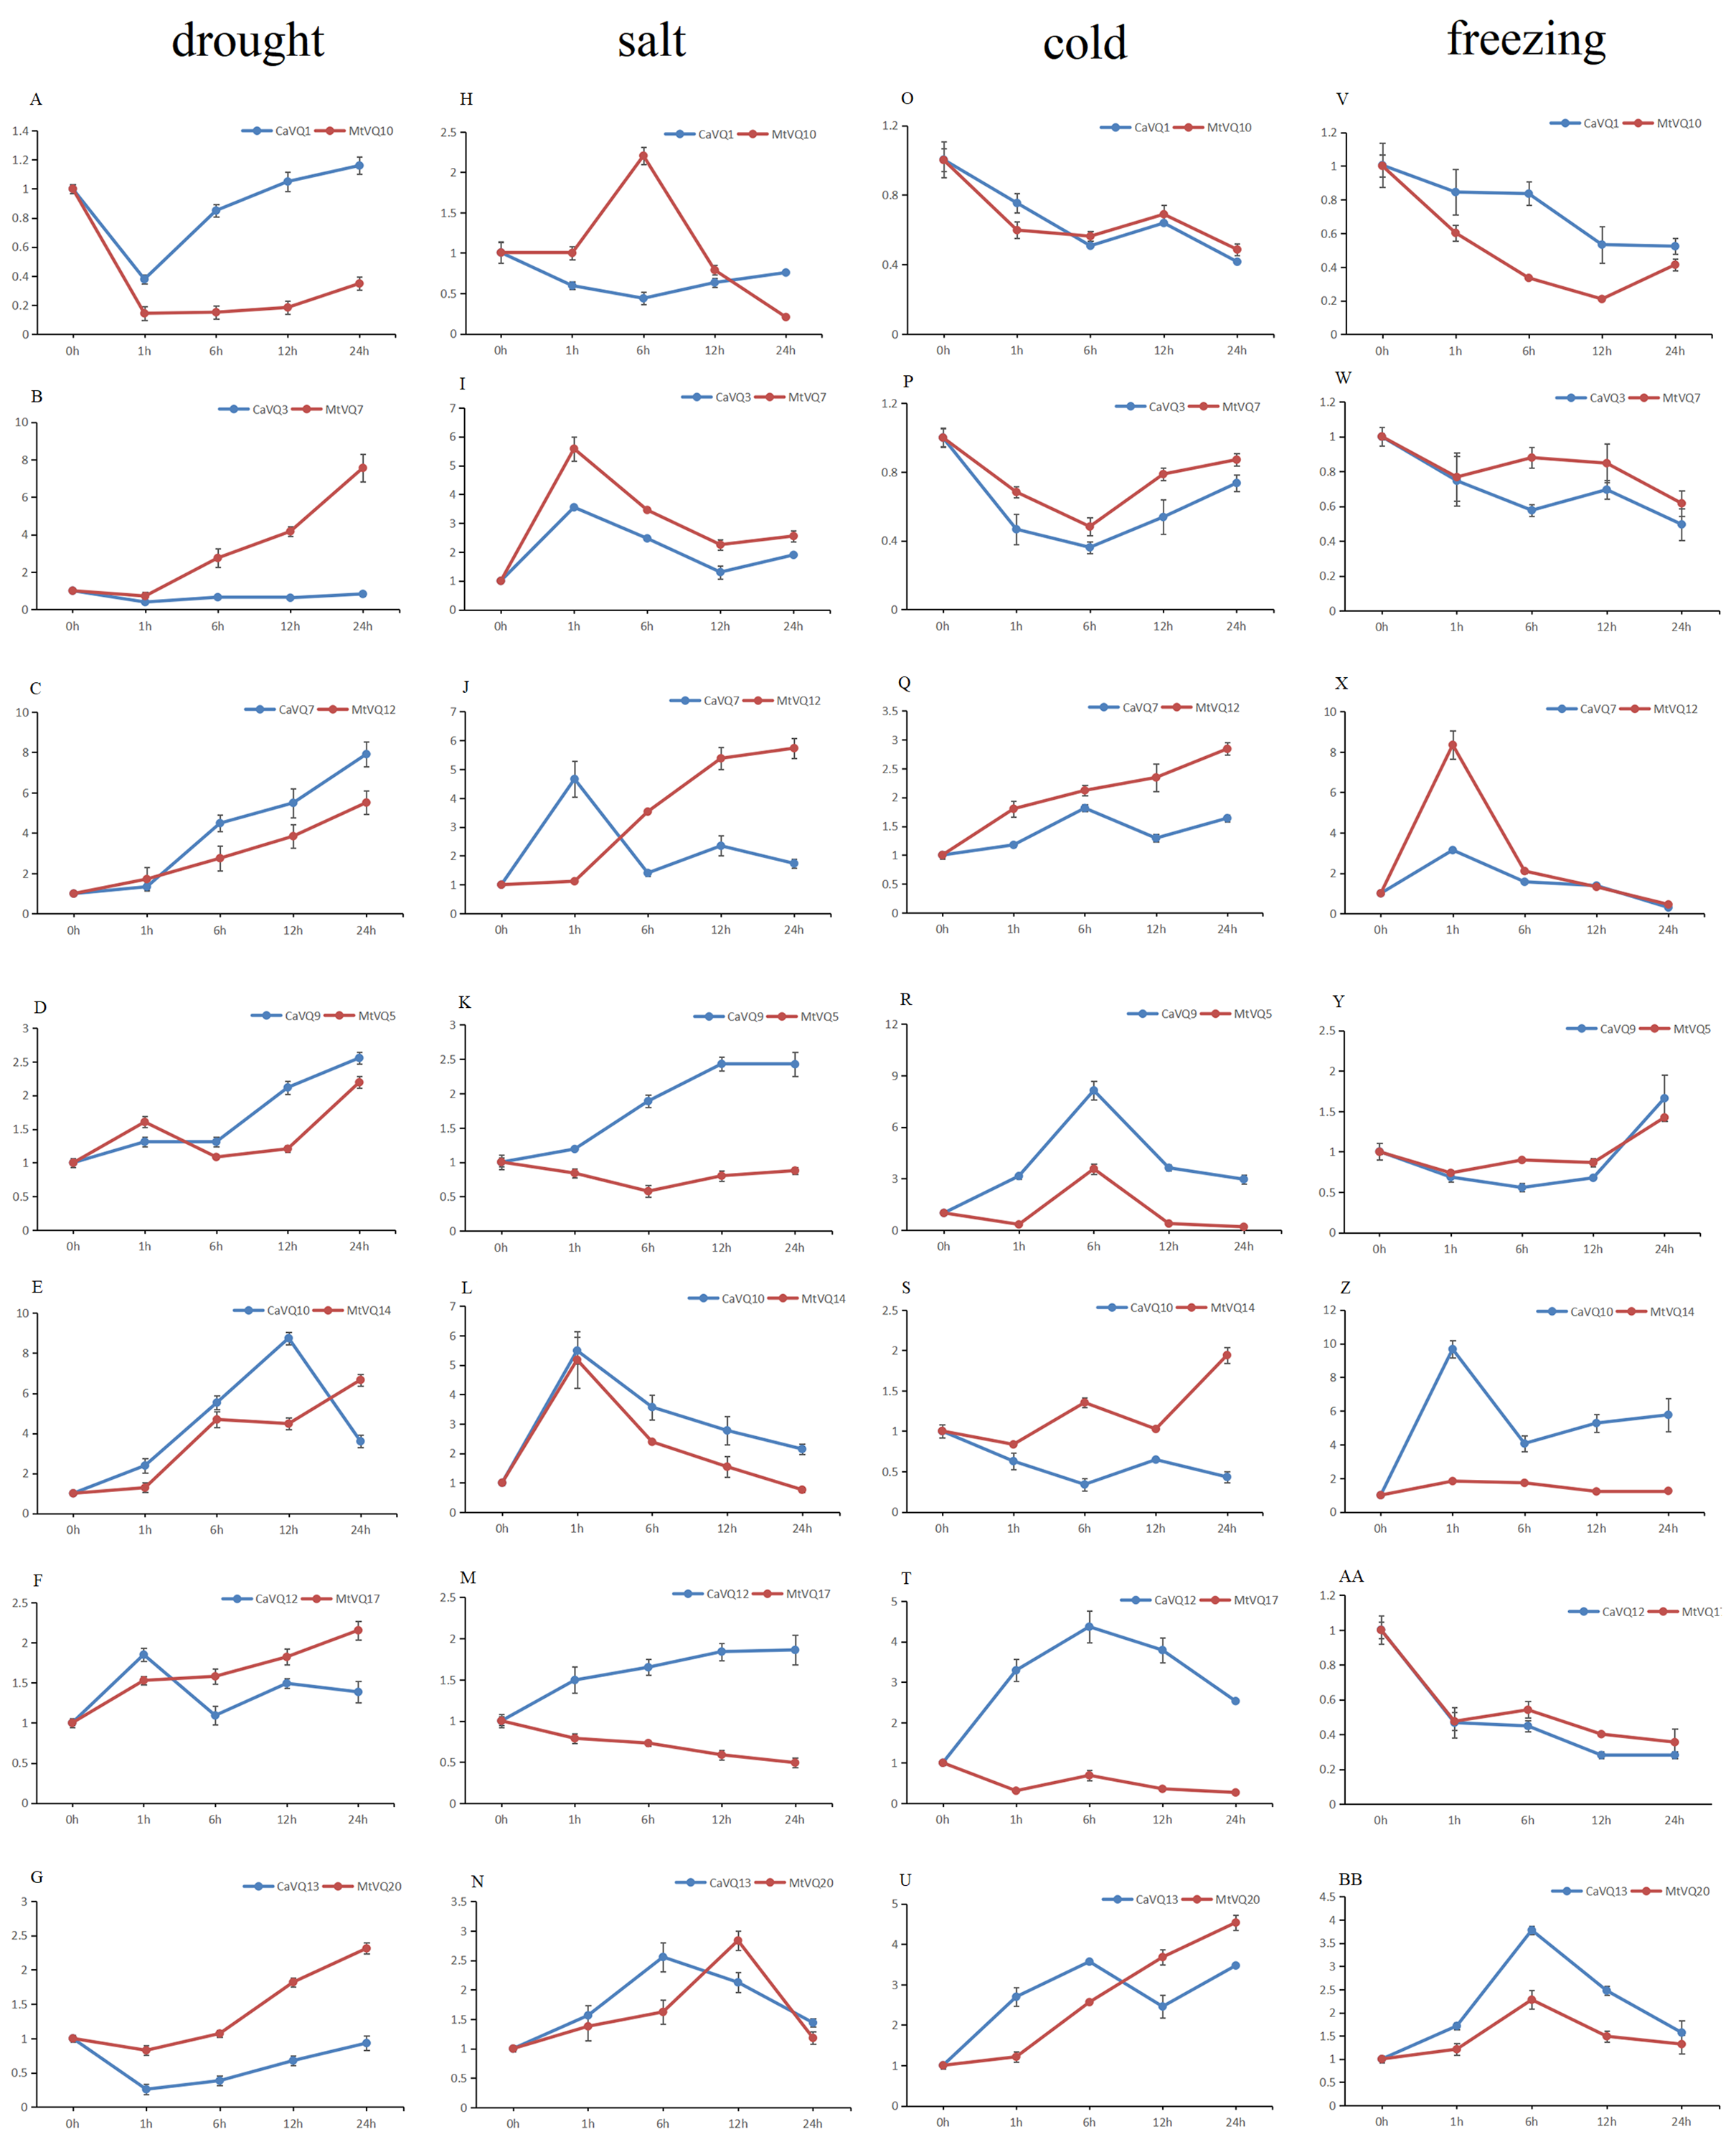
We found that most homologous genes between MtVQ and CaVQ genes showed the same expression patterns under abiotic stresses (Fig. S6). Under drought stress, five gene pairs (CaVQ1/MtVQ10, CaVQ7/MtVQ12, CaVQ9/MtVQ5, CaVQ12/MtVQ17 and CaVQ13/MtVQ20) showed similar expression patterns. Under salt stress, only three gene pairs (CaVQ3/MtVQ7, CaVQ10/MtVQ14 and CaVQ13/MtVQ20) showed similar expression patterns in C. arietinum and M. truncatula, while other gene pairs (CaVQ1/MtVQ10, CaVQ7/MtVQ12, CaVQ9/MtVQ5 and CaVQ12/MtVQ17) exhibited opposing expression patterns. The expression levels of most VQ gene pairs were increased at early time points during salt stress. Under cold stress, five gene pairs (CaVQ1/MtVQ10, CaVQ3/MtVQ7, CaVQ7/MtVQ12, CaVQ9/MtVQ5 and CaVQ13/MtVQ20) had the same expression pattern; however, CaVQ10/MtVQ14 and CaVQ12/MtVQ17 showed opposite expression patterns. Similarly, under freezing stress, most gene pairs showed the same expression patterns, among them, three gene pairs (CaVQ7/MtVQ12, CaVQ10/MtVQ14 and CaVQ13/MtVQ20) exhibited a trend of initially rising and then falling.
Discussion
VQ proteins are plant-specific proteins involved in the regulation of plant growth, development and responses to various environmental stresses in plants (Chu et al., 2016; Guo et al., 2018; Zhong et al., 2018; Cao et al., 2018). VQ genes have been identified in various plants, such as A. thaliana, O. sativa, Z. mays, G. max and V. vinifera (Kim et al., 2013a; Cheng et al., 2012; Zhou et al., 2016; Wang et al., 2015). Legumes, such as C. arietinum and M. truncatula, are widely cultivated and have high nutritional and economic value (Kim et al., 2013b; Cheng et al., 2012; Zhou et al., 2016; Wang et al., 2015). However, systematic analyses of VQ genes in C. arietinum and M. truncatula are lacking. Herein, a total of 19 and 32 VQ genes were identified in C. arietinum and M. truncatula, respectively. Although the genome size of C. arietinum is twice larger than that of M. truncatula, the number of VQ genes in M. truncatula is much larger than that in C. arietinum, indicating that a large number of CaVQ genes have been lost during evolution (Wang et al., 2017a). We systematically analysed the structural and functional characteristics of the CaVQ genes and MtVQ genes to explore their evolutionary relationships and provide a theoretical basis for further research.
CaVQ genes and MtVQ genes were closely related, based on the phylogenetic analyse, we found that the CaVQs and MtVQs were always clustered together. The gene structure analysis suggested that 94.74% (18/19 genes) of CaVQ genes and 90.63% (29/32 genes) of MtVQ genes did not contain introns. These results are consistent with the previous studies that reported the VQ genes in Z. mays (54, 88.5%) (Song et al., 2016) , O. sativa (37, 92.5%) (Kim et al., 2013a), and A. thaliana (30, 88.2%) (Cheng et al., 2012) without introns. While, a smaller number of moss VQ motif-containing genes (7/25, 28%) are not possess introns (Jing & Lin et al., 2015). Comparative these plants (higher plants C. arietinum, M. truncatula, A. thaliana, Z. mays, O. sativa, and lower plants, moss) indicate that most VQ genes have lost introns during the long evolutionary period. Based on the multiple sequence alignment, we found that there are four types in VQ domain of CaVQ and MtVQ proteins (LTG, FTG, LTC, VTG), however, there are six types of AtVQ proteins (LTG, LTS, LTD, FTG, VTG, YTG) (Cheng et al., 2012) and four types of OsVQ proteins (ITG, LTG, VTG, FTG) (Kim et al., 2013a) in previous studies. Except these, we found that a unique and conserved sequence “FxxxVQxLTC” in four VQ proteins (MtVQ17-19 and CaVQ12). The conserved motif analysis showed that CaVQ genes and MtVQ genes were very closely related. Both CaVQ genes and MtVQ genes showed similar motif patterns in the same groups, such as motif 2 and motif 7 were specifically exist in all members of group IV and II, respectively. These results suggest that CaVQ and MtVQ genes may originate from a common ancestor.
Segmental and tandem duplication events are major expansion methods in the plant genome (Storz, 2009; Kaltenegger, Leng & Heyl, 2018). In the MtVQ gene family, 6 gene pairs originated from segmental duplication and 4 gene pairs were involved in tandem duplication. These results are similar to those found in Brassica rapa and pears (Cao et al., 2018; Zhang et al., 2015), suggesting that segmental duplication events are a common expansion mechanism in the VQ gene family. For gene pairs originating from tandem duplication, they all formed gene clusters on M. truncatula chromosomes. However, we did not identify gene duplication event in CaVQ genes. Furthermore, we noticed that there were a large number of orthologous gene pairs in CaVQ and MtVQ genes, which is consistent with the results that C. arietinum and M. truncatula were closely related based on the phylogenetic analysis. The substitution rates of Ka and Ks are the basis for analysing the selection pressure in gene duplication events (Wang et al., 2010b). We found that the Ka/Ks values of most gene pairs were <1, suggested that they had primarily evolved under purifying selection. During evolution, C. arietinum and M. truncatula common experienced whole genome triplication (γ event) at 130 MYA and whole genome duplication (β-event) at 59 MYA, and the differentiation time between them was approximately 30–54 MYA (Wang et al., 2017a). However, the differentiation time of the VQ gene pairs in C. arietinum and M. truncatula was approximately 110–190 MYA. These results indicate that the time of gene differentiation is earlier than that of C. arietinum and M. truncatula differentiation, the VQ gene show high intraspecific polymorphism. Except these, the differentiation time of paralogous gene pairs in M. truncatula was about 3–25 MYA, which were later than the time of species differentiation (Wang et al., 2017a).
In higher plants, the VQ gene family has critical functions in the process of plant growth, development and response to multiple stresses. In the whole period of pear fruit development, most PbrVQ genes are expressed and can play critical roles in pear fruit development (Cao et al., 2018). In bamboo, 11 VQ genes are highly express in leaf, early panicle, advanced panicle, root and rhizome tissue, and they are lowly express in shoot (Wang et al., 2017b). In this study, based on silico analysis, the VQ genes exhibited tissue-specific expression in both C. arietinum and M. truncatula. We found that six MtVQ genes and four CaVQ genes were specifically highly expressed in root and nodule, these results are similar to that in soybean: nine and ten GmVQ genes are specifically express in root and nodule, respectively (Wang et al., 2014). We speculate that they may be involve in root and nodule formation and development. There were six VQ genes (CaVQ8, CaVQ18, MtVQ10, MtVQ5, MtVQ14, MtVQ26) were highly expressed in flowers, GmVQ43 and GmVQ62 affect flowering time of plants, we speculate that these VQ genes may involve in regulate flowering time and flower development (Zhou et al., 2016). Some orthologous gene pairs showed similar expression patterns in different tissues. For instance, CaVQ3/MtVQ7 was highly expressed in the nodule and root and CaVQ8/MtVQ26 was highly expressed in all examined tissues. However, the CaVQ5/MtVQ3 gene pair had different expression patterns, with CaVQ5 highly expressed in six tissues and MtVQ3 expressed only in the root. These results suggest that some gene pairs retained similar functions while others produced functional differentiation during the process of evolution (Zhong et al., 2018).
In previous study, the VQ gene family is found to be involve in responses to multiple stresses (Cai et al., 2019). Certain PbrVQ genes were shown to be highly expressed under GA (Gibberellic acid, GA), salt and black spot disease stresses (Cao et al., 2018). In this study, five CaVQ genes (CaVQ2, 4, 7, 9, and 15) and eight MtVQ genes (MtVQ4, 5, 9, 12, 14, 17, 27, and 29) significantly upregulated during drought stress, which results are similar to the OsVQ genes that twenty-two OsVQ genes are upregulated under drought stress (Kim et al., 2013a). Under salt stress, eight CaVQ genes (CaVQ3, 7, 8, 10, 13, 14, 17 and 19) and four MtVQ genes (MtVQ7, 10, 14 and 21) were significantly induced. In the A. thaliana, similar expression changes among VQ genes were also observed, including the expression of AtVQ9 and AtVQ15 that changed significantly under salt stress (Cheng et al., 2012). In addition, the VQ genes are also sensitive to temperature changes. Seven CaVQ genes (CaVQ7, 8, 9, 11,12, 13 and 15) and eleven MtVQ genes (MtVQ1, 4, 6, 9, 12, 13, 15, 20, 21, 22 and 25) were rapidly upregulated at early time point under cold treatment. Six CaVQ genes (CaVQ2, 7, 13, 14, 18 and 19) and five MtVQ genes (MtVQ12, 16, 20, 21 and 30) were upregulated at early time point (1 h or 6h) for the case of freezing treatment. Similar results have been reported in Chinese cabbage that VQ genes are quickly responsive to heat and cold stresses (Zhang et al., 2015). We speculate that VQ genes can respond to various abiotic stresses both in C. arietinum and M. truncatula. By combining promoter analysis with qRT-PCR analysis, we found that VQ genes were responses to multiple abiotic that might be closely related to their promoters. For example, CaVQ13 and MtVQ26 which contained cis-elements (LTR) involved in low temperature responsiveness, all of them showed upregulated expression both under cold and freezing stresses. Oppositely, four VQ genes (CaVQ3, CaVQ4, CaVQ8 and CaVQ9) contained LTR elements and they were downregulated during cold and freezing stresses. Furthermore, CaVQ5, MtVQ18, MtVQ22 and MtVQ25, which have TC-rich repeats that can participate in response defence and stress, they were showed downregulated expression patterns in drought and salt stresses. The expression patterns of most orthologous gene pairs are similar while others are different. For instance, three gene pairs (CaVQ3/MtVQ7, CaVQ10/MtVQ14 and CaVQ13/MtVQ20) showed similar expression patterns in C. arietinum and M. truncatula, while other gene pairs (CaVQ1/MtVQ10, CaVQ7/MtVQ12, CaVQ9/MtVQ5 and CaVQ12/MtVQ17) exhibited opposing expression patterns during the salt stress. These results indicate that the orthologous gene pairs in different plants may undergo functional differentiation in the long-term evolution process that they may have distinct regulatory mechanisms under various abiotic stresses (Jiang, Sevugan & Ramachandran, 2018). Hence, the expression of most CaVQ and MtVQ orthologous gene pairs have undergone functional divergence, indicating that these gene pairs originate from a common ancestor and they are involve in functional redundancy, while other gene pairs are involve in neo-functionalization or sub-functionalization (Sandve, Rohlfs & Hvidsten, 2018). Taken together, our study suggests that a system analysis of the evolutionary relationship, structure and response to various abiotic stresses may help to elucidate the CaVQ and MtVQ genes for further functional characterization.
Conclusions
In conclusion, this study provides the first comprehensive and systematic analysis of the VQ gene family in two legumes (C. arietinum and M. truncatula). A total of 19 and 32 VQ genes were identified in C. arietinum and M. truncatula, respectively. All VQ genes fell into eight groups (I-VIII). The VQ genes from the same evolutionary branches shared similar motifs and structures, these results suggested that the VQ genes of C. arietinum and M. truncatula might originate from a common ancestor. The selection pressure analysis showed that most homologous pairs were under strong purifying selection by the VQ genes. In silico analyses revealed that most VQ genes exhibited tissue-specific expression patterns, indicating that they might play crucial roles in different tissues. Finally, qRT-PCR analysis showed that the VQ gene family was responsive to abiotic stresses. The results indicating that the VQ genes not only participates in regulating plant growth and development, but also responds to abiotic stresses. Our results provide a theoretical basis for the further study of VQ gene functions.
Supplemental Information
Sequence logo of motifs in CaVQ and MtVQ genes
The font size represents the frequency of the respective amino acid.
Multiple sequence alignment, gene structure and multiple motifs of CaVQ and MtVQ proteins
Amino acids that are conserved throughout are shaded in different colors.
Exon/intron structures of VQ genes
UTR are in green boxes and CDS are in yellow boxes.
Number of each cis-acting element in the promoter region (1.5 kb upstream of the translation start site) of CaVQ and MtVQ genes
Venn diagram represented stress-specific distribution of CaVQs and MtVQs
They were into 4 categories: (A) and (E) early up-regulated, (B) and (F) early down-regulated, (C) and (G) late up-regulated and (D) and (H) late down-regulated, respectively.
Expression levels of homologous VQ genes under abiotic stresses
A-BB represent the expression levels of different gene pairs.