
Up-regulation of cryptochrome 1 gene expression in cotton bollworm (Helicoverpa armigera) during migration over the Bohai Sea
- Published
- Accepted
- Received
- Academic Editor
- Joseph Gillespie
- Subject Areas
- Agricultural Science, Developmental Biology, Entomology, Genetics
- Keywords
- Migration, Helicoverpa armigera, Cryptochromes, Transcripts, Expression analysis
- Copyright
- © 2019 Yang et al.
- Licence
- This is an open access article distributed under the terms of the Creative Commons Attribution License, which permits unrestricted use, distribution, reproduction and adaptation in any medium and for any purpose provided that it is properly attributed. For attribution, the original author(s), title, publication source (PeerJ) and either DOI or URL of the article must be cited.
- Cite this article
- 2019. Up-regulation of cryptochrome 1 gene expression in cotton bollworm (Helicoverpa armigera) during migration over the Bohai Sea. PeerJ 7:e8071 https://doi.org/10.7717/peerj.8071
Abstract
Cryptochromes (CRYs) are flavoproteins and play a pivotal role in circadian clocks which mediate behavior of organisms such as feeding, mating and migrating navigation. Herein, we identified novel transcripts in Helicoverpa armigera of six isoforms of cry1 and seven isoforms of cry2 by Sanger sequencing. Phylogenetic analysis showed that the transcripts of cry1 and cry2 align closely with other insect crys, indicating within-species divergence of Hacry. A dn/ds analysis revealed that the encoding sequence of the cry1 was under purifying selection by a strong negative selection pressure whereas the cry2 was less constraint and showed a less strong purification selection than cry1. In general, Hacrys were more abundantly transcribed in wild migrating populations than that in laboratory maintained populations, and expression of the cry2 was lower than cry1 in all samples tested. Moreover, when compared with the migrating parental population, offspring reared in laboratory conditions showed a significant reduction on transcription of the cry1 but not cry2. These results strongly suggest that cry1 was more related to the migration behavior of H. armigera than cry2.
Introduction
Cryptochromes (CRYs) genes were firstly characterized in Arabidopsis thaliana L. and then found in a wide range of organisms including animals and bacteria (Ahmad & Cashmore, 1993; Lin & Todo, 2005). According to their phylogenetic analysis, CRYs from different organisms can be divided into three subclasses: plant CRYs, animal CRYs and CRY-DASH (Selby & Sancar, 2006; Lin & Todo, 2005; Daiyasu et al., 2004). As receptors for blue and ultraviolet (UV-A) light, plant and animal CRYs mediate many light-dependent responses such as flowering in plants and circadian rhythms in animals (Emery et al., 1998; Griffin, Staknis & Weitz, 1999; Guo et al., 1998). Generally, CRYs have a high degree of sequence affinity to the members of DNA photolyase but do not possess any function on double-strand DNA repair, except for CRY-DASH, which is found in many organisms except for insects and has a single-stranded DNA-specific photolyase activity (Selby & Sancar, 2006).
In insects, two forms of CRYs, Drosophila-type CRY (CRY1, acting as a photoreceptor) and mammalian-type CRY (CRY2, acting as a transcriptional repressor), represent three kinds of circadian clocks: type 1, containing only CRY1 as in Drosophila; type 2, containing only CRY2 as in species from Hymenoptera and Coleoptera and type 3, containing both CRY1 and CRY2 as in mosquito and species in Lepidoptera (Zhu et al., 2005, 2008; Yuan et al., 2007; Wang et al., 2013; Chang et al., 2019). Besides the regulation of circadian clocks, CRY proteins are also well-known for time-compensated sun compass navigation, such as in the monarch butterfly and Drosophila etc. (Zhu et al., 2008; Merlin, Gegear & Reppert, 2009; Yoshii, Ahmad & Helfrich-Forster, 2009; Marley et al., 2014; Bazalova et al., 2016). Differently to diurnal butterflies and Drosophila, most moths are nocturnal. Cry genes have been reported in several moth species (Yuan et al., 2007; Chang et al., 2019). The cotton bollworm, Helicoverpa armigera (Lepidoptera: Noctuide), is one of the most important long-distance migratory agricultural pests in China (Wu & Guo, 2005; Feng et al., 2003, 2004, 2005, 2009). Every year, the first generation of the cotton bollworm emerges in late June feeding on wheat in northern China (especially Shandong, Hebei, and Henan Provinces) and then the adults migrate to the northeast (Liaoning Province, China), where they reproduce one or two generations and the offspring migrates back to the southern China for overwintering (Wu, Xu & Guo, 1998; Feng et al., 2005; Wu & Guo, 2005; Wu et al., 2001). Recently, two types of CRYs were reported in H. armigera, named Hacry1 and Hacry2, respectively (Yan et al., 2013).
Herein, we identified several novel isoforms of cry gene transcripts from H. armigera. We also investigated mutation and expression patterns of these genes with interests in: (1) evolutionary selection pressure acting on the two types of cry genes, and (2) comparison of transcription patterns between migrating and non-migrant cotton bollworms to obtain evidence whether CRYs are related to the migrating behavior in H. armigera.
Materials and Methods
Insects and culture conditions
Migrating adult cotton bollworms (CD) were captured in different months in 2011 by a vertical pointing trap, on Beihuang Island in Bohai sea in Shandong province (38°23.200′N, 120°54.500′E). There were no local individuals of this species (Feng et al., 2003, 2004, 2005). Trapped insects were collected every 3 h starting at 18:00 pm (Beijing time) and were directly stored in liquid N2. The population of LF (originally captured in Langfang, Hebei province, in 2005) was used as control and reared in laboratory at 25 °C with a light (L):dark (D) photoperiod of 14 h:10 h. These control insects were 3rd day post eclosion adults exposed to natural light cycles in July 2011. To investigate the influence of heredity on Hacrys expression, offspring of CD were reared in laboratory (population CDF3) and collected at 15:00 pm under natural light using 3rd day post eclosion adults in August 2011.
Additional three laboratory reared populations were used for obtaining Hacrys expression profiles in different population (Population-96s, captured in Xinxiang, Henan province, in 1996; Population-1463, captured in Xiajin, Shandong province, in 2004; Population-XXF1, captured in Xinxiang, Henan province, in 2011). Except for studying the developmental stages, all insects reared in lab were the 3rd day instar adults under natural light.
Cloning of full length Hacry gene transcripts
Total RNA was isolated from H. armigera using TRIzol reagent (Invitrogen, Carlsbad, CA, USA); cDNA was synthesized using oligo(dT) and M-MLV Reverse Transcriptase (Promega, Madison, WL, USA). To identify transcripts of cry genes in H. armigera, degenerate primers based on insect cry genes (including Hacry1 (GenBank no.: GQ896502) and Hacry2 (GQ896503)) were used to amplify partial segments of Hacry gene transcripts by nested RT-PCR (Table S1), using the following PCR program: 30 s at 94 °C, 30 s at 55 °C, and 60 s at 72 °C for 40 cycles. To obtain complete transcript sequences of the Hacry genes, 5′ and 3′ RACE (Rapid Amplification of cDNA Ends) were performed using the SMART RACE cDNA Amplification Kit (Clontech, Palo Alto, CA, USA) with gene specific primers (Table S1).
To avoid possible artifacts, specific primers amplifying the complete ORFs (open reading frames) of Hacrys were designed according to the RACE results (Table S1). PCR program using the cDNA templates was: 30 s at 94 °C, 30 s at 55 °C, and 150 s at 72 °C for 40 cycles. PCR products were purified, cloned into the pEASY-T Cloning Vector (TransGen, Beijing, China). Positive clones of plasmids of Hacry were purified and sequenced by using Sanger sequencing.
Sequence alignment and phylogenetic analyses
Percentage identities of the nucleotide and amino acid sequences were calculated using CLUSTAL W program (Thompson, Higgins & Gibson, 1994). The longest obtained sequences of cry1 (Hacry1-4) and cry2 (Hacry2-6) were selected to use together with the other insect cry1s and cry2s to determine selection pressures (Table S2).
The sequences were aligned and phylogenetically analyzed using maximum likelihood (ML) methodology implemented in RAxML 7.3.2 (Stamatakis, 2006) under the GTR + G substitution model. For estimating nodal support, nonparametric bootstrap proportions (Felsenstein, 1985) with 1,000 pseudoreplicates were used. For the phylogenetic inference, we divided the dataset into three partitions according to codon position in each gene (1st/2nd/3rd codon). The multiple partitions controlled for heterogeneity across dataset, such as variation in substitution rates. Three replicates were conducted for each analysis to assess whether runs failed to converge upon the optimal posterior distribution and whether likelihood values, branch lengths, tree topology or posterior probabilities differed among runs. We made two kind of trees. One contained only butterfly, moth and outgroup for selection analysis, and another one contained much more insect species for phylogenetic purpose.
Branch and Branch-site test of selection
Selection can promote the evolution of sensory systems and make organisms to adapt to local ecological conditions. To investigate the potential signal of positive selection acting on the cry genes between nocturnal moths and diurnal butterflies, Maximum Likelihood approach (Nielsen & Yang, 1998) was employed to test for differences in selection pressure, using the CODEML program of PAML version 4.5 (Yang, 1997). Branch models and branch-site models were employed to detect positive selection on the lineages. These tests of selection were phylogeny-based tests with requirements of unrooted input-trees. The RAxML trees mentioned above were converted to unrooted trees. For branch models, five hypotheses were evaluated: (1) one dn/ds ratio for all branches; (2) dn/ds ratio = 1 for all branches; (3) moth lineage and butterfly lineage have different dn/ds ratio (ω2 and ω1); (4) neutral evolution for moth (ω2 = 1); and (5) the free-ratio model with free dn/ds ratio for each branch. For branch-site modes, the moth lineage was defined as foreground, and the rest lineages were defined as background branch, which were specified in the tree file by using branch labels. Likelihood ratio test (LRT) was used to investigate if the alternative model, indicating positive selection, was superior to the null model.
To investigate non-synonymous mutations within Hacry1 and Hacry2, we calculated the average dn/ds ratio under one ratio model in PAML. In this analysis, all the detected isoforms of the cry1 and cry2 transcripts were used.
Real-time PCR analysis
With β-actin (GenBank accession no.: X97614) as the reference gene, Real-time PCR (qPCR) reactions were carried out with the first strand cDNAs using the TaqMan method in 20 μl reaction agent comprised of one μl of template cDNA, 2*Premix Ex Taq™ (Takara, Kusatsu, Japan), 0.2 μM each primer and 0.4 μM probe (Table S1) on a 7500 Fast Real-time PCR System (Applied Biosystems, Foster City, CA, USA). Thermal cycling conditions were: 45 cycles of 95 °C for 15 s, 60 °C for 34 s. cDNA sample of each group was replicated three times. At least three groups of individuals were tested for each data-point. Fold differences of Hacry1 or Hacry2 transcripts were calculated according to the 2–ΔΔCT method (Livak & Schmittgen, 2001).
Statistical analysis
Statistical analyses were conducted using the STATA package (version 9.0) and GraphPad InStat 3 (GraphPad Software, Inc., San Diego, CA, USA). The Student’s t-test and/or ANOVA were used to determine the significant differences.
Results
Transcripts of cry genes in H. armigera
By RT-PCR and RACE method, the complete sequences of cry1 and cry2 gene transcripts with variable 5′ and 3′ end sequences were obtained from H. armigera (Fig. 1). BLAST searches performed at NCBI revealed that these Hacry transcripts were highly similar to cry1 or cry2 from the other insects, respectively. The encoding nucleotide sequences of the cry1 of H. armigera displayed homology of 91–99.8% with each other whereas the cry2 encoding sequences displayed much more polymorphisms including large deletions (Tables S3 and S4; Fig. 1; Fig. S1). All deduced amino acid sequences of the cry1 contained fragments of the C-terminal extension (CCE) and the conserved photolyase homology region (PHR) which included a flavin adenine dinucleotide (FAD) domain and an additional pterin derivative domain (methenyltetrahydrofolate, MTHF) (Fig. 1; Fig. S1). However, Hacry2-1, Hacry2-2, Hacry2-3 and Hacry2-4 lacked a complete PHR encoding region (Fig. 1; Fig. S1).
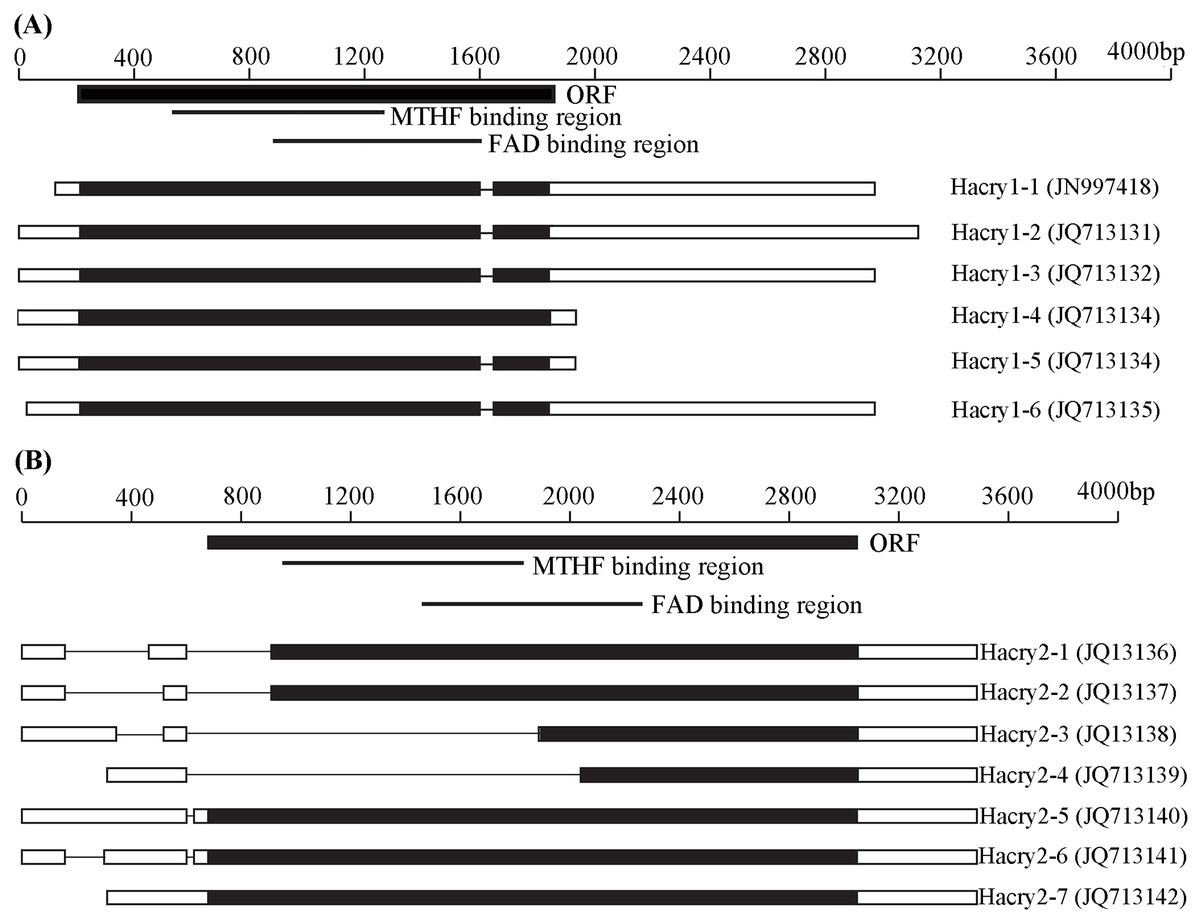
Figure 1: Transcripts of Hacry1 (A) and Hacry2 (B) in H. armigera.
“■” Stands for the open reading frame (ORF) region. “□” stands for untranslated region (UTR). “-” stands for gap. The conserved MTHF and FAD binding regions were shown on the top. The names and GenBank accession numbers of transcripts were shown on the right.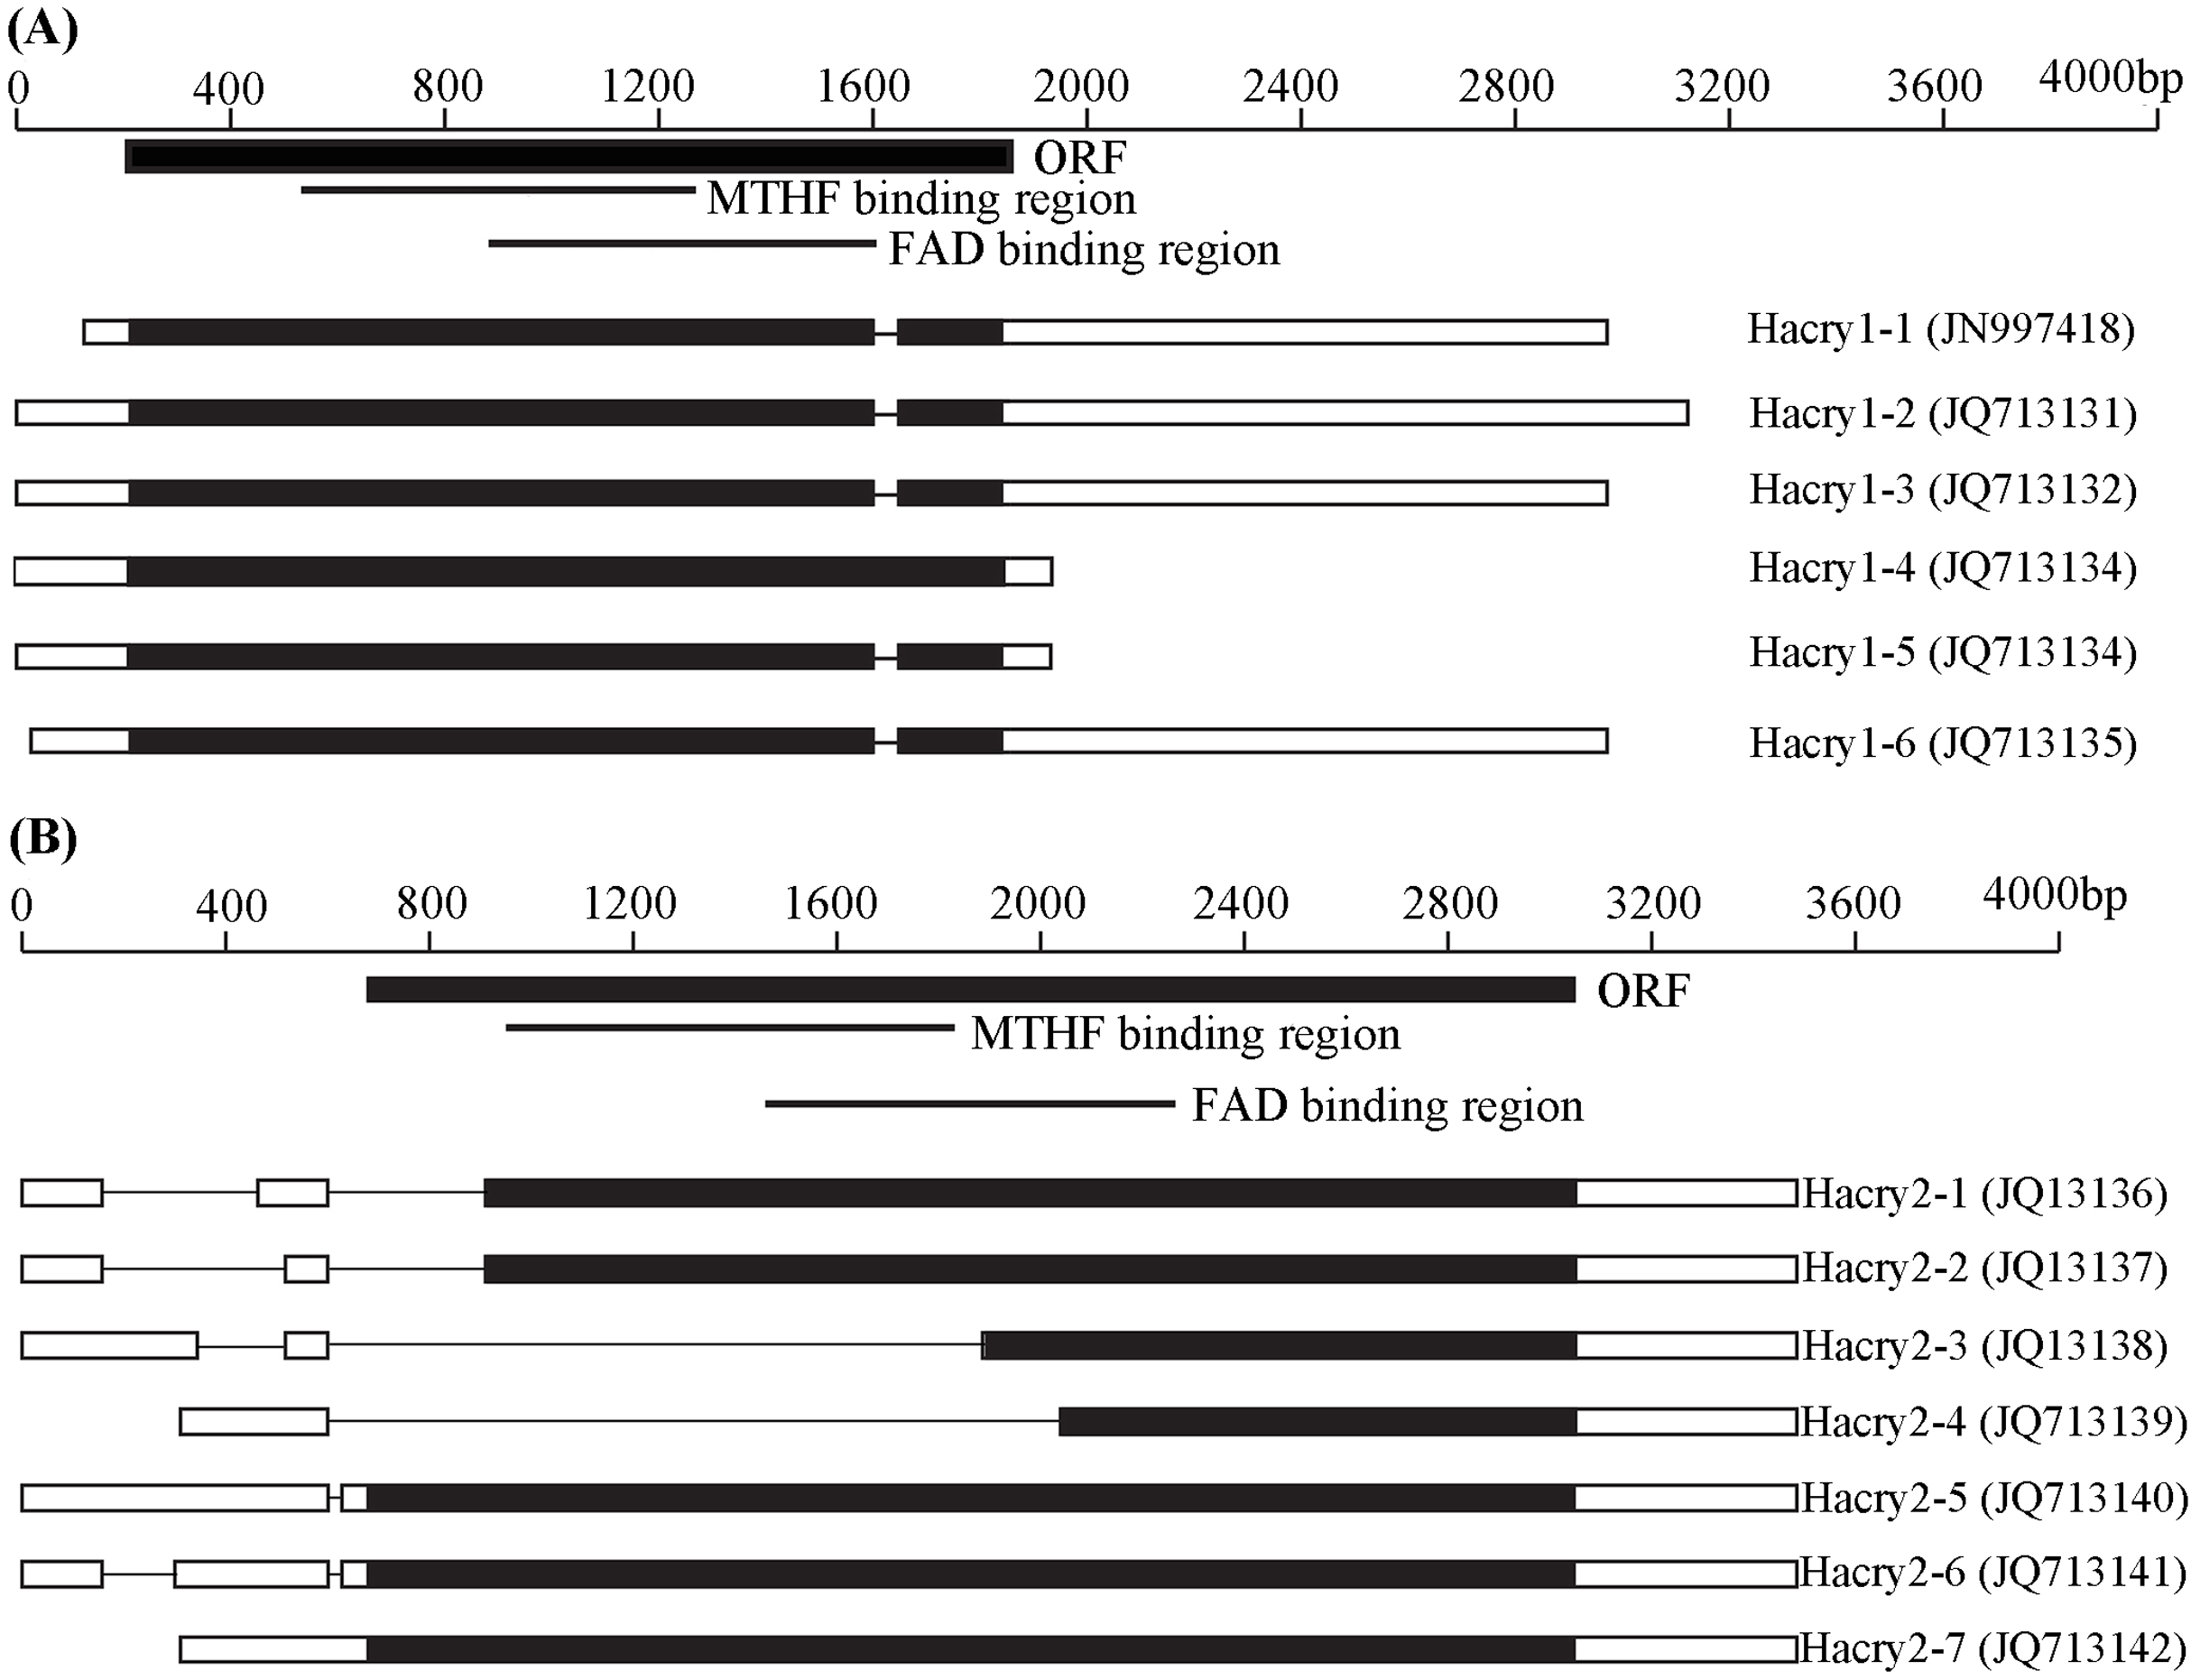
Phylogenetic analysis and selection pressure
Tree based analysis indicated that transcripts of cry1 and cry2 cloned in our study clustered with the one from species in Lepidoptera (Fig. 2). The free-ratio model provided a better fit for the two cry genes than the other four models. No significant differences in dn/ds were detected between the clades of moths and butterflies (Table 1). The branch-specific ω values of moths were 0.0287 and 0.0219 for cry1 and cry2, respectively. The corresponding ω values of butterflies were 0.0409 and 0.0130, respectively (Fig. 2). Interestingly, for cry1, the dn/ds ratio of moths was lower than that of butterflies, suggesting increased constraint on nonsynonymous substitutions. In contrast, for cry2, the dn/ds ratio of moths was much higher than that of butterflies. This suggested that the moth cry2 genes might have accumulated higher proportion of nonsynonymous mutations than the butterfly cry2 in the evolutionary history, suggesting a less strong purification selection than cry1. However, no positive selection could be detected by PAML.
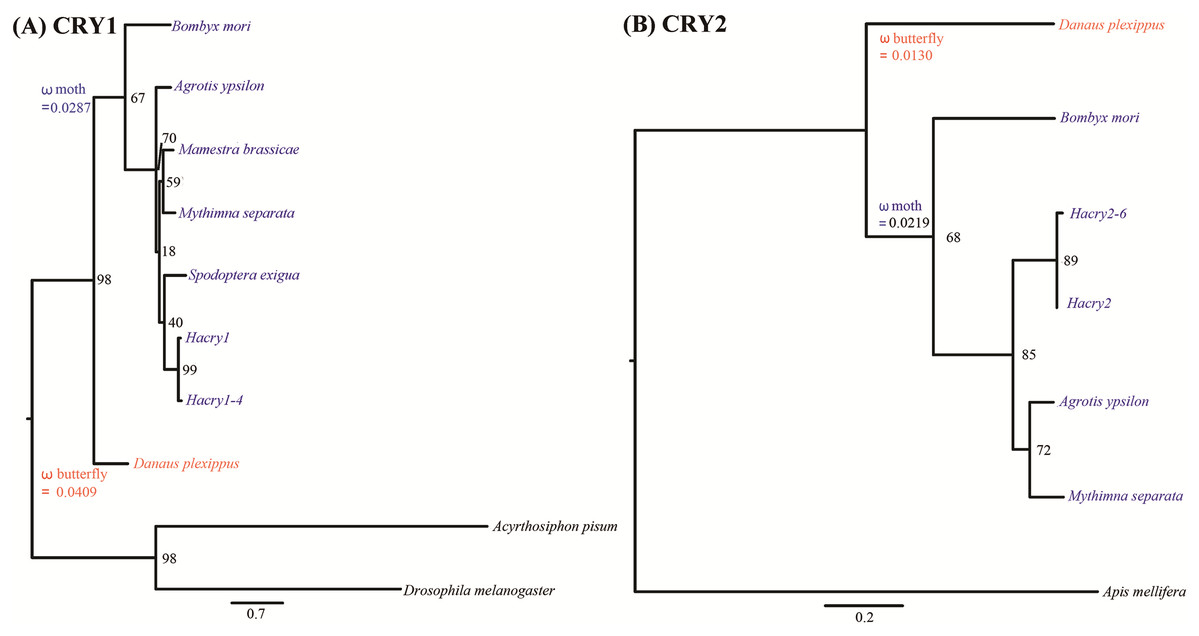
Figure 2: Phylogenetic reconstruction of cry genes in species from Lepidoptera based on maximum likelihood.
(A) Tree based analysis of cry1 genes using the ones of Drosophila melanogaster and Acyrthosiphon pisum as outgroup. (B) Tree based analysis of cry2 genes using the one of Apid mellifera as outgroup. Values on the nodes are the nonparametric bootstrap proportions (MLBPs). Moths denoted in blue and butterflies in red. Branch-specific ω values are shown on nodes of the common ancestors. The names and GenBank accession numbers of crys were shown in Table S2.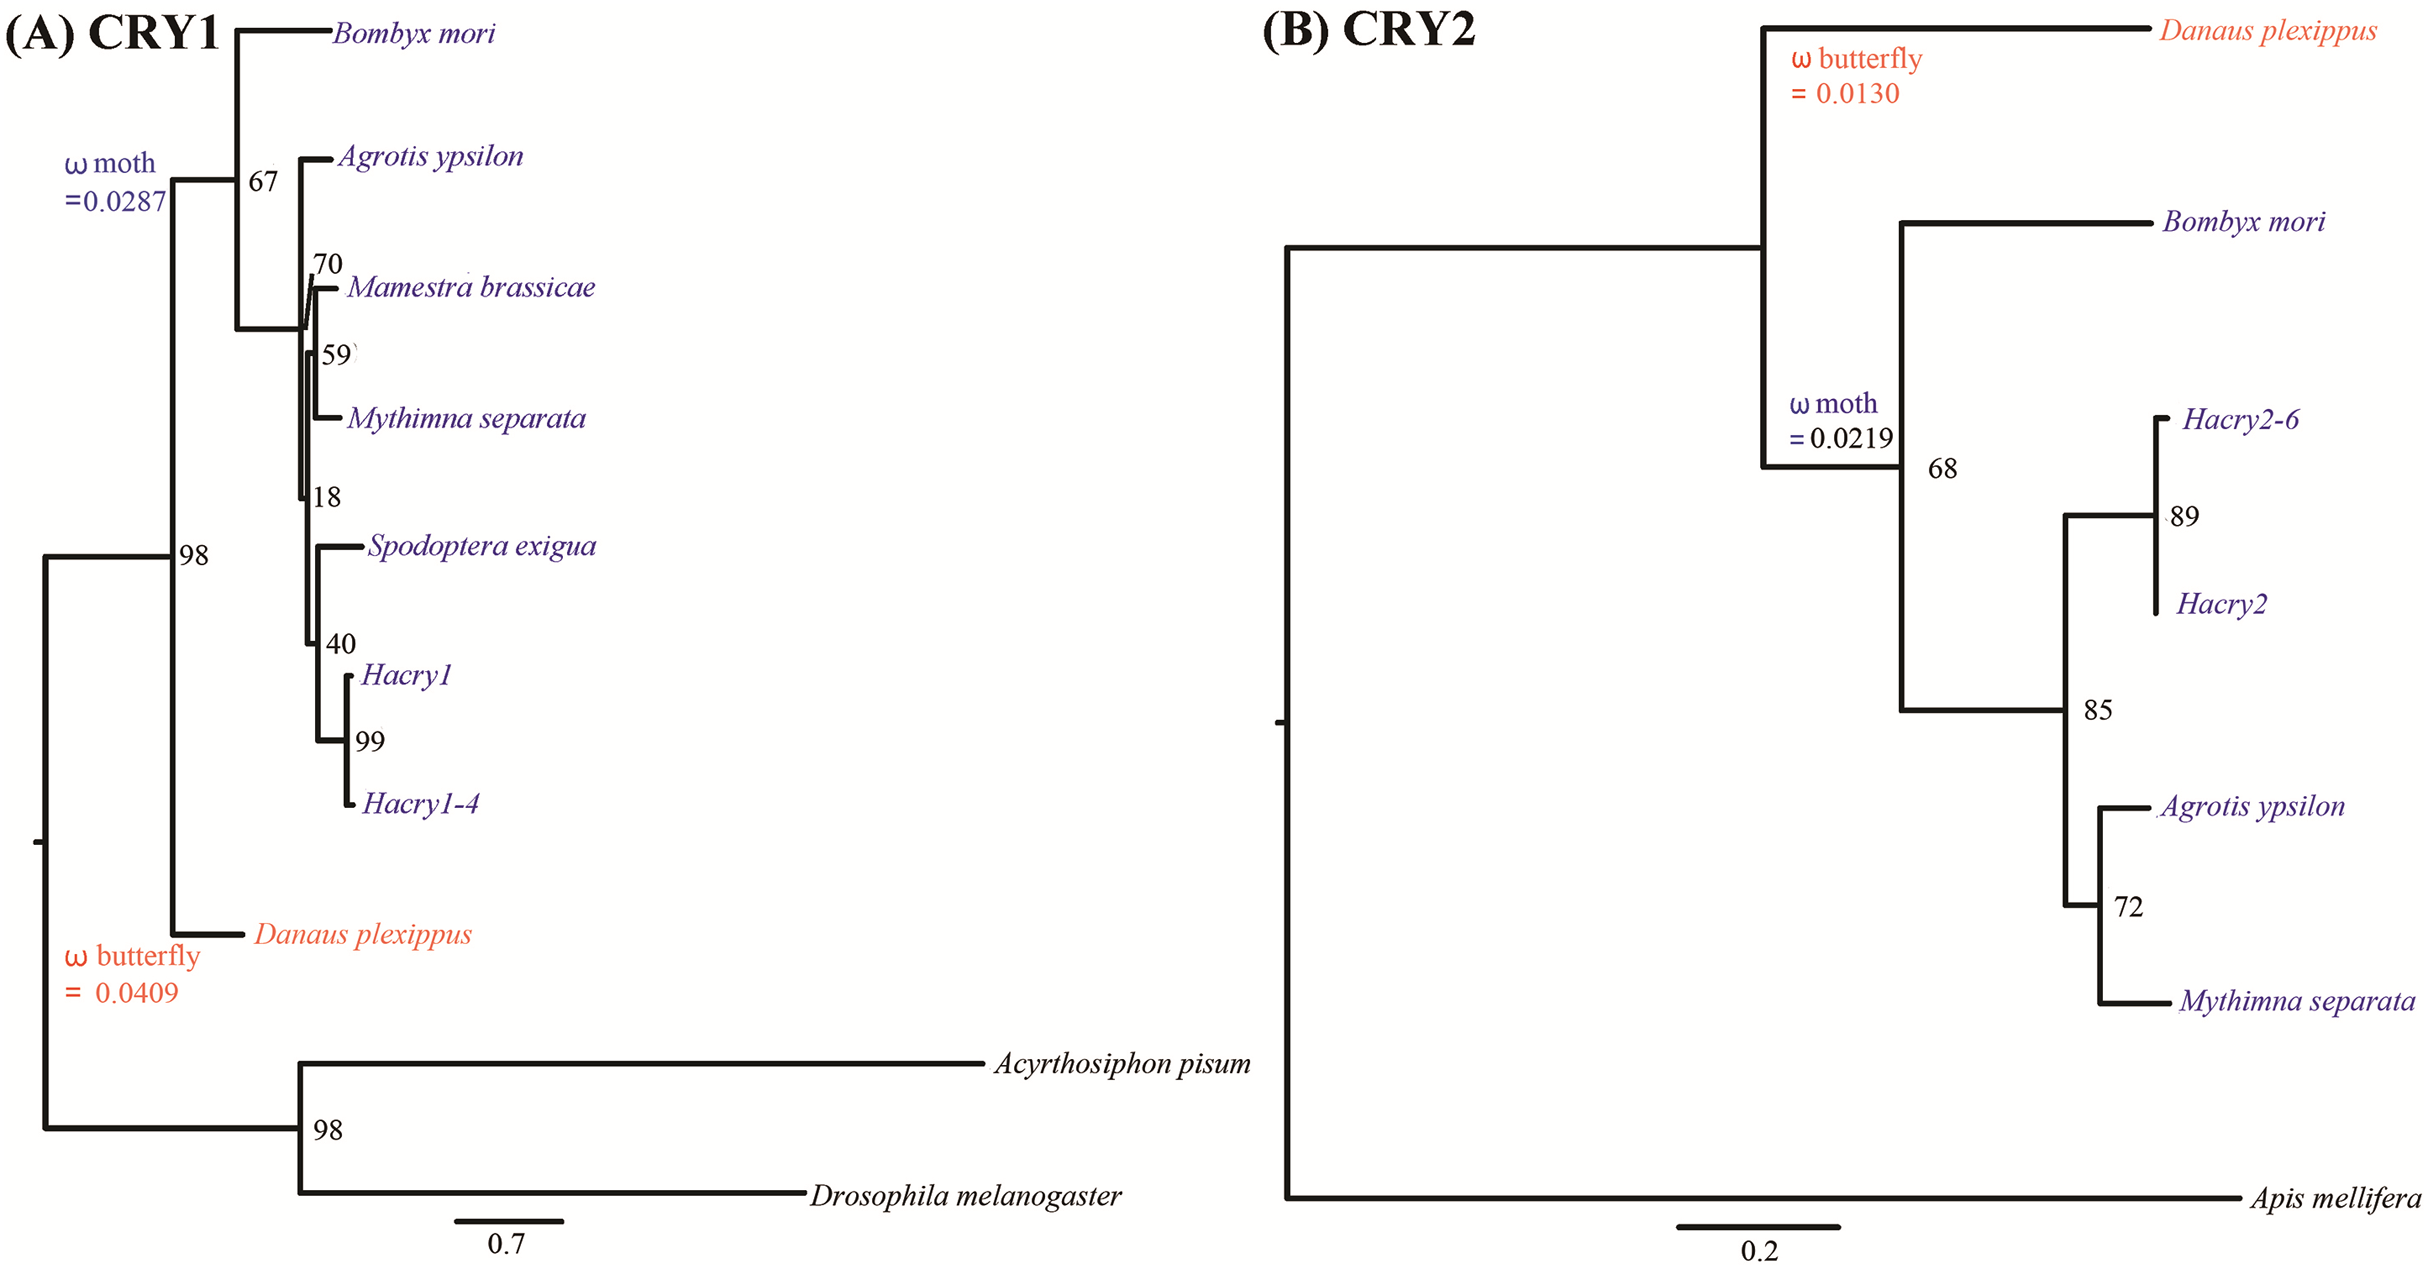
| Genes | Model | npa | Ln Lb | Estimates of ω | Models compared | LRTc | p-values |
|---|---|---|---|---|---|---|---|
| Cry1 | Branch model | ||||||
| A: one ratio | 19 | –9,129.37 | ω = 0.0278 | ||||
| B: one ratio ω = 1 | 18 | –10,508.58 | ω = 1 | B vs. A | 2,758.42 | <0.001 | |
| C: the moth branch has ω2, the butterfly branch has ω1 | 21 | –9,127.01 | ω2 = 0.0287, ω1 = 0.0409 | A vs. C | 4.72 | 0.09 | |
| D: the moth branch has ω2 = 1 | 20 | –10,114.21 | ω2 = 1, ω1 = 0.0270 | D vs. C | 1,974.4 | <0.001 | |
| E: each branch has its own ω | 35 | –9,111.95 | Variable ω by branch | A vs. E | 34.84 | 0.004 | |
| Branch-site models | |||||||
| G: the moth branch | 22 | –9,061.95 | |||||
| H: the moth branch has ω = 1 | 21 | –9,061.95 | H vs. G | 0 | 1 | ||
| Cry2 | Branch model | ||||||
| I: one ratio | 13 | –5,538.87 | ω = 0.0186 | ||||
| J: one ratio ω = 1 | 12 | –6,629.16 | ω = 1 | J vs. I | 2,180.58 | <0.001 | |
| K: the moth branch has ω2, the butterfly branch has ω1 | 15 | –5,534.15 | ω2 = 0.0219, ω1 = 0.0130 | I vs. K | 9.44 | 0.002 | |
| L: the moth branch has ω2 = 1 | 14 | –6,121.45 | ω2 = 1, ω1 = 0.0064 | L vs. K | 1,174.6 | <0.001 | |
| M: each branch has its own ω | 23 | –5,525.41 | Variable ω by branch | I vs. M | 26.92 | 0.003 | |
| Branch-site models | |||||||
| N: the moth branch | 16 | –5,513.53 | |||||
| O: the moth branch has ω = 1 | 15 | –5,513.53 | N vs. O | 0 | 1 |
Then we calculated the dn/ds for all the transcript isoforms of the cry1 and the cry2 (as shown in Tables S3 and S4). Surprisingly, highly contrasting results were obtained. The dn/ds of Hacry1 transcripts was 0.0082, which is in line with the expectation based on results of the cry1. Four replacement changes and 127 synonymous changes were detected. However, for the cry2, dn/ds increased dramatically to 0.684. Fourteen replacement changes and eight synonymous changes were found. It indicated that nonsynonymous mutations were accumulated with much higher rate in these cry2 isoforms than in the cry1 genes.
Expressions Hacrys in different tissues, adult instars, populations and months
According to our preliminary experiment and experience investigating gene expression pattern in H. armigera (Mao et al., 2007; Sui et al., 2009; Zhang et al., 2011), β-actin was selected as reference gene in this study. Individuals of females and males from CD were used to detect tissue distribution of Hacrys mRNA transcripts including antenna, head, thorax, abdomen and leg, by quantitative RT-PCR analyses. Expressions were detected in all examined tissues but no statistically significant difference was detected among them (ANOVA: for Hacry1, in day time, F(4,19) = 0.92, p = 0.4731; in night time: F(4,18) = 0.57, p = 0.6862; for Hacyr2, in day time, F(4,19) = 0.61, p = 0.6628, in night F(4,18) = 0.57, p = 0.6905) (Figs. 3A and 3B).
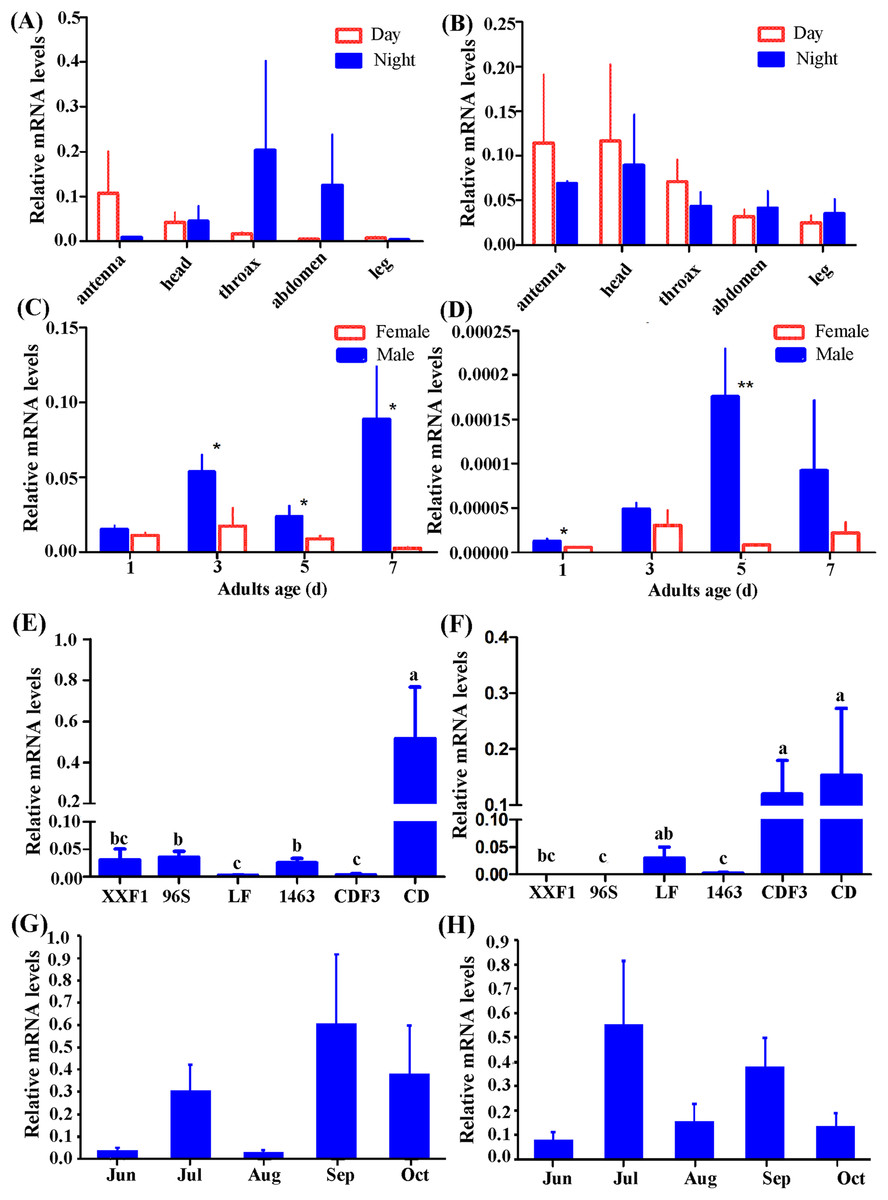
Figure 3: Relative expression level of Hacry1 and Hacry2 in different tissues (n = 3–5), day instar stage (n = 4), population (n = 4–8) and months (n = 8–11) of adults.
(A) Relative expression level of Hacry1 in different tissues of adults. (B) Relative expression level of Hacry2 in different tissues of adults. (C) Relative expression level of Hacry1 in different day instar stage of adults. (D) Relative expression level of Hacry2 in different day instar stage of adults. (E) Relative expression level of Hacry1 in different population of adults. (F) Relative expression level of Hacry2 in different population of adults. (G) Relative expression level of Hacry1 in different months of adults. (H) Relative expression level of Hacry2 in different months of adults. Mean ± SE. The “*” and “**” denote statistical significance of the expression levels in (C) and (D) (p < 0.05 and p < 0.01, respectively). The different letters were used to show significant difference in (E) and (F) (p < 0.05, by Student’s t-test).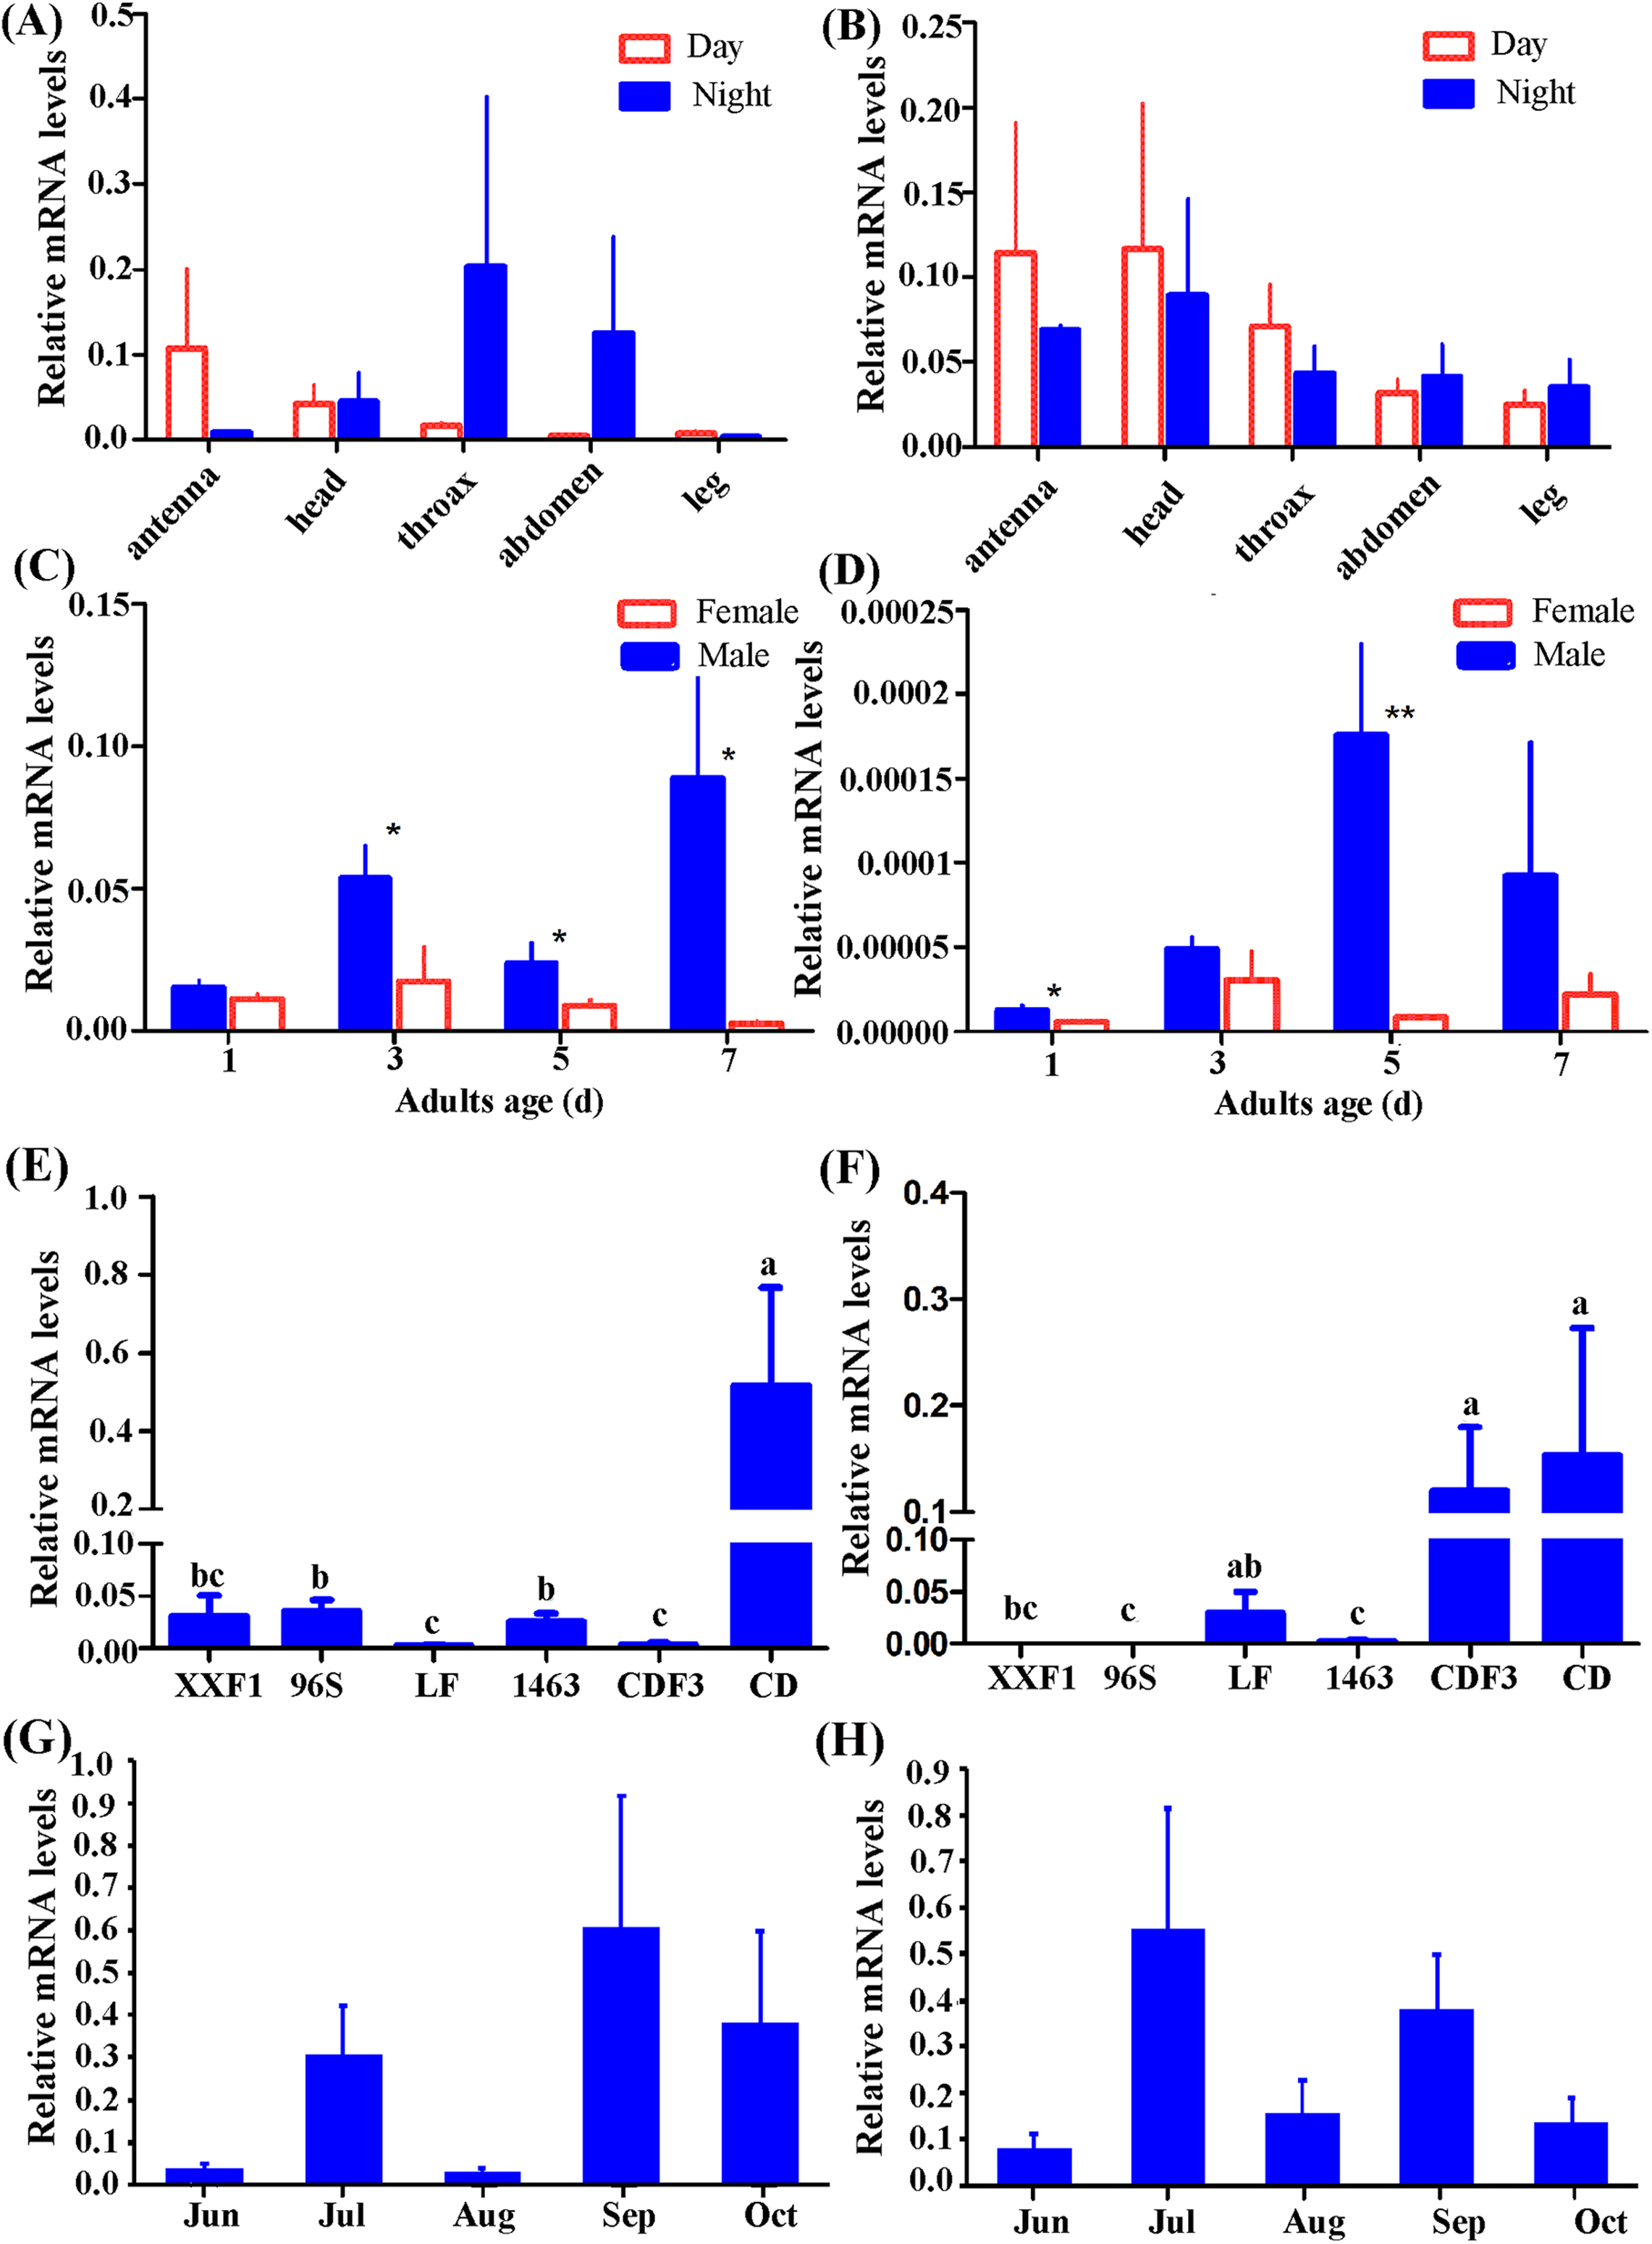
Initially, the expression levels of both Hacry1 and Hacry2 were not significantly different in female or male adults. However, the expression level of Hacry1 mRNA was significantly higher in male than female adults during days 3, 5, and 7 (Student’s t-test, day 3, t = 2.1696, p = 0.0365; day 5, t = 1.9515, p = 0.0494; day 7, t = 2.3900, p = 0.0270). The expression level of Hacry2 mRNA was significantly higher in males on day 1 (Student’s t-test, t = 2.1190, p = 0.0392;) and day 5 (Student’s t-test, t = 3.6869, p = 0.0071) than female adults (Figs. 3C and 3D), which might be due to the differences of rhythm and biological function between females and males. From CD female and male adults, the Hacry1 and Hacry2 mRNA level were significant higher than other populations including LF, 96s, 1,463 and XX (ANOVA: for Hacry1, F(5,30) = 6.63, p = 0.0003; for Hacry2, F(5,26) = 2.69, p = 0.0436) (Figs. 3E and 3F). The Hacry1 genes in CD were significantly differently expressed among individuals from different months (F(4,43) = 3.337, p = 0.0182), however, there were no significant differences in the expression levels of Hacry2 genes (F(4,41) = 0.4738, p = 0.7545) (Figs. 3G and 3H).
To investigate the effect of heredity, we detected the mRNA levels of Hacrys using CD third generation reared indoor (CDF3). The level of Hacry1 mRNA was significantly down-regulated in CDF3 (Bonferroni multi comparison, p = 0.009 between CD and CDF3) and similar to other populations detected in this study (Figs. 3E and 3F). However, the levels of Hacry2 mRNA were stable between CD and CDF3 (Bonferroni multi comparison, p = 0.686 between CD and CDF3), which were significantly higher than other populations except for LF (Figs. 3E and 3F).
Diel changes in the expression of cry1 and cry2 from H. armigera in migrating and reared populations
We selected CD and an artificial reared population (LF, 3rd day moths post eclosion) to detect the diurnal fluctuation of the expression levels of Hacry1 and Hacry2. qPCR analysis revealed a significant fluctuation of the two crys in both CD and LF. The two populations had a similar rhythm of Hacry1 expression level from 0:00 to 12:00. However they show different profiles, with peaks and troughs at 12:00 and 9:00 for outdoor population (CD), 0:00 and 18:00 for indoor population (LF), respectively (Figs. 4A–4D).
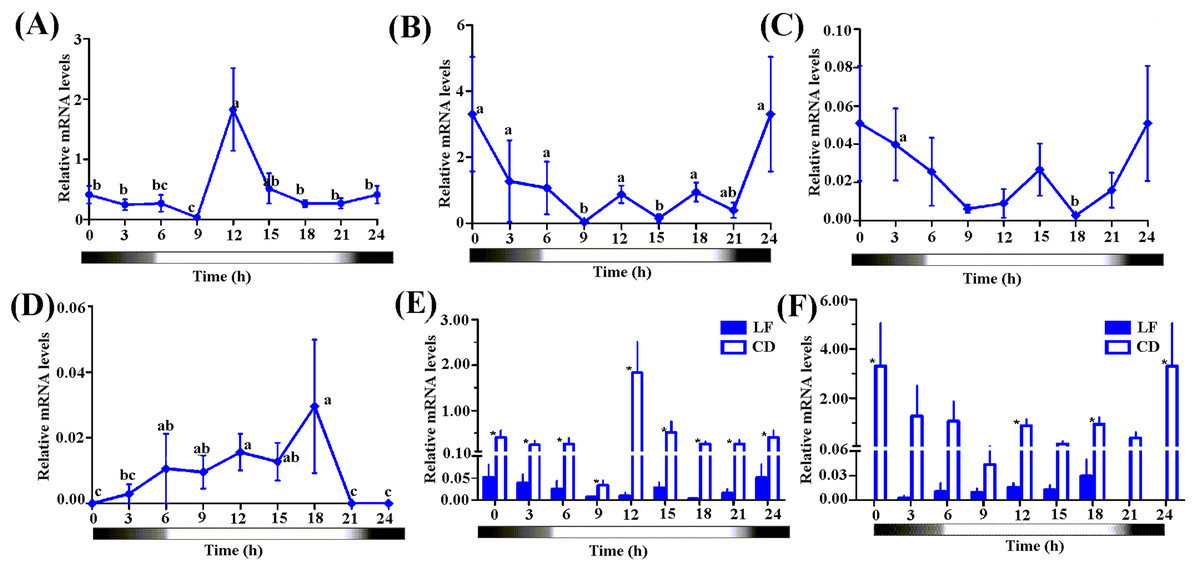
Figure 4: The expression level of Hacrys in CD and LF population.
(A) Diel changes of relative expression level of Hacry1 in CD population. (B) Diel changes of relative expression level of Hacry2 in CD population. (C) Diel changes of relative expression level of Hacry1 in LF population with moths at 3-day after eclosion. The different letter indicates significant differences between groups (p < 0.05, by ANOVA). (D) Diel changes of relative expression level of Hacry2 in LF population with moths at 3-day after eclosion. The different letter indicates significant differences between groups (p < 0.05, by ANOVA). (E) Relative expression level of Hacry1 between CD and LF individuals. Mean ± SE. The “*” denote statistical significance of the expression levels between CD and LF individuals at the same time (p < 0.05, n = 3–4). (F) Relative expression level of Hacry2 between CD and LF individuals. Mean ± SE. The “*” denote statistical significance of the expression levels between CD and LF individuals at the same time (p < 0.05, n = 3–4).
The diurnal-rhythm of Hacry2 mRNA was different between CD and LF, which was low during the day in CD while was high in LF at 0:00 and 18:00 (Figs. 4A–4D). The amount of Hacry1 mRNA expression in CD was significantly higher than in LF in all of the detected samples except for at 6:00 and 15:00 (Figs. 4E and 4F). The amount of Hacry2 mRNA did not show significant temporal variance in LF, but was significantly higher in CD at 0:00, 12:00 and 18:00 than in LF (Figs. 4E and 4F).
Discussion
Recently, Yan et al. (2013) reported two types of cry genes from H. armigera, each with one transcript respectively. Here, we identified six novel transcripts of cry1 and seven novel transcripts of cry2. The transcripts of HaCRY1s contained a conserved PHR motif and the alternative splicing region located in the CCE domain which was also found in cry1s of Mamestra brassicae and Spodotera exigua, suggesting that the cry1 genes might be evolving at a special period in Lepidoptera (Merlin et al., 2006; Berndt et al., 2007).
Similarly, the seven detected isoforms of the Hacry2 are diverse in sequence length and nucleotides, which may be from alternative splicing of the same gene or different genes derived from duplication events. The CRY2s of insects act as a transcriptional repressor in a light-independent manner (Zhu et al., 2005; Yuan et al., 2007; Ikeno, Numata & Goto, 2011). The CCE domain is key to CRYs maintenance and can be active in the absence of a PHR domain (Fankhauser & Ulm, 2011; Mazzotta et al., 2013). Therefore, we suggest that HaCRY2-1, HaCRY2-2, HaCRY2-3 and HaCRY2-4 might be function like other HaCRY2s, despite lacking a complete PHR domain.
Transcription analyses of cry1 and cry2 from insects including Drosophila melanogasta, Apis mellifera, Riptortus pedestris, M. brassicae, Danaus plexippus revealed that each insect species contained only one copy of cry1 and/or cry2 without alternative splicing (Emery et al., 1998; Zhu et al., 2005; Merlin et al., 2006; Rubin et al., 2006; Ikeno, Numata & Goto, 2008). The cry genes of H. armigera were the most polymorphic among all of the known insect cry genes, which might be related to the lifestyle and environmental adaptability of H. armigera. dn/ds analysis did not detect any positive selective evolution between the cry genes of nocturnal moths and diurnal butterflies. However, the dn/ds analysis of H. armigera transcripts suggested that the encoding sequence of the Hacry1 was negatively selected possibly due to functional constraint, but the cry2 showed less strong selection than cry1. For the branch-site model, the neutral model could not be rejected. These results suggested that the Hacry1 might play a more important role than the Hacry2 in H. armigera.
mRNA levels of Hacrys were neither tissue-specific nor developmental-stage-specific (Yan et al., 2013). Based on ovary development, most of the individuals from CD population were 3–4 days instars after eclosion. Therefore, we used whole individuals of 3 days adult instar in laboratory populations to compare with wild CD individuals. To our surprise, the mRNA levels of the cry1 were significantly higher in CD than LF while the Hacry2 was not as strong as the Hacry1.
To confirm that the levels of Hacrys transcripts were correlated to the migrating behavior, we reared offspring of CD for three generations (CDF3) in laboratory and investigated the mRNA levels of Hacrys using the 3rd day adults after eclosion. The expression level of Hacry1 was significantly down-regulated in CDF3 population, suggesting that HaCRY1 might play a role in the migrating behavior of H. armigera. Detected expression of Hacry2, however, was not significantly changed in CDF3, suggesting that the cry2 might not have specific function in the migrating behavior of H. armigera. Recently, CRY proteins were reported as magnetoreceptors and using light signal for their function in navigation (Baik et al., 2017; Marley et al., 2014; Bazalova et al., 2016; Rodgers & Hore, 2009; Gegear et al., 2010). Our results warrant further investigation on the functions of CRY proteins in the migrating behavior of moths, in areas of both circadian biology and magnetochemical biology. This potential role in migration may have important implications for our understanding of migratory behavior of key crop pest species.
Conclusions
We found the Hacry1 and Hacry2 of H. armigera occurred alternative splicing which generated six and seven transcripts, respectively. Selection pressure analysis suggested that the Hacry1 was under purifying selection by a strong negative selection pressure whilst the Hacry2 was less constrained and showed a less strong purification selection than cry1. At mRNA levels by qPCR, Hacrys were more abundantly transcribed in wild migrating populations than in laboratory maintained populations, and expression of the Hacry2 was lower than Hacry1 in all samples tested. Interestingly, when compared with the migrating parental population, offspring reared in laboratory conditions showed a significant reduction on transcription of the Hacry1 but not Hacry2. These results suggest that Hacry1 is more related to the migration of H. armigera than Hacry2.
Supplemental Information
Listing of insect species used to determine selection pressures based on cry1s and cry2s sequences.
Nucleotide identities among ORFs of the Hacry1 from H. armigera.
The length of aligned fragments and the numbers of variant nucleotides were shown in bracket.
Nucleotide identities among ORFs of the Hacry2 from H. armigera.
The length of aligned fragments and the numbers of variant nucleotides were shown in bracket.
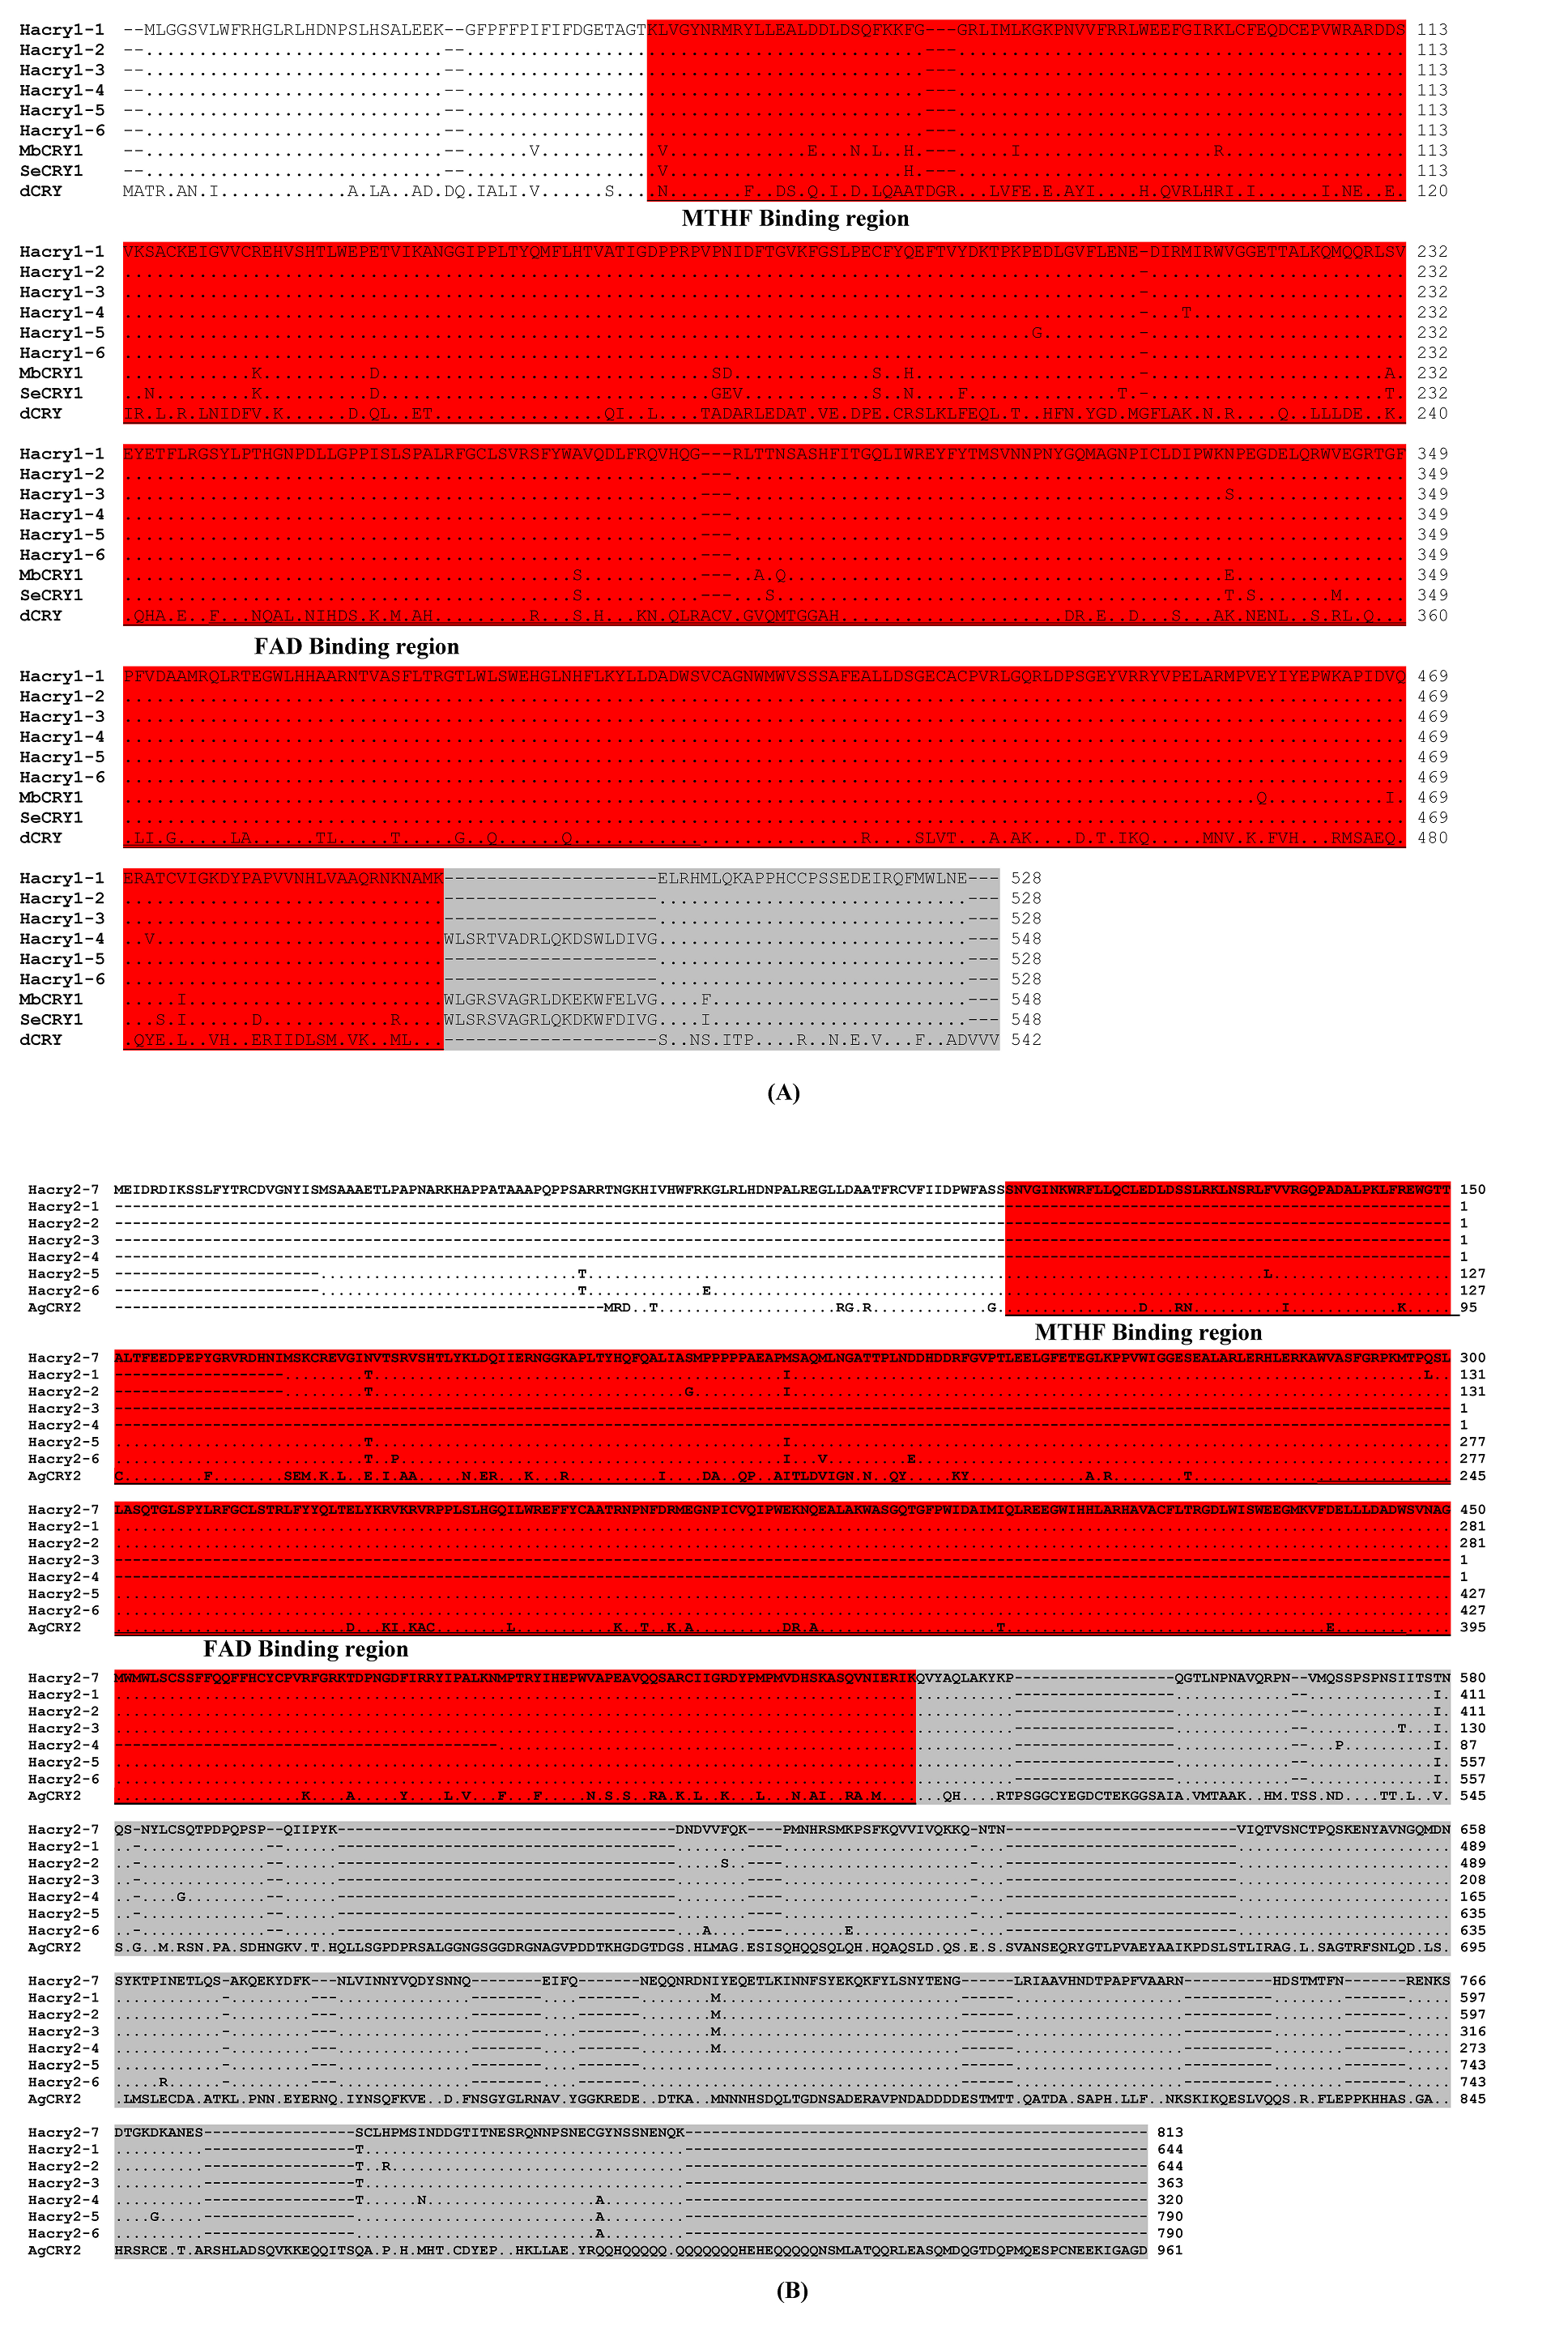
Amino acid sequence alignment of the HACRY1s (A) and HACRY2s (B) in H. armigera.
Region shaded in red correspond to the PHR region. Gray shown the CCE region. “—” stands for MTHF and FAD binding region, in which “=” stands for the shared region by MTHF and FAD. “.” stands for identical sites with the first row sequence. “-” stand for gap. dCRY: Drosphila melanogaster (accession no.: AAK92938), MbCRY1: Mamestra brassicae (accession no.: AAY23345), SeCRY1: Spodoptera exigua (accession no.: ADY17887), AgCRY2: Anopheles gambiae (accession no.: XP_313179).