
Classifying Oryza sativa accessions into Indica and Japonica using logistic regression model with phenotypic data
- Published
- Accepted
- Received
- Academic Editor
- Francisco Balao
- Subject Areas
- Agricultural Science, Biodiversity, Bioinformatics, Evolutionary Studies, Plant Science
- Keywords
- Logistic regression, Oryza sativa, Indica, Japonica, Asian cultivated rice, Genetic diversity in rice, Rice classification, Rice breeding
- Copyright
- © 2019 Kim
- Licence
- This is an open access article distributed under the terms of the Creative Commons Attribution License, which permits unrestricted use, distribution, reproduction and adaptation in any medium and for any purpose provided that it is properly attributed. For attribution, the original author(s), title, publication source (PeerJ) and either DOI or URL of the article must be cited.
- Cite this article
- 2019. Classifying Oryza sativa accessions into Indica and Japonica using logistic regression model with phenotypic data. PeerJ 7:e7259 https://doi.org/10.7717/peerj.7259
Abstract
In Oryza sativa, indica and japonica are pivotal subpopulations, and other subpopulations such as aus and aromatic are considered to be derived from indica or japonica. In this regard, Oryza sativa accessions are frequently viewed from the indica/japonica perspective. This study introduces a computational method for indica/japonica classification by applying phenotypic variables to the logistic regression model (LRM). The population used in this study included 413 Oryza sativa accessions, of which 280 accessions were indica or japonica. Out of 24 phenotypic variables, a set of seven phenotypic variables was identified to collectively generate the fully accurate indica/japonica separation power of the LRM. The resulting parameters were used to define the customized LRM. Given the 280 indica/japonica accessions, the classification accuracy of the customized LRM along with the set of seven phenotypic variables was estimated by 100 iterations of ten-fold cross-validations. As a result, the classification accuracy of 100% was achieved. This suggests that the LRM can be an effective tool to analyze the indica/japonica classification with phenotypic variables in Oryza sativa.
Introduction
Oryza sativa (Asian cultivated rice) is known to have five subpopulations which are indica, temperate japonica, tropical japonica, aus and aromatic. Of these, indica and japonica, comprised of temperate japonica and tropical japonica, are known as pivotal subpopulations; aus is known to be related to indica, and aromatic is intermediate between indica and japonica (Garris et al., 2005; Thomson et al., 2007; Kovach et al., 2009; Huang et al., 2012; Schatz et al., 2014; Civan et al., 2015; McCouch et al., 2016; Chin et al., 2017). There are genetic barriers, particularly between indica and japonica, which often challenge rice trait improvements by breeding (Kato & Kosaka, 1930; Chen et al., 2008; Kim, Jiang & Koh, 2009; Zhu et al., 2017). Because each subpopulation often has desirable characteristics for cultivars, overcoming the genetic barriers between the subpopulations will help rice breeders freely introgress desirable genes originating from different subpopulations into an elite line. This can eventually minimize the breeding costs and maximize the sustainability of rice production being threatened by climate changes, human population increases and loss of cultivation land. Classifying Oryza sativa is important because it can help breeders develop effective mating paths to overcome the genetic barriers by identifying accessions that can bridge between indica and japonica. Currently, classifying Oryza sativa is widely conducted with genomic tools because genomic data can reflect the variation of subpopulation characteristics at a molecular level (Garris et al., 2005; Kim, Jiang & Koh, 2009; Zhao et al., 2011; McCouch et al., 2016; Chin et al., 2017). However, the sole use of genomic data may have limitations to the understanding of Oryza sativa diversity because some subpopulation-associated traits are related to cytoplasmic effects (Bao, Sun & Corke, 2002; Zhao et al., 2010; Thomson et al., 2007). To overcome the gap that genomic data cannot fill, the use of phenotypic data is reasonable in that it comprehends the genomic and cytoplasmic effects.
This study introduces how to computationally classify Oryza sativa accessions into indica and japonica by applying multiple phenotypic variables to the logistic regression model (LRM). This study used a publicly available data source containing information on 413 Oryza sativa accessions and demonstrated that the LRM is a promising tool for accurate indica/japonica classification in Oryza sativa by phenotype.
Materials and Methods
Phenotypic data
A set of phenotypic data and subpopulation information was used, which was originally generated and analyzed by Zhao et al. (2011). The data set consisted of 413 accessions originating from 82 countries, obtained at http://ricediversity.org/data/sets/44kgwas. Out of 32 phenotypic variables, 24 variables were selected because they were quantitative and not confined to a certain geography. The selected variables were divided into morphology (culm habit, flag leaf length, flag leaf width), yield components (panicle number per plant, plant height, panicle length, primary panicle branch number, seed number per panicle, florets per panicle, panicle fertility), seed morphology (seed length, seed width, seed volume, seed surface area, brown rice seed length, brown rice seed width, brown rice volume, seed length/width ratio, brown rice length/width ratio), stress tolerance (straighthead susceptibility, blast resistance) and quality (amylose content, alkali spreading value, protein content). Every accession in the data set belonged to one of the following subpopulation groups: admixed (62), aromatic (14), aus (57), indica (87), temperate japonica (96) and tropical japonica (97). In this study, temperate japonica and tropical japonica were combined into japonica.
Stepwise variable selection and parameter estimation
The LRM formula used in this study can be denoted as follows: (1)
where P(japonica|x1, …, xn) is the probability of an accession being japonica (>0.5) or indica (<0.5) given the predictor variables, x1,…, xn; β0 is the constant term; β1,…, βn are the parameters for the predictor variables, x1, …, xn, respectively.
In Eq. (1), the response variable is binary between indica and japonica, and the predictor variables (phenotypic variables) are quantitative. To identify a set of predictor variables that can maximize the indica/japonica separation power, n sets were prepared from 1D to nD, in which the nD is a set containing all possible combinations of n different phenotypic variables (e.g., 1D contains every single phenotypic variable, 2D contains all possible pairs of phenotypic variables, and so forth). The n was increased by one until the maximum P(japonica|x1, …, xn) was reached, in which every single selection from the nD set was subject to the following steps:
-
Calculate a set of parameters by fitting the LRM (Eq. (1)) with the phenotypic variables in a selection.
-
Applying the phenotypic variables in the selection used in Step 1 to Eq. (1) with the parameters estimated in Step 1. The resulting value must be between 0 and 1, from which the indica or japonica can be determined at 0.5.
In order to estimate the indica/japonica separation power, a receiver operating characteristic (ROC) curve was implemented using an R package called pROC (Robin et al., 2011). In an ROC space, the x- and y- axes ranging between 0 and 1 represent the false positive rate (FPR or specificity) and true positive rate (TPR or sensitivity), respectively. Thus, an area under an ROC curve (AUC) can range between 0 and 1. The closer the AUC is to 1, the higher the indica/japonica separation power. By referring to the resulting AUCs, a set of phenotypic variables that maximized the indica/japonica separation power was identified, and the resulting parameters were used to define the customized LRM.
Applications of the customized LRM
1. Estimating the indica/japonica classification accuracy: given the 280 indica/japonica accessions, the customized LRM along with the related phenotypic variables were taken into 100 iterations of ten-fold cross-validations, from which the 100 values were obtained. The resulting values were averaged into the indica/japonica classification accuracy.
2. Estimating the variable interaction: as the LRM uses multiple phenotypic variables, some portion of indica/japonica classification power might be derived from interactions between variables. The interaction magnitude for every variable with all other variables was calculated using the H-statistic (Frieman & Popescu, 2008). The resulting H-statistic can range between 0 and 1 with no interaction resulting in 0 and full interaction resulting in 1. The H-statistic was calculated using an R package, iml (Molnar, Casalicchio & Bischl, 2018).
3. Classifying accessions in each minor subpopulation group into indica and japonica: the customized LRM was applied to each minor subpopulation group (aromatic, aus, admixed) to divide accessions into indica and japonica. This examination aimed to observe how accessions in each minor subpopulation group are phenotypically divided from the indica/japonica perspective.
Dendrogram-based indica/japonica classification
To draw dendrograms, the genomic data set was obtained at http://ricediversity.org/data/sets/44kgwas (Zhao et al., 2011). The genomic data set consisted of the accessions in the phenotypic data, genotyped with 36,901 SNPs. Two dendrograms were drawn; one included the 280 indica/japonica accessions, and the other included all 413 accessions. Then, the dendrogram-based indica/japonica classifications were compared with the LRM-based indica/japonica classifications. Each dendrogam was graphed based on a genetic distance matrix in which the genetic distances between two different accessions were calculated using the following equation: (2)
where the IBSA,B is the IBS (identical by state) coefficient between A and B, which can range between 0 and 2.
The IBS matrix was computed using Numericware i (Kim & Beavis, 2017) which is freely available at https://figshare.com/articles/Numericware_i/3496787.
Data availability
With the exception of calculating the IBS matrix, all other computations were conducted using R (R Core Team, 2016). The data set and R scripts used in this study are freely available at https://github.com/bongsongkim/logit.regression.rice.
Results
Stepwise variable selection
Figure 1 and Table 1 suggest that more phenotypic variables led to stronger indica/japonica separation power of the LRM, and the fully accurate indica/japonica separation power (AUC = 1) was achieved with a 7D selection. Table 2 summarizes the phenotypic variables yielding the maximum indica/japonica separation power in each set (1D to 7D). The set of phenotypic variables yielding AUC = 1 comprises panicle number per plant, seed number per panicle, florets per panicle, panicle fertility, straighthead susceptibility, blast resistance and protein content.
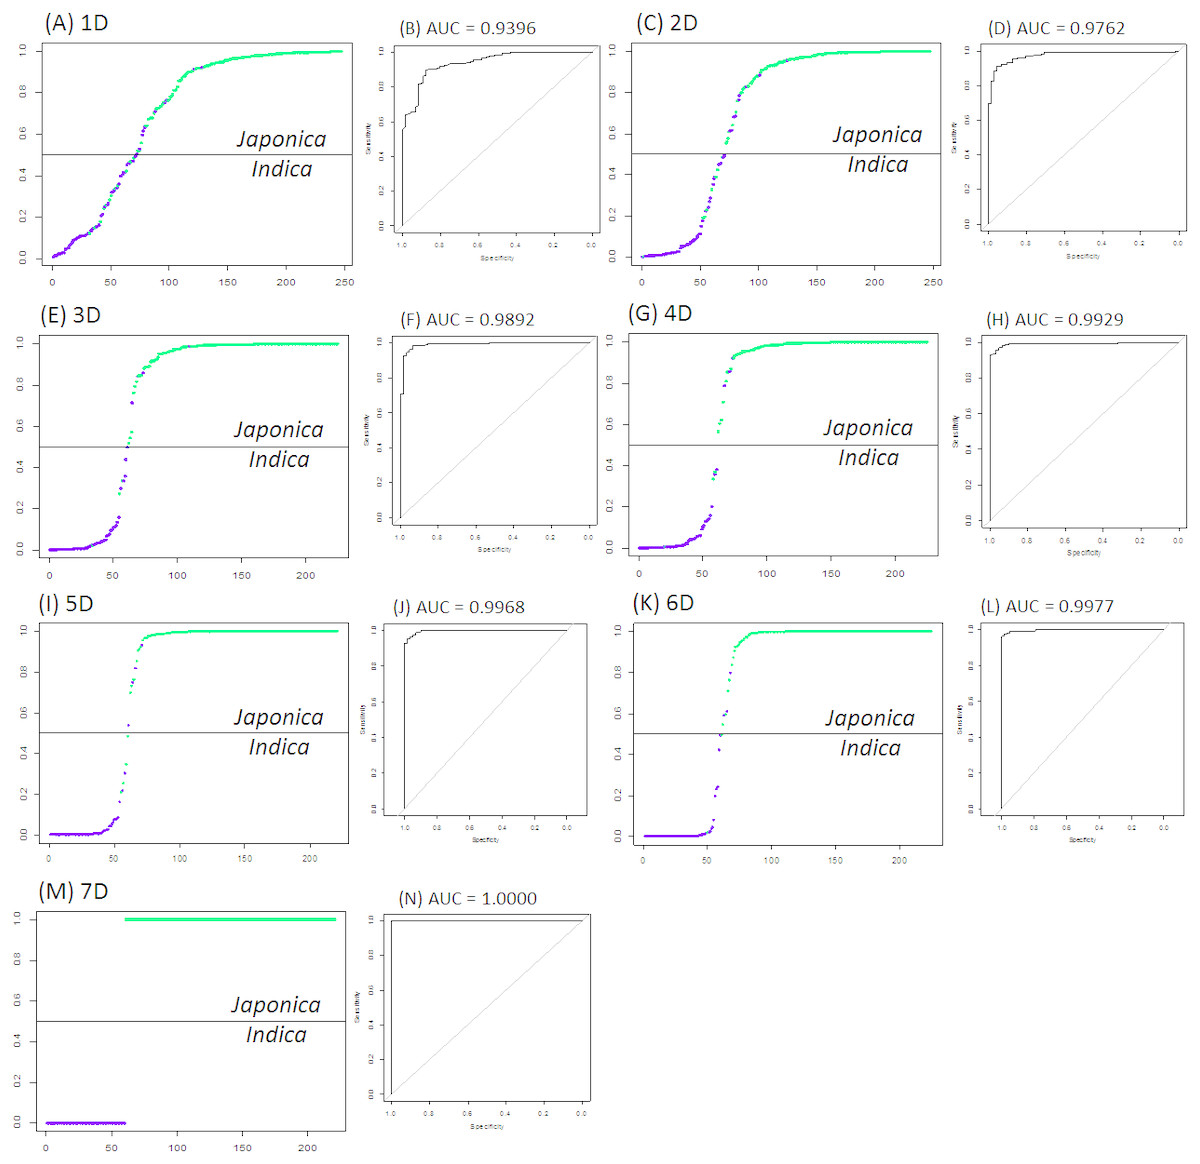
Figure 1: The best indica/japonica classification for each set (1D to 7D).
(A) The best indica/japonica classification in 1D set, (B) the ROC curve for Fig. 1A, (C) the best indica/japonica classification in 2D set, (D) the ROC curve for Fig. 1C, (E) the best indica/japonica classification in 3D set, (F) the ROC curve for Fig. 1E, (G) the best indica/japonica classification in 4D set, (H) the ROC curve for Fig. 1G, (I) the best indica/japonica classification in 5D set, (J) the ROC curve for Fig. 1I, (K) the best indica/japonica classification in 6D set, (L) the ROC curve for Fig. 1K, (M) the best indica/japonica classification in 7D set, (N) the ROC curve for Fig. 1M.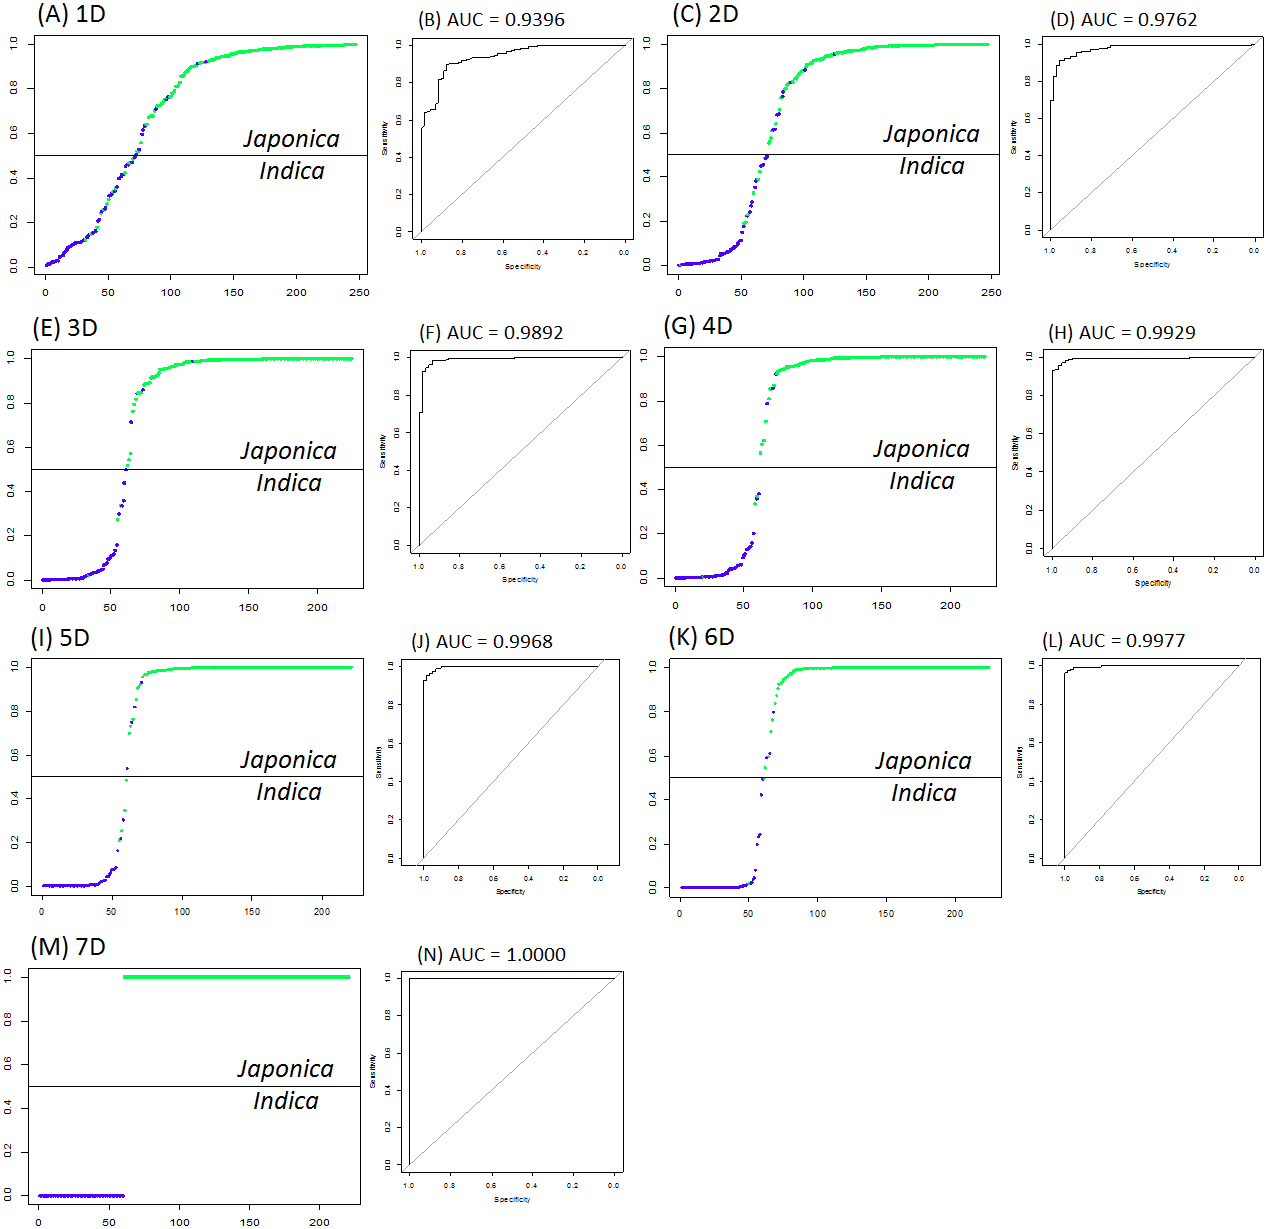
Estimating the indica/japonica classification accuracy
Given the seven phenotypic variables yielding AUC = 1, the indica/japonica classification accuracy was estimated using the 280 indica/japonica accessions, for which 100 iterations of ten-fold cross-validations were implemented. As a result, the indica/japonica classification accuracy of 100% was obtained. This indicates that the seven phenotypes were certainly impactful for the fully accurate indica/japonica classification. Assuming that some portion of classification power might be derived from interactions between variables, the H-statistic was calculated for the purpose of estimating how much each variable generates the classification power in collaboration with other variables. Table 3 summarizes the resulting H-statistic values, indicating nearly no interactions between variables.
| Set name | Minimum | Median | Mean | Maximum |
|---|---|---|---|---|
| 1D | 0.5129 | 0.6937 | 0.6868 | 0.9396 |
| 2D | 0.5192 | 0.7968 | 0.7829 | 0.9762 |
| 3D | 0.5507 | 0.8441 | 0.8413 | 0.9892 |
| 4D | 0.5861 | 0.8789 | 0.8805 | 0.9927 |
| 5D | 0.6101 | 0.9045 | 0.9081 | 0.9968 |
| 6D | 0.6299 | 0.9266 | 0.9283 | 0.9977 |
| 7D | 0.6785 | 0.9435 | 0.9437 | 1.0000 |
| Set name | Predictor variables |
|---|---|
| 1D | panicle number per plant |
| 2D | panicle number per plant, brown rice seed width |
| 3D | panicle number per plant, straighthead susceptibility, blast resistance |
| 4D | panicle number per plant, brown rice volume, straighthead susceptibility, blast resistance |
| 5D | panicle number per plant, brown rice volume, straighthead susceptibility, blast resistance, protein content |
| 6D | panicle number per plant, seed number per panicle, florets per panicle, panicle fertility, straighthead susceptibility, blast resistance |
| 7D | panicle number per plant, seed number per panicle, florets per panicle, panicle fertility, straighthead susceptibility, blast resistance, protein content |
| Phenotypic variable | H-statistic |
|---|---|
| Panicle number per plant | 3.231598e−15 |
| Seed number per panicle | 2.233564e−15 |
| Florets per panicle | 4.127335e−16 |
| Panicle fertility | 3.167362e−16 |
| Straighthead susceptibility | 1.660925e−16 |
| Blast resistance | 1.994817e−16 |
| Protein content | 1.312777e−16 |
Dendrogram-based indica/japonica classification
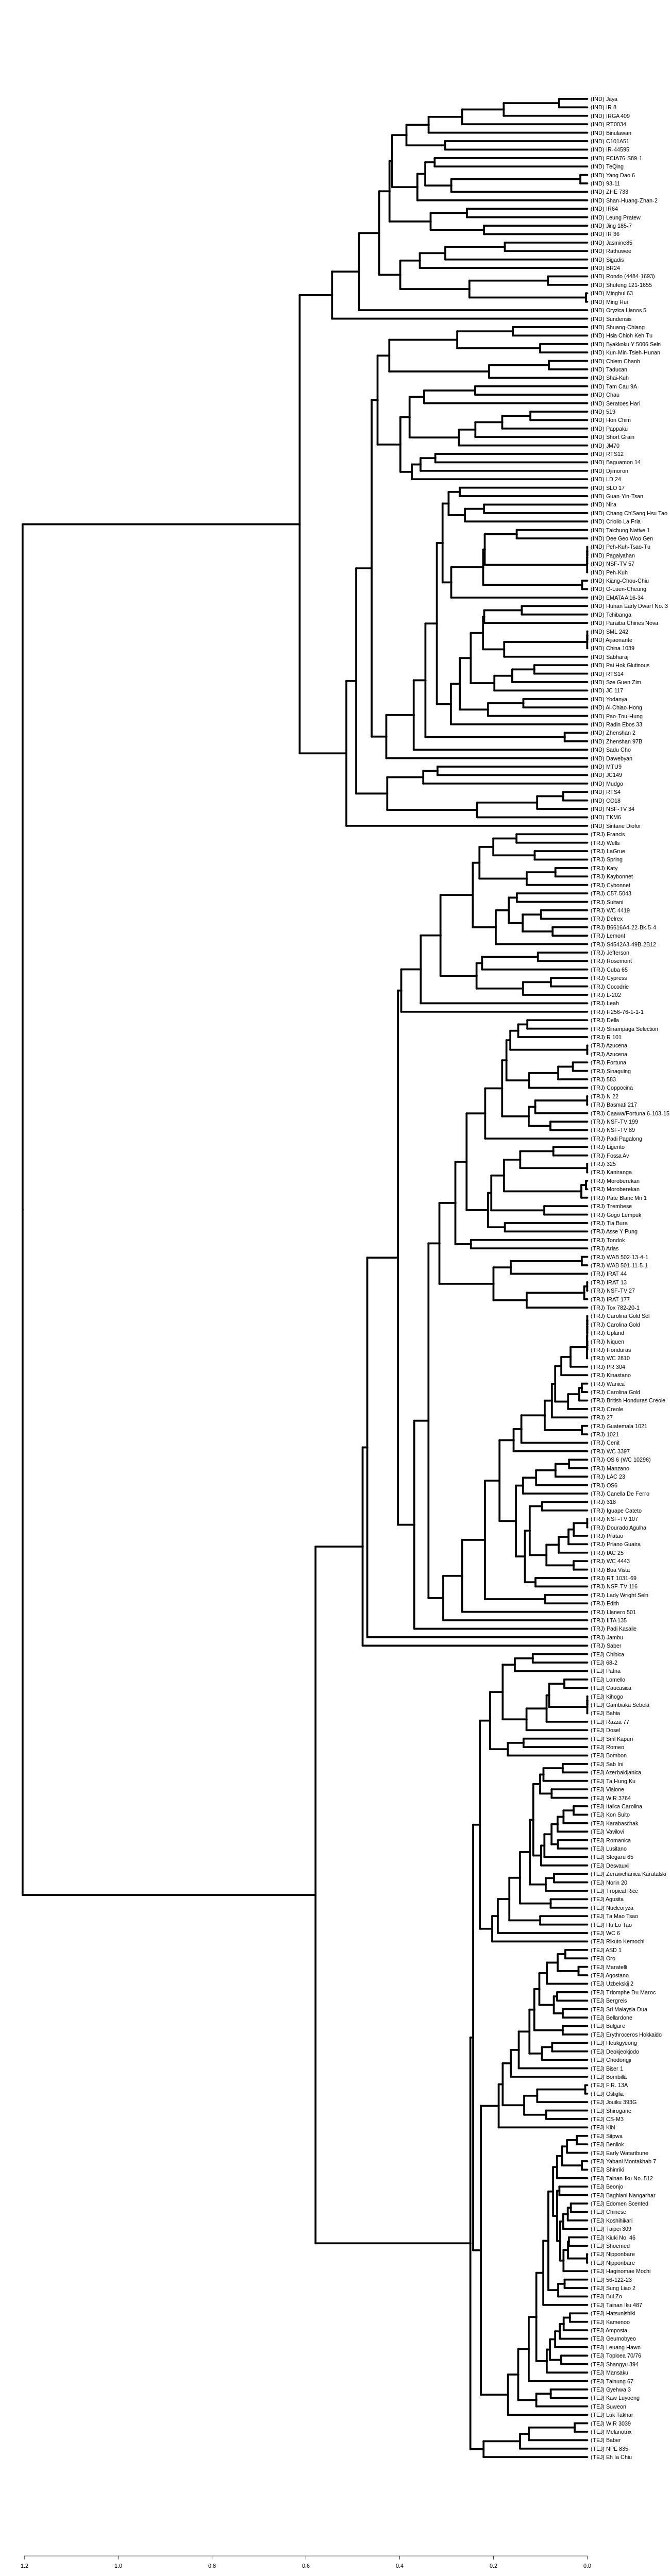
Figure 2 shows the dendrogram-based indica/japonica classification with the 280 indica/japonica accessions, in which the indica- and japonica-varietal clades were accurately divided, and the japonica accessions were further accurately divided into temperate japonica and tropical japonica (Fig. S1). This result shows that the dendrogram-based indica/japonica classification accuracy was 100%.
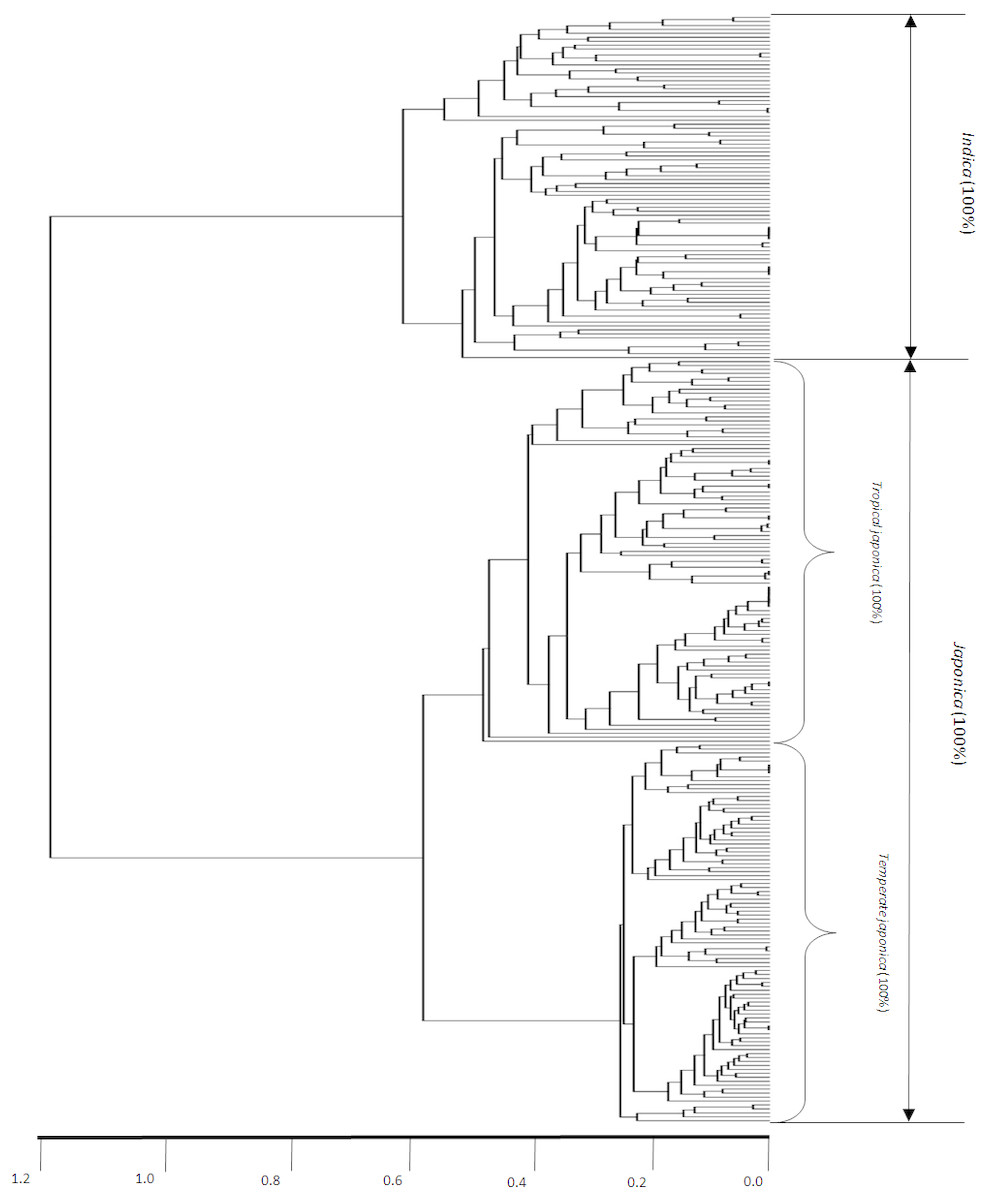
Figure 2: Dendrogram-based indica/japonica classification of 280 accessions.
Dendrogram-based indica/japonica classification of 280 accessions, obtained by using 36,901 SNPs.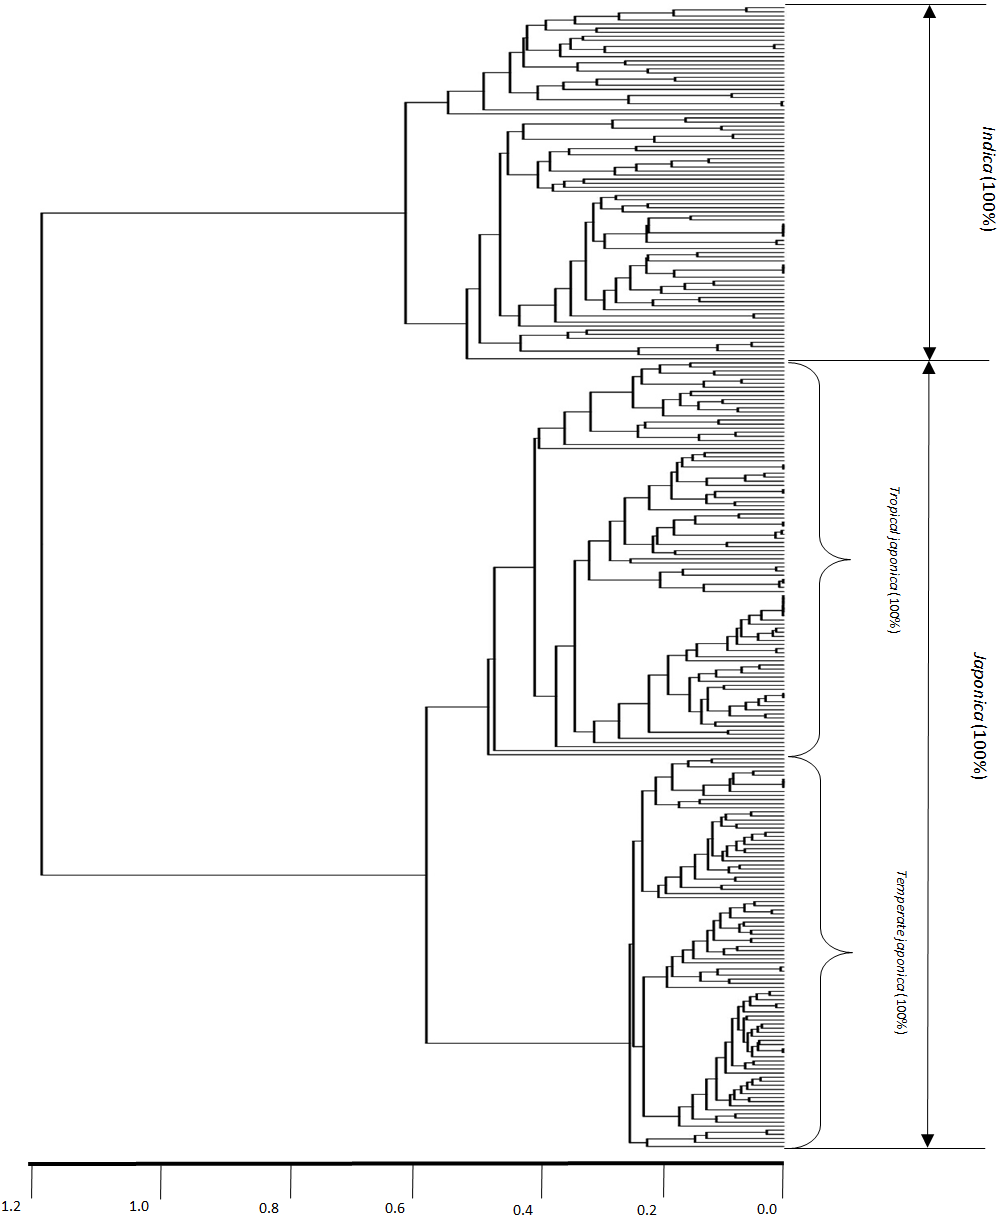
Applying the LRM to each minor subpopulation group
The LRM customized with parameters yielding AUC = 1 was used to investigate how it classifies the accessions in each minor subpopulation group (admixed, aromatic, aus) into indica and japonica. The customized LRM was as follows: (3)
where P(japonica|x1, …, x7) is the probability of an accession being japonica (>0.5) or indica (<0.5) given the predictor variables, x1,…, x7; x1 = the predictor variable for panicle number per plant; x2 = the predictor variable for seed number per panicle; x3 = the predictor variable for florets per panicle; x4 = the predictor variable for panicle fertility; x5 = the predictor variable for straighthead susceptibility; x6 = the predictor variable for blast resistance; x7 = the predictor variable for protein content.
The absolute values for parameters in Eq. (3) in descending order are 50943.2 (-) for panicle fertility, 38008.7 (-) for florets per panicle, 35800.4 (+) for seed number per panicle, 5832.5 (-) for panicle number per plant, 491.6 (-) for straighthead susceptibility, 353.7 (+) for blast resistance and 214.6 (-) for protein content. These suggest that, when it comes to the indica/japonica separation power, the panicle fertility is most impactful, followed by florets per panicle, seed number per panicle, panicle number per plant, straighthead susceptibility, blast resistance and protein content.
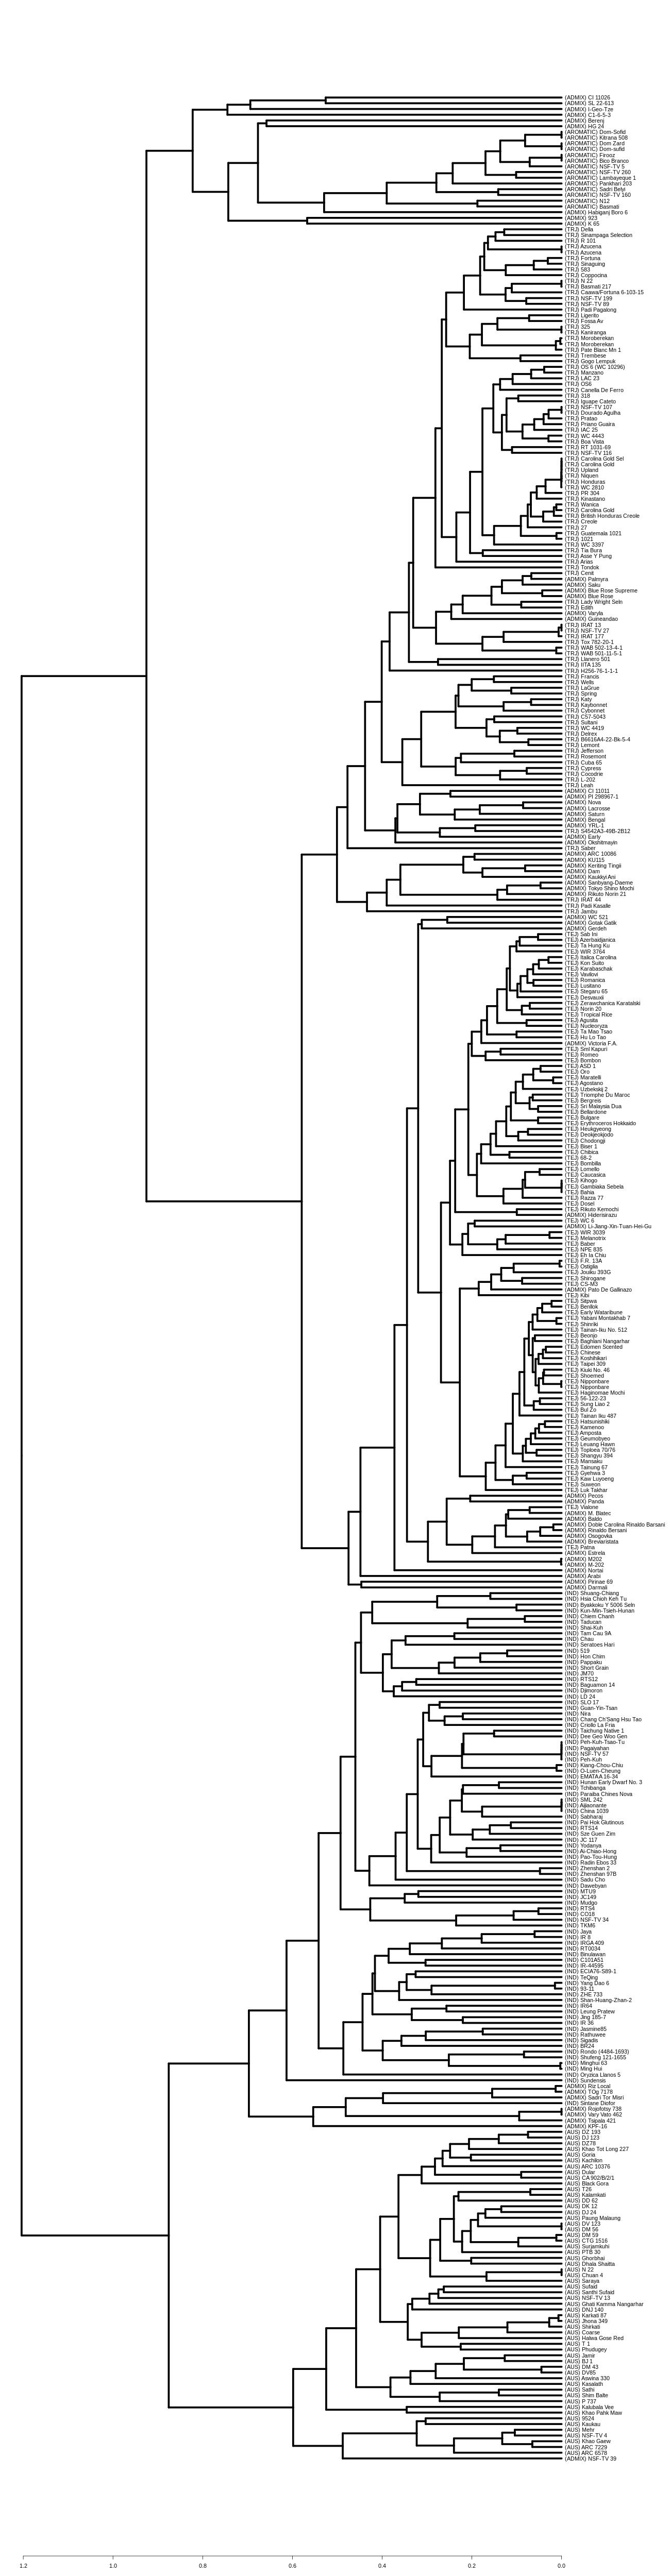
Because of missing phenotypic records, the size of each minor subpopulation group was reduced from 62 to 52 for the admixed group, 14 to 12 for the aromatic group and 57 to 26 for the aus group. Figure 3 shows that Eq. (3) split each subpopulation group into indica and japonica in ratios of 5:47 for the admixed group, 5:7 for the aromatic group and 18:8 for the aus group, respectively. Meanwhile, the dendrogram drawn with the whole accessions (413) shows two major clades (upper and lower), in which temperate japonica, tropical japonica and aromatic formed accurately separate groups within the upper clade (hereafter called japonica-varietal clade), while indica and aus formed accurately separate groups within the lower clade (hereafter called indica-varietal clade). The admixed accessions were spread across all subpopulation groups (Fig. S2). Figure 4 shows three Venn diagrams, each of which represents comparison between the LRM-based and dendrogram-based classifications for each minor subpopulation group; the agreements were 92.3% (48/52) in the admixed group, 58.3% (7/12) in the aromatic group and 69.2% (18/26) in the aus group.
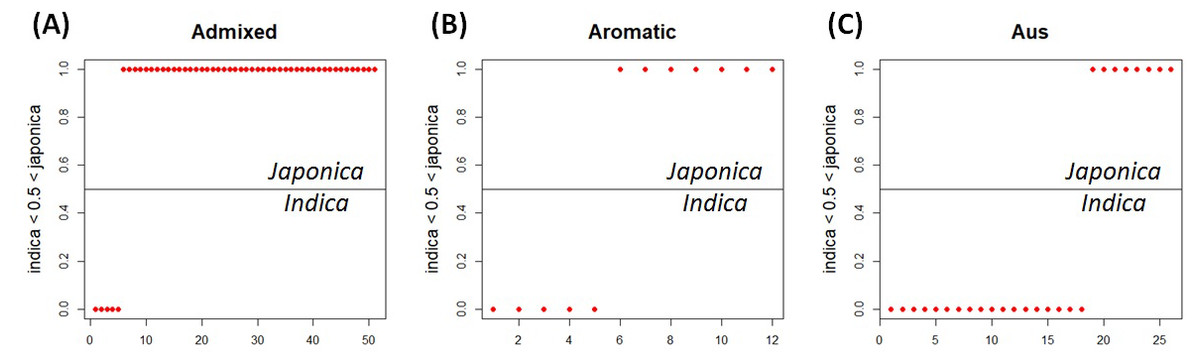
Figure 3: LRM-based indica/japonica classification for each minor subpopulation group.
(A) LRM-based indica/japonica classification for the admixed group, (B) LRM-based indica/japonica classification for the aromatic group, (C) LRM-based indica/japonica classification for the aus group.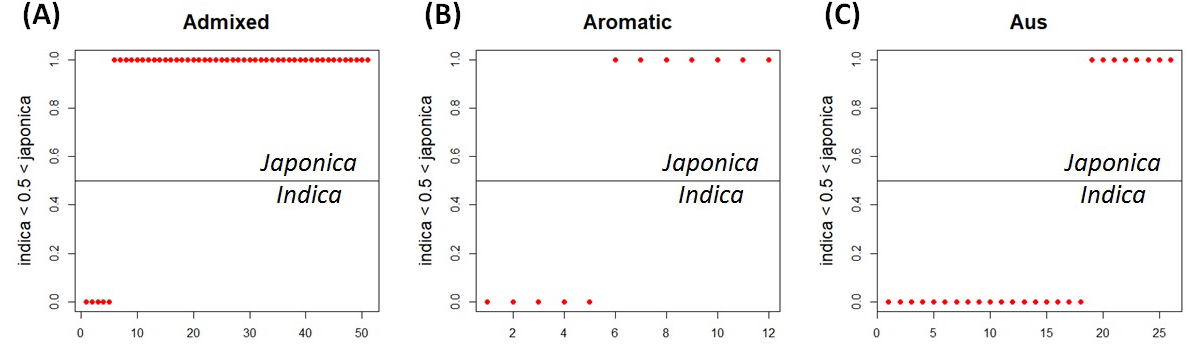
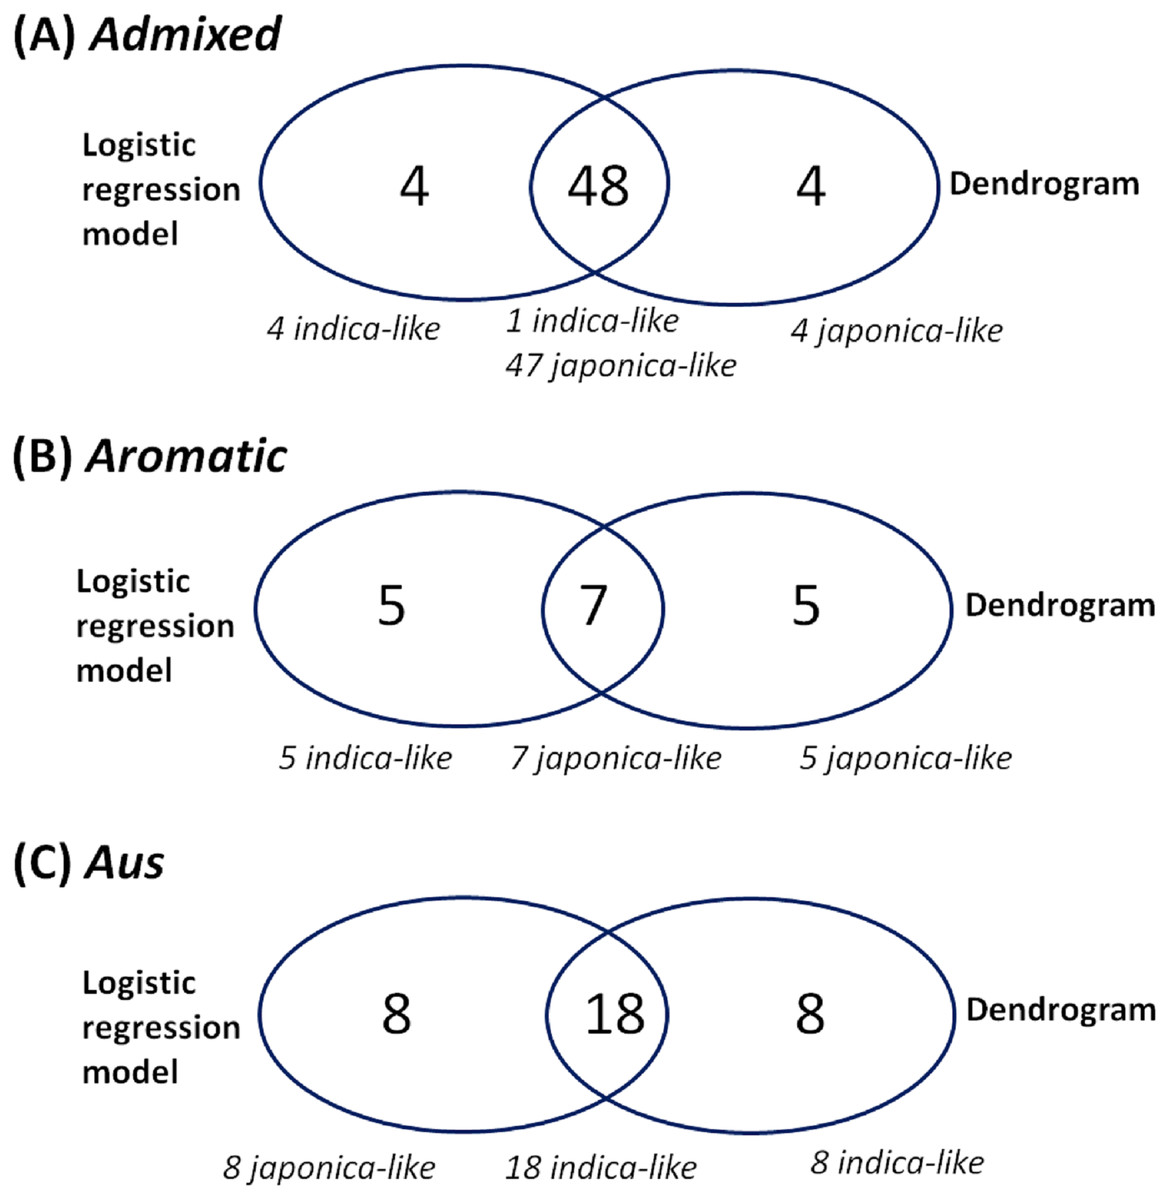
Figure 4: Comparison between the LRM-based classification and the dendrogram-based classification for each minor subpopulation group.
(A) Comparison between the LRM-based classification and dendrogram-based classification for the admixed group, (B) comparison between the LRM-based classification and dendrogram-based classification for the aromatic group, (C) comparison between the LRM-based classification and dendrogram-based classification for the aus group.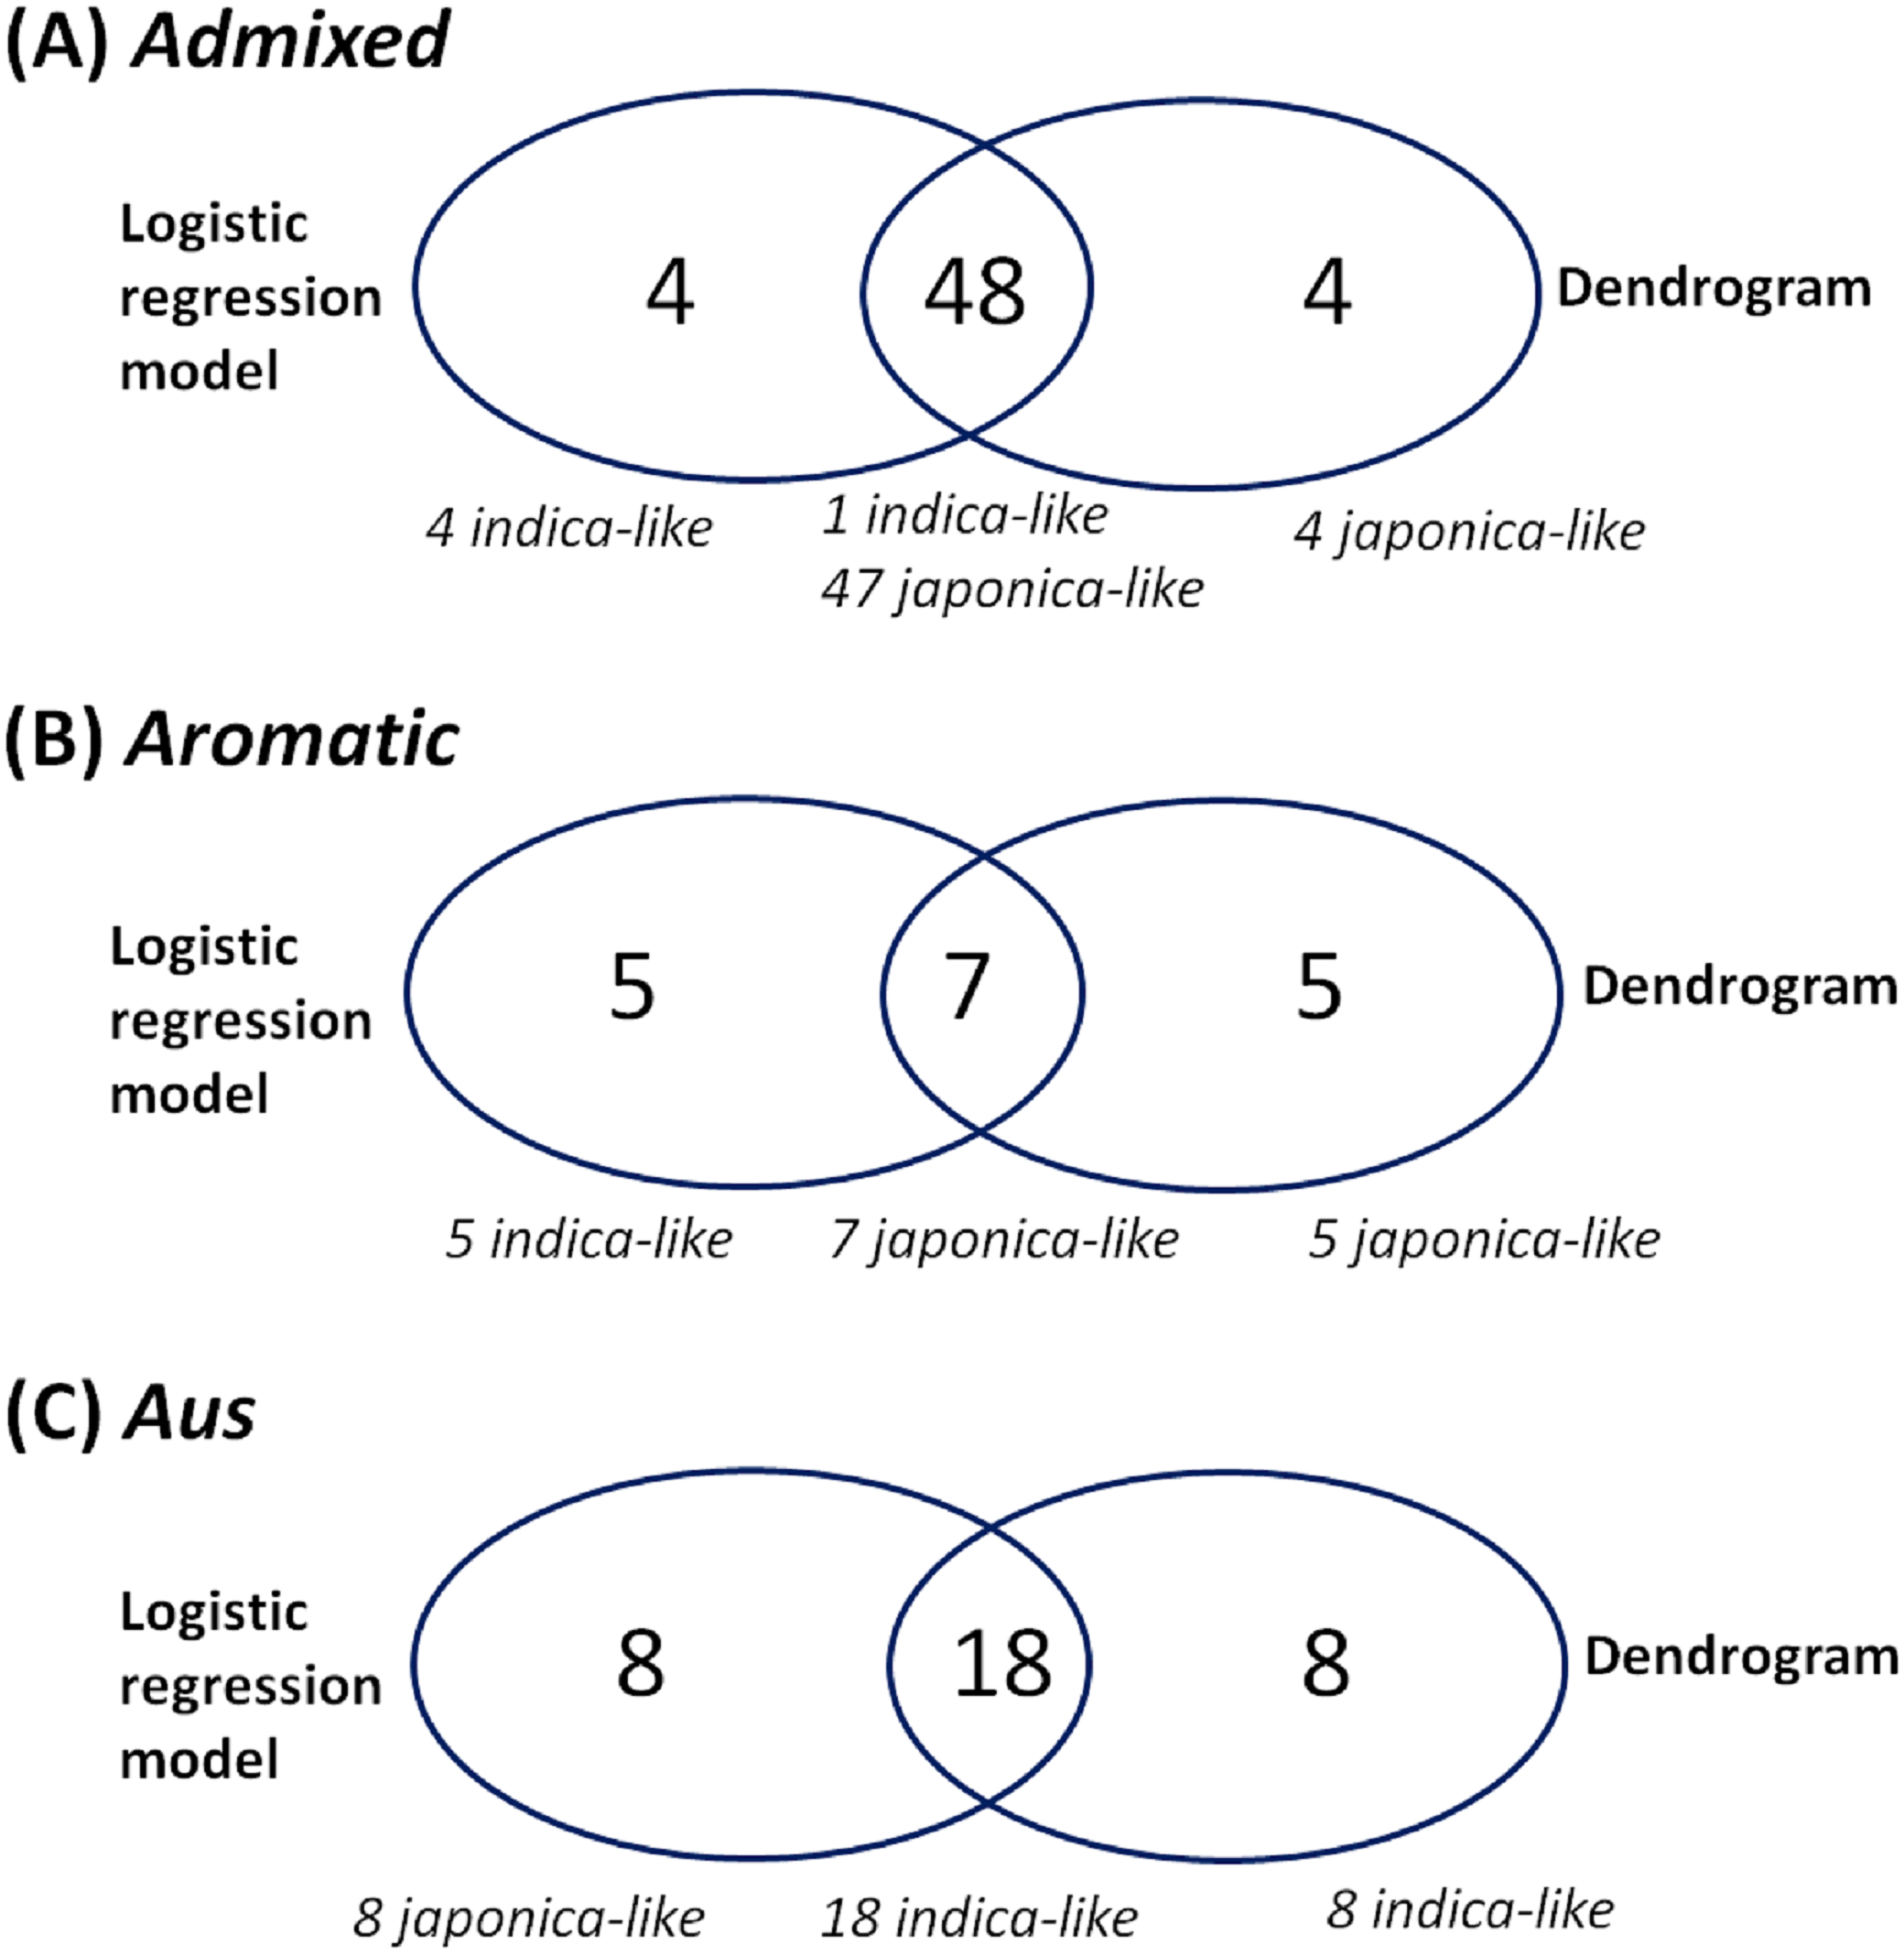
Discussion
The indica and japonica in Oryza sativa can be classified based on phenotypic observations by humans. However, the classification by humans can be subjective so that the classification results could sometimes be biased by an observer’s perception. Meanwhile, the indica/japonica classification by the LRM is thoroughly systematic and quantitative. In this aspect, the indica/japonica classification qualities by the LRM are expected to be comparable to or better than the qualities made by humans. In fact, the customized LRM (Eq. (3)) achieved the indica/japonica classification accuracy of 100% given the 280 indica/japonica accessions.
Table 1 and Fig. 1 suggest that the more predictor variables there are, the stronger the indica/japonica separation power (AUC). This implies that the variation in a single trait is narrowly distinct between indica and japonica perhaps due to intensive genetic admixture by breeding over history (Zhao et al., 2010; Xu et al., 2012), and that the variation given multiple traits is substantially distinct between indica and japonica because multiple layers of the narrow effects collectively magnify differences between indica and japonica. In this study, the fully accurate indica/japonica separation power (AUC = 1) of the LRM was achieved with a set of seven phenotypic variables (Table 1 and Fig. 1). The H-statistic value of nearly zero for every phenotypic variable indicates that the indica/japonica separation power was not overestimated by unexpected synergetic effects between the phenotypic variables.
Table 2 shows that the panicle-related traits, straighthead susceptibility and blast resistance frequently appeared across all sets. This may be related to previous knowledge that the variations in panicle characteristics, straighthead susceptibility and blast resistance are strongly associated with the indica and japonica differentiation: panicles are long and sparse in indica but short and dense in japonica (Bai et al., 2016); straighthead resistance and blast resistance are greater in indica than japonica (Yan et al., 2005; Jia et al., 2011).
The customized LRM (Eq. (3)) was applied to each minor subpopulation group (aromatic, aus, admixed). Applying Eq. (3) to the aromatic and aus groups aimed to see how well the resulting classifications reflect their known evolutionary relationships with both indica and japonica: aromatic is intermediate but narrowly closer to japonica; aus is distinct from but closely related to indica (Garris et al., 2005; Thomson et al., 2007; Kovach et al., 2009; Huang et al., 2012; Schatz et al., 2014; Civan et al., 2015; McCouch et al., 2016; Chin et al., 2017). Regarding the aromatic accessions, the dendrogram-based classification formed the aromatic group distantly from the japonica group in the japonica-varietal clade, which is consistent with the previous knowledge that aromatic is narrowly close to japonica between indica and japonica. The agreement between the dendrogram-based and LRM-based classifications was 58.3% (7/12). The low agreement may be related to the subtle phenotypic similarity between aromatic and japonica (Garris et al., 2005). Regarding the aus accessions, the dendrogram-based classification assigned all of them to the aus group in the indica-varietal clade, which was consistent with the previous knowledge that aus and indica are distinct within a close evolutionary relationship. The agreement of 69.2% (18/26) between the dendrogram-based and LRM-based classifications suggests that phenotypic variation between the aus and japonica groups overlaps to some extent. Perhaps, it may be because the sub-speciation of aus from indica, occurred in a geographically isolated area (Bangladesh, India) under short growing seasons and upland conditions, might have confounded its phenotypic characteristics (Garris et al., 2005; Londo et al., 2006). Regarding the admixed accessions, the dendrogram-based classification dispersed them across indica- and japonica-varietal clades. This indicated that the admixed group covered a wide spectrum of genomic properties. The admixed group was a collection of accessions with uncertain subpopulation membership due to intensive inter-subpopulation mating. This allows us to deduce that the admixed accessions may have a high potential to bridge between indica and japonica. The agreement of 92.3% (48/52) between the dendrogram-based and LRM-based classifications shows reliable classification ability of the LRM given Oryza sativa accessions with uncertain subpopulation membership.
Conclusion
This study showed that the indica/japonica classification based on phenotypes can be analyzed using the LRM. A set of phenotypes that can collectively generate the fully accurate indica/japonica separation power can be used for researching indica/japonica differentiation. For example, if a study aims to detect quantitative trait loci (QTL) associated with the indica/japonica differentiation, each phenotype that contributes to the fully accurate indica/japonica separation power can be used for genome-wide association studies (GWAS). Furthermore, research on the indica/japonica differentiation in Oryza sativa may benefit from the variation of genes responsible for the phenotypes that contribute to the fully accurate indica/japonica separation power.