
Vulnerability of diatom communities in the Peace–Athabasca Delta to environmental change
- Published
- Accepted
- Received
- Academic Editor
- Martina Doblin
- Subject Areas
- Biodiversity, Ecology, Freshwater Biology
- Keywords
- Diatoms, Acidification, Resource development, Wetlands, Environmental change, Drought
- Licence
- This is an open access article distributed under the terms of the Open Government License.
- Cite this article
- 2018. Vulnerability of diatom communities in the Peace–Athabasca Delta to environmental change. PeerJ 6:e5447 https://doi.org/10.7717/peerj.5447
Abstract
Habitat degradation associated with resource development is a major ecological concern, particularly in Canada’s boreal zone where limited information on biodiversity is available. Habitat degradation can lead to reductions in biodiversity and ecosystem function, especially when drivers of variability and diversity patterns have not been identified for a region of interest. In this study, the distribution of diatom genera in the Peace–Athabasca Delta in northeastern Alberta was examined in relation to seasonal, geographic, and alkalinity gradients. Grab samples of six abiotic variables (total dissolved nitrogen, total dissolved phosphorus, dissolved iron, turbidity, pH, and specific conductance (SPC)) were taken from 12 remote wetlands over three sampling periods, and regressed against an ordination of diatom community composition to identify key environmental drivers of diatom community variation. Indirect gradient analysis identified two major gradients among sites. First, separation of sites among sampling periods showed successional seasonal changes in diatom community composition. Second, separation of sites from the Peace sub-delta and Birch sub-delta showed a gradient of geographic separation. Direct gradient analysis failed to explain the underlying drivers of these two gradients, but did show that alkalinity is a key driver of diatom community composition in the Embarras sub-delta, and that these sites could be particularly vulnerable to community changes associated with acidification.
Introduction
Resource development can have a significant impact on the surrounding landscape. In Canada’s oil sands region, emissions of oxidized sulfur and nitrogen associated with mining activity have the potential to acidify surrounding boreal lake ecosystems (Hazewinkel et al., 2008) when these compounds are returned to the landscape in the form of acid precipitation (Beamish, 1976; Galloway et al., 1978; Cowling & Linthurst, 1981). In addition, the land clearing associated with such mining activity destabilizes the soil matrix and reduces water retention (Saha & Kukal, 2013) furthering the potential for acidification due to increased run-off. Higher run-off also increases the sediment and nutrient load of receiving waters leading to an increased potential for high turbidity associated with high levels of total suspended solids and eutrophication. Extensive upstream water extraction and river engineering in the oil sands region also reduces the volume of receiving waters in rivers and downstream wetlands further exacerbating eutrophication as nutrients become more concentrated in the water column and conductivity increases as ions also become more concentrated. Along with impacts from resource development, changes in receiving waters are intensified by warmer and drier conditions associated with climate change in Canada’s north that also reduce water levels through higher rates of evaporation (Rouse et al., 1997).
Diatoms have been used extensively in freshwater systems as indicators of ecosystem change (Kelly et al., 1998; Taylor, Harding & Archibald, 2007; Stevenson et al., 2008). Diatom-based indices have been developed as indicators of nutrient enrichment (trophic diatom index; Kelly & Whitton, 1995), organic pollution (Sládeček, 1986; Rott, Duthie & Pipp, 1998), acidification (Dickman et al., 1984), and climate change (Kilham, Theriot & Fritz, 1996). Diatoms are particularly useful for assessing stressors that are highly variable and cannot be accurately measured with single time-point water samples (Stevenson, 2006) as they represent a time-integrated sample rather than a snapshot. Individual taxa have also been identified as strong indicators of stressors of concern. For example, Actinella punctata is a strong indicator of acidic conditions (Dixit et al., 1993), Achnanthes minutissima is sensitive to metal exposure (Ivorra et al., 2002; Gold et al., 2003), and Epithemia turgida is a strong non-flood indicator (Wiklund et al., 2010). Diatoms can be particularly useful in remote areas where baseline data do not exist because their siliceous cell walls (i.e., frustules) accumulate in the sediment allowing for historical community composition to be assessed.
The subarctic boreal ecoregion north of Canada’s Athabasca oil sands is a remote area that is difficult to access and sample. Our knowledge of aquatic ecosystems in this area is correspondingly poor, restricting the ability of managers to minimize and mitigate the risks posed by industrial development in this sensitive region. The Peace–Athabasca Delta (PAD) in northeastern Alberta, Canada is one such area. To date, the majority of diatom studies in the oil sands region focus on historical diatom assemblages in lakes outside of the PAD (see: Pla, Curtis & Simpson, 2006; Hazewinkel et al., 2008; Curtis et al., 2010; Summers et al., 2016). One study by Moser, Smol & MacDonald (2004) looked at drivers of diatom community composition in Wood Buffalo National Park (WBNP), but all sites were north of Peace Point (59.125278, −112.446389) and outside of the Delta. To our knowledge, this is the only study surveying benthic diatom communities in wetlands of the PAD.
The purpose of this study was to examine physico-chemical variables potentially driving observed differences in diatom community composition in 12 wetlands of the PAD. This was done by first examining the differences in six variables over three sampling periods in each of the Athabasca (Creek-Mamawi Creek + Embarras), Peace and Birch sub-deltas, and secondly by regressing these variables against an ordination of community composition and abundance thus identifying key drivers of variation. This combined approach allows for examination of environmental factors associated with both individual sites and specific taxa.
Methods
Study sites
Samples were collected from 12 wetlands, covering a spatial extent of approximately 1,900 km2, across the PAD in northeastern Alberta, Canada (Fig. 1; Table 1). The PAD is a delta complex formed at the inland confluence of the Peace and the Athabasca Rivers (>1,000 m3/s), and the smaller Birch River (>2 m3/s) (mean daily discharge in m3/s from http://wateroffice.ec.gc.ca). It consists of a series of variably connected low-lying wetlands and their associated rivers covering 5,674 km2 west of Lake Athabasca (Timoney, 2013) in the Mackenzie River basin. Approximately 80% of the PAD lies within WBNP—an area protected both as a Canadian National Park (Parks Canada, 1922) and as a wetland of international importance under the Ramsar Convention (Ramsar Secretariat, 2003). The PAD is also an ecologically important boreal wetland that provides habitat to the largest free-roaming herd of bison (Bison bison) in the world (Timoney, 2013) and migrating waterfowl, such as the endangered whooping crane (Grus americana). The delta is impacted from upstream development such as oil sands mining in the Athabasca watershed and the Bennett hydroelectric dam on the Peace River.
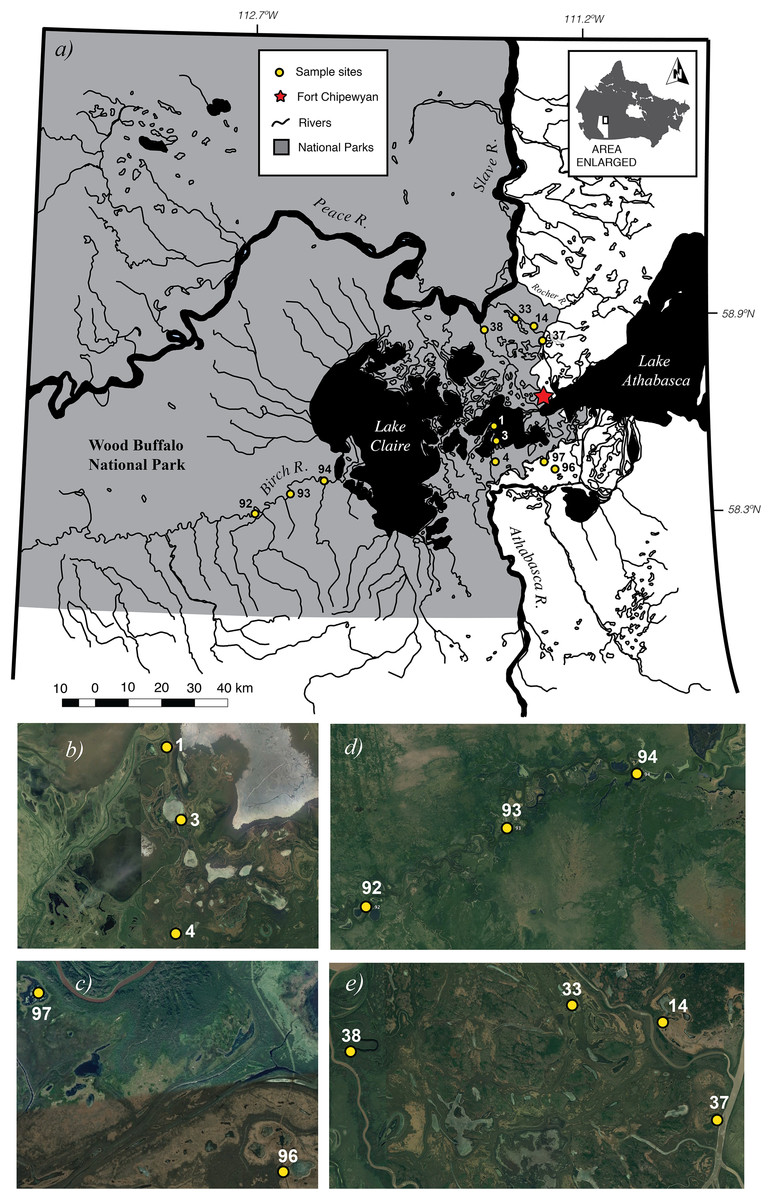
Figure 1: Map of 12 study sites (A). Close-up views of each of the four sub-basins Cree-Mamawi Creek (B), Embarras (C), Birch (D), and Peace (E) in the Peace–Athabasca Delta (PAD) in northeastern Alberta, Canada.
The study sites are also within Wood Buffalo National Park, a protected area of international significance, that extends more than 150 km west from the lower reaches of the Athabasca River and 200 km north before continuing across the Alberta border and into the Northwest Territories. Close-up views in (B) through (E) courtesy of Google Earth © 2016. Map data from NRCan Atlas of Canada 1,000,000 with projection NAD83, UTM Zone 12 composited using QGIS (v2.6.1-Brighton, https://qgis.org).
| Sub-delta | Site code | Site name | N | W | Spatial extent (ha) |
|---|---|---|---|---|---|
| Cree-Mamawi Creek | PAD 1 | Otter Creek | 58.6028 | −111.5258 | 31 |
| PAD 3 | Mamawi Bay | 58.5645 | −111.5113 | 33.5 | |
| PAD 4 | Mamawi Creek Pond | 58.5079 | −111.518 | 11 | |
| Peace River | PAD 14 | Rat Lake | 58.8746 | −111.3247 | 0.37 |
| PAD 33 | Egg Lake | 58.8966 | −111.4181 | 1,377 | |
| PAD 37 | Rocher | 58.8323 | −111.2812 | 7.1 | |
| PAD 38 | Horseshoe Slough | 58.8637 | −111.5837 | 47 | |
| Birch River | PAD 92 | Johnson Lake | 58.3561 | −112.7585 | 124 |
| PAD 93 | Birch Oxbow | 58.4106 | −112.5739 | 6.53 | |
| PAD 94 | Modere Lake | 58.4477 | −112.405 | 51.5 | |
| Embarras River | PAD 96 | Gray wavies | 58.4835 | −111.2109 | 6.57 |
| PAD 97 | Embarras1 | 58.5072 | −111.2674 | 9.13 |
Note:
Both Cree-Mamawi Creek and the Embarras River are part of the relictual Athabasca Delta.
Water chemistry
Water samples for chemical analysis were collected as part of the Joint Canada-Alberta implementation plan for oil sands monitoring from June 2012 to August 2015 following standard operating protocols. Samples for metals, major ions, and nutrients were analyzed at Environment Canada’s National Laboratory for Environmental Testing facility in Burlington, Ontario using nationally recognized analytical standards and procedures (Environment Canada, 2012).
Periphyton
Samples for diatom community composition analysis were collected from the epiphytic biofilm community at each of the 12 wetland sites. Both submerged and emergent macrophytes were sampled as the dominant substrate. Major emergent taxa included Typha sp. and Equisetum sp. while major submerged taxa included: Nuphar variegata, Myriophyllum spp., Ceratophyllum sp., Ultricularia sp., and Potamogeton spp. A total of 10 macrophyte leaf clippings were collected per site for the initial June 2014 sampling to ensure an adequate density of material for identification. After preliminary analysis of June 2014 samples, macrophyte collection was reduced to five clippings for August 2014 and 2015 due to the excessive density of diatom valves obtained from the initial material collected using the 10 clipping method. For each sampling period, clippings were combined into one composite sample to represent the broadest possible periphyton assemblage in each individual wetland site. This protocol was modified for use in wetland habitats from the US EPA’s Rapid Bioassessment Protocols for Use in Streams and Wadeable Rivers (EPA 841-B-99-002). Due to discordant macrophyte assemblages among sites, maintaining consistent collection of epiphytic biofilm material was not possible (e.g., length, volume, surface area, weight of clippings). To account for this, community data was summarized as relative abundance to be comparable among sampling locations. Clippings were placed into one L wide-mouthed sampling jars with approximately 500 mL of water and vigorously shaken to remove the biofilm. In 2014, local wetland water was used to collect samples. For 2015 sampling this was changed to Fort Chipewyan municipal tap water to reduce the density of fine particulate matter in the sample. After shaking, macrophyte clippings were discarded and the remaining periphyton community sample preserved with 5% w/v Lugol’s iodine solution to a final concentration of 1% (v/v) and then refrigerated until further processing. All biological material collected from WBNP was approved by the Parks Canada Agency under Research and Collection permit # WB-2013-13514.
Diatom samples were further processed for laboratory identification according to the methods of Stevenson & Bahls (1999). In brief, samples were allowed to settle for 24 h after which the supernatant was removed reducing the volume of sample to no more than 250 mL. From each 250 mL sample a 10 mL periphyton subsample was decalcified by acid digestion (1 M HCl) and then boiled in concentrated hydrogen peroxide (30% H2O2) for three hours to oxidize organic matter, and to further clean diatom frustules. A second round of digestion with concentrated nitric acid (15 M HNO3) was performed to further break down residual polysaccharides from the biofilm matrix. A 0.5 mL subsample of cleaned diatom valves was mounted in Naphrax™ (Brunel Microscopy Ltd. Chippenham, England) to produce permanent slides for identification of diatom frustules (see Stevenson & Bahls, 1999).
Each diatom sample was observed and identified with a Leica DM2500, or an Olympus BX40 compound microscope. Diatoms were identified at 400× or 1,000× magnification (under oil immersion, where necessary) and identified to the level of morphospecies. For the purposes of minimizing identification errors and to simplify identification for routine biomonitoring, diatom community data were summarized at genus level for subsequent analyses (Kelly, Penny & Whitton, 1995); however, some notable species (Cocconeis placentula and E. turgida) and the implications of their presence and abundance are discussed. Taxonomic identification followed the morphologies described by Krammer & Lange-Bertalot (1986, 1988, 1991, 1992), Krammer (2003), and Spaulding et al. (2010). Throughout, a minimum of 300 valves were counted, and a taxa accumulation curve generated for each slide. The average number of valves counted and identified per slide was 1,102 (range: 300–6,470). In order to maximize encounters of rare taxa, slides were analyzed until 50 consecutive fields of view with no new taxa were observed.
Statistical analyses
Indirect and direct gradient analyses were performed in order to identify spatial and temporal gradients in community composition among samples. Data were summarized per site in a genus matrix of proportional abundance. A detrended correspondence analysis (DCA; Hill & Gauch, 1980) was performed in order to determine if the gradient response was linear or unimodal (function: decorana; package: vegan). The results of the DCA showed that the response was linear with a first axis gradient length of 2.33 units. According to Legendre & Legendre (1998) a gradient length of <2.5 denotes a linear gradient, so principal components analysis (PCA; unconstrained) and redundancy analysis (RDA; constrained) were chosen for further analyses. PCA (Hotelling, 1933) was used to examine biotic variation among sites (function: rda; package: vegan). The site by genus matrix was logit transformed as suggested by Warton & Hui (2011) to remove a minor horseshoe effect (function: logit; package: car). The initial PCA results showed four sites as outliers (PAD 4 June 2014; PAD 3, PAD 4, and PAD 14 from August 2015) leading to the clumping of the remaining sites. Therefore, these outliers were removed from subsequent analyses in order to examine community variation within the largest group of sites whose variation could be reasonably assessed with the available data. The resultant PCA also showed clumping of samples around the origin along axis 2 and thus data were plotted on axes PC1 and PC3 to maximize the separation of sites in multidimensional space. After gradients among wetlands were identified by PCA, a direct gradient analysis was performed to identify what variables may be driving these underlying patterns. Physical and chemical water quality variables were chosen a priori for use in a RDA (Van Den Wollenberg, 1977). The RDA first performed a multiple regression comparing continuous response variables to a community ordination in order to identify factors that may be driving differences among sites and further, which variables were associated with individual taxa (function: rda; package: vegan). The continuous variables included: total dissolved nitrogen (mg/L), total dissolved phosphorus (mg/L), dissolved iron (μg/L), turbidity (NTU), pH, and SPC (μS/cm). These common water quality variables were chosen as they have been previously shown to determine diatom species occurrence as they include essential macro- (nitrogen and phosphorus) and micro- (iron) nutrients (Guillard & Lorenzen, 1972). Turbidity is known to affect light availability for photosynthesis (Goldsborough & Robinson, 1996) while pH (Stokes, 1986) and SPC (Potapova & Charles, 2003) have been associated with changes in species richness and community composition. Due to strong correlations between dissolved iron and total dissolved phosphorus (r = 0.64), and between dissolved iron with total dissolved nitrogen (r = 0.79), the RDA was run without dissolved iron to meet assumptions of multicollinearity. Similar to the PCA, the RDA was run using the logit transformed site by genus matrix with PAD 4 (June 2014), PAD 3 (August 2015), PAD 4 (August 2015), and PAD 14 (August 2015) removed. The RDA output was plotted on axes RDA1 and RDA3 to visualize the strongest correlations with explanatory variables.
All analyses were performed using R version 3.3.2 statistical software (R Core Team (2014).
Results
Hydrological conditions in the PAD sites were increasingly dry over the three sampling periods following widespread flooding 1 month prior to the first sampling period in June of 2014 due to an ice jam on the Peace River (see https://wateroffice.ec.gc.ca/). Due to interference from the ice jam, water levels could not be recorded during the summer of 2014 as levels exceeded all the available weirs. For example, water levels at the two nearest hydrometric stations reported extreme events during this period with levels >215 m (Athabasca R. at Embarras, Station no. 07DD001) and >208 m (Peace R. at Quatre Fourches, 07KC005) (95% CI [213.42–213.50] and [191.14–193.06] m on the Athabasca and Peace R., respectively) (https://wateroffice.ec.gc.ca/). Extreme annual discharge events associated with snowmelt have occurred three times previously on the Athabasca River and 27 times on the Peace River since the recorded gauging of these sites in the early 1970s. Many of the flooded sites (e.g., PAD 4) had dried significantly by August of 2014 (see Fig. 2) with similar dry conditions in the following August (https://wateroffice.ec.gc.ca/). Increasingly dry hydrological conditions could also be associated with shifts in water quality and corresponding changes in the diatom community composition.
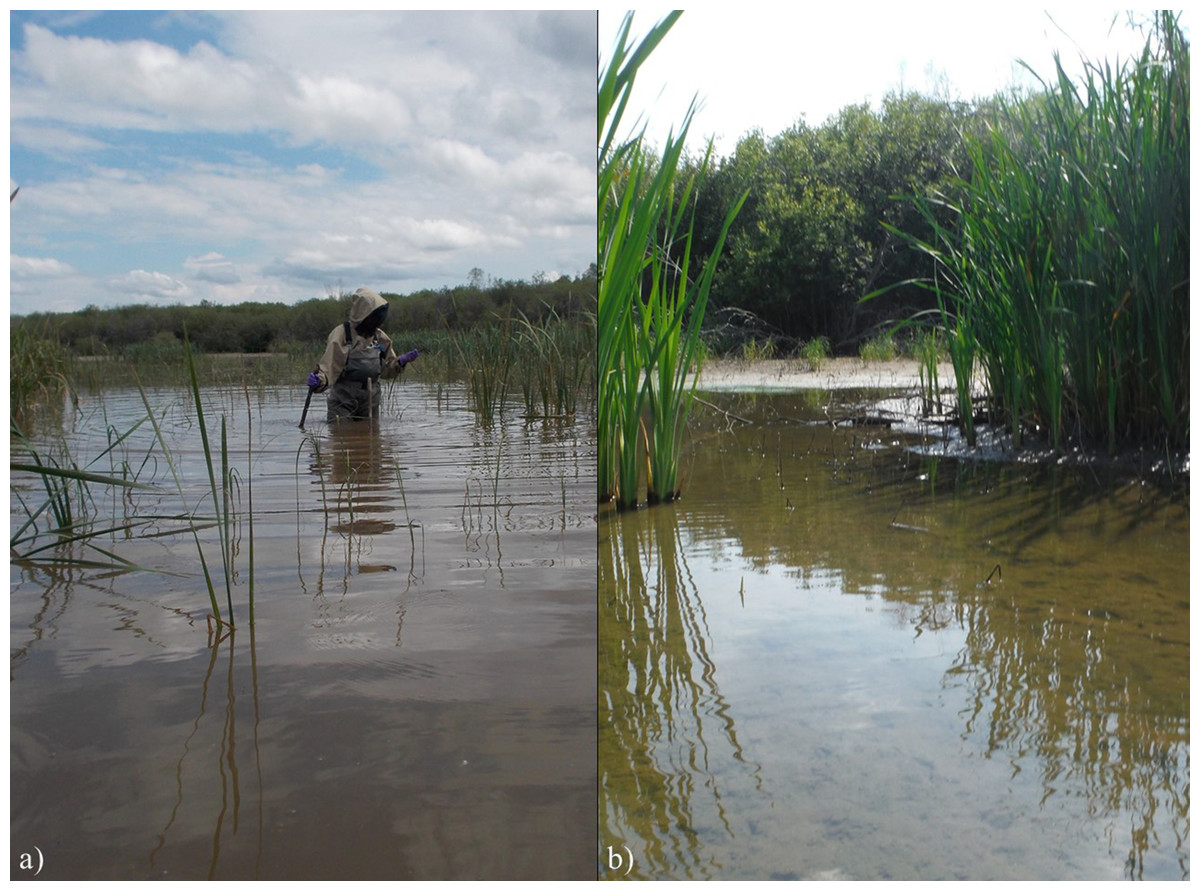
Figure 2: (A) Flooding in PAD 4 (Mamawi Creek Pond) in June 2014 due to an ice jam on the Peace River, and (B) subsequent drying of PAD 4 by August 2014.
Photo Credit: Stephanie J. Connor.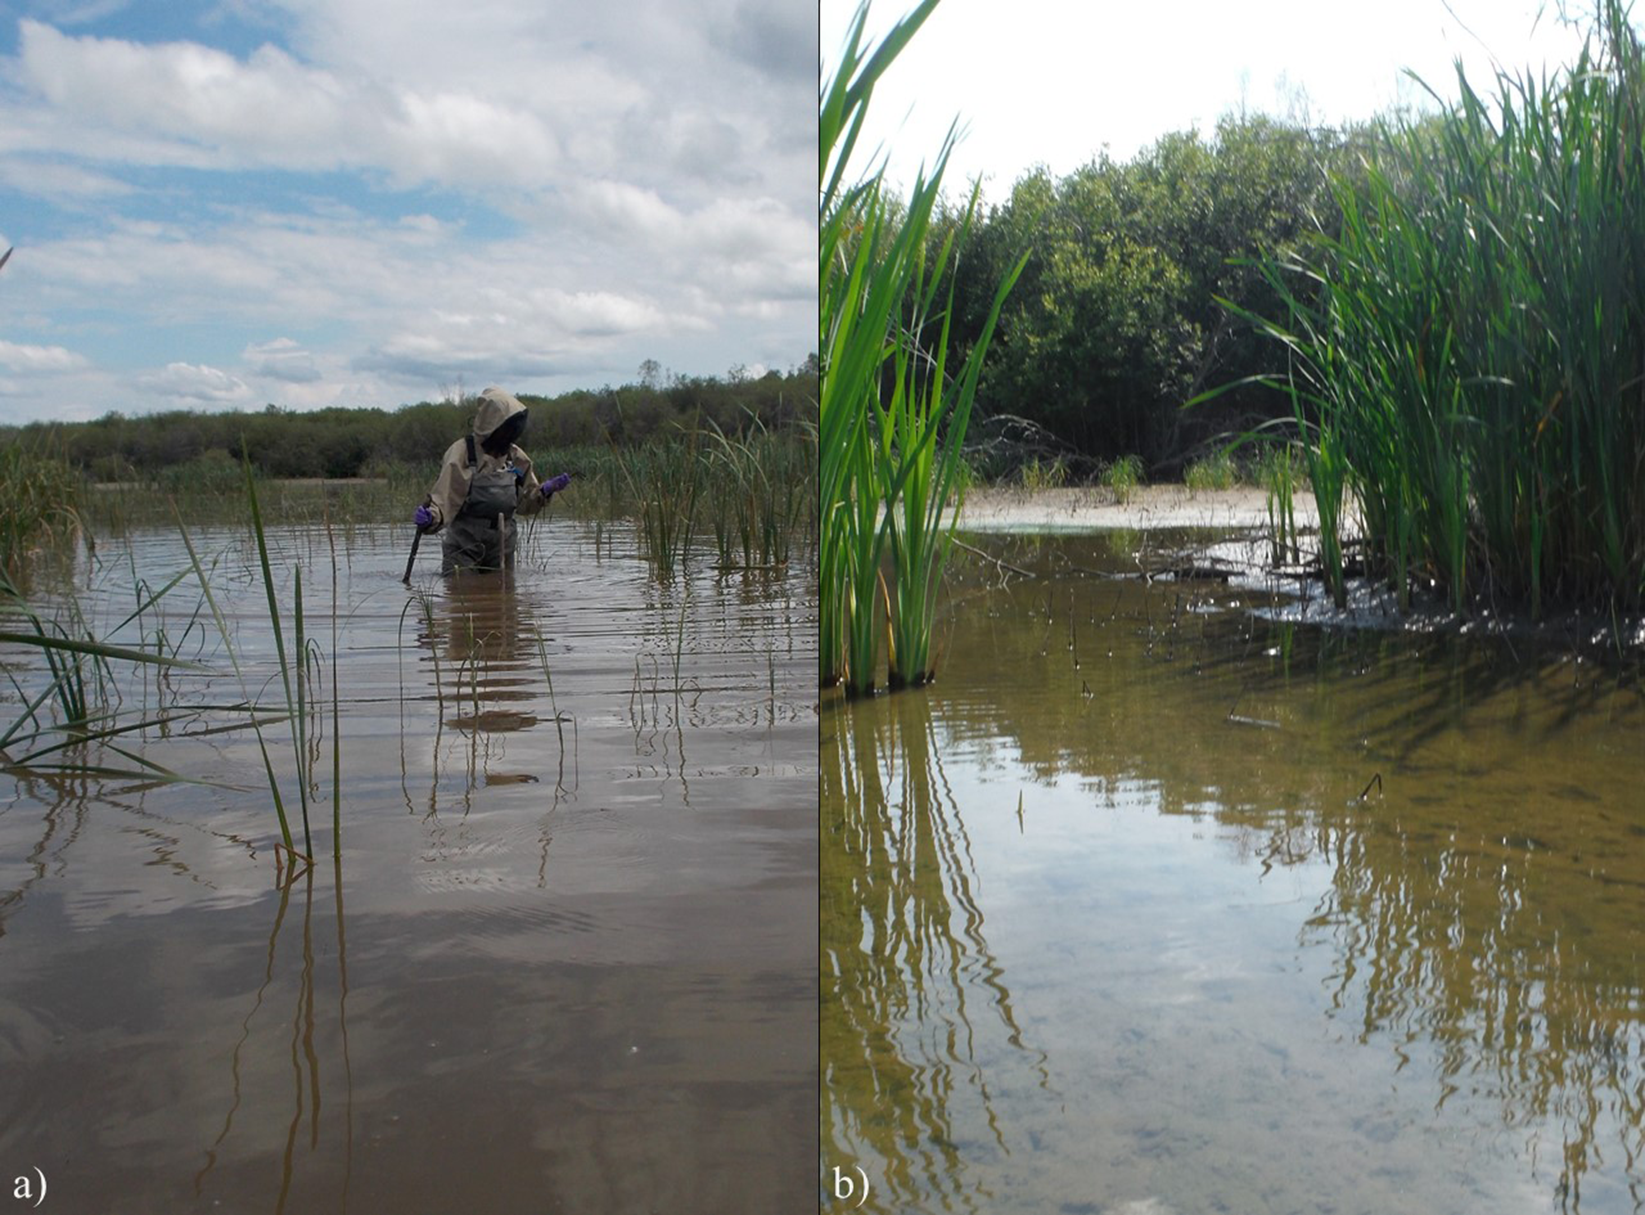
Water chemistry
Water quality in the three sub-deltas was also variable (Table 2). Nutrients such as total dissolved nitrogen increased 120% (AVG ± SE 1.17 ± 0.2 to 2.57 ± 0.66 mg/L) within the Peace sub-delta (n = 4) over the study period while total dissolved phosphorus increased 233% from, on average, 0.03 ± 0.005 to 0.1 ± 0.028 mg/L in wetlands in the Cree-Mamawi Creek sub-delta (n = 3). The average concentration of dissolved iron increased in both the Peace (166.2 ± 63.2 to 960 ± 386.4 μg/L) and Cree-Mamawi Creek (298.4 ± 50.7 to 1367.7 ± 527.3 μg/L) sub-deltas, and was highly variable in August 2015 (e.g., across all sub-deltas the standard deviation is 107% of the mean). The turbidity of each sub-delta became increasingly variable over the sample period and ranged from extremely turbid (40 NTU, Athabasca) to clear (0.7 NTU, Birch). The pH decreased in the Birch (8.14 ± 0.6 to 7.46 ± 0.07), Peace (8.17 ± 0.31 to 7.71 ± 0.12), and Embarras (9.04 ± 0.12 to 7.98 ± 0.1) sub-deltas over the three sample periods. While quite variable, the SPC of each sub-delta increased with season (Cree-Mamawi Creek: 264.3 ± 10.6 to 351.7 ± 17.7; Peace: 275.5 ± 28.4 to 385.3 ± 47.2; Birch: 237.7 ± 68.2 to 314 ± 30; Embarras: 186.5 ± 7.8 to 242.5 ± 43.5 μS/cm).
| Cree-Mamawi Creek | Peace | Birch | Embarras | ||
|---|---|---|---|---|---|
| Total dissolved nitrogen (mg/L) | June 2014 | 0.61 ± 0.06 | 1.17 ± 0.2 | 1.16 ± 0.13 | 1.05 ± 0.18 |
| August 2014 | 0.97 ± 0.1 | 1.54 ± 0.25 | 0.85 ± 0.09 | 0.91 ± 0.14 | |
| August 2015 | 2.46 ± 0.72 | 2.57 ± 0.66 | 1.12 ± 0.17 | 1.22 ± 0.36 | |
| Total dissolved phosphorus (mg/L) | June 2014 | 0.03 ± 0.005 | 0.03 ± 0.01 | 0.03 ± 0.01 | 0.04 ± 0.004 |
| August 2014 | 0.05 ± 0.015 | 0.03 ± 0.01 | 0.03 ± 0.01 | 0.03 ± 0.004 | |
| August 2015 | 0.1 ± 0.028 | 0.04 ± 0.01 | 0.05 ± 0.01 | 0.06 ± 0.005 | |
| Dissolved iron (μg/L) | June 2014 | 298.4 ± 50.7 | 166.2 ± 63.2 | 57 ± 32.3 | 253 ± 11 |
| August 2014 | 332.2 ± 57.3 | 212.9 ± 53.8 | 88.7 ± 55.2 | 354.5 ± 126.5 | |
| August 2015 | 1367.7 ± 527.3 | 960 ± 368.4 | 268 ± 116.7 | 247.6 ± 174.4 | |
| Turbidity (NTU) | June 2014 | 10.7 ±7.4 | 2.3 ± 0.8 | 1.4 ± 0.4 | 1.2 ± 0.1 |
| August 2014 | 10.9 ± 1.6 | 1.7 ± 0.4 | 2.1 ± 0.4 | 1.2 ± 0.4 | |
| August 2015 | 10 ± 4.1 | 11.6 ± 4.2 | 6.8 ± 1.8 | 8 ± 4.8 | |
| Specific conductance (μS/cm) | June 2014 | 264.3 ± 10.6 | 275.5 ± 28.4 | 237.7 ± 68.2 | 186.5 ± 7.8 |
| August 2014 | 333.8 ± 23.9 | 389.5 ± 41.8 | 251 ± 51.7 | 198 ± 17 | |
| August 2015 | 351.7 ± 17.7 | 385.3 ± 47.2 | 314 ± 30 | 242.5 ± 43.5 | |
| pH | June 2014 | 7.96 ± 0.06 | 8.17 ± 0.31 | 8.14 ± 0.6 | 9.04 ± 0.12 |
| August 2014 | 7.82 ± 0.06 | 7.78 ± 0.1 | 7.69 ± 0.08 | 8.12 ± 0.16 | |
| August 2015 | 9.04 ± 0.17 | 7.71 ± 0.12 | 7.36 ± 0.07 | 7.98 ± 0.1 | |
Notes:
The sampling periods include June 2014, August 2014, and August 2015. Surface water quality parameters include: total dissolved nitrogen (mg/L), total dissolved phosphorus (mg/L), dissolved iron (μg/L), turbidity (NTU), specific conductance (μS/cm), and pH. Four sub-Deltas were sampled including: Creek-Mamawi Creek, Peace River, Birch River, and Embarras River. Note: both Cree-Mamawi Creek and the Embarras are part of the relictual Athabasca Delta.
Periphyton
Genus-level periphyton richness increased over time, and ranged from 9 to 31 across all study sites within the PAD with a total of 37 genera identified by the end of the driest sampling period in August 2015. However, the diversity of the biofilm community was relatively low at most sites (H < 2; Table 3). Communities were characterized by a few dominant taxa (Table 4) with upward of 28 additional taxa in low abundance (<5% abundance). Common taxa included Cocconeis Ehrenberg 1837, Epithemia Kützing 1844, Gomphonema Ehrenberg 1832, Navicula Bory de Saint-Vincent 1822, and Nitzschia Hassall 1845 varying in relative abundance across sites and seasons (Table 4). C. placentula (sensu lato) Ehrenberg 1838 was the only species of Cocconeis present, and was found at every wetland sampled with the exception of PAD 33 (Egg Lake) in June 2014. Additionally, C. placentula was the dominant diatom species at wetlands in the Embarras sub-delta throughout the study period (Table 4). E. turgida (Ehrenberg) Kützing 1844 was the most common species of Epithemia present with low abundances of both E. adnata (Kützing) Brébisson 1838 (<1% average relative abundance across sites and seasons) and E. sorex Kützing 1844 (<5% average relative abundance across sites and seasons) also present. The average relative abundance across all sites of Epithemia increased by 167% throughout the study period (4.8% average relative abundance in June 2014; and 12.8% average relative abundance in August 2015) and was dominant at many sites in August 2015 (Table 4).
| Site code | Richness | Shannon diversity (H) | ||||
|---|---|---|---|---|---|---|
| June 2014 | August 2014 | August 2015 | June 2014 | August 2014 | August 2015 | |
| PAD 1 | 16 | 19 | 23 | 2.11 | 2.4 | 1.7 |
| PAD 3 | 16 | 17 | 31 | 2.03 | 2.06 | 1.72 |
| PAD 4 | 18 | – | 28 | 2.09 | – | 2.07 |
| PAD 14 | 12 | 11 | 20 | 1.89 | 1.56 | 2 |
| PAD 33 | 9 | 11 | 23 | 1.79 | 0.98 | 1.41 |
| PAD 37 | 14 | 11 | 16 | 1.53 | 1.15 | 1.47 |
| PAD 38 | 19 | 17 | 18 | 2.04 | 2.03 | 1.81 |
| PAD 92 | 14 | 13 | 17 | 2.05 | 1.5 | 1.17 |
| PAD 93 | 10 | 11 | 12 | 1.8 | 2 | 1.61 |
| PAD 94 | 13 | 12 | 14 | 2.16 | 1.47 | 0.99 |
| PAD 96 | 17 | 10 | 22 | 1.43 | 1.18 | 0.74 |
| PAD 97 | 18 | 14 | 21 | 0.6 | 0.36 | 0.95 |
| Rank abundance 1 | Rank abundance 2 | Rank abundance 3 | |
|---|---|---|---|
| Site code | June 2014 | ||
| PAD 1 | Rhoicosphenia (0.23) | Gomphonema (0.23) | Eunotia (0.11) |
| PAD 3 | Gomphonema (0.38) | Epithemia (0.15) | Eunotia (0.11) |
| PAD 4 | Nitzschia (0.26) | Meridion (0.21) | Gomphonema (0.21) |
| PAD 14 | Gomphonema (0.22) | Eunotia (0.21) | Navicula (0.18) |
| PAD 33 | Eunotia (0.34) | Epithemia (0.21) | Nitzschia (0.15) |
| PAD 37 | Fragilaria (0.59) | Cocconeis (0.11) | Epithemia (0.06) |
| PAD 38 | Fragilaria (0.35) | Gomphonema (0.14) | Navicula (0.11) |
| PAD 92 | Cocconeis (0.31) | Fragilaria (0.22) | Navicula (0.12) |
| PAD 93 | Navicula (0.29) | Sellaphora (0.27) | Nitzschia (0.19) |
| PAD 94 | Nitzschia (0.21) | Navicula (0.20) | Gomphonema (0.10) |
| PAD 96 | Cocconeis (0.63) | Fragilaria (0.10) | Aulacoseira (0.08) |
| PAD 97 | Cocconeis (0.88) | Gomphonema (0.04) | Epithemia (0.01) |
| Site code | August 2014 | ||
| PAD 1 | Nitzschia (0.20) | Epithemia (0.17) | Gomphonema (0.14) |
| PAD 3 | Gomphonema (0.25) | Epithemia (0.20) | Fragilaria (0.15) |
| PAD 4 | – | – | – |
| PAD 14 | Gomphonema (0.35) | Navicula (0.23) | Encyonema (0.20) |
| PAD 33 | Fragilaria (0.74) | Epithemia (0.13) | Stauroneis (0.04) |
| PAD 37 | Cocconeis (0.70) | Nitzschia (0.10) | Gomphonema (0.07) |
| PAD 38 | Navicula (0.30) | Cocconeis (0.2) | Rhopalodia (0.17) |
| PAD 92 | Epithemia (0.50) | Nitzschia (0.22) | Cocconeis (0.09) |
| PAD 93 | Navicula (0.41) | Nitzschia (0.11) | Gomphonema (0.10) |
| PAD 94 | Nitzschia (0.46) | Cocconeis (0.27) | Navicula (0.10) |
| PAD 96 | Cocconeis (0.60) | Epithemia (0.18) | Encyonema (0.15) |
| PAD 97 | Cocconeis (0.94) | Navicula (0.02) | n/a |
| Site code | August 2015 | ||
| PAD 1 | Cocconeis (0.45) | Epithemia (0.19) | Nitzschia (0.17) |
| PAD 3 | Cocconeis (0.52) | Epithemia (0.16) | Gomphonema (0.09) |
| PAD 4 | Epithemia (0.41) | Navicula (0.12) | Nitzschia (0.17) |
| PAD 14 | Eunotia (0.28) | Gomphonema (0.24) | Encyonema (0.17) |
| PAD 33 | Epithemia (0.65) | Encyonema (0.08) | Nitzschia (0.07) |
| PAD 37 | Cocconeis (0.47) | Epithemia (0.28) | Fragilaria (0.10) |
| PAD 38 | Cocconeis (0.34) | Fragilaria (0.18) | Epithemia (0.16) |
| PAD 92 | Cocconeis (0.72) | Nitzschia (0.07) | Navicula (0.04) |
| PAD 93 | Nitzschia (0.49) | Cocconeis (0.14) | Navicula (0.11) |
| PAD 94 | Cocconeis (0.76) | Gomphonema (0.09) | Nitzschia (0.05) |
| PAD 96 | Cocconeis (0.84) | Nitzschia (0.07) | Halamphora (0.01) |
| PAD 97 | Cocconeis (0.78) | Gomphonema (0.10) | Navicula (0.05) |
The PCA analysis examined differences in the periphyton community among sites based on biotic variation and explained 34.6% of the variance among samples over three axes (PC1 14.8%, PC2 10.1%, and PC3 9.7%). The first axis (PC1) primarily shows interannual separation in samples due to seasonal differences between June 2014 to August 2015 (Fig. 3). Along PC3 there is separation of the Peace sub-delta sites from the Birch sub-delta sites (Fig. 3) with variation based on geographic separation. Along axis PC2 there was clumping of samples around the origin and no gradient was detected (data not shown).
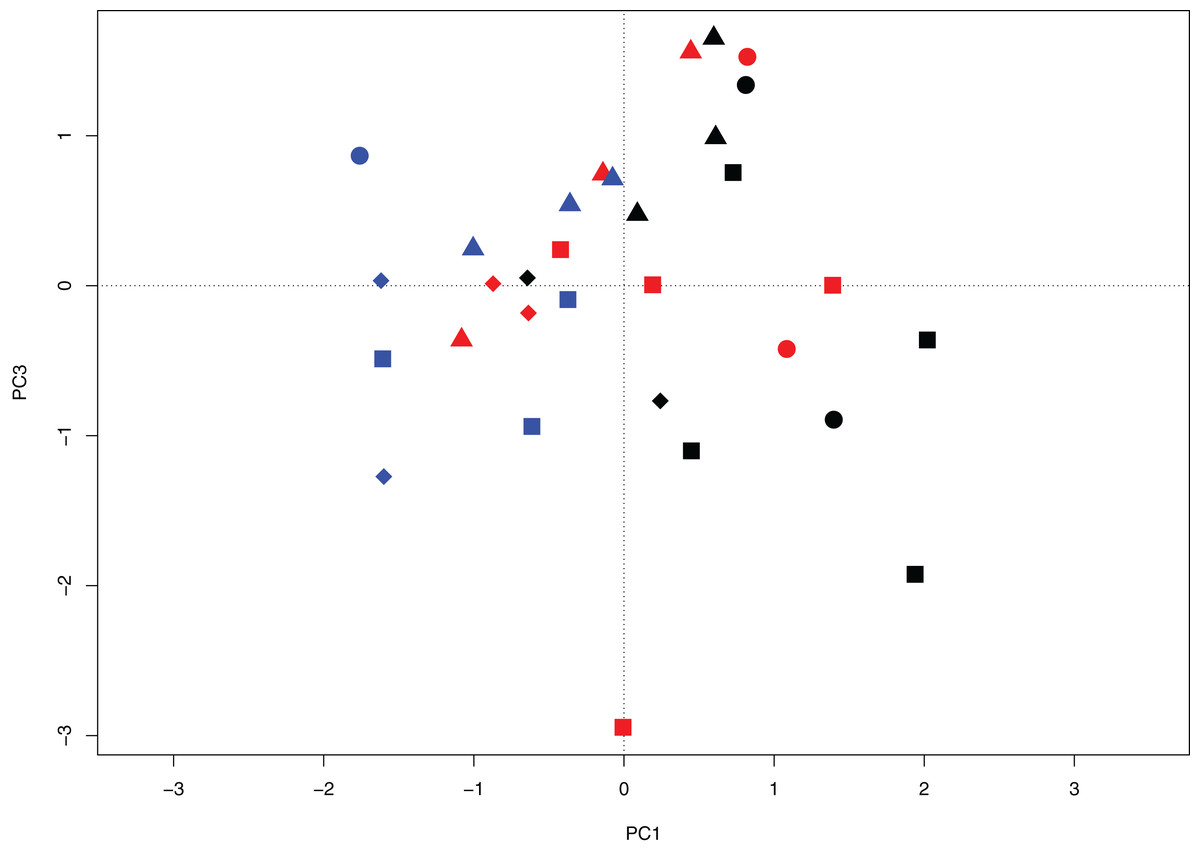
Figure 3: Principal components biplot projecting axes PC1 and PC3 for wetland sites of the Peace–Athabasca Delta based on diatom community composition, summarized at genus level.
Sites include wetlands in each of four sub-deltas: Cree-Mamawi Creek (circles), Peace (squares), Birch (triangles), and Embarras (diamonds). Results include data from three sampling periods: June 2014 (black), August 2014 (red), and August 2015 (blue). Variation among sites represents variation due to biotic differences (i.e., diatom community composition). PC1 explains 14.8% variance among sites and shows variation among sampling periods and PC3 explains an additional 9.71% variance and represents variation between the Peace and Birch sub-Deltas.
The RDA (Figs. 4 and 5) examined the periphyton sampling sites compared to physico-chemical parameters and explained 21.6% of the (constrained) variance with a residual of 78.4%. Of the portion of the explained variance, RDA axis 1 accounted for 11.9% and was negatively correlated with pH (r = −0.55) and turbidity (r = −0.53). RDA axis 1 also coincided with a gradient of pH separating Embarras wetland samples (PAD 96 and 97, all sampling periods) from the Peace sub-delta samples (PAD 14, 33, and 38) as well as from PAD 93 (all sampling periods) in the Birch sub-delta (Fig. 4). Along this same pH gradient the diatom, Cocconeis Ehrenberg 1837 was also strongly associated with high pH (Fig. 5).
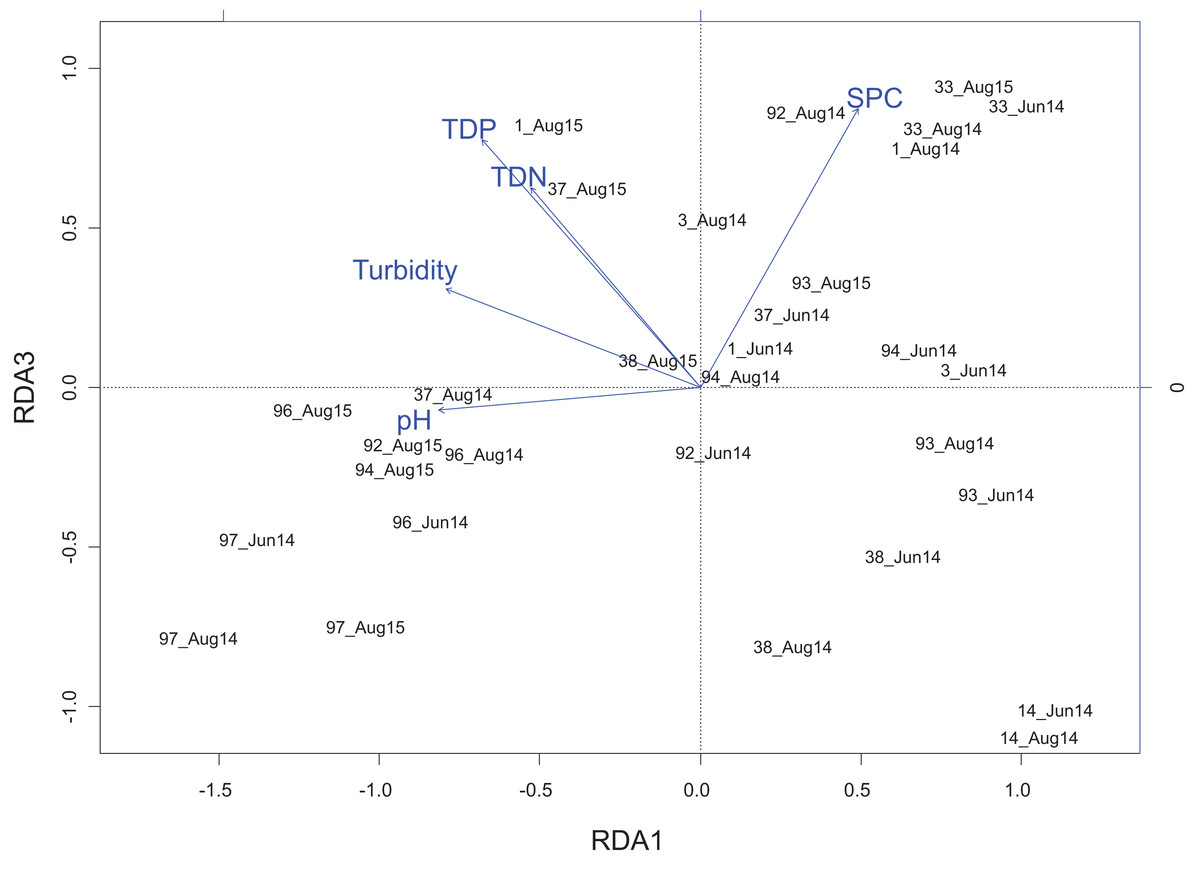
Figure 4: Redundancy analysis biplot projecting RDA axes 1 and 3 showing wetland sites from the Peace–Athabasca Delta and and associated physico-chemical parameters.
Biplot summarizes data from three sampling periods: June 2014, August 2014, and August 2015. Included physico-chemical parameters include: TDN or total dissolved nitrogen (mg/L), TDP or total dissolved phosphorus (mg/L), pH, turbidity (NTU), and SPC or specific conductance (μS/cm). The overall variance explained by the RDA was 21.6% with 11.9% explained by axis RDA axis 1 and 2.3% explained by RDA axis 3. RDA axis 1 shows a gradient of pH that separates the Embarras sub-delta (PAD 96 and 97) from the Peace sub-delta (PAD 14, 33, and 38). RDA axis 3 shows a gradient of ion content/nutrient concentration that separates the Embarras sub-delta from the Cree-Mamawi Creek sub-delta (both in the relictual Athabasca sub-delta), as well as separating Egg Lake (PAD 33) from other wetlands in the Peace sub-delta (PAD 14 and 38).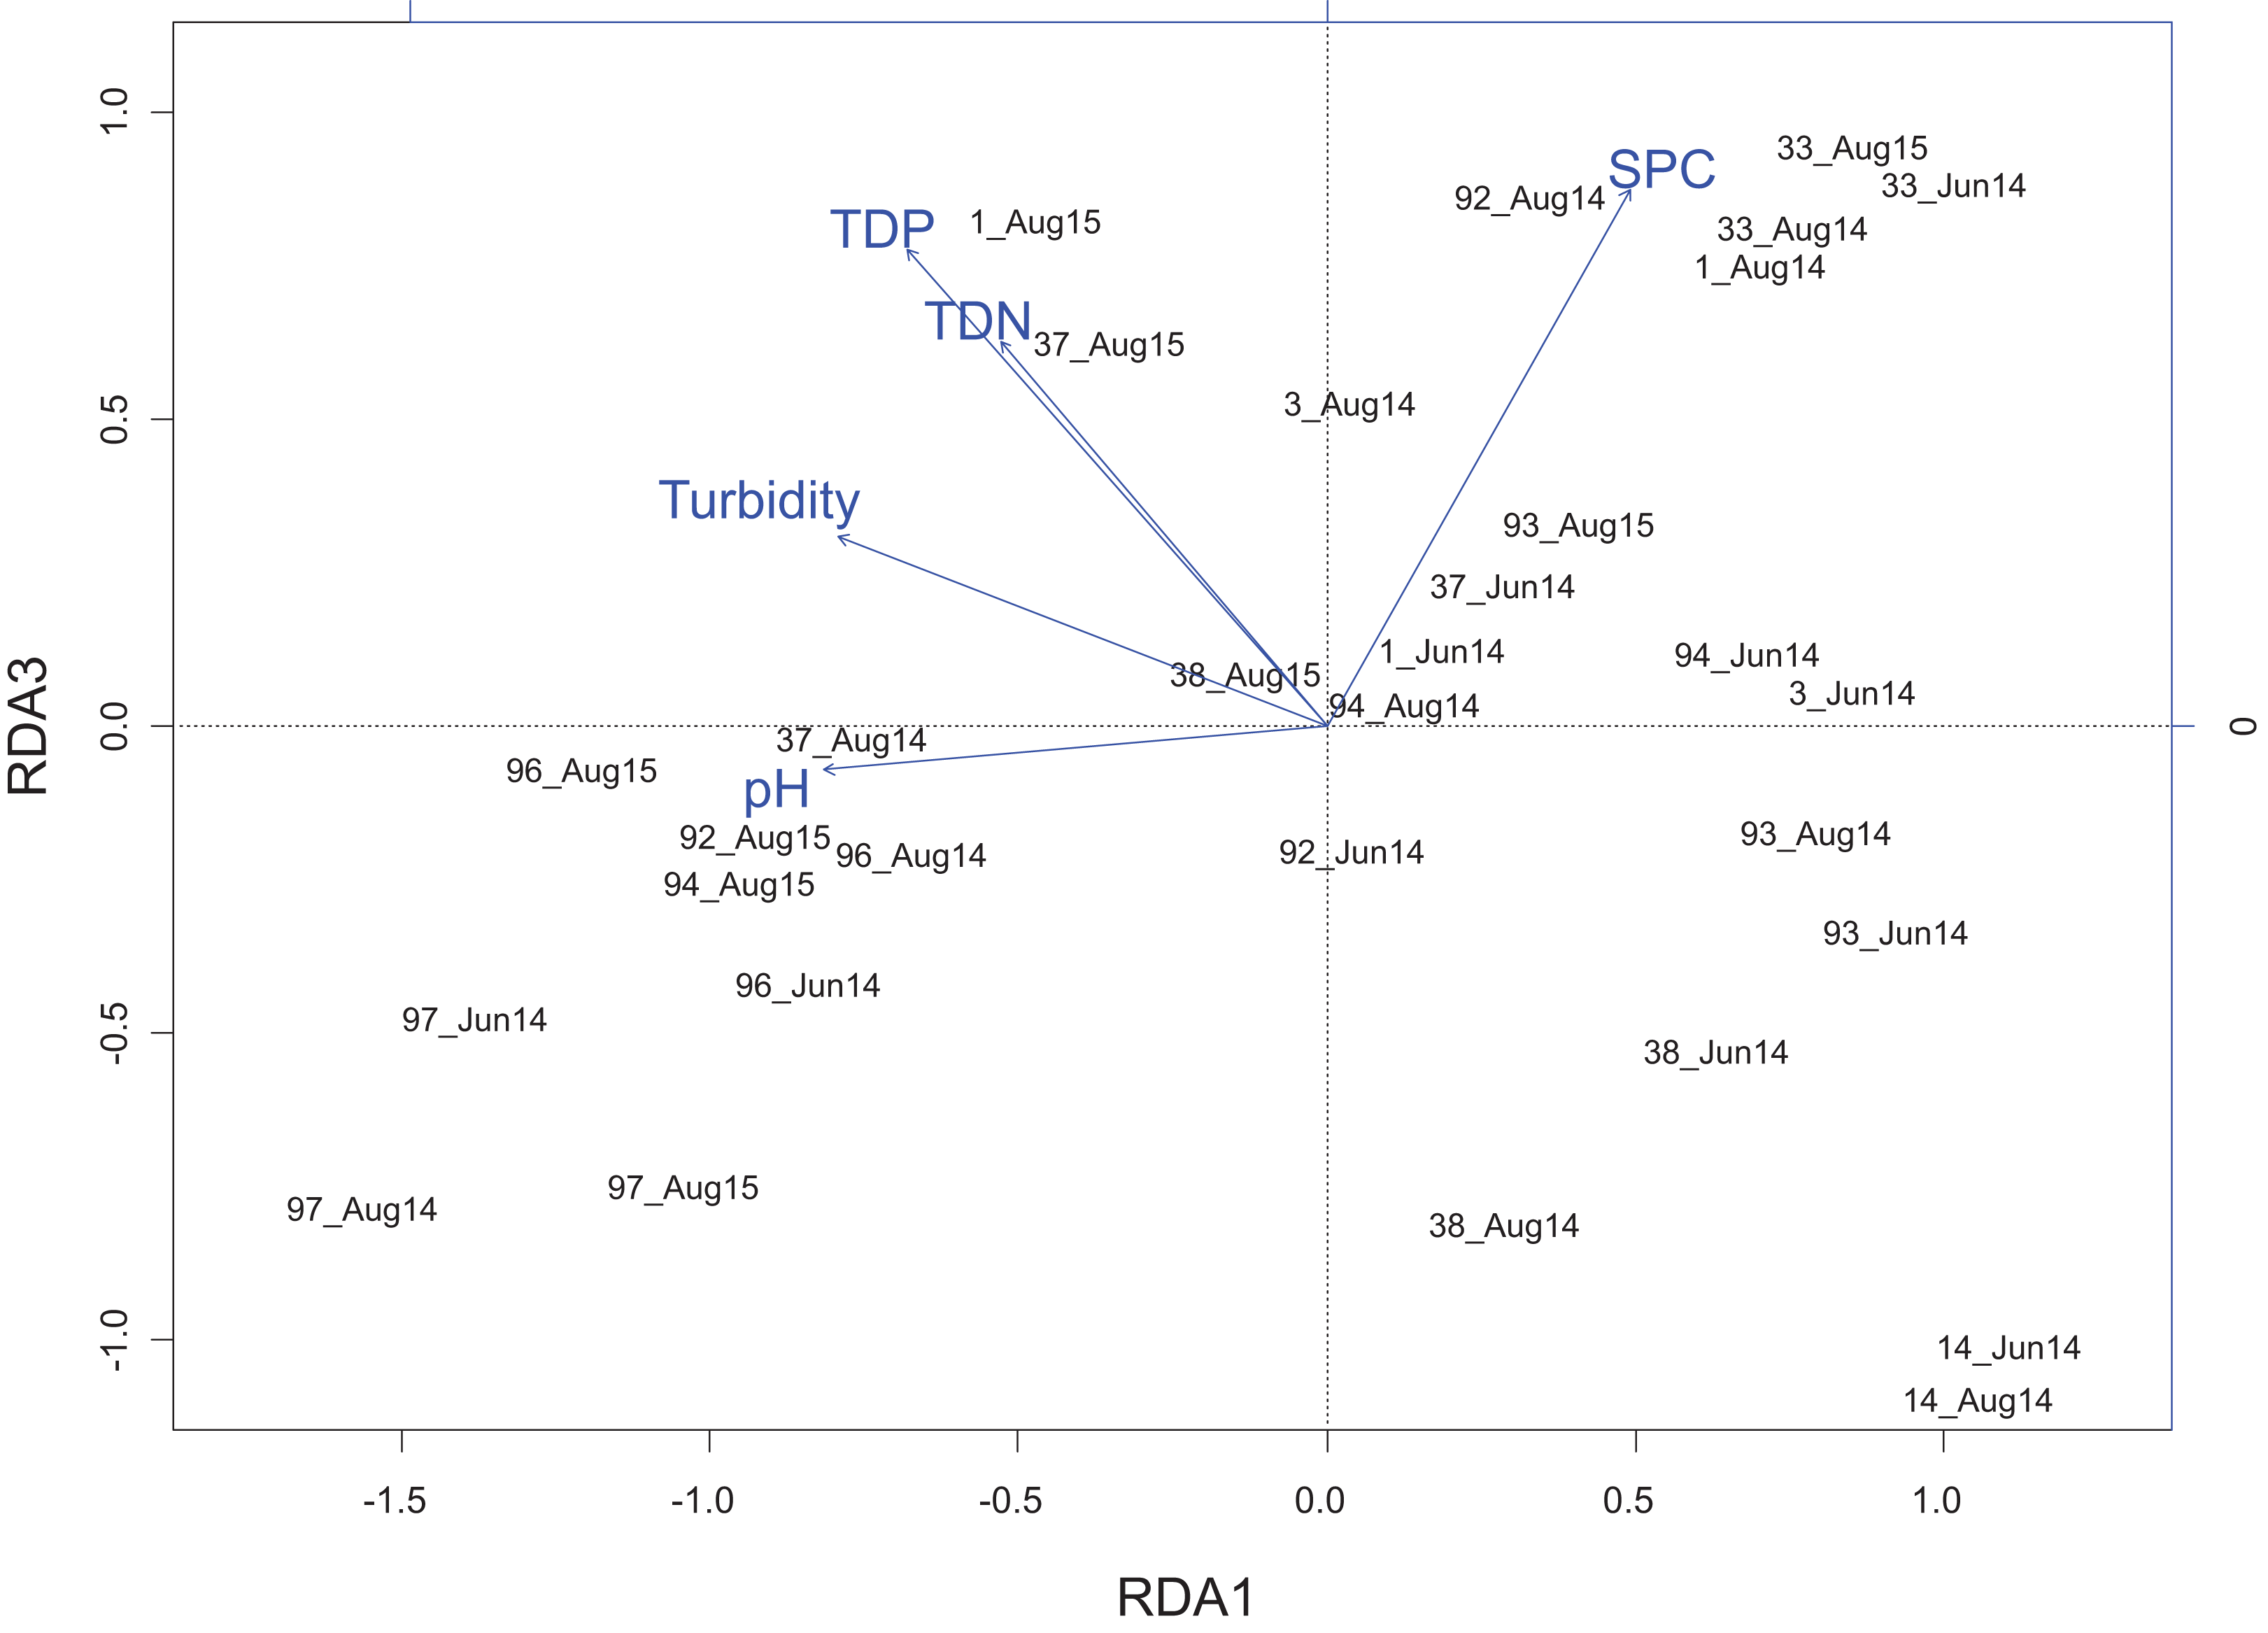
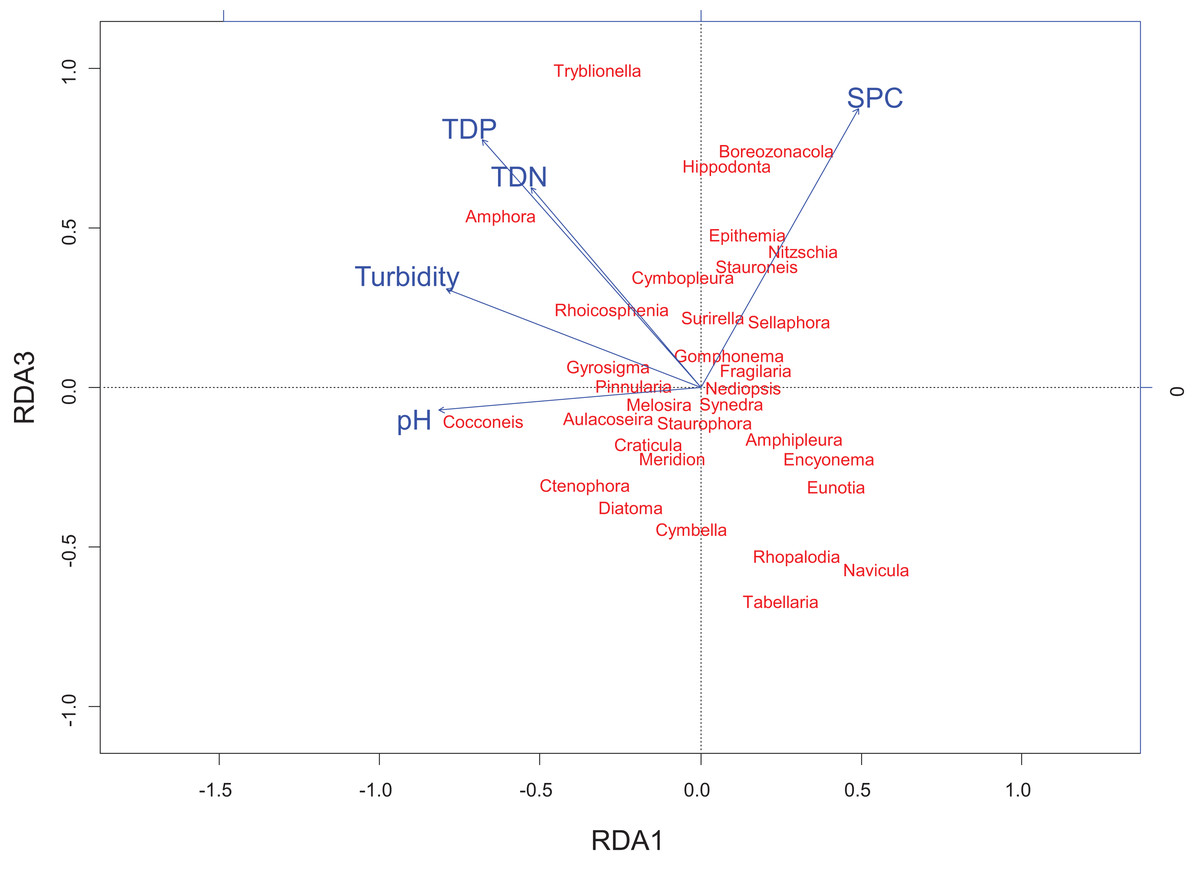
Figure 5: Redundancy analysis biplot projecting RDA axes 1 and 3 showing diatom genera from the Peace–Athabasca Delta and associated physico-chemical parameters.
Biplot summarizes data from three sampling periods: June 2014, August 2014 and August 2015. The included physico-chemical parameters are TDN or total dissolved nitrogen (mg/L), TDP or total dissolved phosphorus (mg/L), pH, turbidity (NTU), and SPC or specific conductance (μS/cm). The overall variance explained by the RDA was 21.6% with 11.9% explained by axis RDA axis 1 and 2.3% explained by RDA axis 3. RDA axis 1 shows a strong correlation between high pH and Cocconeis Ehrenberg 1837. RDA axis 3 shows a gradient of ion content/nutrient concentration where Hippodonta Lange-Bertalot, Witkowski and Metzeltin 1996 and Boreozonacola Lange-Bertalot, Kulikovskiy et Witkowski 2010 are associated with high specific conductance while Navicula Bory de Saint-Vincent 1822, Rhopalodia O. Muller 1895 and Tabellaria Ehrenberg ex Kützing 1844 are associated with low nutrient concentration.
RDA axis 3 explained only 2.3% of the variance, but was strongly positively correlated to a number of water quality parameters of interest including total dissolved nitrogen (r = 0.64), total dissolved phosphorus (r = 0.79), and SPC (r = 0.89). Along this gradient driven largely by nutrients/ions, sites in the Embarras sub-delta (PAD 96 and 97) are separated from sites in the Cree-Mamawi Creek sub-delta (PAD 1 and 3) despite both being part of the relict Athabasca sub-delta (Fig. 4). Also along this gradient, PAD 33 (Peace sub-delta) is strongly associated with high SPC in all sampling periods while PAD 14 and 38 (Peace sub-delta) are strongly associated with low nutrient concentration (both N and P) in 2014 (Fig. 4). Along the gradient of SPC, Boreozonacola Lange-Bertalot, Kulikovskiy and Witkowski 2010 and Hippodonta Lange-Bertalot, Witkowski and Metzeltin 1996 are associated with high ion concentration. Epithemia Kützing 1844 is associated with higher than average SPC and is weakly correlated with nutrients. Along the nutrient gradient Navicula Bory de Saint-Vincent 1822, Rhopalodia O. Muller 1895, and Tabellaria Ehrenberg ex Kützing 1844 are associated with low nutrients (Fig. 5).
Discussion
Habitats in the PAD are sensitive to water level fluctuations in the lower Athabasca River (Wolfe et al., 2008; Timoney, 2009; Monk, Peters & Baird, 2012) and flooding is particularly important in a wetland complex like the PAD as this generally contributes to the replenishment of nutrients and sediments from the river channel to the associated perched basin wetlands. In this study, drying after flooding resulted in relatively little of the variance in the periphyton community corresponding with water quality differences between sampling sites (i.e., <21.6%). The frequency of flooding in the delta has declined over the last several decades (Wolfe et al., 2008; Wiklund et al., 2010) leading to drought concerns. Unfortunately, the effects of changing drought conditions on diatom communities is but poorly understood in this remote region. Other studies of diatom assemblages using 200-year-long sediment cores have reported similar variance associated with water quality (e.g., 25%, see Faulkenham et al., 2003). Likewise, a survey of diatoms north of the PAD in WBNP found that underlying geology is the main driver of diatom distribution, but also had relatively high unexplained variance (73.7–77.6%; Moser, Smol & MacDonald, 2004). Such results are not uncommon in noisy taxonomic datasets that contain many zeros (Stevenson et al., 1991). Thus, the findings presented here are of interest as they reflect a similar contribution of different water quality conditions in a contemporary diatom assemblage under a near perpetual state of flux that may well be the “normal” condition in these remote, dynamic and difficult to sample watersheds.
The PCA revealed two gradients of interest. The first gradient, along PC1, explained the highest variance among sites and represented a change in diatom community composition across the three sampling periods. Epithemia, for instance, increased substantially throughout this time period with this genus dominating at several sites sampled in August 2015 (Table 4). As taxa with the ability to fix atmospheric nitrogen via cyanobacterial endosymbionts, seasonal gradients associated with Epithemia were initially hypothesized to be driven by changing nutrient concentrations in the delta. Analysis of water chemistry suggests nitrogen limitation due to an increase in phosphorus in these sensitive wetlands raising the question as to whether the PAD is becoming eutrophic. In particular, in the Cree-Mamawi Creek sub-Delta (PAD 1, 3, and 4) concentrations of total dissolved phosphorus increased over the study period (Table 5) and during this period Epithemia was common (17% average relative abundance) at the affected sites. Increasing phosphorus can lead to eutrophication (originally defined by the absolute value of total phosphorus concentration; e.g., Naumann, 1929) and nitrogen limitation (defined by the relative concentrations of total nitrogen and total phosphorus; Sakamoto, 1966). Interestingly, the RDA showed that Epithemia was only weakly correlated with nutrients (either N or P) for the periods sampled. Given the interannual and seasonal variability in this deltaic system it seems likely, however, that periods of nutrient limitation may be a regular recurrence and thus, why Epithemia remains common in the periphyton community.
| Site code | 2012 | 2013 | 2014 | 2015 | ||||
|---|---|---|---|---|---|---|---|---|
| June | August | June | August | June | August | August | ||
| Cree-Mamawi Creek | PAD 1 | 3.22 | N/A | 9.55 | 3.08 | 7.82 | 7.87 | 19.4 |
| PAD 3 | 4.65 | 6.66 | 7.65 | 3.69 | 11.66 | 5.49 | 11.42 | |
| PAD 4 | 13.85 | 14.6 | 7.89 | 14.08 | 8.15 | 10.18 | 12.62 | |
| Peace | PAD 14 | 13.21 | 36.55 | 92.67 | – | 71.24 | 37.18 | 46.3 |
| PAD 33 | 33.71 | 22.45 | 32.85 | 1.04 | 16.57 | 16.32 | 45.06 | |
| PAD 37 | 53.27 | 33.85 | 31.45 | 26.31 | 25.15 | 45.66 | 16.71 | |
| PAD 38 | 22.77 | 34 | 10.32 | 23.63 | 12.88 | 21.35 | 21.51 | |
| Birch | PAD 92 | – | – | – | – | 58.83 | 16.53 | 28.12 |
| PAD 93 | – | – | – | – | 12.89 | 6.33 | 11.1 | |
| PAD 94 | – | – | – | 14.46 | 15.67 | 16.41 | 3.4 | |
| Embarras | PAD 96 | – | – | – | 5.06 | 16.55 | 19.67 | 11.61 |
| PAD 97 | – | – | – | 8.85 | 20.77 | 18.61 | 13.64 | |
Notes:
Based on Sakamoto’s (1966) classification for nutrient limitation, sites shown in bold are indicative of possible nitrogen limitation, where N:P < 10:1 = N limitation and 10:1 < N:P <17:1 = possible N limitation.
In addition to the ability to fix nitrogen, E. turgida (Ehrenberg) Kützing 1844 also shows a preference for non-flooded conditions in the PAD and has previously shown some utility in tracking long-term changes in hydrolimnological condition (Wiklund et al., 2010). Thus, high and widespread abundance of E. turgida during the August 2015 sampling was also likely driven by increased drying in the delta leading to the change across sampling periods. For example, at one site affected by the Spring 2014 flood (PAD 4) Epithemia had low abundance during the flood event (1% relative abundance; June 2014), but was the most dominant species during dry conditions (41% relative abundance; August 2015; Table 4). This pattern of drying may also explain the second gradient along PC3 that showed broad separation of sites in the Birch vs the Peace sub-deltas. This geographic separation was not explained by findings from the RDA, but may be related to differences in flow conditions that affect water availability in the delta. In contrast to the Birch River, the Peace River is subject to flow regulation in its headwaters for the purposes of hydroelectric power generation at the W.A.C. Bennett dam (Peters & Prowse, 2006). Differences between an unaltered flow regime (Birch) vs flow regulation (Peace) are a potential cause for the observed difference in these two systems.
The highest variance among sites was correlated with a pH gradient. This finding is similar to previous studies that found pH to be a strong explanatory variable of regional community variation in lacustrine diatoms (Allen et al., 1999; Pla, Curtis & Simpson, 2006; Bennett et al., 2010). In particular, diatom communities of sites in the Embarras sub-delta (PAD 96 and 97) were driven by a strong association with high pH and have a biofilm community dominated by the alkaliphilous diatom C. placentula. This affinity for alkaline conditions could make wetlands in the Embarras sub-delta particularly vulnerable to changes in community composition due to acidification associated with upstream resource development in the area (i.e., oil sands mining in the Athabasca River watershed near Fort McMurray). Reductions in pH are very likely to result in a shift in the diatom community if the chemical conditions move outside the pH optimum for C. placentula (>7; Hustedt, 1939; Denys, 1992). Given that Cocconeis is the dominant diatom in Embarras wetlands, their replacement by successive taxa could have cascading effects on higher trophic levels. Cocconeis is resistant to grazing (Pan & Lowe, 1994) due to prostrate attachment to the substrate so reductions in abundance of this genus may promote increased abundance of grazing invertebrates. For instance, snails are currently only ∼1% of the proportional abundance of the macroinvertebrate community at Embarras sites. However, if Cocconeis were to be succeeded by more palatable taxa, such as any of several species in the genus Gomphonema Ehrenberg 1832—a genus that attaches vertically to substrate via a mucilaginous stalk (Spaulding et al., 2010)—this could also lead to a reduction in overall productivity due to shifts resulting from increases in grazing pressure. As Gomphonema is also common at sites in the Embarras (Table 4) increased monitoring for shifts in assemblages between these taxa may be warranted.
Generally, wetlands in Canada’s boreal zone have low buffering capacity and are particularly vulnerable to acidification (Hazewinkel et al., 2008; Aherne & Shaw, 2010). Unlike other areas in the Boreal ecoregion, much of the underlying geology in the PAD is thermokarst, leading to naturally high alkalinity during the open water season. Despite this, these shallow, soft-bottom wetlands are 90% overlain by poorly buffered soils containing extensive deposits of decaying organic matter and thus organic carbon is typically high (e.g., 25.05 ± 1.00 mg DOC/L and 28.74 ± 1.61 mg TOC/L, 2012–2016) (Timoney, 2013). Elevated dissolved and particulate organic carbon is also commonly found deposited in the region (e.g., 124.71 mg DOC/m2 and 192.91 ± 17.50 mg POC/m2, 2014 only). Unfortunately, source attribution for atmospheric carbon is still a nascent science (e.g., see Legrand et al., 2013), but increased contributions of carbon in the PAD may have originated in the oil sands proper as the sites examined are within 60 ± 20 km (range: 16–128 km) of the most developed area (distance to AR6). The prevailing wind pattern (fall, 1971–2000) in the region also favors the potential for an atmospheric deposition pathway in addition to surface water contributions from the upstream oil sands development (e.g., Agroclimatic Atlas of Alberta). Regional estimates of the ANC (Acid Neutralizing Capacity) of precipitation in the PAD, as measured at the Fort Chipewyan station, are also typically less than zero (e.g., 95% CI [−0.43 to −0.56], 2008 only) (https://www.ec.gc.ca/natchem/). Other studies examining patterns under similar conditions found that organic carbon is the main contributor to reduced acid neutralizing capacity in the oil sands region (Alexander, Chambers & Jeffries, 2017) as well as elsewhere (Wellington & Driscoll, 2004). Given the high and potentially increasing DOC contributions, the naturally high alkalinity of these sites may not afford much buffering capacity to these deltaic wetlands. Rain events following drought conditions have previously been associated with severe episodic acidification in temperate climate zones (e.g., Wellington & Driscoll, 2004). Effects of similar climate conditions in remote wetlands north of ∼46° latitude have, as yet, been poorly studied in Canada. This study extends the bulk of the previous work undertaken >1,000 km north (and >3,000 km west) into the taiga, the moist, subarctic edge of coniferous forest in northwestern Canada. To date, widespread acidification of lakes in northern Alberta has not been reported (Hazewinkel et al., 2008; Curtis et al., 2010), but one lake studied by Curtis et al. (2010) shows evidence of recent (starting at ∼1970) acidification and this lake is most similar to wetlands in the PAD (small, shallow, and peaty catchment). Collectively, these findings are suggestive of a substantial risk of impact associated with the combined effects of acidification, drying and the potential for atmospheric deposition of contaminants from oil sands development.
Conclusions
Physical and chemical parameters can affect the composition and distribution of the diatom community in wetlands and shallow lakes throughout northern Alberta’s Boreal ecoregion. Among these are several, potentially interacting, gradients (e.g., drought, acidification, nutrient enrichment, and contaminants) that would benefit from further study. This study provides preliminary evidence of eutrophication in the southern end of the PAD as well as data on the potential for diatom community shifts associated with acidification. In addition, evidence of reduced flood frequency remains a substantial concern for the natural dynamics of this complex, deltaic habitat. With the ongoing risks associated with industrial development and ecosystem change due to warming climatic conditions, understanding these relationships will be critical for mitigating negative impacts on the fauna and flora of the PAD arising from degradation of ecosystem services supporting wildlife habitat in this remote region.