
Top-down and bottom-up controls on southern New England salt marsh crab populations
- Published
- Accepted
- Received
- Academic Editor
- Michael LaMontagne
- Subject Areas
- Ecology, Marine Biology, Climate Change Biology, Environmental Impacts
- Keywords
- New England, Community assessment, Sea-level rise, Predation, Crabs, Salt marsh
- Copyright
- © 2018 Raposa et al.
- Licence
- This is an open access article distributed under the terms of the Creative Commons Attribution License, which permits unrestricted use, distribution, reproduction and adaptation in any medium and for any purpose provided that it is properly attributed. For attribution, the original author(s), title, publication source (PeerJ) and either DOI or URL of the article must be cited.
- Cite this article
- 2018. Top-down and bottom-up controls on southern New England salt marsh crab populations. PeerJ 6:e4876 https://doi.org/10.7717/peerj.4876
Abstract
Southern New England salt marsh vegetation and habitats are changing rapidly in response to sea-level rise. At the same time, fiddler crab (Uca spp.) distributions have expanded and purple marsh crab (Sesarma reticulatum) grazing on creekbank vegetation has increased. Sea-level rise and reduced predation pressure drive these changing crab populations but most studies focus on one species; there is a need for community-level assessments of impacts from multiple crab species. There is also a need to identify additional factors that can affect crab populations. We sampled crabs and environmental parameters in four Rhode Island salt marshes in 2014 and compiled existing data to quantify trends in crab abundance and multiple factors that potentially affect crabs. Crab communities were dominated by fiddler and green crabs (Carcinus maenas); S. reticulatum was much less abundant. Burrow sizes suggest that Uca is responsible for most burrows. On the marsh platform, burrows and Carcinus abundance were negatively correlated with elevation, soil moisture, and soil percent organic matter and positively correlated with soil bulk density. Uca abundance was negatively correlated with Spartina patens cover and height and positively correlated with Spartina alterniflora cover and soil shear strength. Creekbank burrow density increased dramatically between 1998 and 2016. During the same time, fishing effort and the abundance of birds that prey on crabs decreased, and water levels increased. Unlike in other southern New England marshes where recreational overfishing is hypothesized to drive increasing marsh crab abundance, we propose that changes in crab abundance were likely unrelated to recreational finfish over-harvest; instead, they better track sea-level rise and changing abundances of alternate predators, such as birds. We predict that marsh crab abundance will continue to expand with ongoing sea-level rise, at least until inundation thresholds for crab survival are exceeded.
Introduction
Southern New England salt marshes are undergoing rapid and dramatic change. Some conspicuous examples include the replacement of high marsh with low marsh vegetation, increasing areas of high marsh vegetation dieback, shallow pond formation, edge erosion, channel expansion, and soil weakening (Cole Ekberg, Ferguson & Raposa, 2015; Raposa et al., 2017a; Watson et al., 2017a). Sea-level rise is driving many of these changes, but other factors such as elevated nutrient levels, latent effects from hydrologic alterations, and plant fungal infections have also been identified as potential stressors (Deegan et al., 2012; Coverdale et al., 2013a; Elmer et al., 2013). Another emerging co-stressor, however, is impacts from crab populations (e.g., Holdredge, Bertness & Altieri, 2009).
Southern New England marshes have typically supported crab communities comprised of few species at relatively low densities. One early survey in a Rhode Island (RI) salt marsh documented a crab community dominated by the mud fiddler crab, Uca pugnax, followed by the purple marsh crab, Sesarma reticulatum (hereafter Uca and Sesarma, respectively), which was common but not abundant, and two additional Uca species that were very rare (Bertness & Miller, 1984). In later studies, the European green crab, Carcinus meanas (hereafter Carcinus) emerged as a common component of crab communities in both subtidal and marsh surface habitats (Roman et al., 2002; Meng, Cicchetti & Chintala, 2004). Early research also demonstrated that Uca burrowing enhances Spartina alterniflora production by aerating soils and promoting drainage (Bertness, 1985) and, to our knowledge, reports of negative impacts to marshes from crabs were absent in southern New England up through the early 2000s. However, observations of expanding Uca and Sesarma populations have proliferated across the region within the last decade, and studies are now confirming negative impacts to marshes across the region associated with excessive crab burrowing and grazing (Holdredge, Bertness & Altieri, 2009; Coverdale, Bertness & Altieri, 2013b; Schultz, Anisfeld & Hill, 2016).
Many reports linking marsh degradation to crabs have emerged from Cape Cod MA, where Holdredge, Bertness & Altieri (2009) first demonstrated a link between the loss of low marsh S. alterniflora and excessive Sesarma herbivory, which was in turn linked to a reduction in predation pressure. A series of subsequent studies further demonstrated that Sesarma overgrazing (1) ultimately stems from recreational overfishing, (2) negatively impacts multiple ecosystem services, (3) creates denuded areas on the marsh surface favored by Uca and that facilitate Uca expansion, and (4) can be mitigated by the invasive crab Carcinus (Altieri et al., 2012; Bertness & Coverdale, 2013; Brisson, Coverdale & Bertness, 2014; Coverdale et al., 2014; Smith, 2015). In Connecticut, Luk & Zajac (2013) documented an intra-marsh range expansion of U. pugnax and attributed it to sea-level rise. These findings expand the geographic extent of impacts to marshes from crabs. For example, the headward erosion of creek networks in Georgia and South Carolina has been linked to excessive crab burrowing in association with sea-level rise (Hughes et al., 2009; Wilson, Hughes & FitzGerald, 2012; Vu, Wieski & Pennings, 2017), and in southern Maine the physical removal of low marsh S. alterniflora is occurring even in the absence of Sesarma, and is instead being linked to recent increases in Carcinus, which are burrowing into vertical creekbanks (Belknap & Wilson, 2014).
In RI, new research is now documenting vegetation shifts, seaward edge erosion, drainage channel expansion, and the net loss of marsh area (Watson et al., 2017a), but few studies have linked these changes to crabs despite proliferating anecdotal reports of localized high Uca densities in marshes. As late as 2007, Holdredge, Bertness & Altieri (2009) reported that creekbank vegetation loss and Sesarma densities were very low in RI compared to Cape Cod marshes. By 2013, however, Bertness et al. (2014) documented an increase in creekbank vegetation loss over time in some RI marshes and attributed this to increased Sesarma gazing due to overfishing as in Cape Cod. In fact, Coverdale, Bertness & Altieri (2013b) report that this is a region-wide phenomenon that is occurring at least from Long Island Sound to Massachusetts. The evidence linking creekbank vegetation loss to Sesarma grazing in RI is compelling, but the sea-level rise-induced Uca expansion in CT, reports of creekbank vegetation loss in Maine linked to Carcinus, and reports of high Uca densities across RI call for investigations into the potential role of other crab species in addition to Sesarma. Moreover, it is difficult to definitively link marsh changes over time in RI to increasing crab populations, or to specific crab species, because time-series data on crab abundance is generally lacking and because no recent studies have considered all marsh crab species simultaneously.
The above-mentioned studies demonstrate that crab populations are impacting salt marshes across New England and identify sea-level rise and overfishing of crab predators as drivers of expanding crab populations in some locations. However, more research is needed to quantify the relative degree of impacts to marshes from multiple crab species and to identify environmental parameters that affect the distribution and abundance of each species. We therefore conducted a field study in 2014 to examine relationships between crab populations and vegetation, elevation, and soil characteristics among marshes and habitat types. We also included a second study component to quantify recent temporal trends in crab abundance and a suite of potential drivers of crabs. The specific goals of this study were to (1) describe current marsh crab community and population demographics, (2) quantify patterns in crab species among marshes and habitats, (3) identify significant correlates of crab abundances in multiple marsh habitats, and (4) quantify temporal trends in crab abundance and potential drivers of change. Our study provides insight into the current composition, distribution, and habitat use of marsh crabs in RI and serves as a baseline to which future studies can be compared to assess change. It provides additional insight into the potential causes and effects of changes in crab abundance over time in southern New England salt marshes. Most studies focus either on Uca or Sesarma individually; here we focus on all dominant crab species simultaneously to provide a holistic assessment of crab dynamics in RI marshes.
Materials & Methods
Study sites
This study was conducted at four salt marshes selected to represent a broad range of conditions along known elevation and habitat composition gradients within Narragansett Bay, RI (Cole Ekberg, Ferguson & Raposa, 2015). The sites included Bissel Cove Marsh (BIS; North Kingstown), Coggeshall Marsh (COG; Prudence Island and in the Narragansett Bay National Estuarine Research Reserve [NBNERR]), Nag Marsh (NAG; Prudence Island, NBNERR), and Passeonquis Marsh (PAS; Warwick) (Table 1; Fig. 1). Vegetated habitats were typical of southern New England salt marshes (e.g., Warren & Niering, 1993), but the relative amount of dominant species in each marsh followed a predictable pattern in relation to overall mean site elevation: as site elevation increased, the percent composition of flood-tolerant S. alterniflora decreased, and the composition of less flood-tolerant high marsh species (e.g., S. patens, Distichlis spicata) increased. All marshes, however, exhibited impacts that have been linked to sea-level rise and/or crabs, including the presence of bare creekbanks and the net loss of marsh area over time (Bertness et al., 2014; Watson et al., 2017a).
| BIS | COG | NAG | PAS | |
|---|---|---|---|---|
| Type | Wide fringe | Meadow/fringe | Salt-meadow | Wide fringe |
| Latitude | 41°16′N | 41°39′N | 41°37′N | 41°46′N |
| Longitude | 71°26′W | 71°20′W | 71°19′W | 71°24′W |
| Area (ha) | 3.3 | 25.5 | 15.3 | 3.6 |
| Tide range (m) | 0.87 | 1.16 | 0.53 | 0.8 |
| Median elevation (m NAVD88) | 0.36 | 0.62 | 0.64 | 0.75 |
Notes:
- BIS
-
Bissel Cove Marsh
- COG
-
Coggeshall Marsh
- NAG
-
Nag Marsh
- PAS
-
Passeonquis Marsh
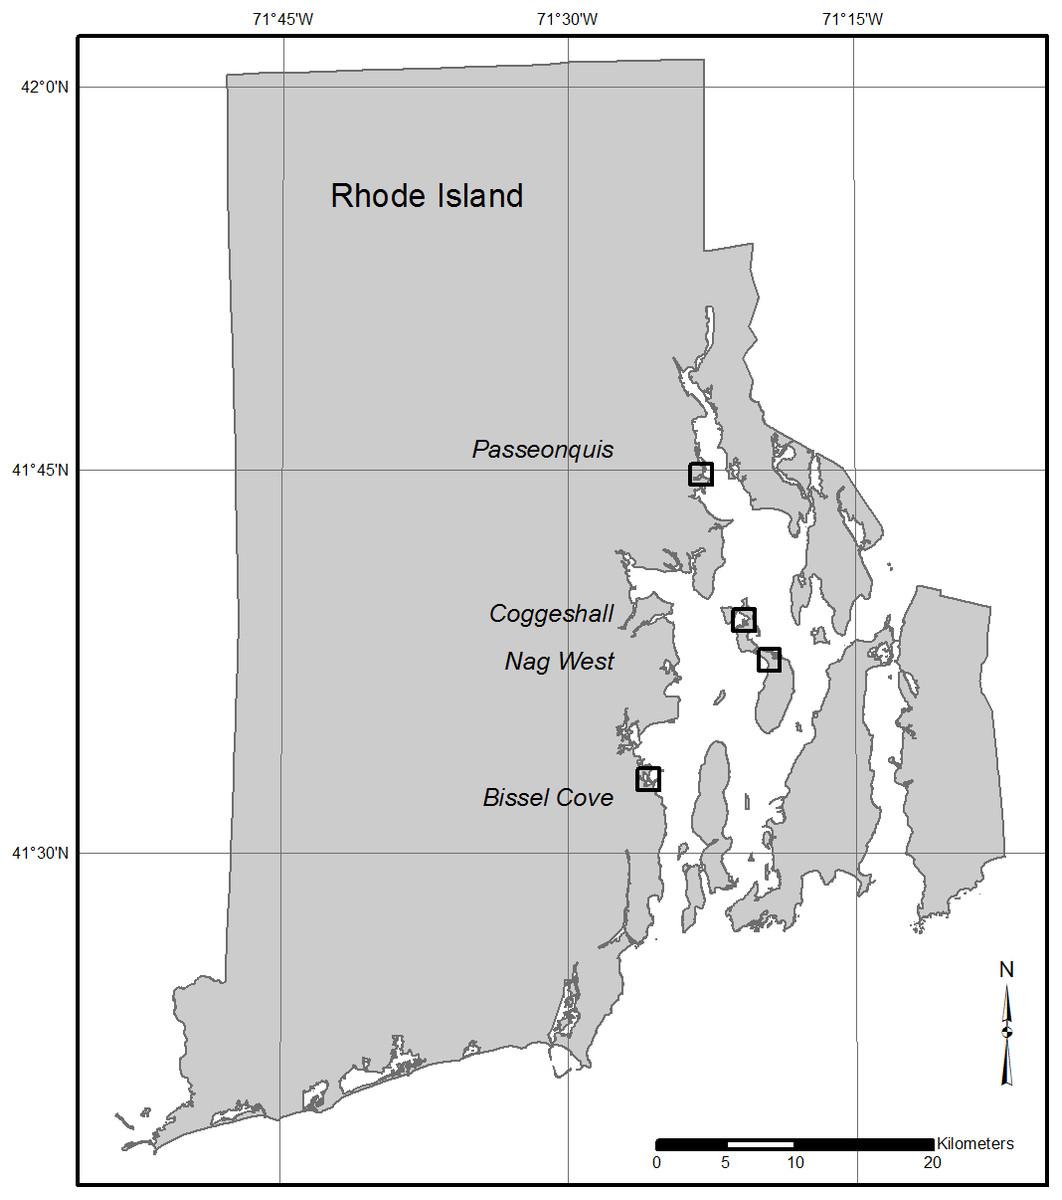
Figure 1: Locations of the four study marshes in Narragansett Bay, RI.
The marshes include Bissel Cove Marsh (BIS), Coggeshall Marsh (COG), Nag Marsh (NAG), and Passeonquis Marsh (PAS).
Field sampling
We conducted stratified random sampling, establishing five random sampling stations in each of four habitat types, for a total of 20 stations per marsh. Once randomly selected, station locations remained fixed and were permanently marked with a PVC stake. Habitats included (1) bare/unvegetated creekbanks (BCB), (2) vegetated creekbanks (VCB), (3) the marsh platform (MP), and (4) the Iva frutescens marsh/upland transition zone (IVA). All bare and vegetated creekbank stations were located within ∼1 m of a creek edge, and all vegetated creekbank stations were in tall-form S. alterniflora. The marsh platform included the entire high marsh plain between the low marsh and I. frutescens zones (i.e., including short S. alterniflora, S. patens/D. spicata salt meadow, Juncus gerardii/D. spicata high marsh, and dieback pannes). No stations were located in open water features such as creeks, pools, or ditches.
Marsh crabs were sampled at all stations three times in summer 2014 (approximately monthly, June through August) using two different methods that are commonly used to sample marsh crabs or provide surrogate estimates of crab abundance. We used a 0.5 m ×0.5 m quadrat sampler to conduct crab burrow counts. Around low tide, the quadrat was placed in the same location relative to each plot’s locator stake. All crab burrows were then counted and their diameters measured. We counted all burrows that were >3 mm in diameter in order to include all crab species. We also sampled crabs with pitfall traps. The traps were 7.5 cm in diameter by 20 cm deep with a capped bottom and perforated sides for drainage. Each trap was pushed into the marsh peat until the top of the trap was flush with the marsh surface. To deploy, the cap of each trap was removed around low tide and the trap was allowed to fish for 24 h. Upon retrieval, all captured crabs were removed from each trap, identified to species, measured (carapace width), and released. From burrow counts we calculated crab burrow density (number m−2); from pitfall traps we calculated catch-per-unit-effort (CPUE; an indicator of abundance, with effort being the number of traps) for each species.
Ancillary environmental parameters were also sampled once at each station in summer 2014. We collected data on elevation, vegetation communities, and edaphic conditions (soil bulk density, percent soil moisture, percent soil organic matter, and soil shear strength). Plot elevation was measured relative to tidal and orthometric datums. At COG and NAG, plots were surveyed relative to National Geodetic Survey benchmarks whose elevations (relative to NAVD88) were established using GPS static post-processed kinematic surveys (PPK). At BIS and PAS, several temporary benchmarks (PVC pipes topped with survey markers driven to refusal) were established per marsh, and elevations of these benchmarks were measured using PPK GPS surveys. Differential leveling was conducted using a Self-Leveling Exterior Rotary Laser (CST/Berger, Watseka, IL, USA), with an accuracy of ±1.5 mm at 30 m. The elevation of each plot was estimated as the mean of five points: the four corners and center of each quadrat. Plot elevations were also calculated relative to mean high water (MHW) for the 1983–2001 National Tidal Datum Epoch using the VDatum vertical transformation tool. VDatum converts between orthometric, tidal, and ellipsoidal datums, and interpolates tidal datums between tide gauges using hydrodynamic model simulations (ADCIRC) run using nearshore bathymetric data (Yang et al., 2008). While the maximum cumulative uncertainty reported for converting between NAVD88 and MHW for the RI region is 3.0 cm, VDatum documentation cautions that larger errors were typically seen in marshes and in areas where the tides change rapidly, such as in barrier estuaries and upriver sites (NOAA, 2015).
Within the burrow count quadrats, we quantified the percent cover of all plant species (and other relevant cover types such as bare ground) using the point-intercept technique at 50 grid points (Roman, James-Pirri & Heltshe, 2001). When any dominant marsh grass (S. alterniflora, S. patens, D. spicata, J. gerardii) was present in a quadrat, the heights of up to 12 random plants of each species (three from each corner of the quadrat) were also measured. We used a geovane to twice measure marsh soil strength every 10 cm to 1 m depth or to refusal in each quadrat. We collected a surface soil sample (usually 5 cm × 5 cm) between plant shoots to a depth of 4 cm with a sharp knife in each quadrat. The soil sample was collected ±2 h of low tide. Soil moisture (wet wt. [g] − dry wt. [g]), bulk density (dry wt. [g]/volume [mL]), and percent organic matter were determined for each sample. Samples were dried at 50°C until a constant weight was attained (usually 48 h). Dried samples were ashed at 550°C for 6 h to determine percent organic matter (Heiri, Lotter & Lemcke, 2001).
Temporal trends
Existing monitoring and survey data were compiled and augmented with new data collected in this study to quantify temporal trends in crab abundance (i.e., burrow density), creekbank vegetation loss, and a variety of factors that can potentially affect crab abundance. Water level change was the bottom-up factor; top-down factors included recreational fishing pressure and abundances of two levels of higher-order predators (wading birds as direct crab predators; ospreys as apex predators of fish that prey on crabs).
Burrow density (number m−2) in creekbank and marsh platform habitats was compared between 1998 and 2016 using counts from three randomly-placed 0.25 m−2 quadrats in each habitat each year in ten reference salt marshes (Wigand et al., 2010) across Narragansett Bay. Within each quadrat, all burrow holes were counted; we did not use destructive excavations to determine which species occupied each burrow or which burrows were currently active. Trends in the extent of bare creekbanks were calculated from ongoing habitat monitoring along multiple transects each in COG and NAG (Raposa & Weber, 2013). Recreational fishing statistics were obtained for 2004–2014 from the Marine Recreational Information Program (MRIP) online data query tool (http://www.st.nmfs.noaa.gov/st1/recreational/queries/). The species chosen for analysis were striped bass (Morone saxatilis), scup (Stenotomus chrysops), black sea bass (Centropristis striata), and tautog (Tautoga onitis) as all of these species are known crustacean predators (Bigelow & Schroeder, 1953) and are important recreational species in RI (Shepherd & Nieland, 2010; ASMFC, 2015a; ASMFC, 2015b; Northeast Fisheries Science Center , NEFSC). Trends in the amount of fishing effort over time were calculated for all species combined and for the marsh-associated striped bass only. Effort was defined as directed angler trips taken with the species above as the primary or secondary target. Trends in the number of wading bird nests in coastal RI (an indicator of wading bird abundance) were calculated from the RI Department of Environmental Management state-wide monitoring program. Trends were calculated for all wading bird species that forage in RI salt marshes combined (Black-crowned Night Heron (Nycticorax nycticorax), Cattle Egret (Bubulcus ibis), Glossy Ibis (Plegadis falcinellus), Great Egret (Ardea alba), Little Blue Heron (Egretta caerulea), and Snowy Egret (Egretta thula)) and on a subset that commonly prey on crustaceans (Glossy Ibis and Black-crowned Night Heron). Trends in the number of osprey (Pandion haliaetus) nests in coastal RI (an indicator of osprey abundance) were calculated from the Audubon Society of Rhode Island’s ongoing annual monitoring program. Finally, trends in annual mean high water (MHW; referenced to the North American Vertical Datum of 1988) were calculated from monthly MHW data obtained from the Newport RI NOAA tide station (ID# 8452660; https://tidesandcurrents.noaa.gov/).
The duration of each of these temporal datasets varied somewhat due in part to data availability, but we truncated most to span from 1998 (the first burrow density survey) to 2014 (when the bulk of the field data were collected for this study). Exceptions include (1) burrow density, which was re-sampled in 2016, (2) bare creekbank extent, which was extended to 2015 to help reveal trends since this habitat was not detected until 2012 in our sites, and (3) recreational fishing data, which were not readily available before 2004 due to a statistical survey design change.
Data analysis
We used burrow density, and Uca, Carcinus, and Sesarma CPUE as indicators of crab abundance in this study, and derived crab and burrow size distributions to further describe crab demographics. Patterns in crab indicators were examined among marshes, among habitats, and in association with environmental parameters within each habitat. For each indicator, two-way ANOVAs were run to detect differences among the four marshes and four habitats. ANOVA models were run on rank-transformed data because raw and log-transformed data did not meet the assumptions for a strictly parametric test (multiple comparisons require significant subsetting of the data and, for this analysis, results in very small sample sizes per comparison; multiple comparisons were therefore not run). Pearson correlation tests for bivariate pairs with 10 or more available samples were used to evaluate relationships between each crab indicator and environmental parameters within each of the four habitats using data pooled among the four marshes. Both significant and non-significant correlations are reported. Paired t-tests were used to compare burrow density between 1998 and 2016 in creekbank and marsh platform habitats. Temporal trends for all remaining factors were quantified using simple linear regression on annual data over time. All statistical analyses were performed with R version 3.4.0 (Chang, 2009; Wickham, 2016; Hollister & Raposa, 2017; R Core Team, 2017; Revelle, 2017; Robinson, 2017; Rudis, 2017; Wickham, 2017; Wickham & Bryan, 2017; Wickham & Henry, 2017; Wickham et al., 2017a; Wickham, Hester & Francois, 2017b). Code and data for all analyses are available via GitHub (https://github.com/jhollist/crabs) and archived on Zenodo (Hollister & Raposa, 2017).
Results
Crab community and population characteristics
Five crab species were captured in pitfall traps during this study. Uca pugnax was by far the most abundant species (318 captured; 64.5% of all crabs), followed by C. maenas (146; 29.6%), S. reticulatum (27; 5.5%), one sand fiddler crab Uca pugilator (0.2%), and one unidentified mud crab (family Xanthidae; 0.2%). Hereafter, the two fiddler crab species will be pooled and referred to as Uca. Nearly all captured Uca were less than 2-cm wide (carapace width) and averaged 1.45 cm overall; Sesarma were slightly larger and averaged 2.10 cm (Fig. 2). Carcinus exhibited a bimodal size distribution with a sharp peak in juveniles that were less than 1-cm wide (mostly from one pitfall sample) and another peak of adults ranging from 3.5 to 5.0-cm wide. Mean crab burrow densities ranged from 0 to 257 m−2 at individual plots (overall mean = 42 burrows m−2), and burrow diameters ranged from 0.3 to 9.0 cm (mean = 1.3 cm). Most burrows (87%) were less than 2 cm in diameter (Fig. 2), which is typically the upper size threshold for Uca (Bertness, Holdredge & Altieri, 2009); only 7.9% of burrows were ≥ 2.5 cm diameter, the reported minimum threshold for Sesarma (Bertness, Holdredge & Altieri, 2009).
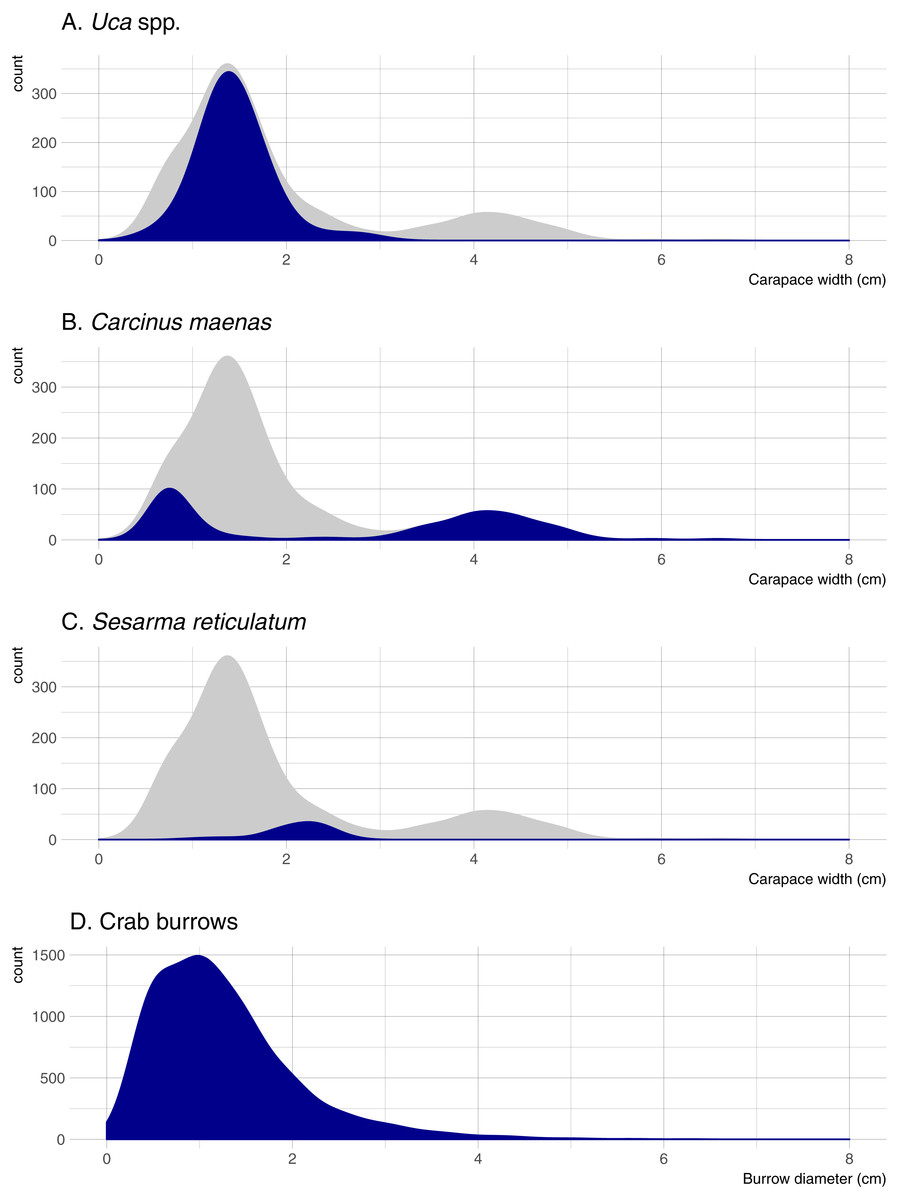
Figure 2: Density distributions of crab burrow diameters and carapace widths for Uca, Carcinus, and Sesarma.
Grey distribution represents all crab species. Note that y axes are at different scales. (A) Uca spp. (B) Carcinus maenas. (C) Sesarma reticulatum. (D) Crab burrows.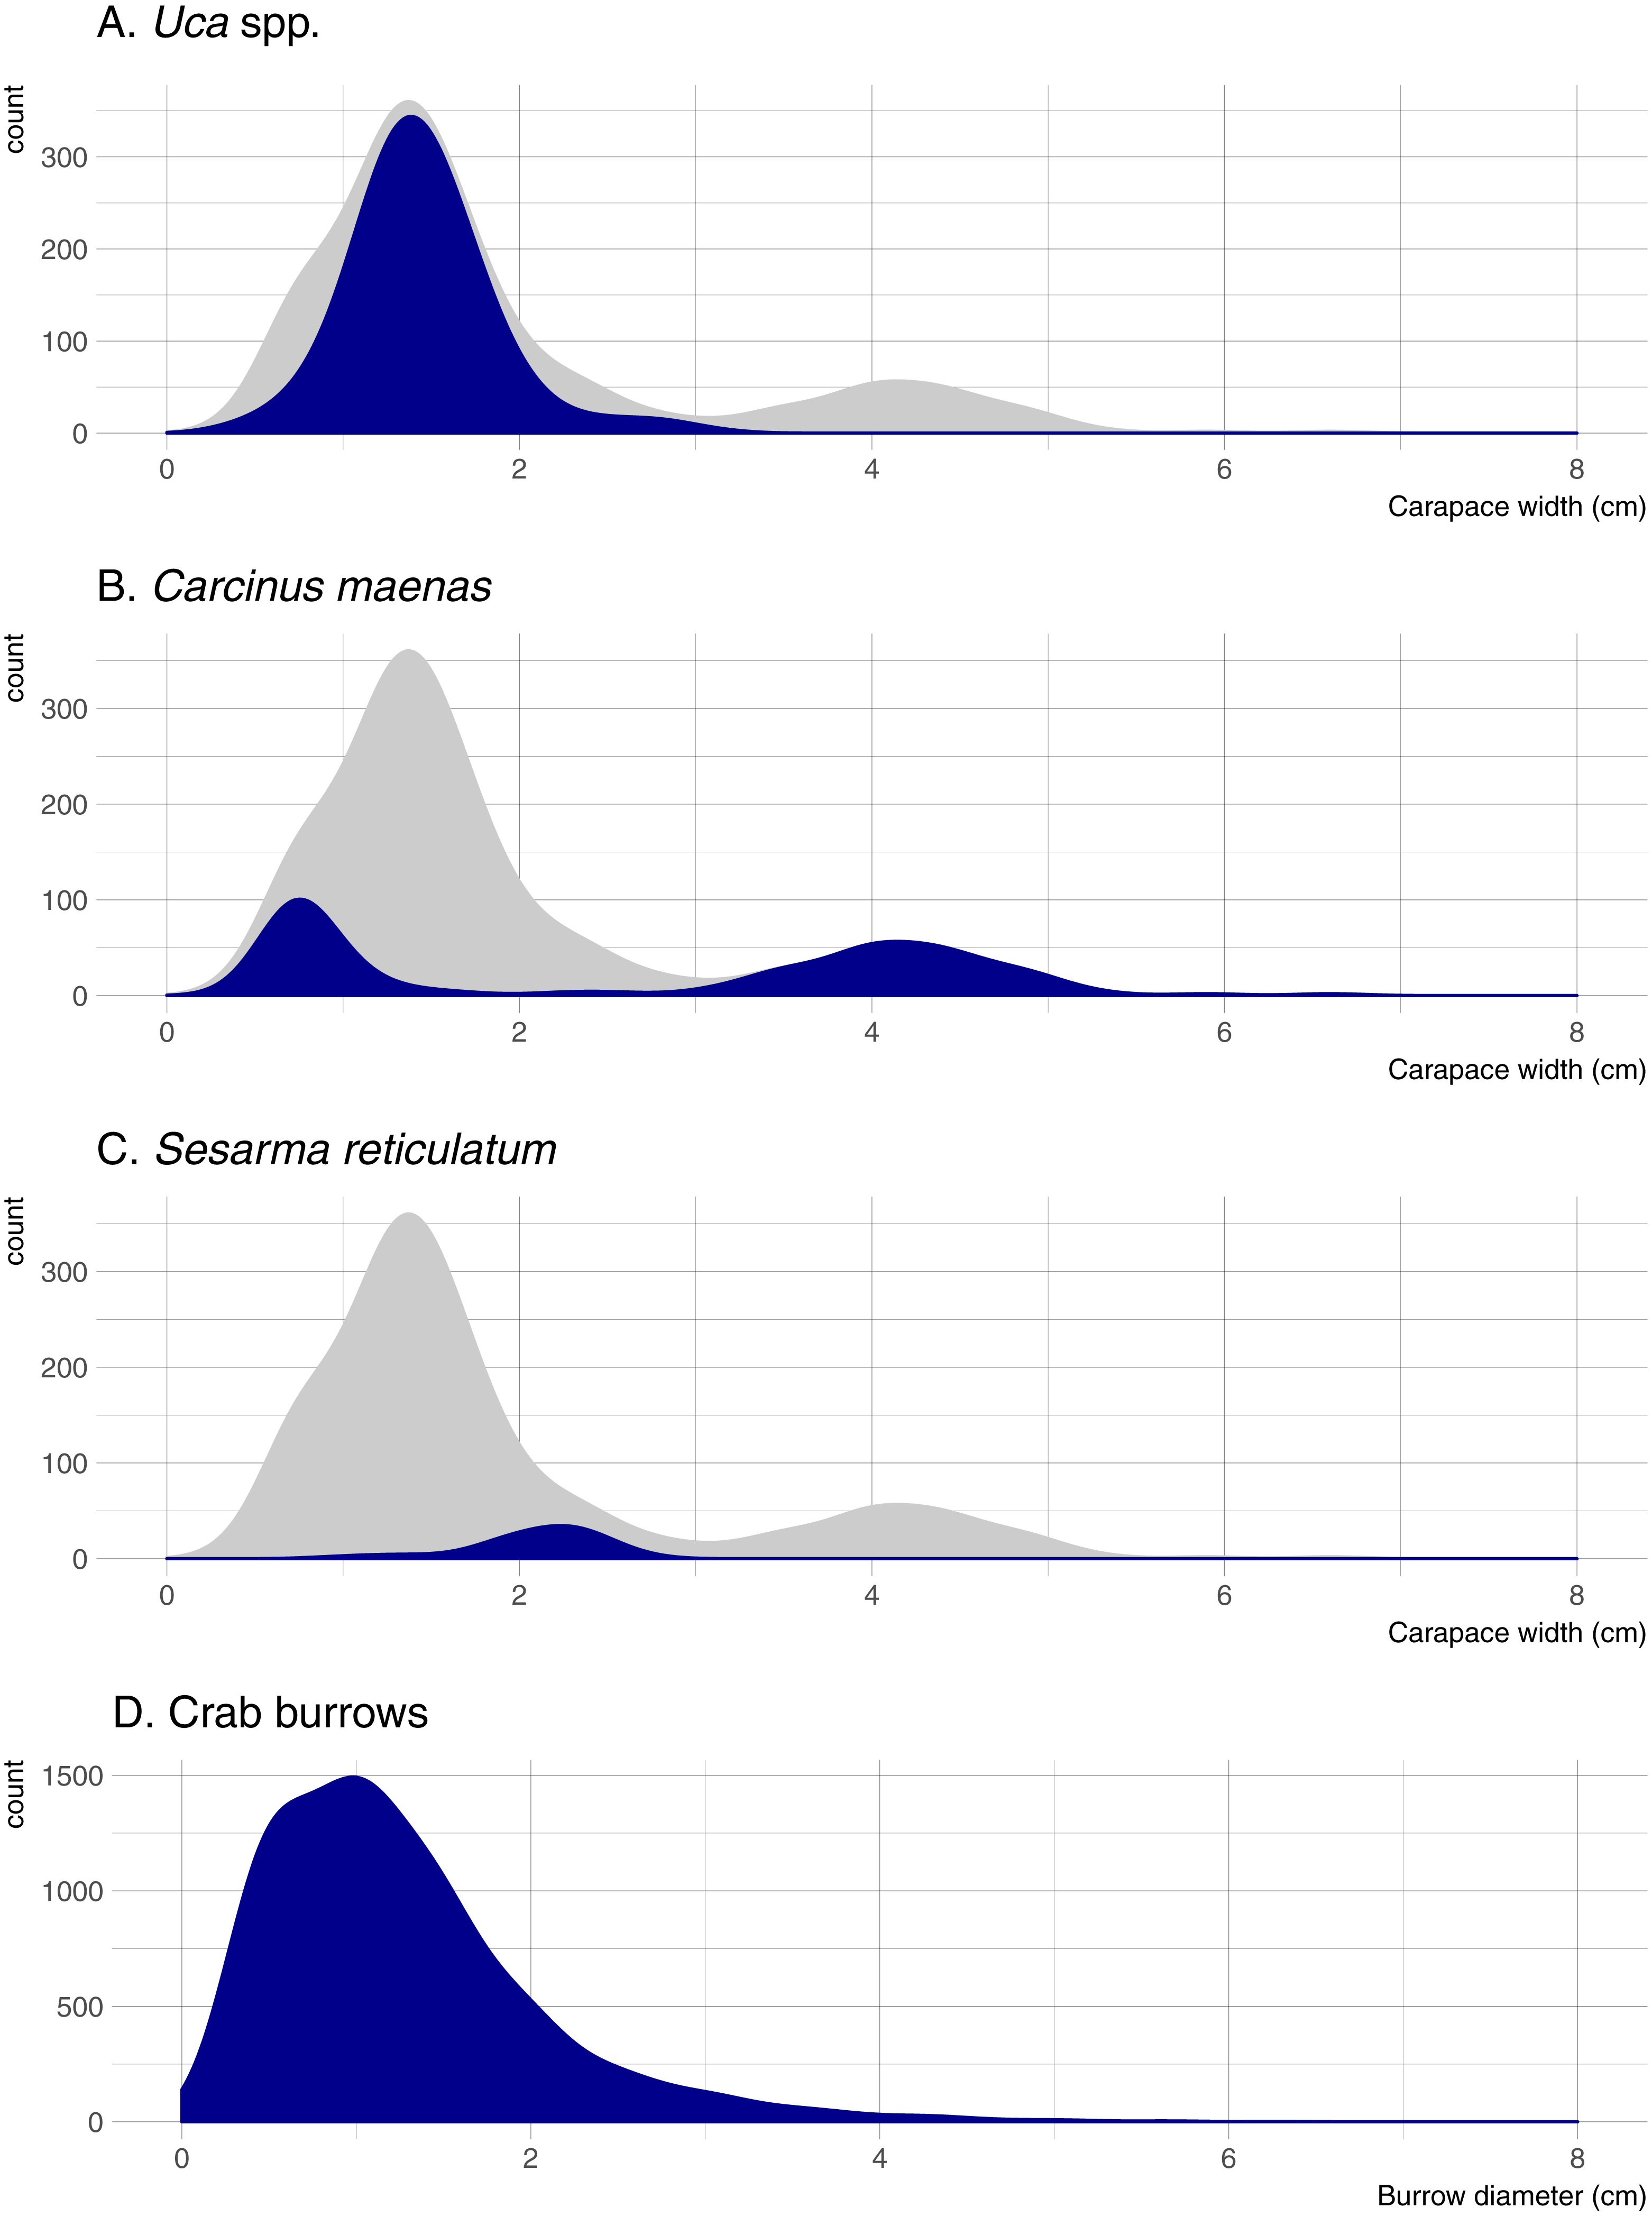
Variability among marshes and habitats
Significant differences in all crab indicators were found among marshes, among habitats, and for marsh/habitat interactions (main ANOVA results are summarized in Table 2). Among marshes, burrow density was highest at the two intermediate-elevation sites (COG and NAG; median elevation =0.62 − 0.64 m NAVD88), whereas Uca CPUE was highest at the lowest-elevation site (BIS; median elevation = 0.36 m NAVD88) and one intermediate-elevation site (COG) (Fig. 3). Carcinus CPUE and Sesarma CPUE were highest at the lowest (BIS) and highest (PAS) elevation marsh, respectively. Among habitats, burrow density was by far highest in bare creekbanks, and Uca CPUE on the marsh platform. Carcinus and Sesarma CPUE were both highest in the two types of creekbank habitats.
| Indicator | Source | df | F | p |
|---|---|---|---|---|
| Burrow density | Marsh | 3 | 4.20 | 0.009 |
| Habitat | 3 | 21.03 | <0.001 | |
| Marsh × habitat interaction | 9 | 2.72 | 0.010 | |
| Uca CPUE | Marsh | 3 | 5.10 | 0.003 |
| Habitat | 3 | 6.72 | 0.001 | |
| Marsh × habitat interaction | 9 | 3.64 | 0.001 | |
| Carcinus CPUE | Marsh | 3 | 14.58 | <0.001 |
| Habitat | 3 | 24.62 | <0.001 | |
| Marsh × habitat interaction | 9 | 2.21 | 0.033 | |
| Sesarma CPUE | Marsh | 3 | 5.10 | 0.003 |
| Habitat | 3 | 8.91 | <0.001 | |
| Marsh × habitat interaction | 9 | 3.79 | 0.001 |

Figure 3: Burrow density and crab species CPUE across the four study sites and four habitats.
(A) Burrow density among marshes. (B) Burrow density among habitats. (C) Uca CPUE among marshes. (D) Uca CPUE among habitats. (E) Sesarma CPUE among marshes. (F) Sesarma CPUE among habitats. (G) Carcinus CPUE among marshes. (H) Carcinus CPUE among habitats. Error bars are 95% confidence limits and thus may be compared with each other to imply significance. BIS, Bissel Cove Marsh; COG, Coggeshall Marsh; NAG, Nag Marsh; PAS, Passeonquis Marsh; BCB, bare creekbanks; VCB, vegetated creekbanks; MP, marsh platform; IVA, Iva frutescens zone.
Crab/environmental correlations within habitats
Crab burrow density correlated with multiple edaphic indicators on the marsh platform and in the Iva zone (Fig. 4). In general, more burrows were found where soil bulk density was high, and where percent organic matter and percent moisture were low. In vegetated creekbanks, burrow density correlated negatively with S. alterniflora cover and positively with bare cover. Burrows also strongly correlated with elevation—positively in bare creekbanks and negatively on the marsh platform.
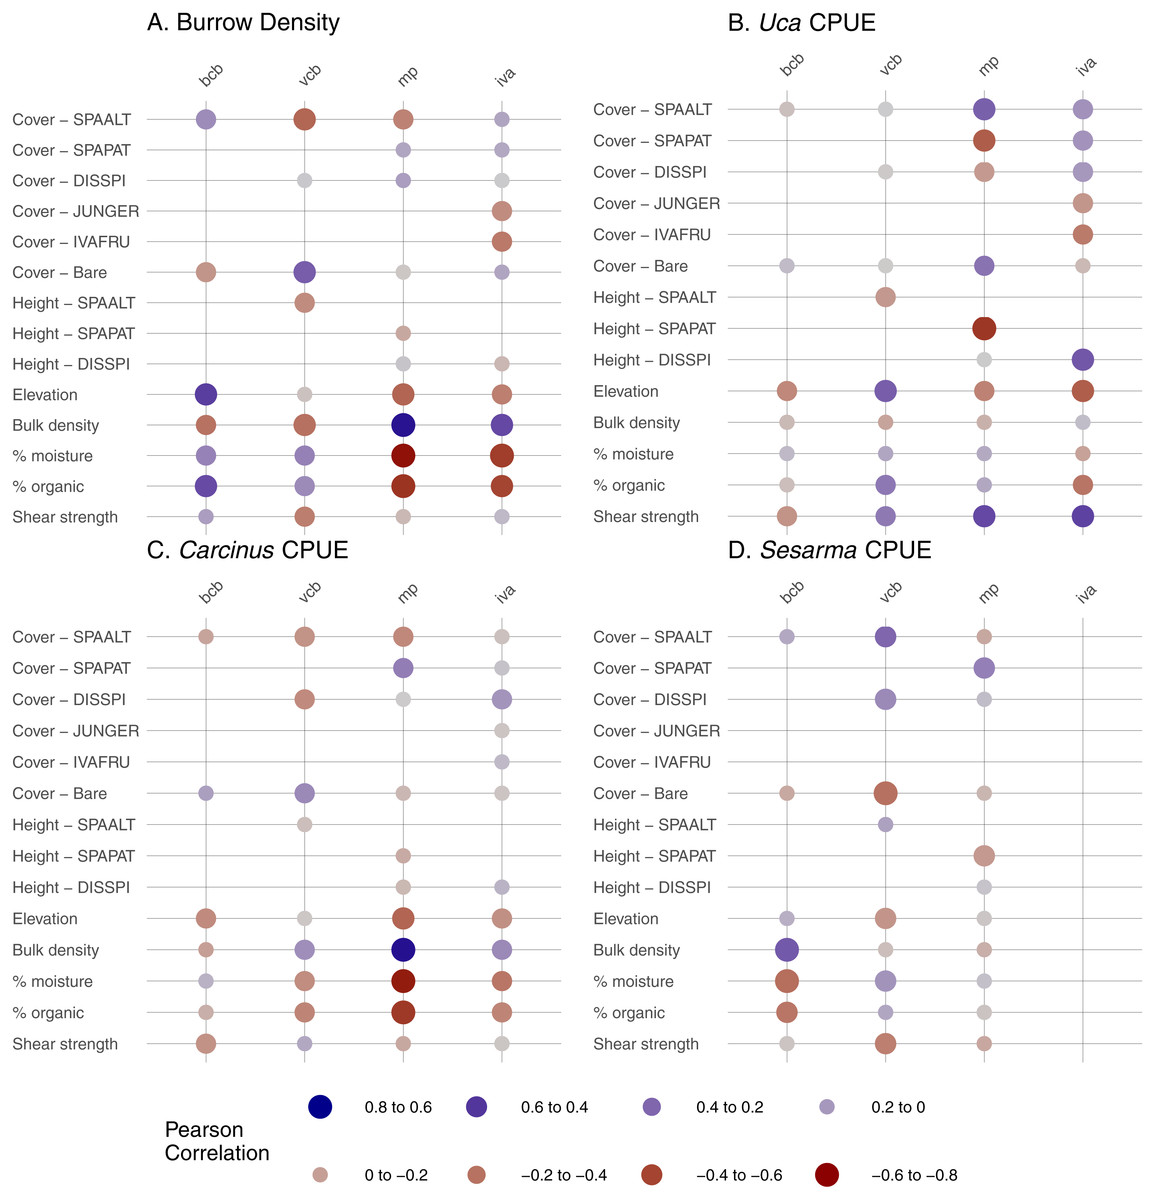
Figure 4: Correlations between crab abundance indicators and environmental parameters in four habitat types.
Correlations were run for pairs with 10 or more samples. BCB, bare creekbanks; VCB, vegetated creekbanks; MP, marsh platform; IVA, Iva frutescens zone; SPAALT, Spartina alterniflora; SPAPAT, Spartina patens; DISSPI, Distichlis spicata; JUNGER, Juncus gerardii; IVAFRU, Iva frutescens. (A) Burrow Density (B) Uca CPUE (C) Carcinus CPUE (D) Sesarma CPUE.
Uca CPUE correlated strongly with S. patens cover and height (negative correlation) and S. alterniflora cover (positive) on the marsh platform (Fig. 4), demonstrating a negative association with dense, tall S. patens in favor of short-form S. alterniflora. Uca CPUE was also positively correlated with soil shear strength on the marsh platform and in the Iva zone. Carcinus CPUE was positively related to soil bulk density and negatively related to elevation, soil percent moisture, and soil percent organic matter on the marsh platform (Fig. 4), showing that Carcinus is most common in low-elevation areas with relatively dry, compact, mineral soils when on the marsh platform. The strongest relationship for Sesarma CPUE was a positive correlation with soil bulk density in bare creekbanks.
In addition to correlations, we derived elevation range distributions for each crab species. These data reveal a gradient in crab distribution across elevation, with no crabs found at highest elevations, followed in order by Uca, Sesarma, and Carcinus as elevation declines (Fig. 5).
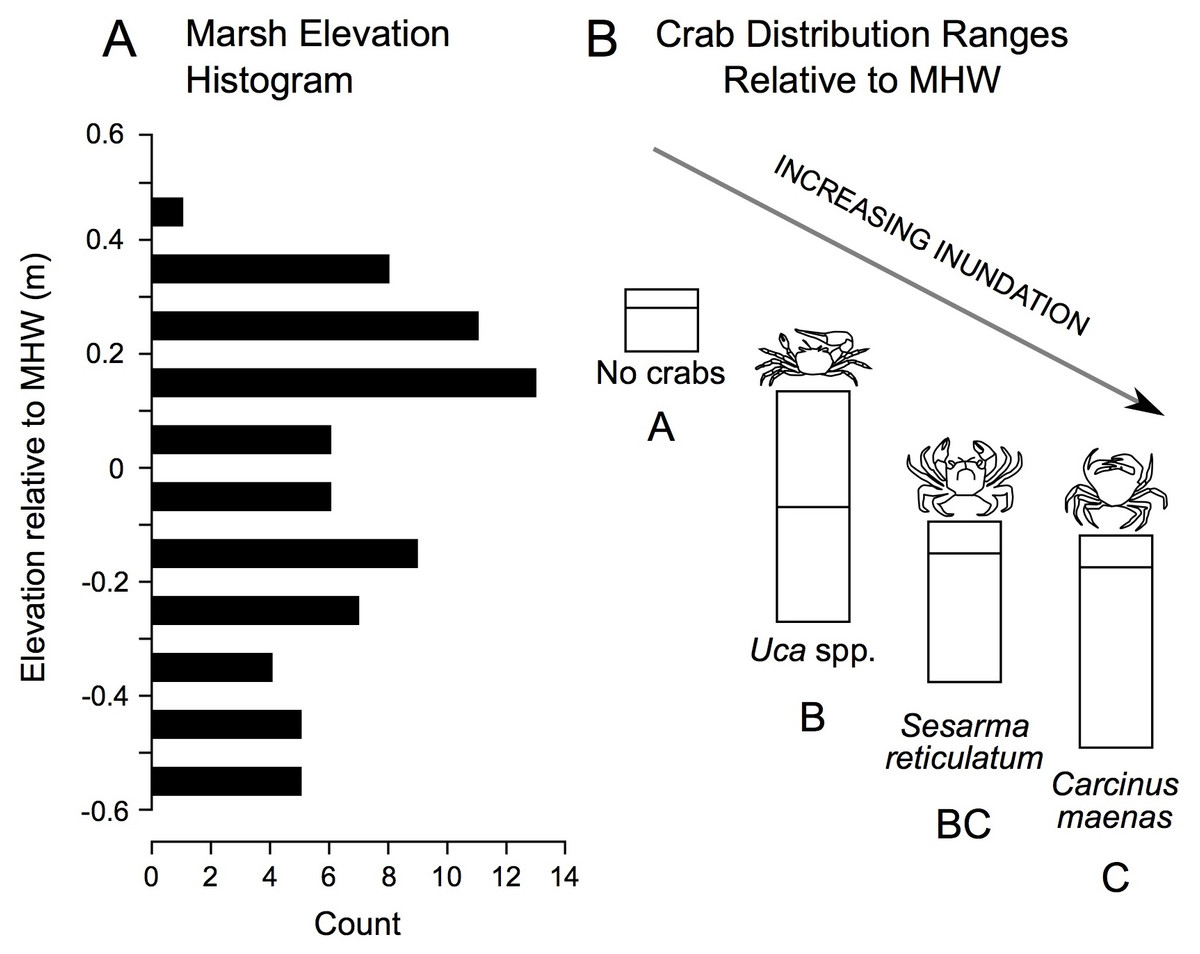
Figure 5: Distribution of study plot elevations relative to mean high water (A), and elevation distributions (inter-quartile ranges) of crab species caught in pitfall traps (B).
No crabs were captured at the highest marsh elevations. At mid-marsh elevations, Uca was found; Sesarma and Carcinus were caught at lower elevations. Different subscripts among species indicate significant differences in mean elevation based on ANOVA and a Games Howell pairwise test (F = 10.225, p < 0.001). These data suggest that as coastal marsh inundation increases with sea-level rise, shifts from no crabs to Uca and then to Sesarma and Carcinus are expected.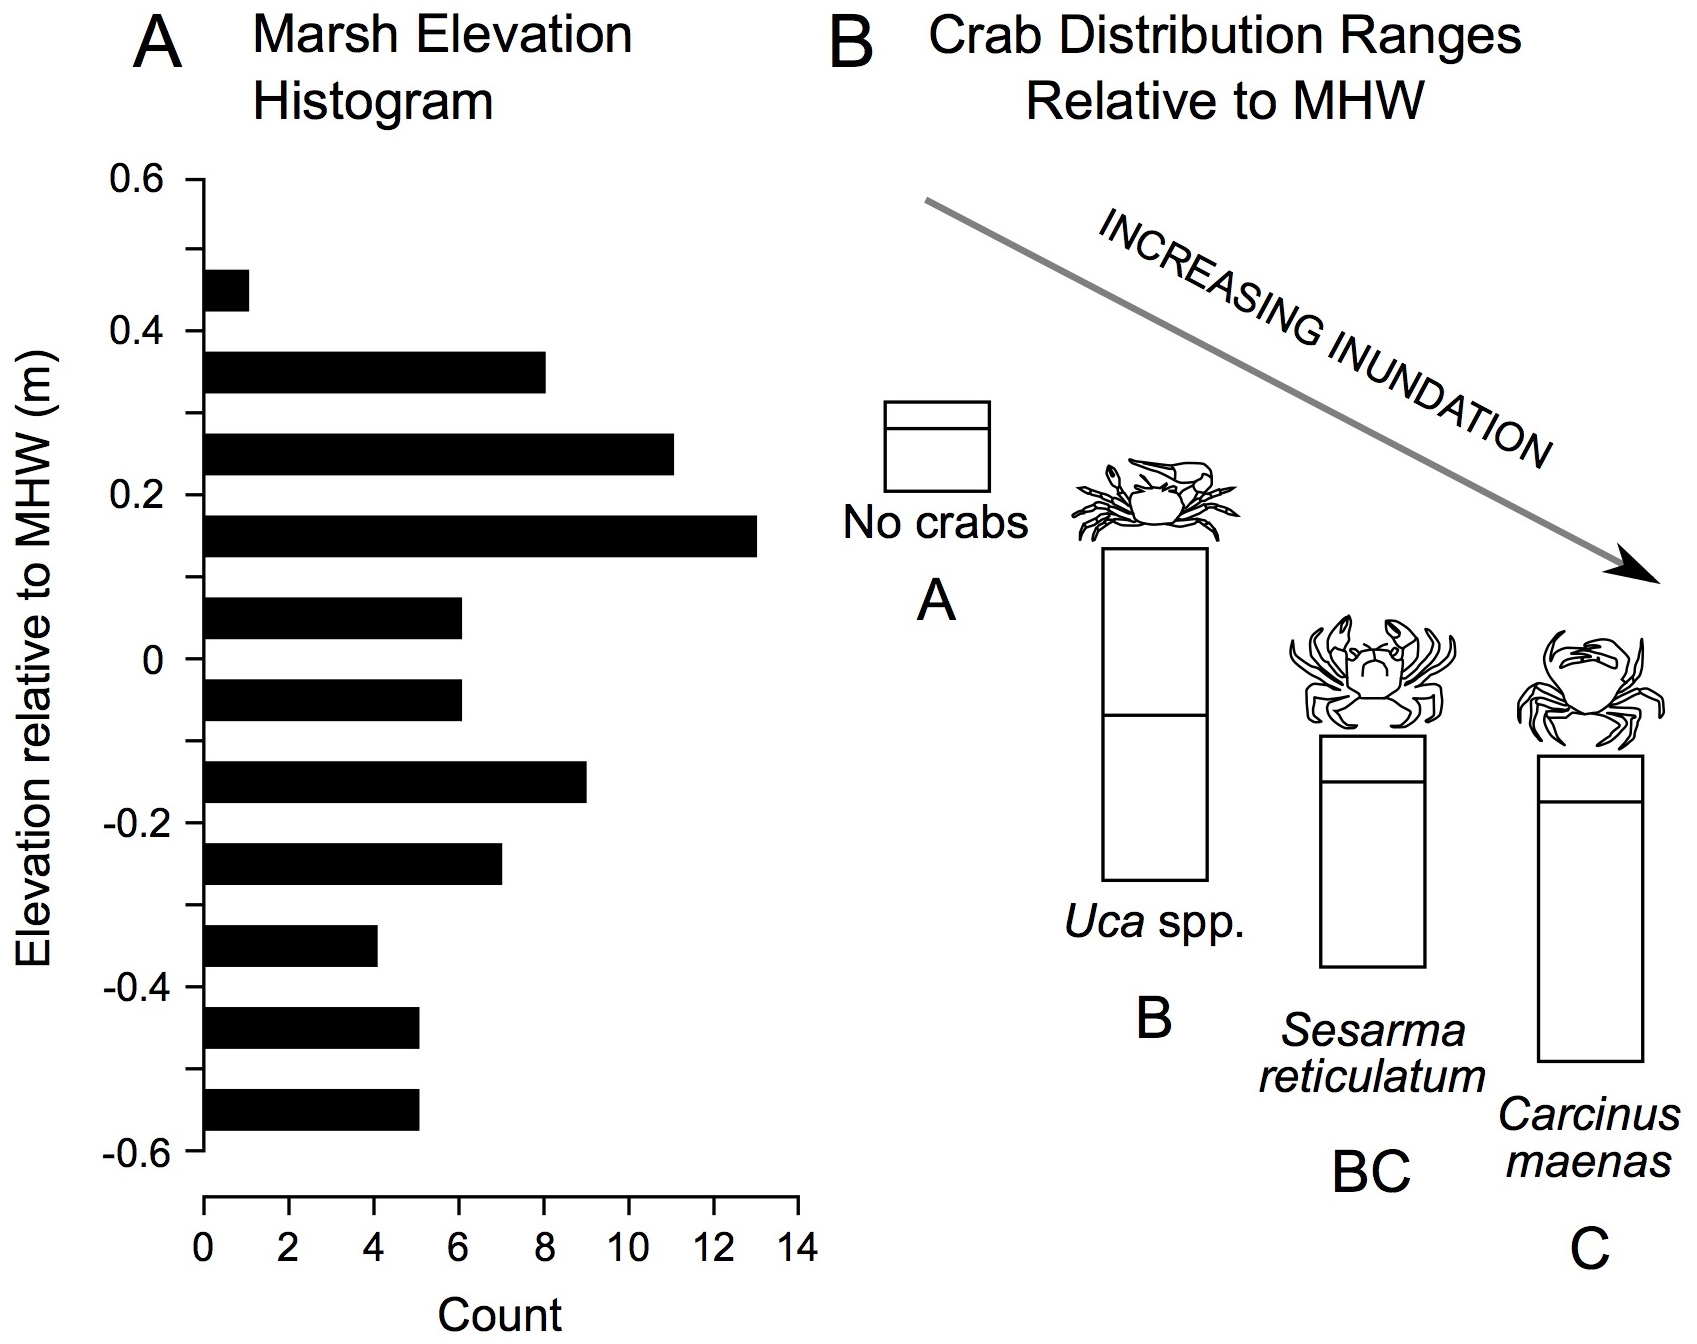
Temporal trends
Burrow density increased dramatically over time in creekbanks (t = − 4.44; p = 0.0001) but not on the marsh platform (t = − 0.909; p = 0.367) (Fig. 6). Bare creekbanks were absent from both NBNERR marshes in 2010, but have been increasing linearly in COG since appearing in 2012 (R2 = 0.96; p = 0.02), and trending higher since appearing in NAG in 2013 (R2 = 0.83; p = 0.09). Recreational fishing effort decreased between 2004 and 2014, and this decrease was consistent for all major crustacean-eating sport fish (R2 = 0.43; p = 0.03), and for the marsh-associated striped bass only (R2 = 0.58; p < 0.01). The declines in fishing pressure coincide with steady to increasing stock numbers for all of these same fish species in Narragansett Bay (S Olszewski, 2017, unpublished data; Project No. F-61-R-21, available upon request from RIDEM Division of Fish and Wildlife Marine Fisheries). Conversely, wading bird abundance has declined in RI since 1998 (R2 = 0.57; p < 0.001 for all wading bird species; R2 = 0.44; p = 0.003 for Glossy Ibis and Black-crowned Night Heron only), and osprey abundance has increased significantly since 1998 (R2 = 0.90; p < 0.0001). Finally, annual MHW increased significantly from 1998–2014 (R2 = 0.29; p = 0.03).
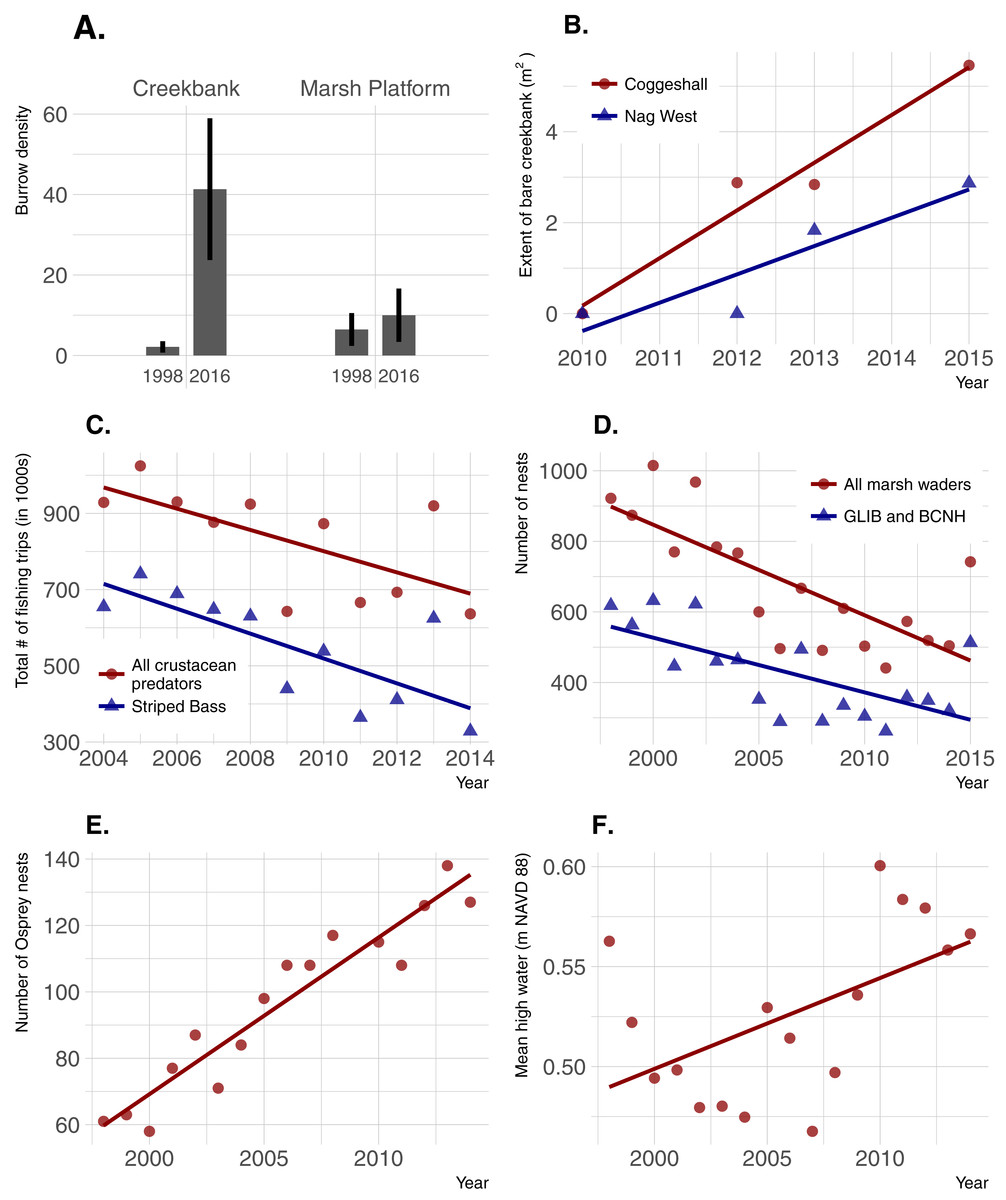
Figure 6: Temporal changes in crab abundance (burrow density), a habitat change linked to crabs (extent of bare creekbanks), and factors that can potentially affect crab abundance.
(A) Burrow density; error bars are 95% confidence limits. (B) Extent of bare creekbanks. (C) The level of recreational fishing, defined as directed trips with primary and secondary targets of crustacean predators. (D and E) Predation pressure by birds. (F) Sea-level rise.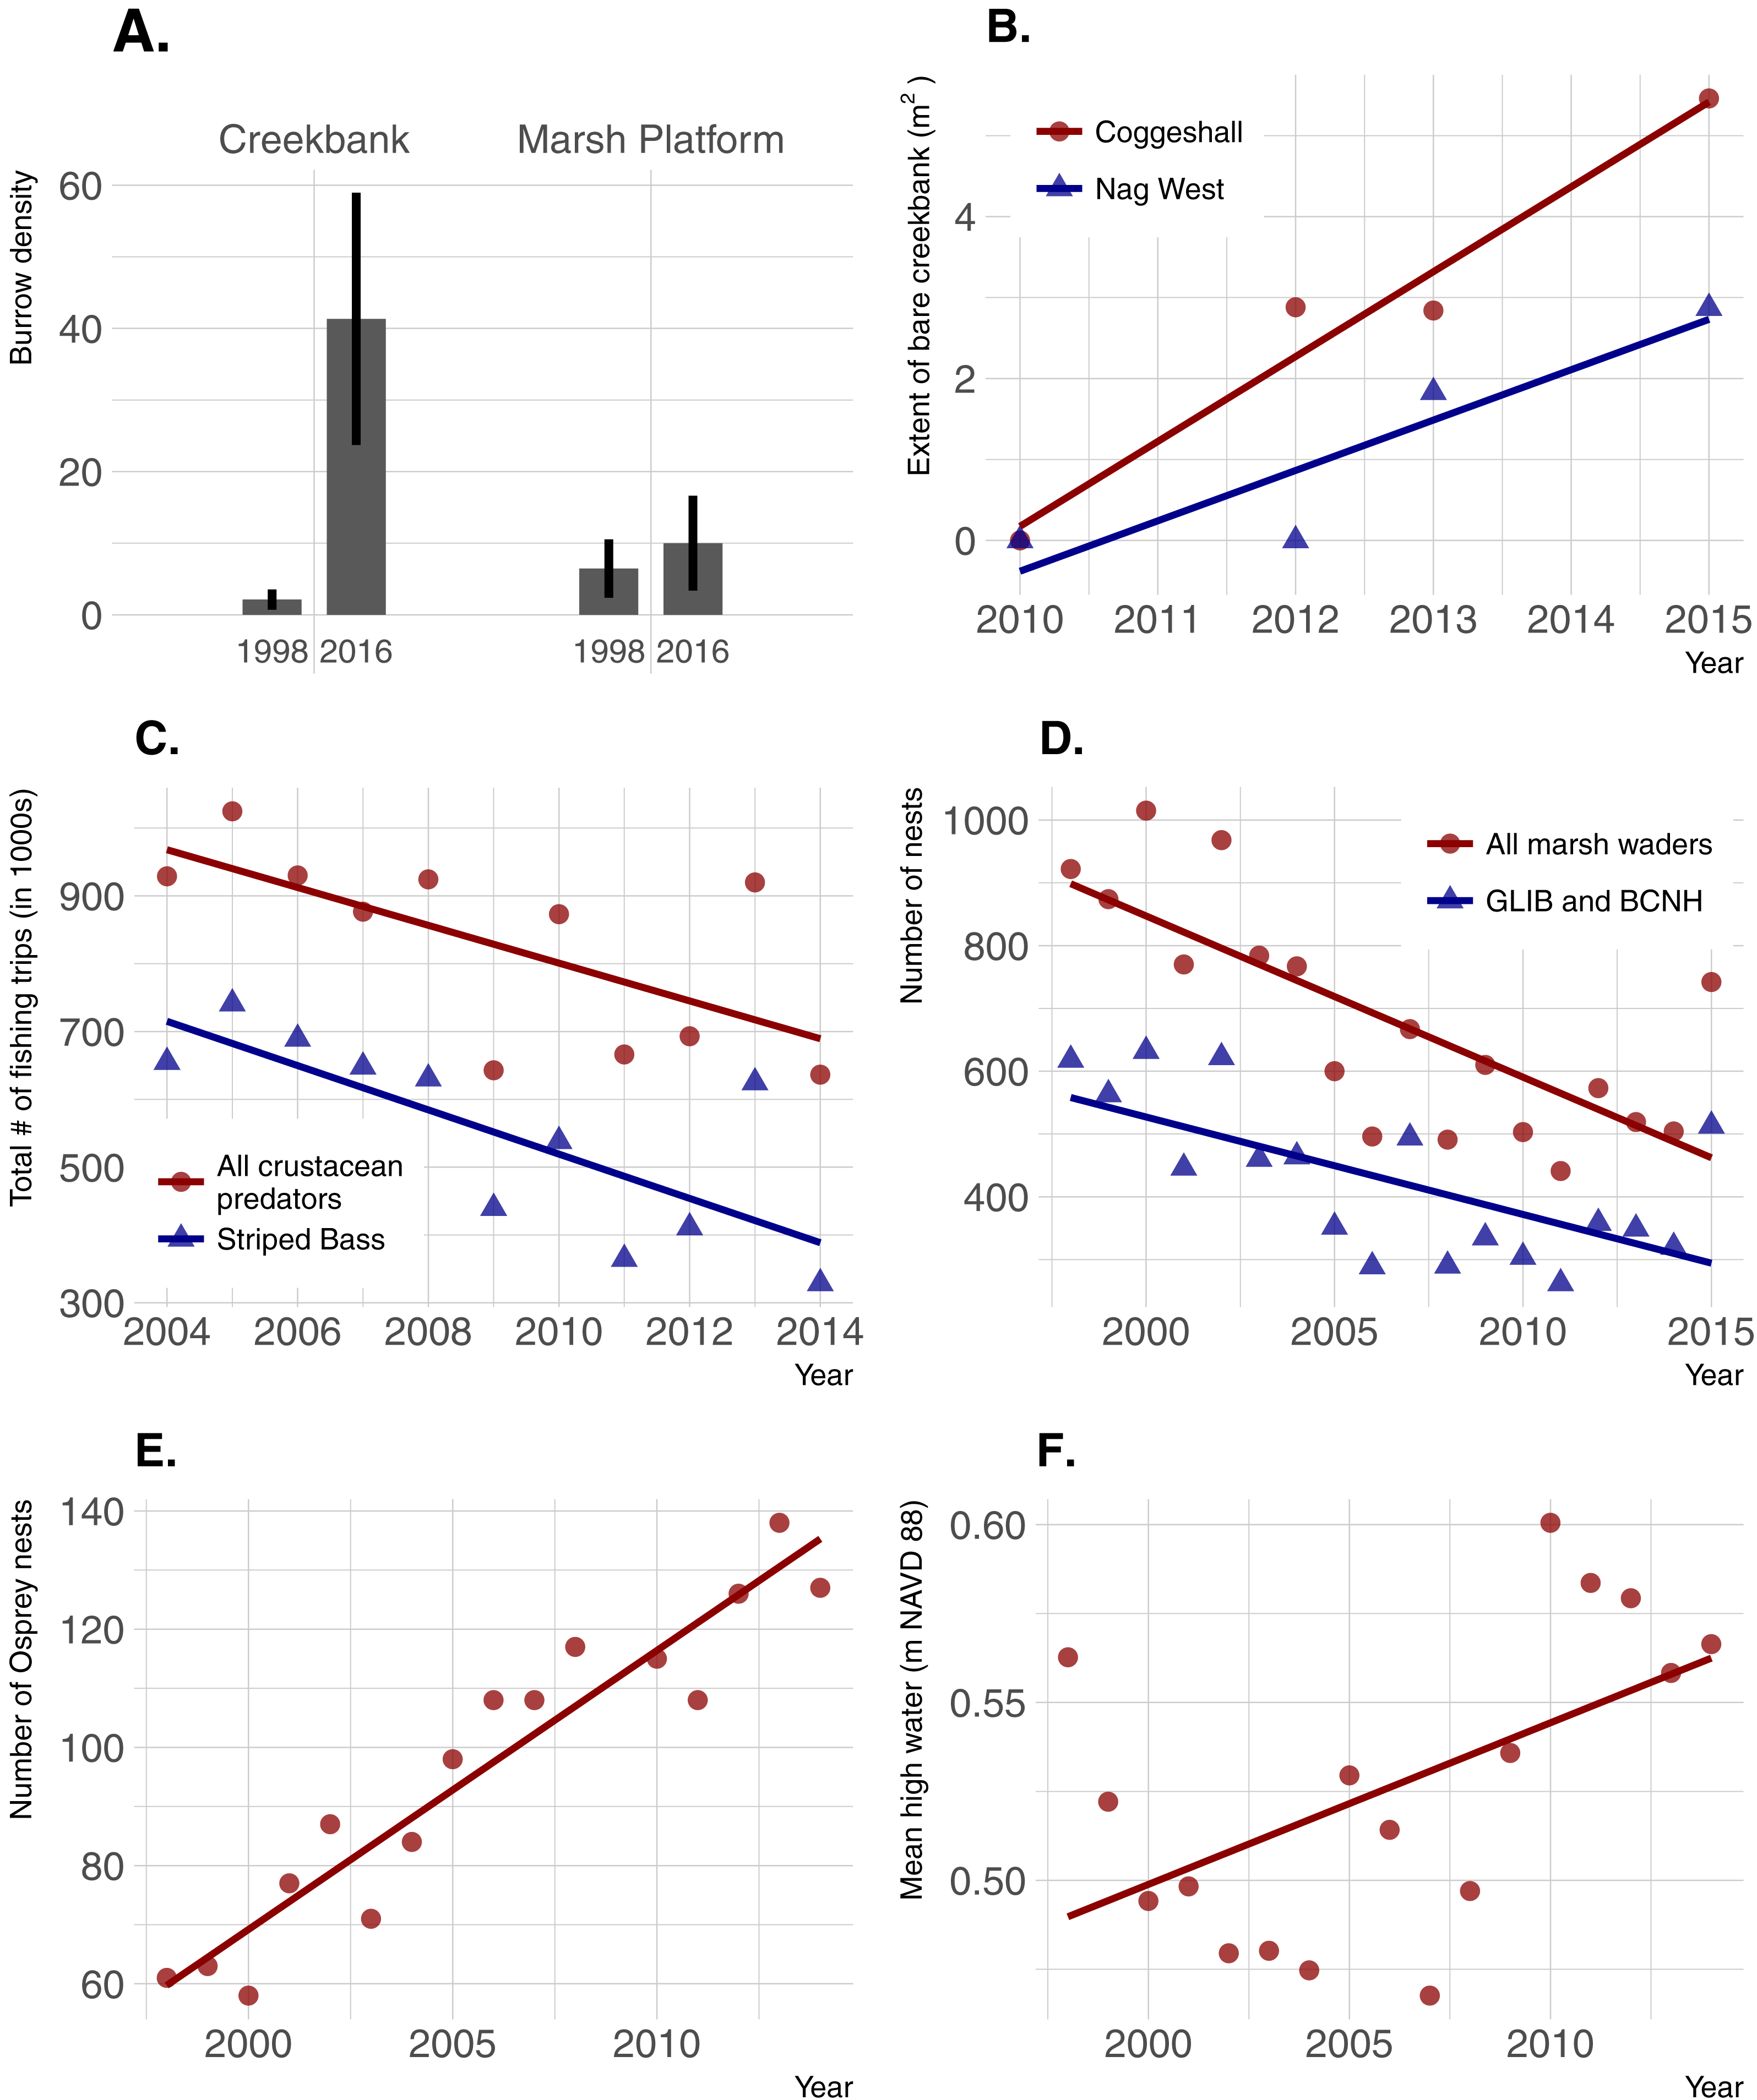
Discussion
Our results from four marshes show that Uca dominates crab communities in RI marshes and that most creekbank burrows (87%) are sized for Uca. The significant increase in burrow density over the past ∼15 years is not coincident with an increase in recreational fishing pressure as reported elsewhere (e.g., Altieri et al., 2012); instead it more closely tracks rising sea levels and changing populations of alternate predators. Our data also demonstrate strong correlations of crabs with vegetation, elevation, and soil characteristics; because these same environmental factors are known to change with sea-level rise (e.g., shifts from high to low marsh vegetation, loss of elevation capital, wetter soils; Cole Ekberg, Ferguson & Raposa, 2015; Raposa et al., 2017a; Watson et al., 2017b), our data and results can therefore be used to help predict how crab communities will respond as sea-level rise accelerates.
Crab patterns among marshes and habitats
All four crab indicators (burrow density, and Uca, Carcinus, and Sesarma CPUE) varied significantly among marshes, further demonstrating that crabs and their potential impacts can vary considerably from marsh to marsh even in a relatively small geographic area (Holdredge, Bertness & Altieri, 2009; Bertness et al., 2014). The distribution and relative abundance of crabs also varied significantly among habitats in our study. Sesarma and Carcinus were concentrated in low-elevation creekbank habitats, but Uca was found in the entire range of marsh habitats from bare creekbanks up through the Iva zone. This is consistent with the findings of Luk & Zajac (2013), who documented a within-marsh Uca range expansion and attributed it as a response to sea-level rise, and with Vu, Wieski & Pennings (2017), who found Sesarma concentrated within creek heads and Uca common throughout the marsh. In our study, Uca CPUE was actually highest on the marsh platform. This was somewhat surprising given that burrow density (most of which were Uca burrows) was highest along creekbanks, and that Uca was consistently observed in very high densities on bare creekbanks throughout the study (K Raposa & R McKinney, pers. obs., 2014). Multiple factors may have contributed to this disconnect, including a possible overestimation of active burrows in creekbanks and the fact that Uca frequently forages considerable distances from their burrows and can exhibit poor burrow fidelity (Montague, 1980; Bertness & Miller, 1984). Another contributing factor may be our choice of pitfall traps as sampling gear. Although pitfall traps are commonly used to sample salt marsh crabs (e.g., Altieri et al., 2012), there are known issues associated with this sampling gear, both in terrestrial and aquatic habitats (Topping & Sunderland, 1992; Fanini & Lowry, 2016). Pitfall traps have not been fully evaluated in salt marshes, but we suspect that data can be affected by factors such as the presence of predators in traps (i.e., Carcinus in creekbanks) and the lack of trap drainage in waterlogged soils that may facilitate crab escape. In general, care should be taken when interpreting results from any study that relies on data collected only from pitfall traps, at least until the effectiveness of this sampling gear is further evaluated in salt marshes. Regardless, our results unambiguously demonstrate that Uca currently utilizes a wide range of marsh habitats that includes high elevation areas in the Iva zone. This aligns well with Teal (1958), who also found U. pugnax distributed throughout a Georgia salt marsh, suggesting that some faunal community patterns in southern New England marshes may now be trending towards similarity with southeastern US marshes.
Similar to Uca, crab burrows were also found in all habitats in our study. Burrow density was higher in bare creekbanks compared to all other habitats, and trended lower while moving away from creekbanks towards the upland/marsh edge. In bare creekbanks, burrow density averaged 110 m−2 and peaked above 250 m−2. These very high densities result in “Swiss-cheese” creekbanks that are similar in appearance to other marshes in the region that are heavily impacted by Sesarma (Schultz, Anisfeld & Hill, 2016). With our data it is not possible to determine whether dense creekbank crab burrows preceded creekbank vegetation loss or vice versa, but other studies demonstrate a negative impact on marsh vegetation from dense crab burrowing (Wilson, Hughes & FitzGerald, 2012). Even if crab burrowing is not the direct cause of creekbank vegetation loss in RI marshes, dense burrow networks are surely accelerating the rate of bank undercutting and erosion.
Correlations with environmental parameters
The distribution and abundance of crabs in RI salt marshes was affected by multiple environmental parameters whose relative influence varied by species and habitat. By far most of the strongest correlations were between crab indicators and edaphic conditions (12 of the 14 correlations greater than an absolute value of 0.5). This is consistent with other studies that demonstrate a strong effect of soil condition and strength on crabs and burrowing (e.g., Bertness & Miller, 1984; Jaramillo & Lunecke, 1988). In general, crabs tend to burrow in soils of intermediate strength; soils that are too weak are less able to support burrow walls, and those that are too firm inhibit burrowing (Bertness & Miller, 1984). However, in our study all four crab indicators were positively correlated with high soil shear strength and/or high bulk density in at least one habitat type. We interpret these findings as a sign that soils in our study marshes have generally weakened (e.g., from habitat shifts and waterlogging; Wigand et al., 2014; Cole Ekberg, Ferguson & Raposa, 2015) to the point where crabs and burrows are now concentrated in areas where soil strength remains relatively high. Additionally, the common occurrence of crab burrows in sandier soils in our marshes may be attributed to drowning soils at low elevations being too waterlogged for successful burrow construction.
There were surprisingly few strong correlations between crabs and vegetation within each habitat zone. Notable exceptions were the increase in burrow density with decreasing vegetation cover along creekbanks, and decreasing Uca CPUE with increasing S. patens cover and height on the marsh platform. The former is consistent with the higher burrow densities in bare creekbanks compared to vegetated creekbanks described above. The latter supports previous studies that demonstrate inhibited Uca activity and abundance in the high marsh due to thick, healthy S. patens (Bertness & Miller, 1984). Given that S. patens is in rapid decline in many RI marshes due to sea-level rise (Watson et al., 2016; Raposa et al., 2017a), we hypothesize that Uca populations will benefit if rates of RI marsh elevation gain continue to lag behind sea-level rise (Raposa et al., 2017b). Elevation was also a minor correlate of crab burrow density and CPUE, at least at the within-habitat scale, but two relationships suggest upper and lower elevation bounds for crabs in marshes. The positive correlation between burrow density and elevation in bare creekbanks suggests that creekbanks lose their capacity to support burrows and crabs with declining elevation. Likewise, the negative correlation between Uca CPUE and elevation in the Iva zone suggests that there is an ultimate high-elevation threshold for this species in marshes.
Ultimately, the relationships between crabs, habitats, and environmental parameters will help inform how crab populations will respond to future sea-level rise. We predict that Sesarma and Carcinus will expand into previously inaccessible marsh interiors based on their association with creekbank habitats that are expanding in response to sea-level rise (Watson et al., 2017a). Our correlation analyses suggest contrasting responses by crabs to varying environmental changes associated with sea-level rise. For example, the shift from S. patens to S. alterniflora (Watson et al., 2016; Raposa et al., 2017a) should favor Uca and crab burrowing on the marsh platform, and pioneering Uca should further expand landward as its upper elevation bound increases with sea-level rise. In contrast, overall crab burrowing may eventually become inhibited if soils become too weak or waterlogged as marsh inundation progresses. When combined with the overall species-specific elevation ranges documented in our study (Fig. 5), we further predict that sea-level rise will induce habitat changes that will initially favor Uca and then Sesarma and Carcinus.
Temporal trends
Localized recreational overfishing is causing Sesarma-induced creekbank vegetation loss in marshes from Long Island to Cape Cod (Coverdale, Bertness & Altieri, 2013b). However, sea-level rise is also causing creekbank vegetation loss independent of Sesarma grazing pressure (Schultz, Anisfeld & Hill, 2016). In RI, we have documented creekbank dieback in marshes where Uca is very abundant and Sesarma abundance has not changed over time (e.g., Coggeshall Marsh; 2014 Uca and Sesarma data from Fig. 3; 2007 Sesarma data from Holdredge, Bertness & Altieri, 2009), and in marshes that are distant to boat marinas and have minimal observed recreational fishing (e.g., Nag Marsh). These inconsistent findings emphasize that, as a first step, additional factors that can potentially affect crab abundance and creekbank vegetation loss need to be identified. At the mesoscale of Narragansett Bay, results from our trend analyses demonstrate that increases in crab abundance and trends of creekbank vegetation loss actually coincide with a decrease in overall recreational fishing pressure on crab-eating fish. This is also coincident with good stock status for the species identified in this study, and locally stable to increasing populations in Narragansett Bay. This negative fishing pressure finding cannot directly translate to the smaller scale of individual marshes, but within this context of an overall Bay-wide decline in fishing, it seems unlikely that fishing intensity has actually increased near marshes coincident with the onset of recent creekbank vegetation loss.
Instead, increases in crab abundance and creekbank vegetation loss in Narragansett Bay have coincided with accelerating sea-level rise and recent extreme high-water levels (Boon, 2012; Goddard et al., 2015). Sea-level rise has already been linked to an intra-marsh Uca range expansion (Luk & Zajac, 2013), and it can directly cause creekbank vegetation loss in the absence of crab impacts (Schultz, Anisfeld & Hill, 2016). These multiple lines of evidence agree with recent findings across southern New England (Schultz, Anisfeld & Hill, 2016; Crotty, Angelini & Bertness, 2017) and identify sea-level rise as a potential driver of creekbank vegetation loss in RI, either directly through inundation stress or indirectly via enhanced crab abundance and impacts.
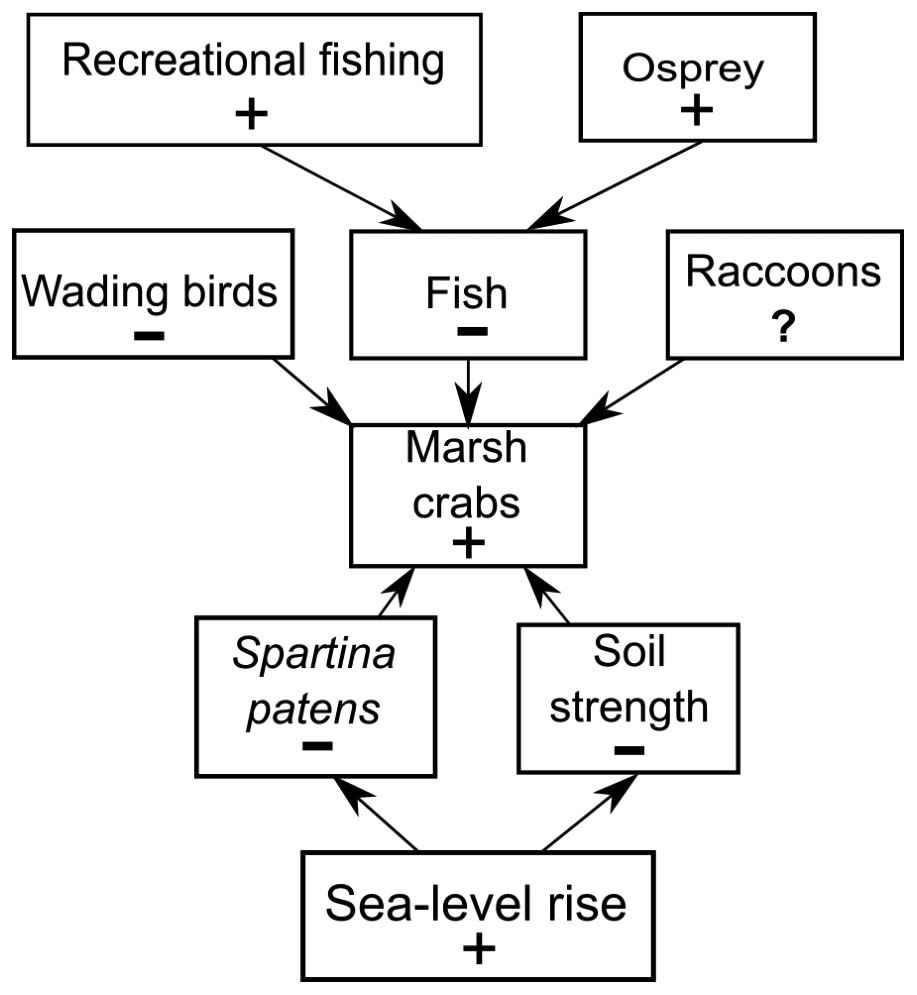
Figure 7: Conceptual model of marsh crab responses to the interactive effects of bottom-up (sea-level rise) and top-down (predation) processes.
Positive and negative changes in each parameter are indicated by “+” and “−”, respectively (e.g., as sea-level rise increases (+), Spartina patens and soil strength decline (−), eliciting an increase in crabs (+). For simplicity, marsh crabs are combined into one overarching group; individual species may respond differently to changes in any single model parameter. Responses should be strongest at intermediate elevation marshes. Predation effects will be mitigated at lower elevation marshes where burrowing is inhibited by weak and waterlogged soils, and at higher elevation marshes where burrowing and activity is limited by infrequent flooding and dense high marsh vegetation.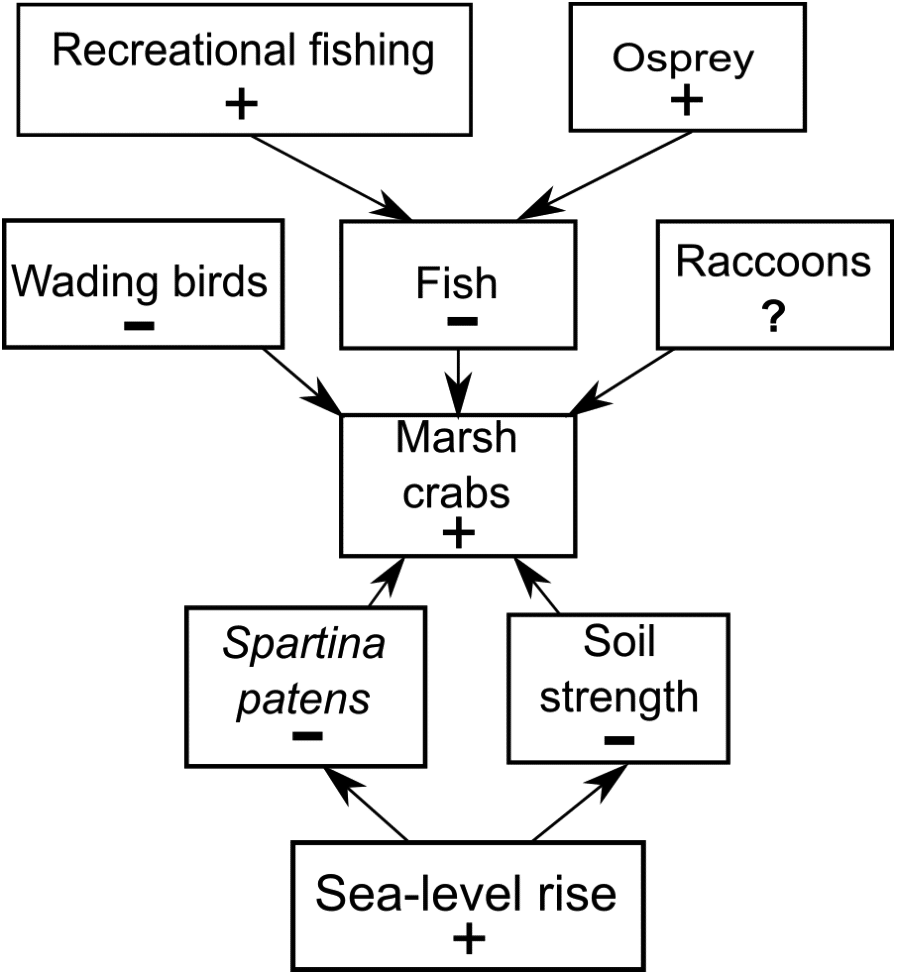
Our trend analyses show that increases in crabs and decreases in vegetation have also coincided with changes in the abundance of direct crab consumers and predators of crab consumers. Wading birds can feed on marsh crabs (e.g., Grimes et al., 1989), and their abundance has been in steady decline in RI for almost two decades. However, we suspect that wading bird impacts on crab abundance are minimal because (1) marsh crabs are typically minor components of most wading bird diets, which are instead typically dominated by other crustaceans and/or fish (e.g., Smith, 1997; McCrimmon, Ogden & Bancroft, 2011), and (2) to our knowledge, reports of impacts to marshes from excessive crabs did not occur when wading bird abundance in RI was very low before a gradual recovery began in the 1970s (Ferren & Myers, 1998). Marsh crabs are also consumed by some estuarine fish (e.g., striped bass), which in turn serve as prey for higher-order predators, such as the Osprey. Osprey abundance has risen steadily in RI over the last four decades, largely due to expansion of human-built platforms and cell-phone towers (Walsh, 2013). Ospreys commonly nest along estuarine shores, often in or near salt marshes, and the occupants of a single osprey nest can consume over five large fish per day (McLean & Byrd, 1991). Individually, these predators may have minimal impacts on crab abundance, but their collective impacts point to the potential importance of top-down predation (potentially including fishing) as a driver of increasing crabs and creekbank vegetation loss that warrants further study.
We do not discount the effects of localized fishing at some marshes (Coverdale, Bertness & Altieri, 2013b), but our data combined with new findings (Schultz, Anisfeld & Hill, 2016) suggest a more complex scenario (Fig. 7). We hypothesize that the recent increases in crab abundance and marsh vegetation loss are the consequence of a combination of bottom-up (sea-level rise) and top-down (predation) factors and that the relative importance of each factor varies across the region and locally among individual marshes. We also acknowledge that other factors may be important beyond those we focused on here. Although data are currently lacking, examples include potential changes in predation pressure on larval crabs by planktivorous fish (Morgan, 1990), or on adult crabs by mesopredators such as raccoons (Montague, 1980; Nomann & Pennings, 1998), as well as potential changes in food availability and intra- and inter-specific competition among crabs.
Conclusions
Our study provides new insight into the complex relationships between bottom-up and top-down stressors, crab populations, and ongoing marsh vegetation loss. Results from our four marshes demonstrate that Uca remains overwhelmingly dominant in RI marshes and is responding favorably to changing environmental conditions linked to increased inundation and sea-level rise. We posit that increasing crab populations are not being caused primarily by recreational overfishing; instead, sea-level rise and changing predator populations may play a more important role. At a minimum, these collective findings call for studies to further examine (1) the cause and effects of overabundant Uca populations on marshes, and (2) inter-marsh variability in the relative impacts of fishing, sea-level rise, and predation on crab abundance. We also recommend that ongoing long-term marsh monitoring programs be augmented to include indicators of crab abundance in order to track changes over time. The factors that drive crab overabundance and marsh vegetation loss are site-specific to some degree. It follows then that if a marsh is showing signs of degradation over time, managers will need site-specific data in order to select and implement appropriate intervention strategies. If sea-level rise is the primary driver of increasing crab abundance, managers can choose from multiple strategies aimed at building resilience that are already being evaluated (Wigand et al., 2017); if higher-order predators or localized overfishing is the driver, new management strategies will need to be identified.